
Abstract
Endogenous alcohol has been applied for spontaneous ethanol production via different metabolic pathways of the human body. Auto-brewery syndrome describes the patients with alcohol intoxication after ingesting carbohydrate-rich meals. The main objective of this study is to investigate the effect of diabetes mellitus (DM), liver cirrhosis (LC) and presence of both (DM and LC) on blood alcohol concentration (BAC) especially after carbohydrate ingestion. BAC has been measured by headspace gas chromatography-mass spectrometry in three groups of humans namely control, DM, LC and both (DM and LC) groups. The results showed that BAC in control group was 0.01–.3 mg/dL with mean 0.3 ± 0.41 mg/dL. In patients with DM, BAC is significantly higher than that of control group 4.85 ± 3.96 mg/dL. In patients with LC, BAC was 3.45 ± 2.65 mg/dL. In patients with both DM and LC, BAC increases to reach 10.88 ± 5.36 mg/dL. Endogenous ethanol production appears to increase in DM and LC. Also, it increased much more in patients with both diseases, but it did not reach toxic levels. On comparing BAC and blood glucose level in each group, all groups show insignificant correlations (p > 0.05).
Introduction
Ethanol is a metabolic pathway product that is normally produced with variable concentration in the mammalian cells. The endogenous alcohol describes the unprompted ethanol production via different metabolic pathways. For instances, some Japanese people have ability to produce significant amounts of endogenous alcohol due to carbohydrates’ fermentation of Candida albicans that is present in the normal gut microflora. This syndrome is known as auto-brewery syndrome. 1 Ethanol is metabolized mainly in the liver by the class I isozymes of alcohol dehydrogenase (ADH). One physiological role of ADH is to rid the body of any ethanol produced by fermentation of sugars in the gut during a process known as first-pass metabolism. 2 The ADH enzyme is widely distributed in body organs during evolution and provides a detoxification mechanism whenever ethanol was inadvertently ingested together with fruits, juices honey and also during the sugar fermentation. 3 Endogenous ethanol (EnEth) may increase in diabetic patients, although of absence of alcohol consumption. 4
The bulk of reabsorbed ethanol (95–98%) is neutralized in liver by the hepatic enzymes consumption. 5 The cirrhotic liver patients with abstinent alcoholic product can remain with stable case for remarkable periods, however, they have abnormalities in intestinal motility. Some liver cirrhotic patients produce EnEth, which in turn could aggravate liver damage previously caused either by alcohol or by other agents. 6
Several computer surveys, had been done including SciFinder, indicated that there are several reports interested in the detection of ethanol in liver diseases and diabetes, but there is no publication focused on patients having both hepatic and diabetes especially after carbohydrate ingestion and whether blood alcohol concentration (BAC) correlates with GBLs, and so our aim is to clarify those issues. On these bases, the current manuscript performed a comparative studies to evaluate the level of ethanol among patients who have diabetes, cirrhotic liver or both.
Material and methods
This study was conducted in cooperation between forensic medicine and clinical toxicology department and tropical medicine department of the University hospital at Minia University. All the patients who involved in the study had never consumed alcoholic beverages. They were properly briefed and signed consent before starting the study. These consents have been approved from the official committee of ethics, Faculty of medicine, Minia University.
The study included four groups
Group I: Fourteen healthy non-alcoholic male volunteers aged 40–62 years, with no previous history of diabetes mellitus (DM) or liver affection. Also, none of the subjects smoked, took long-term medications, or suffered from known chronic disease.
Group II: Fourteen male patients aged 40–68 years with diagnosed type II DM on oral hypoglycaemic agents, liver functions were done to exclude liver diseases from this group.
Group III: Fourteen male patients from those attendant internal medicine and tropical clinics. They are scheduled to receive antiviral medications for hepatitis C virus (HCV). All of them were in stage B (according to the Child–Turcotte–Pugh classification score; Table 1).
7
The age ranges between 44 and 68 years. Assessment of liver function was done via abdominal ultrasound and laboratory tests.
Group IV: Fourteen patients aged 40–68 years were selected with the same rules as group III. In addition, they are type II DM on oral hypoglycaemic, glimepride and metformin regimen agents from DM.
CTP classification of the severity of cirrhosis.a,7

PT: prothrombin time; INR: international normalized ratio; CTP: Child–Turcotte–Pugh.
aCTP score is obtained by adding the score for each parameter. CTP class: A = 5–6 points B = 7–9 points C = 10–15 points.
Design of the work
After overnight fasting, subjects ingested 75 g of glucose diluted in 296 mL of orange-flavoured drink solution according to Galassetti et al. 8 The blood was taken from cubital vein in the early morning and 2 h after glucose ingestion. Blood sampling equipment was chemically clean and sterile, while the disinfection of the skin before venepuncture was performed by 3% hydrogen peroxide and then by distillated water. The amount of blood taken was 5 mL for each sample; the tube was closed tightly with plastic cap and was shaken gently where it was necessary.
Serum glucose levels were determined by quantitative enzymatic measurements with the use of Sigma diagnostic kit # 510 (Sigma Diagnostics, St. Louis, MO).
Analysis of blood alcohol
Headspace gas chromatography-mass spectrometry (HS GC-MS) was carried out using GCMS-QP2010 ultra (Shimadzu, Kyoto, Japan). An aqueous solution of 1-propanol added to a blood sample as an internal standard was prepared by dissolving 1-propanol in MilliQ (Corston Bath, UK) distilled water. The standard aqueous ethanol solution used to create the calibration curve, which was prepared by serial dilution of ethanol in MilliQ distilled water with concentration of 0. 3 mg/mL, 0.5 mg/mL, 1.0 mg/mL and 2.0 mg/ mL.
For the standard sample’s calibration curve, 0.5 mL of standard aqueous ethanol solutions (0.03, 0.5, 1.0 and 2.0 mg/mL, respectively) were added to headspace vials (22 mL). Next, 0.5 mL of the internal standard aqueous 1-propanol solution (0.5 mg/mL) was added, and the vials were immediately sealed with headspace caps. Similarly, 0.5 mL of the blood was added to a headspace vial. Next, 0.5 mL of internal standard aqueous 1-propanol solution (0.5 mg/mL) was added, and the vial was immediately sealed with a cap. A direct connection between headspace and the GC-MS was adopted to minimize the carrier gas consumption, and the analysis conditions are shown in Table 2. 9
HS GC-MS analysis conditions. 9

HS: headspace; GC-MS: gas chromatography mass spectrometry.
Statistical analysis
Data are presented as the mean ± standard deviation. Statistical analysis was performed using one-way analysis of variance and correlation coefficients were done using SPSS Version 22. The 0.05 level of probability was used as the criterion of significance.
Results
As shown in Tables 3 and 5, the current results showed that the normal blood glucose level (BGL) in control group was 113.60 ± 9.62 mg/dL at 2 h postprandial. The BGL in DM patients, in liver cirrhosis (LC) patients and in patients with DM and LC were 176.07 ± 43.49, 117.13 ± 11.83 and 158.07 ± 29.57 mg/dL, respectively. There was significant difference between BGL in control group and patients with DM alone or DM and LC (p < 0.05). In contrast, as expected, there were insignificant differences between BGL in control subjects and patients with LC only (p > 0.05).
Comparison between BGLs in different studied groups.

DM: diabetes mellitus; LC: liver cirrhosis; BGL: blood glucose level.
a p < 0.05 Significant when comparing to group I.
b p < 0.05 Significant when comparing to group I.
As shown in Tables 4 and 5, as regard to BAC detected by HS GC-MS, in control subjects, it ranged from 0.05 to 1.2 mg/dL with mean 0.3 ± 0.41 mg/dL. In patients with DM, the BAC is significantly higher than that of control group 4.85 ± 3.96 mg/dL; the maximum level reaches 12.90 mg/dL. In patients with LC without DM, BAC is significantly higher than control but slightly lower than that of patients with DM (3.45 ± 2.65 mg/dL). The maximum level reaches 9.7 mg/dL. In patients with both DM and LC, BAC increases to reach 22.3 mg/dL (maximum level) with mean 10.88 ± 5.36 mg/dL.
Comparison between BACs in different studied groups.
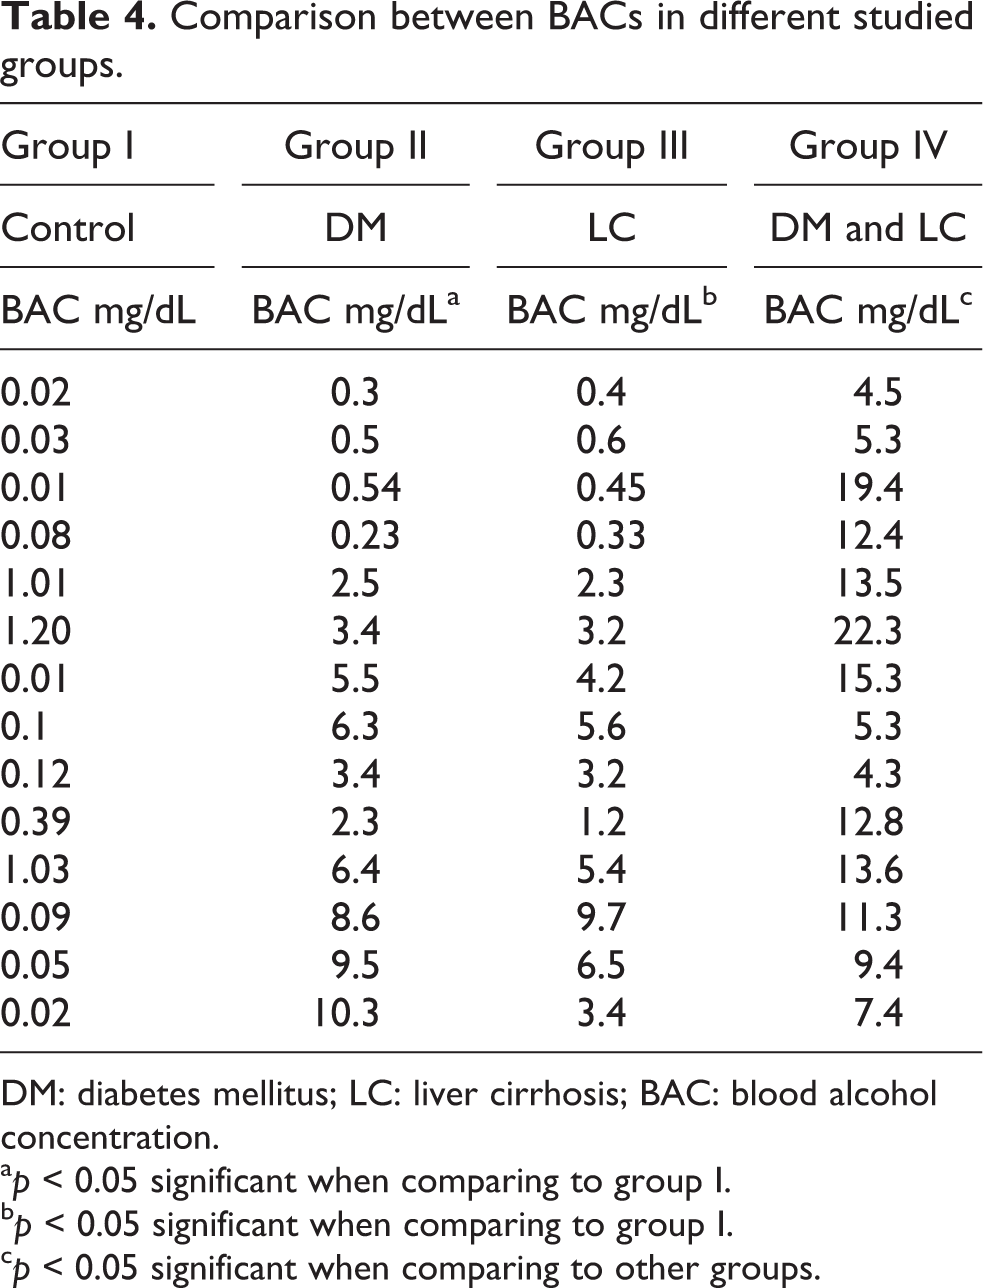
DM: diabetes mellitus; LC: liver cirrhosis; BAC: blood alcohol concentration.
a p < 0.05 significant when comparing to group I.
b p < 0.05 significant when comparing to group I.
c p < 0.05 significant when comparing to other groups.
Blood glucose and blood alcohol concentration in different studied groups.

DM: diabetes mellitus; LC: liver cirrhosis; BAC: blood alcohol concentration; BGL: blood glucose level.
a p < 0.05 significant regarding to BAC in different groups.
bMean ± standard deviation.
c p < 0.05 significant regarding to BGL in different groups.
Regarding to Table 5 when comparing BAC and BGL in each groups, all groups show insignificant correlations between both levels (p > 0.05).
Discussions
According to the results of the current study, the control group, which included healthy adult male who had not consumed any alcohol with no history of DM or liver disease, the BAC ranged from 0.05 to 1.2 mg/dL with mean 0.3 ± 0.41 mg/dL. BAC is an aliphatic endogenous alcohol in human tissue fluids, which does not originate from consumed alcoholic beverage, but is the result of a spontaneous auto generation within the body itself. Ethanol is constantly formed from acetaldehyde within the human body through various metabolic processes. Due to the fact that spontaneous auto production of ethanol occurs in healthy subjects, it is also called ‘physiological-blood ethanol’. 10,11
This detectable alcohol in the blood has resulted from intra-intestinal carbohydrate fermentation by colonic flora. 12 Auto production of ethanol in intestine is also called ‘auto-brewery syndrome’. 13,14 C. albicans produces 1 mg/h ethanol per gram of intestinal content, and, thus, it is responsible for the intestinal fermentation. 15 Early investigations using semi-quantitative methods showed the values of EnEth levels in the blood and, unfortunately, are not significant. According to the literatures, the values range from 10 to 30 mg/L. 10 Another studies, employed gas chromatography method, 16 estimated the levels of ethanol in the serum of healthy persons to be 0–39 mg/L. The value of the physiological-blood ethanol was less than 0.75 mg/L, as published by Sprung et al. 11 Shishkin et al. found the values of 0.08–1.30 mg/L, when a sensitive technique was applied. 17
Extensive investigation of the BAC level of the DM group was found that it is significantly higher than its level in the control group 4.85 ± 3.96 mg/dL; the maximum level reaches 12.90 mg/dL. This indicated that the autogeneration of the endogenous alcohol are different metabolic processes, including different disorders, which lead to the production of the precursor of ethanol and acetaldehyde. 18 Alexander et al. 19 reported the observation that indicated the association between ethanol and DM. The blood ethanol concentrations are resulted from the fermentation of carbohydrates in the gut. If this production rate exceeds the metabolism of ethanol of 6–8 g/h, then the ADH enzyme should be responsible for the efficient in ethanol’s metabolism at low concentrations. 20 Furthermore, non-metabolized ethanol has diluted with body water of 50–69% body weight. Gatt estimated the blood alcohol levels to be less than 0.5 mg/dL, 12 with exceptions, in persons with abnormal proliferation of Candida in the gut and with gut stagnation. Candida is the most common fungal species that converts glucose into ethanol. Diabetic patients often have significant amounts of glucose, which explain the possibility of conversion of glucose to ethanol. 21
In patients with LC without DM, BAC is significantly higher than control but slightly lower than that of patients with DM (3.45 ± 2.65 mg/dL). The maximum level reaches 9.7 mg/dL. In patients with both DM and LC, the BAC increases to be 22.3 mg/dL maximally, with mean 10.88 ± 5.36 mg/dL. The bulk of reabsorbed ethanol (95–98%) is neutralized in liver 22 by the hepatic enzymes responsible for biotransformation of ethanol. 23,24 Oxidizing capacity of the liver is about 6–8 g ethanol per hour in an adult individual. 13 Jones gives the clearance rate 0.1 g ethanol per kilogram body weight per hour, 23 which translates to about 7 g/kg/h for a person with a body weight of 70 kg. In order for ethanol to get into the central blood stream, its quantity which, be produced by the intestinal fermentation, in addition to the reabsorbed from the intestines has to be greater than the aforementioned values. It is simply not credible that auto-brewing could yield such quantity of ethanol that would overwhelm the clearance capacity of the liver. 13 Small amount of EnEth that manages to pass the hepatic barrier is diluted in the total body mass. This makes the values of blood ethanol so low to be in the detectable range of the standard analytical methods. The exceptions are ethnic groups from the Far East (Japanese), 25 where, in individuals with genetic metabolic deficit, the amount of ethanol in the blood can reach significant values after ingestion of rice. A similar phenomenon has been seen in patients with chronic pseudo-obstruction 26 even in young children with short bowel syndrome. 27 An abnormal yeast proliferation, food stagnation and defective alcohol metabolizing enzymes in the liver might lead to higher concentrations of ethanol in the peripheral circulation. 22
On comparing BAC and BGL in each groups, all groups show insignificant correlations (p > 0.05) and fully agree with published data (Table 6). 8 Pietro et al. found that ethanol rapidly increased after ingestion of 75 g of glucose, led to increasing BGL and then returned to near baseline much more rapidly than blood glucose. 8 The increasing breath ethanol was observed after a mixed meal which coincided with previously reported results. 28
Correlation coefficients between BGL and BAC in different groups.

BGL: blood glucose level; BAC: blood alcohol concentration; DM: diabetes mellitus; LC: liver cirrhosis; r: correlation coefficient (Correlation is not significant regarding to p-value).
Conclusion
The EnEth production has been evaluated in patients with chronic diseases (DM and LC). The measurable values are present in permissible levels without toxicity. The observed values of ethanol have no effect in the brain functions and ability of motor drivers. While these slight increases in BAC may be added to small amount of alcohol ingestion to reach the level that possibly affect brain functions. The BAC level of the DM group was found to be higher than its level in the control group. This indicated that the autogeneration of the endogenous alcohol is different metabolic processes. In patients with LC without DM, BAC is higher than control but slightly lower than that of patients with DM (3.45 ± 2.65 mg/dL). In patients with both DM and LC, the BAC increases to be 22.3 mg/dL. These low levels may be falsely interpreted when detected post-mortem in cadaver with DM or LC patients. Also, there is no correlation between BGL and BAC, that is, EnEth production is not related to BGL. Thus, it has not affected by meal. The difference between type I and type II diabetes and LC classes warrant further investigation
Footnotes
Declaration of Conflicting Interests
The author(s) declared no potential conflicts of interest with respect to the research, authorship, and/or publication of this article.
Funding
The author(s) received no financial support for the research, authorship, and/or publication of this article.