
Abstract
Tuberculosis (TB) is an intractable chronic infection. Disease treatment with anti-TB drugs remains challenging due to drug-induced hepatotoxicity. The toxicity of the anti-TB drugs rifampicin (RIF), isoniazid (INH) and pyrazinamide (PZA) either alone or in combination was investigated in HepG2 cells. Assays of intracellular adenosine triphosphate (ATP) levels at 4-, 24- and 48-h post-exposure to gradient concentrations of RIF, INH and PZA were conducted. Drug-induced effects on mitochondrial membrane potential (MMP), mitochondrial complex I and complex III activity, nicotinamide adenine dinucleotide (NAD+) levels and cellular lactate production were assessed. Decreased ATP levels were dose-dependent and correlated with drug exposure duration. Approximate 24-h IC50s were 0.5 mM, 70 mM and 84 mM for RIF, INH and PZA, respectively. Twenty-four hours post-drug treatment, reductions of MMP (p = 0.0005), mitochondrial complex I and III activities (p = 0.0001 and p = 0.0003, respectively), NAD+ levels (p = 0.0057) and increased lactate production (p < 0.0001) were observed. Drug combinations used to mimic cumulative drug treatments induced a synergistic inhibition of mitochondrial complex I activity. An assessment of cellular ultrastructure using transmission electron microscopy indicated drug-induced mitophagy. Collectively, our study suggests that hepatotoxicity of commonly employed anti-TB drugs is mediated by their curtailment of mitochondrial function.
Keywords
Introduction
Tuberculosis (TB) is an airborne infectious disease. Treatment of TB remains one of the major public health challenges in the world today. In 2013, 9 million people developed TB, and 1.5 million died from the disease. 1 Rifampicin (RIF), isoniazid (INH) and pyrazinamide (PZA) are basic (first-line) anti-TB drugs. 2 The treatment regimen currently used in some developing countries is a fixed-dose, single-tablet combination of four drugs: RIF, INH, PZA and ethambutol (EMB) for 2 months, followed by 4 months of INH–RIF and/or EMB. The multidrug combination is employed at the intensive phase of treatment in an attempt to reduce primary INH–RIF combination drug resistance. 2 Additionally, the use of fixed dose combination tablets can improve patient adherence to treatment. 3 However, adverse drug reactions during TB treatment persist for which there are risk factors that include gender, age, malnutrition, co-infection with HIV and liver functionality. 4
Specifically, anti-TB drug-induced hepatotoxicity during standard multidrug TB treatment has been reported, with incidence influenced by a similar set of risk factors. 4 –7 However, patients with anti-TB drug-induced elevation of liver transaminase levels may still be asymptomatic. 6,8 Of the anti-TB drugs prescribed: RIF, INH and PZA are potentially hepatotoxic, 9 –14 whereas no hepatotoxicity has been described for EMB. 2
Although the induction of anti-TB drug-induced hepatotoxicity has been documented, the mechanism by which individual or combinatorial anti-TB drugs influence cell viability and mitochondrial bioenergetics has not been extensively studied. Herein we have investigated the potential hepatotoxicity of commonly employed anti-TB drugs, and provide a mechanistic insight into individual drug or dual-drug combination contributions to drug-induced hepatotoxicity.
Materials and methods
Chemical agents
The antibiotic, RIF (5,6,9,17,19,21-hexahydroxy-23-methoxy-2,4,12,16,18,20,22-heptamethyl-8-[N-(4-methyl-1-piperazinyl)formimidoyl]-2,7-(epoxypentadeca[1,11,13]trienimino)-naphtho[2,1-b]furan-1,11(2 H)-dione 21-acetate), (C43H58N4O12; MW = 822.94 g/mol); antibacterial agents INH (pyridine-4-carbohydrazide) (C6H7N3O), MW 137.13 g/mol) and pyrazinamide (pyrazine-2-carboxamide) (C5H5N3O, MW = 123.11 g/mol) were all purchased from Sigma (St Louis, Missouri, USA). For assays, drugs were dissolved in dimethyl sulfoxide (DMSO), and diluted into serum-free media when applied to cells. Additions of vehicle (DMSO) only at identical dilutions to that of assay samples were used to generate control readings for all assays. All other chemicals and media components were also purchased from Sigma unless specified.
Cell culture
Human hepatocellular carcinoma cells (HepG2 cells) were grown in serum-free PC-1 medium (Cambrex, NJ, USA) supplemented with 2 mM L-glutamine. Cells were incubated at 37°C in a humidified atmosphere with 5% CO2.
Intracellular ATP content determination
Cells were seeded in 96-well plates at 1 × 10⁴ cells/well. At confluence cells were treated with the anti-TB drugs at concentrations of 0.1, 1, 10 and 100 mM for INH or PZA, and concentrations of 1 µM, 10 µM, 0.1 mM and 1 mM for RIF. After 4, 24 and 48 h cells were harvested and intracellular adenosine triphosphate (ATP) content determined according to the manufacturer’s protocol (Abcam, Cambridge, Massachusetts, USA). Briefly, 50 µL of the supplied cell lysis buffer was added to each well and the plates were shaken for 5 min. Then 50 µL of the reconstituted substrate (D-luciferin) was added to each well. Plates were placed on an orbital shaker for 5 min and then kept in the dark for further 10 min. The microplate scintillation counter ‘TopCount’ (Perkin Elmer, Waltham, Masachusetts, USA) was used to determine intracellular ATP levels. Basal values in medium were subtracted from each test value. Intracellular ATP levels are represented as a percentage of vehicle controls. Experiments were conducted in triplicates.
MMP measurements
HepG2 cells were seeded in 24-well plates at a density of 3 × 10⁴ cells/well. At confluence cells were treated for 24 h with the anti-TB drugs: RIF at 0.1 and 0.5 mM, INH at 10 and 70 mM and PZA at 10 and 84 mM. The media was removed and the Mitotracker green assay performed according to the manufacturer’s protocol (Invitrogen, Carlsbad, California, USA). Mitotracker green staining solution was added and the plates incubated at 37°C for 30 min. A weak hydrophobic acid, carbonyl cyanide 4-(trifluoromethoxy)phenylhydrazone, a protonophoric uncoupler of oxidative phosphorylation in mitochondria, was used as a positive control. After staining, fluorescence was read in fresh phosphate buffer saline (PBS) using a Dyne MRX microplate reader (Dyne technologies, Virginia, USA) using excitation/emission filters of 490/451 nm, respectively.
Mitochondrial complex I and III activity assays
HepG2 cells were treated with RIF (0.1 and 0.5 mM), INH (10 and 70 mM) and PZA (10 and 84 mM) for 24 h. Complex I and complex III activities were assayed. For complex I assays, a mitochondrial-enriched fraction was used, prepared according to the procedure of Spinazzi et al.
15
in 10 mM ice-cold hypotonic Tris buffer (pH 7.6) containing 1.5 M sucrose. 2,6-Dichloroindophenol
Complex III activity was measured according to the procedure of Spinazzi et al. 15 ; measuring the ability of the cell lysate to reduce cytochrome C monitored by a change in absorbance at 550 nm. Specific complex III activity was calculated as the difference between activities measured in the absence and presence of 2 mM antimycin A.
To study the effect of combinations of anti-TB drugs upon complex I activity, cells were pre-treated with RIF, INH and PZA at concentrations of 30 µM, 3 mM and 3 mM, respectively, for 48 h before initiation of the activity assays. At these drug concentrations ATP levels were not significantly reduced. After removal of media, cells were washed with PBS and then exposed to RIF (0.1 or 0.5 mM), INH (10 or 70 mM) or PZA (10 or 84 mM). After 24 h, complex I and III activity measurements were taken.
Cellular NAD+/NADH measurements
Cellular nicotinamide adenine dinucleotide (NAD+/NADH) levels were determined using a commercial kit (product 600480, Cayman Chemical, Michigan, USA), according to the manufacturer’s protocol. HepG2 cells were seeded at 0.1 × 10⁴ cells per well in 96-well plates, and grown until confluent. Once confluent, culture media was removed and cells treated with the anti-TB drugs at their 50% inhibitory concentrations (IC50). After 24 h, 120 µL of assay buffer was added and then the plates centrifuged at 500 × g for 5 min. Assay buffer was removed and then 110 µL of permeabilization buffer added to each well. Plates were shook for 30 min at room temperature and then centrifuged at 1000 × g for 5 min at 4°C. One hundred µL of the supernatant was removed to a fresh plate, followed by 100 µL of reaction buffer. Plates were shook for 90 min before absorbance readings taken at 450 nm. Reagent only blanks were subtracted from the absorbance of all wells. The absorbance measurements of drug-treated samples were represented relative to vehicle controls. Experiments were performed in triplicates.
Lactate production assays
HepG2 cells were seeded in 24-well plates at 5 × 10⁴ cells/well. At confluence cells were treated for 24 h with RIF (0.01 and 0.5 mM), INH (10 and 70 mM) and PZA (10 and 84 mM). After trypsinization, cells were counted, and cell supernatant media removed and assayed immediately for lactate levels using a lactate assay kit (Biovision, CA, USA) according to the manufacturer’s protocol. Lactate production was normalized to cell number and expressed as a percentage of lactate production from control cells. Experimental data points were performed in triplicates.
Transmission electron microscopy
HepG2 cells were grown to near confluence in Eagle’s minimum essential medium with 2 mM glutamine, 1% non-essential amino acids and 10% foetal bovine serum in 175 cm2 flasks. Media was removed and replaced with media containing low serum (2%) and cells grown for 24 h. Cells were then incubated with media containing the anti-TB drugs RIF, INH or PZA at concentrations of 0.5, 70 and 84 mM, respectively. After 24 h of drug treatment, media was removed and cells washed with media containing fixative (3% glutaraldehyde in 0.1 M cacodylate buffer). The 1:1 (v/v) media: fixative solution was replaced with fixative alone, and cells fixed in the cell incubator for 1 h at 37°C. Flasks were removed and cells scraped into the fixative. Cells were collected by centrifugation at 1500 rpm for 5 min at 4°C, and then further fixed for 1 h at 4°C. Cells were washed in 0.1 M cacodylate buffer, transferred to flat-bed embedding capsules and then incubated for 1 h with 1% osmium tetroxide in 0.1 M cacodylate buffer. Cells were washed with water and then dehydrated with a graded ethanol series of 50, 70, 90 and 100% ethanol, and a transitional solution, 100% propylene oxide (propox). Cells were infiltrated with an epoxy resin: propox mix (1:1) overnight, and then infiltrated with epoxy resin 3 times for 2 h each the following day. Samples were then embedded and polymerized in an oven at 60°C for 48 h. Ultra-thins of the cells (80 nm) were sectioned with a diamond knife on a Leica EM UC6 ultra microtome, collected and placed on 200 mesh copper grids. Sections were analysed using a Tecnai G2 BioTWIN transmission electron microscope (TEM; FEI company, Eindhoven, The Netherlands), which was run at an accelerated voltage of 100 kV. For each cell treatment up to 19 fields of view were analysed, with random unbiased selection. Images were captured using a MegaView SIS camera, with representative images included in figures.
Statistical analysis
All statistical procedures were performed using PRISM 5 (GraphPad Software Inc., San Diego, California, USA). For the IC50, curve fitting was performed using single-use log (antagonist) versus response (variable slopes). A one-way analysis of variance test was performed with Dunnett’s multiple comparisons post-test. Unpaired Student’s t-tests were performed for two group comparisons. Data points or histograms in figures represent means ± SEMs, with differences compared to control values set at 100% of activity. Statistical significance was defined as p < 0.05. For figures, significance is represented as *** for p < 0.001,** for p < 0.01 and * for p < 0.05.
Results
Hepatotoxicity of anti-TB drugs
To assess the influence of the anti-TB drugs RIF, INH and PZA on cellular ATP levels, HepG2 cells were incubated with each drug over a broad concentration range for up to 48 h (Figure 1). Collectively, all drugs reduced ATP levels in a concentration- and exposure duration- dependent manner; albeit with similar drug profiles for 24- and 48-h incubations (Figure 1). RIF was the most potent drug as it significantly reduced ATP levels (p = 0.0021) 4 h post-treatment at a concentration of 0.1 mM. A summary of the approximate IC50 values for each drug are listed in Table 1.
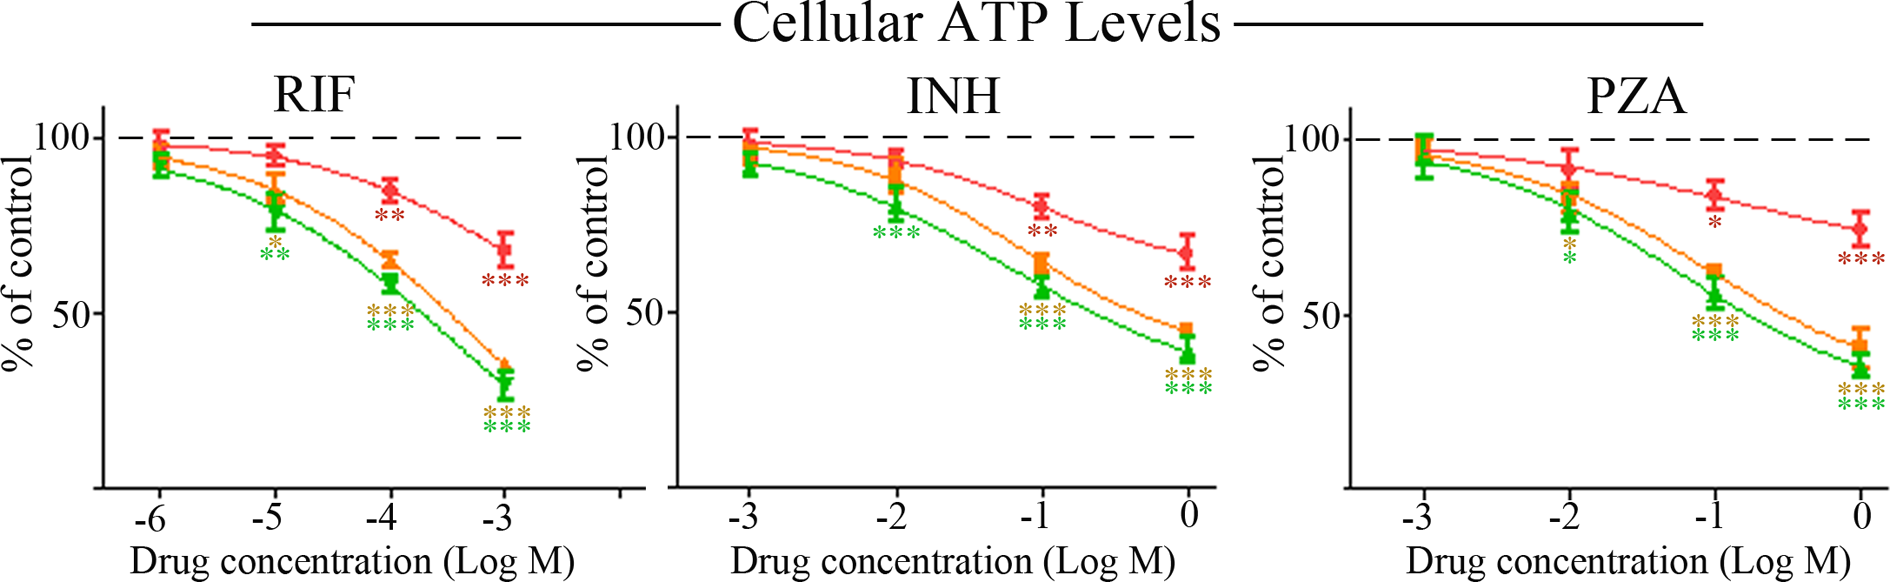
Hepatotoxicity of anti-TB drugs. HepG2 cells were treated with the anti-TB drugs RIF, INH and PZA, and cellular ATP levels measured after 4 h (red circles), 24 h (orange squares) and 48 h (green triangles). Graphs depict mean values relative to vehicle control values of 100%, with significant changes from controls marked with asterisks. For significance: ***p < 0.001; **p < 0.01 and *p < 0.05. TB: tuberculosis; HepG2 cells: human hepatocellular carcinoma cells; RIF: rifampicin; INH: isoniazid; PZA: pyrazinamide; ATP: adenosine triphosphate.
Hepatotoxicity of anti-TB drugs. HepG2 cells were treated with the anti-TB drugs RIF, INH and PZA, for 4, 24 and 48 h and the drug concentration producing 50% inhibition (IC50 values) of cellular ATP production determined.
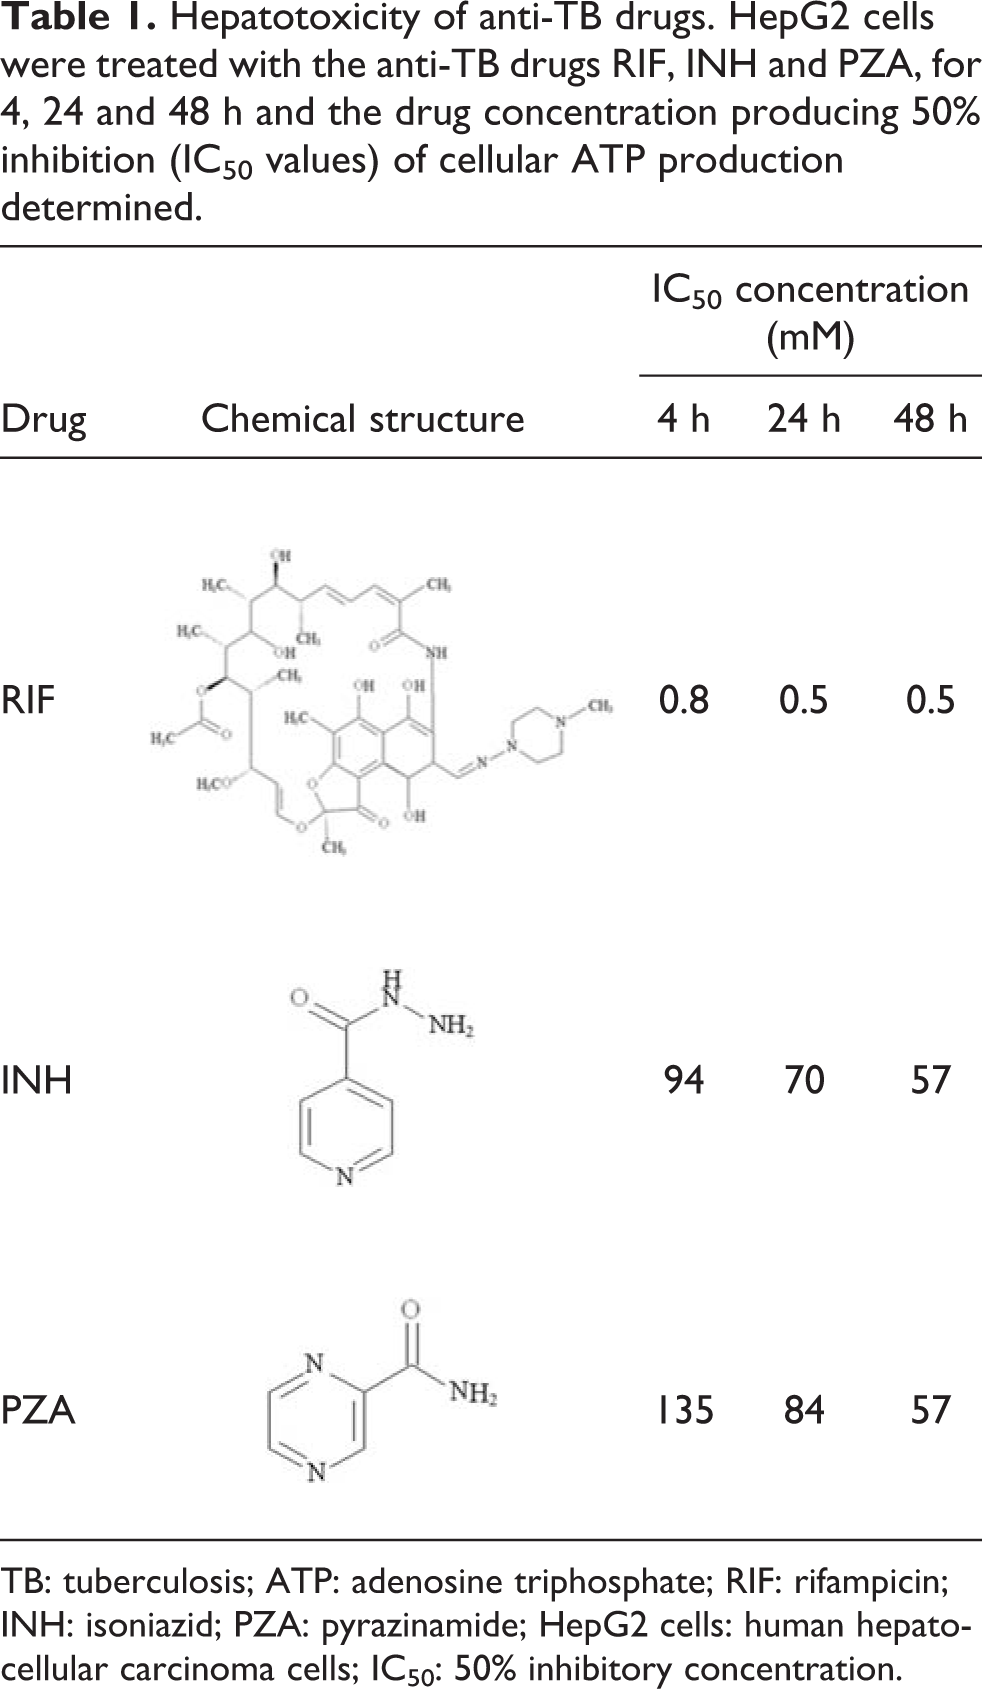
TB: tuberculosis; ATP: adenosine triphosphate; RIF: rifampicin; INH: isoniazid; PZA: pyrazinamide; HepG2 cells: human hepatocellular carcinoma cells; IC50: 50% inhibitory concentration.
Drug-induced uncoupling of mitochondrial bioenergetics
A mitotracker green assay was performed to quantify the effect of the tested anti-TB drugs on mitochondrial membrane potential (MMP). Drugs were applied approximately at their IC50 values as determined by the ATP assay and also at lower concentrations of 0.1 mM, 10 mM and 10 mM for RIF, INH and PZA, respectively. All drugs at their IC50 concentrations significantly decreased MMP approximately by 40% 24 h post-exposure (p = 0.0005). At the lower tested concentrations all drugs reduced MMP approximately by 12–15% but this did not reach significance (Figure 2).

Effect of anti-TB drugs on HepG2 cell mitochondrial membrane potential. HepG2 cells were incubated with anti-TB drugs at the concentrations listed for 24 h and then the mitochondrial membrane potential measured using a mitotracker green assay. Histograms are displayed relative to vehicle control values of 100%, with significant changes from controls marked with asterisks. For significance: **p < 0.01 and *p < 0.05. TB: tuberculosis; HepG2 cells: human hepatocellular carcinoma cells.
These drug concentrations were then assessed for inhibitory activity towards mitochondrial complex-I (MC-1) activity. At their IC50 concentrations RIF, INH and PZA significantly inhibited MC-I activity (p = 0.0001) by approximately 40%, 43% and 33%, respectively (Figure 3, upper panel). Additionally at a concentration of 0.1 mM RIF also significantly reduced MC-I activity approximately by 20% (Figure 3, upper panel). Mitochondrial complex-III (MC-III) activity was less sensitive to drug inhibition, and was inhibited by RIF and INH only at their IC50 concentrations (approximately 30% inhibition, p = 0.0003), whereas PZA at an IC50 concentration did not significantly reduce MC-III activity (Figure 3, lower panel).
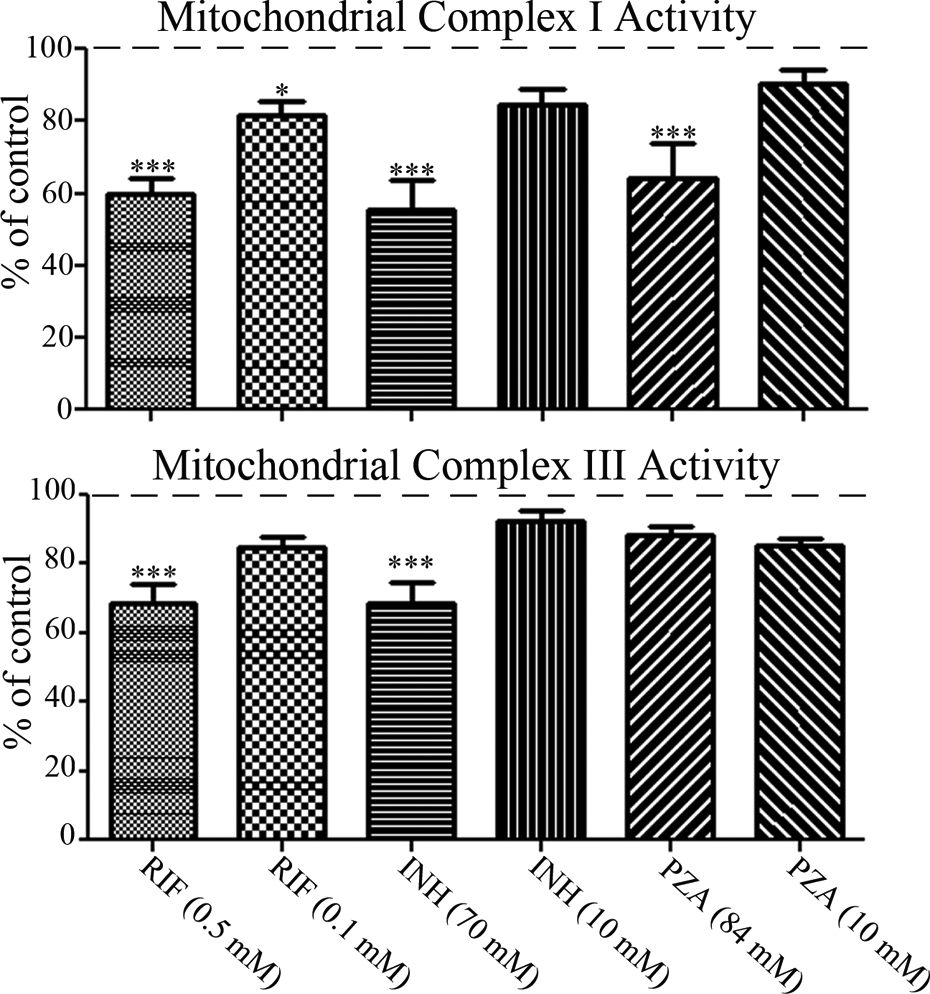
Effect of anti-TB drugs on HepG2 cell mitochondrial complex I and complex III activities. HepG2 cells were incubated with anti-TB drugs at the concentrations listed for 24 h and then mitochondrial complex I and complex III activities were measured. Histograms are displayed relative to vehicle control values of 100%, with significant changes from controls marked with asterisks. For significance: ***p < 0.001 and *p < 0.05. TB: tuberculosis; HepG2 cells: human hepatocellular carcinoma cells.
To further verify the uncoupling of mitochondrial activity we also quantified cellular NAD+ levels. Incubation of cells at IC50 concentrations for RIF and INH significantly reduced cellular NAD+ levels by 41% and 39%, respectively (p = 0.0057). A 21% reduction of NAD+ levels at the IC50 concentration for PZA was observed, but this did not reach significance (Figure 4).
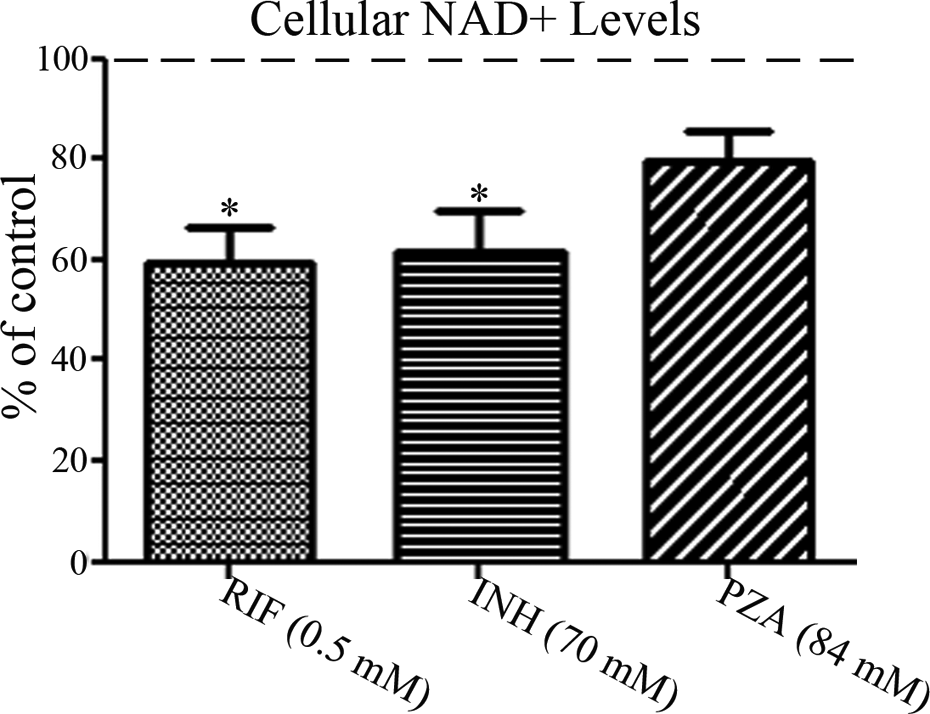
Effect of anti-TB drugs on HepG2 cell NAD+ levels. HepG2 cells were incubated with anti-TB drugs at the concentrations listed for 24 h and then NAD+ levels measured. Histograms are displayed relative to vehicle control values of 100%, with significant changes from controls marked with asterisks. For significance: *p < 0.05. TB: tuberculosis; HepG2 cells: human hepatocellular carcinoma cells.
As combinations of these anti-TB drugs are medically prescribed for patients suffering from TB, we also investigated the effects of drug combinations on MC-I activity. Cells were pre-incubated with anti-TB drugs at concentrations of 30 µM, 3 mM and 3 mM for RIF, INH and PZA, respectively, for 48 h. At these drug concentrations ATP levels were not significantly reduced (Figure 1). Cells were subsequently treated with RIF at 0.5 mM (24-h IC50 concentration) and MC-I activity quantified (Figure 5(a)). At this RIF concentration, MC-I activity was significantly reduced approximately to 60% of control values, similar to a single-drug incubation (as observed in Figure 2). Incubations of cells with RIF at 0.5 mM and addition of either INH (3 mM) or PZA (3 mM) reduced MC-I activity a further 1–10%, but this was not significant (Figure 5(a)). By contrast, incubation of cells with RIF at a lower concentration of 0.1 mM reduced MC-I activity approximately to 82% of controls (similar to Figure 2), but the combination of RIF (0.1 mM) with INH (3 mM) significantly reduced MC-I activity by a further 21% (p = 0.0417) (Figure 5(b)). Cells incubated with RIF (0.1 mM) and PZA (3 mM) evoked a 2% non-significant reduction of MC-I activity.

Effect of combinations of anti-TB drugs on HepG2 cell mitochondrial Complex I activity. HepG2 cells were pre-incubated with RIF, INH and PZA at 30 µM, 3 mM and 3 mM, respectively, for 48 h. Cells were subsequently treated with anti-TB drugs at the concentrations detailed for 24 h and then mitochondrial complex I activity measured. Significant changes from dual-drug versus single-drug incubations are marked with asterisks. For significance: **p < 0.01 and *p < 0.05. TB: tuberculosis; HepG2 cells: human hepatocellular carcinoma cells; RIF: rifampicin; INH: isoniazid; PZA: pyrazinamide.
Cell incubation with INH at 70 mM significantly reduced MC-I activity approximately to 56% of controls (similar to Figure 2), and this was also further reduced by 10 and 3% with additions of either RIF (3 µM) or PZA (3 mM), respectively, but these reductions were not significant (Figure 5(c)). Incubation of cells with INH at 10 mM produced approximately a 15% fall of MC-I activity (similar to Figure 2), but notably a further significant 16% reduction of MC-I activity (p = 0.0466) was observed with the INH and RIF (3 µM) drug combination (Figure 5(d)). Incubation with INH (10 mM) and PZA (3 mM) produced a 4% non-significant further reduction of MC-I activity (Figure 5(d)).
Incubation of cells with 84 mM PZA produced a 36% reduction of MC-I activity, in keeping with Figure 2, and although this was further reduced by 4% and 14% with additions of RIF (3 µM) and INH (3 mM), respectively, these changes were not significant (Figure 5(e)). Incubation with 10 mM PZA reduced MC-I activity by 10% (as seen in Figure 2), and this was further reduced by co-incubation with 3 µM RIF (12%, non-significant), and INH at 3 mM (approximately 21% significant, p = 0.0078) (Figure 5(f)).
To study the bioenergetic shift of HepG2 cells to anaerobic metabolism due to the influence of anti-TB drugs, cellular production of lactate was measured. RIF, INH and PZA at their IC50 concentrations all significantly increased cellular lactate production (p < 0.0001) by approximately 41, 37 and 16%, respectively (Figure 6). However, lower drug concentrations (0.1, 10 and 10 mM for RIF, INH and PZA, respectively) did not induce a significant change of lactate levels (Figure 6).

Effect of anti-TB drugs on HepG2 cellular lactate production. HepG2 cells were incubated with anti-TB drugs at the concentrations listed for 24 h and then the level of lactate produced was measured. Histograms are displayed relative to vehicle control values of 100%, with significant changes from controls marked with asterisks. For significance: ***p < 0.001 and *p < 0.05. TB: tuberculosis; HepG2 cells: human hepatocellular carcinoma cells.
Drug-induced cellular damage
To assess cellular and mitochondrial damage as a consequence of anti-TB drug treatment, cells were incubated with anti-TB drugs for 24 h at their IC50 concentrations and then fixed for TEM. Control cells were relatively rich in rod-shaped mitochondria, with well-defined cristae, and displayed relatively few vacuoles (Figure 7(a)). By contrast, cells treated with RIF displayed spherical mitochondria, abundant vacuoles indicative of removal of damaged mitochondria by mitophagy, and vacuoles thought to contain degrading mitochondria (mitophagolysosomes) (Figure 7(b)). For cells treated with INH or PZA, rod-shaped mitochondria similar to control cells were observed, but also spherical mitochondria and presumed mitophagic vacuoles were present (Figure 7(c) and (d)).

Effect of anti-TB drugs on HepG2 cell ultrastructure. HepG2 cells were incubated with (a) vehicle control, (b) RIF at 0.5 mM, (c) INH at 70 mM, (d) PZA at 84 mM for 24 h and then cellular ultrastructure assessed by TEM. Electron micrographs depict at least one nucleus. A control rod-like mitochondrion is marked with an asterisk (panel A), smaller, spherical mitochondrion marked with an arrowhead (panels b, c and d) and presumed mitophagolysosomes marked with a long arrow (panel b). White bar denotes 5000 nm. TB: tuberculosis; ATP: adenosine triphosphate; RIF: rifampicin; INH: isoniazid; PZA: pyrazinamide; HepG2 cells: human hepatocellular carcinoma cells; TEM: transmission electron microscope.
Discussion
Anti-TB drug-induced liver insult is a leading cause of drug-induced acute liver injury and failure in the developing world. 17 However, the correlation between serum anti-TB drugs levels and drug-induced hepatotoxicity remains unclear. 7 Collectively, there are toxicity concerns regarding the use of anti-TB drugs as either dual-drug combinations or as a four drug fixed-dose combination, with subjects ranging from asymptomatic elevation of liver enzymes to displaying severe hepatitis. 4 –14,18
We show here that the anti-TB drugs RIF, INH and PZA significantly reduce ATP levels in HepG2 cells in a concentration- and exposure duration-dependent manner. The antibiotic RIF with the lowest estimated IC50 was the most potent inhibitor. At these IC50 concentrations a concurrent and significant decrease of MMP, inhibition of MC-I and MC-III activities, decrease of NAD+ levels, and increased cellular lactate production were also observed. To establish a drug dose and effect relationship, drug concentrations below IC50 values were also examined. At these lower drug concentrations reduced MMP, MC-I and MC-III activities were still evident, but they did not reach significance except for RIF inhibition of MC-I activity at 0.1 mM.
Mitochondrial protein complexes I and III are components of the electron transport chain (ETC) that is crucial for cellular respiration and the generation of ATP. MC-I (NADH: ubiquinone oxidoreductase) oxidizes NADH produced predominantly from the tricarboxylic acid cycle, but also from β-oxidation of fatty acids. Two electrons are produced from NADH oxidation, and these are used to reduce ubiquinone to ubiquinol in the inner mitochondrial membrane, and initiate the supply of electrons to be passed through the ETC to reduce oxygen to water. This MC-I redox reaction also drives proton transport across the inner mitochondrial membrane. Similarly, electron transport is coupled to proton translocation in MC-III and IV, and this proton motive force supports ATP synthesis in complex V. 19,20 Hence drug-induced inhibition or dysfunction of MC-I, and/or MC-III will limit the transfer of electrons along the ETC, driving the loss of the MMP, reduced NADH oxidation (NAD+ production), and ultimately a breakdown of cellular ATP production (Figures 1 to 4), and increased anaerobic metabolism and lactate production (Figure 6).
In support of our results, drugs or oxidants that induce mitochondrial damage can provoke a progressive loss of cellular energy (ATP) resource, mitochondria degeneration and ultimately cell death. 21 –24 Indeed mitochondrial dysfunction is suggested to play a crucial role in the etiology of drug-induced toxicities. Medication-induced mitochondrial dysfunction may arise through several mechanisms including direct inhibition of mitochondrial DNA transcription of ETC complexes, and the inhibition of the enzymes required for glycolysis and β-oxidation. 25 –27 In addition, inhibition of mitochondrial complexes, particularly MC-I, can increase the production of reactive oxygen species (ROS). 28 ROS can damage cellular components including lipids, proteins and DNA. Hence once mitochondria are damaged there will be a disruption of cellular bioenergetics. 27 In support of this work, agents with anti-oxidative activity have been shown to exhibit hepato-protective effects, able to prevent anti-TB drug-induced hepatotoxicity. 29,30
Our strategy of drug pre-treatment followed by subsequent cellular dosing provides an in vitro model to mimic cumulative drug treatment in vivo. 30 Our study has highlighted that a combination of anti-TB drugs may significantly increase their adverse effect on MC-I activity; presumably leading to exacerbated drug toxicity. A further reduction of MC-I activity was registered even with drugs employed at their IC50 concentrations (Figure 5(a), (c) and (e)), but moreover, with drug concentrations that produced a 10–20% reduction of MC-I activity, a further dual-drug treatment of RIF + INH, or PZA + INH combinations were able to further significantly reduce MC-I activity (Figure 5(b), (d) and (f)). The concentration of drugs used for pre-treatments reflected relatively high therapeutic dose levels, but for which no detectable depletion of ATP levels were evidenced. For RIF, a literature review has suggested that the current recommended 600 mg daily could be further increased to be more clinically efficacious without induction of toxicity. 31 Ultimately, this synergistic effect of inhibiting MC-I activity at high therapeutic dose levels could be a contributing factor to patient hepatotoxicity experienced by dual- or multi-drug combinations.
Damaged or excessive mitochondria are targeted for degradation and elimination by an autophagosome pathway. Autophagosomes fuse with lysosomes to form mitophagolysosomes (autolysosomes) in which the enveloped contents are degraded. This process of mitophagy can be cytoprotective and triggered in response to mitochondrial damaging agents that disrupt the MMP, generate ROS and deplete cellular ATP levels. 32 –34 With TEM we were able to detect the presence of spherical mitochondria, extensive vacuolization and the presence of vacuoles thought to contain degrading mitochondria (mitophagolysosomes) in response to drug incubations (Figure 7). These mitochondrial changes are similar to those observed in liver cells as a response to acute toxicological insult from ethanol. 34 Changes to mitochondrial morphology and evidence of mitophagy was most apparent for RIF-treated cells, consistent with this drug’s relatively higher mitochondrial toxicity as determined by a reduction of MMP, mitochondrial complex I and III activities, NAD+ levels and increased lactate production (Figures 2 to 4 and 6).
In summary, our results suggest that anti-TB drugs provoke hepatotoxicity by inducing deficiencies in the functions of mitochondrial ETC proteins. This study also highlights toxicity concerns regarding multi-drug combinatorial usage, and the importance of pre-clinical in vitro testing of newly discovered anti-TB drug combinations on cellular bioenergetics, as this approach may provide a useful predictive index of hepatotoxic potential.
Footnotes
Acknowledgements
The authors are grateful to Mr Ian Ward (University of Nottingham, UK) for technical assistance with resin embedding for transmission electron microscopy. The authors would also like to acknowledge the helpful suggestions of the manuscript reviewers.
Declaration of Conflicting Interests
The author(s) declared no potential conflicts of interest with respect to the research, authorship, and/or publication of this article.
Funding
The author(s) disclosed receipt of the following financial support for the research, authorship, and/or publication of this article: The authors gratefully acknowledge financial support from Mansoura University, Egypt, and the University of Nottingham, UK.