
Abstract
Ochratoxin A (OTA) induced DNA damage, cytotoxicity, and apoptosis in mammalian cell lines. Micro RNAs (miRNAs) are involved in physiological and developmental processes and contribute to cancer development and progression. In our study, high-throughput miRNA profiling and Kyoto Encyclopedia of Genes and Genomes analysis were applied to comparatively study the toxicity of OTA in HEK293 cells and HepG2 cells treated with 25 μM OTA for 24 h. In these two cells, the same changing miRNAs were mostly related to signal transduction pathways, whereas the different changing miRNAs were mostly related to human cancer pathways. DGCR8, Dicer1, and Drosha were significantly suppressed in HEK293 cells, indicating an impairment of miRNA biogenesis. The damage seemed more extensive in HEK293 cells. Cell models and in vivo models were also compared. Many miRNAs in vitro were markedly different from those in vivo; however, OTA toxicity was observed both in vitro and in vivo. The classification of deregulated pathways is similar. The biogenesis of miRNA was impaired in both lines. In conclusion, deregulated miRNAs in vitro are mostly related to human cancer and signal transduction pathways. The deregulated pathways in vivo are similar to those in vitro.
Introduction
Ochratoxin A (OTA) is a ubiquitous mycotoxin produced by several species of Aspergillus and Penicillium. 1 Humans are chronically exposed to OTA because of its presence in a variety of foodstuffs. 2 OTA is classified under carcinogen group 2B, 3 a possible human carcinogen. The target organs of OTA are the kidney and the liver. Oxidative stress, DNA adducts, and signaling transduction were considered the causes of OTA toxicity. 4
MicroRNAs (miRNAs) play an important role in stress resistance and metabolism. They are important regulators of gene expression. 5 The miRNAs typically regulate gene expression at the posttranscriptional level by binding to partially complementary sites on their target messenger RNAs (mRNAs) to promote mRNA degradation or translational inhibition. 6 A strong connection between miRNA processing and cancer resulting from impaired miRNA processing was found in various tumors. 7 –9 The miRNAs have been implicated in the control of a wide range of physiological pathways. The miRNA profiling is helpful to identify miRNAs to regulate target genes and a large range of biological processes. 10 Organ-specific miRNA patterns are able to provide new insights into their possible functions. 11
High-throughput sequencing has been used to study miRNAs at the genome level in several plants, mutants, and tissues, as well as at different stages of development, which could potentially enable the early detection of tumor recurrence. 12,13 Moreover, the combination of sequencing technologies and bioinformatics will accelerate the identification of novel miRNAs and discovery of cancer biomarkers. 14
The miRNA expression profiling has not been used to investigate the connection of OTA toxicity in kidney cell line and liver cell line in vitro. To study the functions of miRNAs in HEK293, HepG2, and their possible roles in these pathways, a deep sequencing method and molecular biology approaches were employed to identify miRNAs. In our study, first, we explored the similarity and differences of OTA toxicity between hepatic and kidney cell lines. Second, we incorporate in vitro and in vivo miRNA profiling models to analyze the toxicity of OTA.
Materials and methods
Cell culture and treatment
The HEK293 and HepG2 cell lines were obtained from American Type Culture Collection. HEK293 and HepG2 cells were grown on Dulbecco’s modified Eagle’s medium. The medium for HEK293 cells was supplemented with 10% fetal bovine serum (FBS; HyClone, GE Healthcare, Logan, Utah, USA), 100 U/ml penicillin, 100 μg/ml streptomycin, 250 ng/ml amphotericin B (Macgene, Beijing, People’s Republic of China), 2 mM
Detection of apoptosis by Hoechst 33342
After OTA treatment as described above, cells were washed twice with phosphate-buffered saline (PBS) and treated with 0.1 mg/ml Hoechst 33342 for 10 min at 37°C in the dark. Hoechst-stained nuclei were observed under a fluorescence microscope (Olympus BX51, Japan). The amount of cells for each sample is about 106.
Cell viability assay
The cells were seeded in a 96-well plate at a cell density of 1 × 10⁴ cells/well. After incubation with 25 μM of OTA for 24 h, 20 μL 3-(4,5-dimethylthiazol-2-yl)-2,5-diphenyltetrazolium bromide (MTT) was added to the wells. The cells were then incubated for an additional 4 h at 37°C. The reaction was stopped by removal of the supernatant. The MTT formazan crystals were then dissolved with 200 μL dimethyl sulfoxide. The absorbance at 540 nm was determined using a microplate reader (ThermoFisher Scientific, Waltham, Massachusetts, USA).
Δψm Assay
The mitochondrial membrane potential (Δψm) was measured by JC-1 staining. 15 In brief, the cells were treated as above and then washed once with PBS and incubated with JC-1 (Beyotime, China) staining solution (5 μg/ml) for 20 min at 37°C. After the cells were washed twice with the JC-1 staining buffer, the fluorescence densities of the JC-1 monomers (λex = 488 nm, λem = 529 nm) and JC-1 aggregates (λex = 524 nm, λem = 594 nm) were detected using a microplate reader. The Δψm of the HEK293 and HepG2 cells was expressed as the fluorescence intensity ratio of the JC-1 aggregates over the JC-1 monomers.
miRNA library construction and expression profile sequencing procedures
Total RNA was extracted from HEK293 and HepG2 cells using the mirVana™ miRNA isolation kit (Ambion, Foster City, California, USA) following the manufacturer’s instructions. Three replicates were pooled for one sample. The quality of the purified RNA was assessed using a BioAnalyzer 2100 (Agilent Technology, Santa Clara, California, USA) with the following parameters: RNA integrity number ≥7.5 and concentration ≥200 ng/μl. The RNA concentration was determined by measuring the absorbance at 260 nm with a Nanodrop ND-2000 spectrophotometer (Infinigen Biotechnology, City of Industry, California, USA). RNA samples were stored at −80°C and were sequenced with the Solexa/Illumina platform. Small RNA library was constructed and deep sequencing was performed according to the method described by Dai et al. 16
Real-time polymerase chain reaction
The miRNA was transcribed into first-strand complementary DNA (cDNA) using the miRcutemiRNA first-strand cDNA synthesis kit miRNA (Tiangen, Beijing, China). Quantitative real-time reverse transcriptase PCR (RT-PCR) was performed using RealMasterMix (SYBR green I; Tiangen, Beijing, China). The internal control was 5 s for miRNA and β-actin for mRNA. RT-PCRs were run on the ABI 7500 real-time PCR machine (Applied Biosystems, Foster City, California, USA), with three technical replicates per sample. The thermal cycling program was set as follows: 95°C for 5 min, followed by 42 cycles of 95°C for 30 s, 60°C for 30 s, and 72°C for 30 s, a melting curve was performed as a default. Data were analyzed using the ΔΔCtmethod, where
Animal experiment
Animal studies were conducted in accordance with the ethical guidelines for the care and use of laboratory animals of the Supervision & Testing Center for Genetically Modified Organisms Food Safety, Ministry of Agriculture (Beijing, China) (license number SYXK (Beijing) 2010–0036). All procedures were approved by the Animal Care ethics Committee of China Agricultural University (permission number: 120020)
Male F344 rats were obtained from Vital River Inc. (Beijing, China) aged 6–7 weeks. Food and water were provided ad libitum. Eighteen rats were administered with OTA at doses of 0, 70, or 210 μg/kg body weight in corn oil (Aladin, Shanghai, China) by gavage for 13 weeks (5 days/week). Six rats were in a group. KC (control group), KM (mid-dose group), and KH (high-dose group) represent groups with 0, 70, and 210 μg/kg in the kidneys, and LC, LM, and LH represent groups with 0, 70, and 210 μg/kg in their livers, respectively. 16 All the rats were killed by dislocation under anesthesia (Pentobarbital).
Statistics
The data from the different treatments were subjected to an analysis of variance (ANOVA). Chi-square test was applied to calculate the difference between groups with 5% level of significance. All of the statistical analyses were performed using SPSS 16.0. The value of p < 0.05 was considered statistically significant. The cell experiments were repeated at least three times. Each experiment included at least triplicate treatments. miRNA and mRNA are expressed as mean ± SD, with three technical replicates for each group.
Results
Cytotoxicity of OTA
In previous in vitro toxicity studies, a concentration that induced 50% cell death (IC50) was often selected to treat cells. 17 According to the results of previous experiments in our lab, after treatment with 25 μM OTA for 24 h, the cell survival rates of HEK 293 and HepG2 were 65% and 73%, respectively, 18,19 which are close to the IC50. So 25 μM OTA for 24 h was selected in our study. What’s more, 25 μM OTA can influence cell signaling pathways and cause preliminary, but not severe, damage, which can reflect the early toxicity of OTA in cells.
Three indicators were detected in our study: cell apoptosis, viability, and Δψm. HEK293 and HepG2 cells were exposed to 25 μM OTA for 24 h; then, Hoechst 33342 was used to detect cell apoptosis. The results indicated that OTA effectively induced apoptosis in both HEK293 and HepG2 (Figure 1(a)). The effects of OTA on cell viability after 24 h exposure were measured with the MTT assay. All of the treatments decreased cell viability. The cell survival rates values of HEK293 and HepG2 in this experiment were 62.2% and 70.4%, respectively. (Figure 1(b)). The treatment markedly decreased the Δψm (Figure 1(c)) to 36.9% and 59.5% in HEK293 and HepG2, respectively.

Detection of cell apoptosis viability and Δψm in KC, KT, GC, and GT groups. OTA induced cell apoptosis (a), reduction of cell viability (b), and Δψm loss (c). Values are means ± SD (n = 3). *p < 0.05:when the treated group is compared with the control group. OTA: ochratoxin A; KC: control group in HEK 293; KT: treated group in HEK 293; GC: control group in HepG2; GT: treated group in HepG2; Δψm: mitochondrial membrane potential.
The miRNA profiling
The miRNA profiling was performed for the four samples, and we acquired 17241302, 18234755, 16937975, and 14682556 reads in HEK293 control, HEK293 treated with OTA, HepG2 control, HepG2 treated with OTA, respectively. Clean reads without the adapters and with high quality were further analyzed. 16
Analysis of small RNA length distribution (Figure 2) indicated that in the HEK293 treated with OTA group, the small RNA reads number peaked at 22 nt and 23 nt; there was nearly an equal number of reads for each of these lengths. However, in the HEK293 control group, the percentage of 23 nt reads was slightly higher than the percentage of 22 nt reads. In HepG2 cell lines, the number peaked at 22 nt. Notably, the 21- to 24-nt RNAs in HepG2 dramatically declined after OTA treatment.

Small RNA length distribution in KC, KT, GC, and GT. The length distribution of small RNA reads percentage in KC (a), KT (b), GC (c), and GT (d). KC: control group in HEK 293; KT: treated group in HEK 293; GC: control group in HepG2; GT: treated group in HepG2.
Clean reads were compared with the Rfam database (ftp://selab.janelia.org/pub/Rfam) to match them with known ribosomal RNA (rRNA), small nuclear RNA, small nucleolar RNA, and transfer RNA (tRNA) sequences (Figure 3). Moreover, mature miRNAs and predicted novel miRNAs were acquired. 16 In the HEK293 cell line, the rRNA levels decreased slightly after OTA treatment, while the miRNA and tRNA levels increased slightly. However, HepG2 exhibited different changes. The rRNA and miRNA levels decreased after exposure to OTA; alterations in HepG2 were much more obvious than those in HEK293. In addition, the tRNA level rose significantly in both the HepG2 treated with OTA and HEK293 treated with OTA groups.
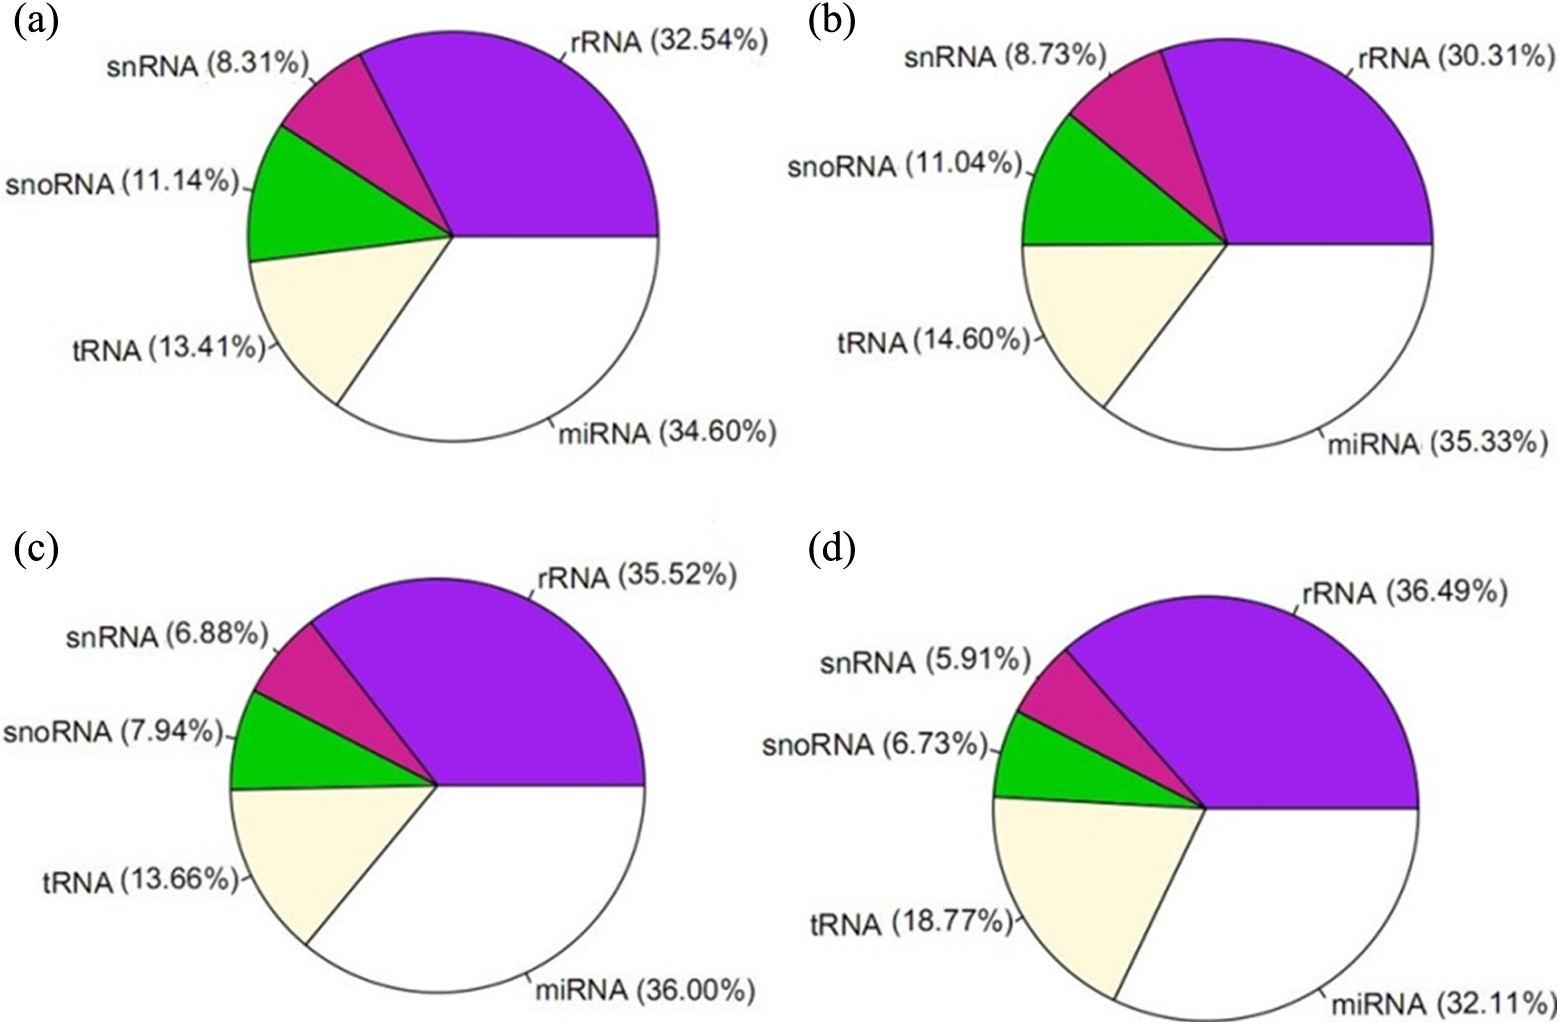
RNA types distribution in KC, KT, GC, and GT. The distribution of RNA types in KC (a), KT (b), GC (c), and GT (d). KC: control group in HEK 293; KT: treated group in HEK 293; GC: control group in HepG2; GT: treated group in HepG2.
The identification of potential novel miRNAs
The miRanda was used to characterize novel miRNAs. 20 Different criteria are used to evaluate whether a small RNA is a genuine miRNA, including the ability to form a stable hairpin structure and the detection of miRNAs. 21 The expression levels of novel miRNAs were tested by RT-PCR. The hairpin structures of novel miRNAs precursors were made by RNAfold Web server (http://rna.tbi.univie.ac.at/cgi-bin/RNAfold.cgi). Using these rules, we identified 12 potential novel miRNAs: m0115-3p, m0006-5p, m0168-5p, m0104-5p, m0019-5p, m0044-5p, m0125-3p, m0147-3p, m0156-5p, m0186-3p, m0120-5p, and m0095-5p. (Figure 4, Supplementary Figure 1, Supplementary Table 3).

The validation of 12 identified novel miRNAs in HEK 293 and HepG2 by PCR. The two left lanes indicate miRNAs, and the right depicts the negative control. miRNA: microRNA; PCR: polymerase chain reaction.
The results showed that m104-5p, m0044-5p, m0125-3p, m0120-5p, and m0095-5p only existed in HEK293 treated with OTA; m0147-3p and m0156-5p were observed in HepG2 control; and m0115-3p was only detected after OTA treatment in HepG2 cell line. It seems that most of the novel miRNAs existed in HEK 293 or the OTA treatment group.
Prediction of identified miRNA targets
We further analyzed the differentially expressed miRNAs. On the condition of a fold change ≥3 and p < 0.05, there were 76 upregulated and 28 downregulated miRNAs in HEK293 and 25 upregulated and 40 downregulated miRNAs in HepG2. The target genes of these differently expressed miRNAs were collected using the comparative platform of miRWalk 22 with six different algorithms, including MiRanda, miRDB, miRWalk, PITA, TargetScan, and RNAhybrid. To minimize the number of putative and false positive targets, a target gene should be predicted by different miRNA-target prediction algorithms. 23 The targets predicted with at least two different programs were considered for further analysis. The predicted target genes were subjected to Kyoto Encyclopedia of Genes and Genomes (KEGG) enrichment analysis individually according to a multiple testing method (st Holm) with 5% significance for selecting significantly overrepresented KEGG pathways.
In HEK293, there were 310,408 putative targets enriched in upregulated miRNAs and 85,513 putative targets enriched in downregulated miRNAs, while in HepG2, there were 84,110 putative targets enriched in upregulated miRNAs and 173,692 putative targets enriched in downregulated miRNAs. In KEGG pathway analysis, 96 pathways were enriched in upregulated miRNAs and 81 pathways were enriched in downregulated miRNAs in HEK293, while in HepG2, 89 pathways were enriched in upregulated miRNAs and 90 pathways were enriched in downregulated miRNAs. A strong overlap was also noted between pathways in each group (Figure 5); eight pathways of the top 10 appeared in each group (Tables 1 and 2). Those were “pathways in cancer,” “endocytosis,” “axon guidance,” “glioma,” “prostate cancer,” “mitogen-activated protein kinases (MAPKs) signaling pathway,” “chronic myeloid leukemia,” and the “neurotrophin signaling pathway.” Based on the KEGG analysis, they may play a significant role in OTA toxicity. Notably, hsa-miR-195-5p, hsa-miR-342-5p, hsa-miR-520g-3p, hsa-miR-524-5p, and hsa-miR-515-5p regulate the greatest number of pathways: 52, 47, 46, 41, and 38, respectively.

Venn diagrams for overlapping KEGG pathways in HEK293 and HepG2 These charts represent pathways in upregulated miRNAs in both HEK293 and HepG2 (a), upregulated miRNAs in HEK293 and downregulated in HepG2 (b), upregulated miRNAs in HEK293 and downregulated in HEK293 (c), downregulated miRNAs in HEK293 and upregulated in HepG2 (d), downregulated miRNAs in HEK293 and downregulated in HepG2 (e), and upregulated miRNAs in HepG2 and downregulated in HepG2 (f). The blue and yellow diagrams represent pathways in upregulated and downregulated miRNAs in HEK293, respectively, and the red and green represent pathways in upregulated and downregulated miRNAs in HepG2, respectively. KEGG: Kyoto Encyclopedia of Genes and Genomes; miRNA: microRNA.
Top 10 significant changed pathways and the number of targeted miRNAs in upregulated group in HEK293 and HepG2 cells.
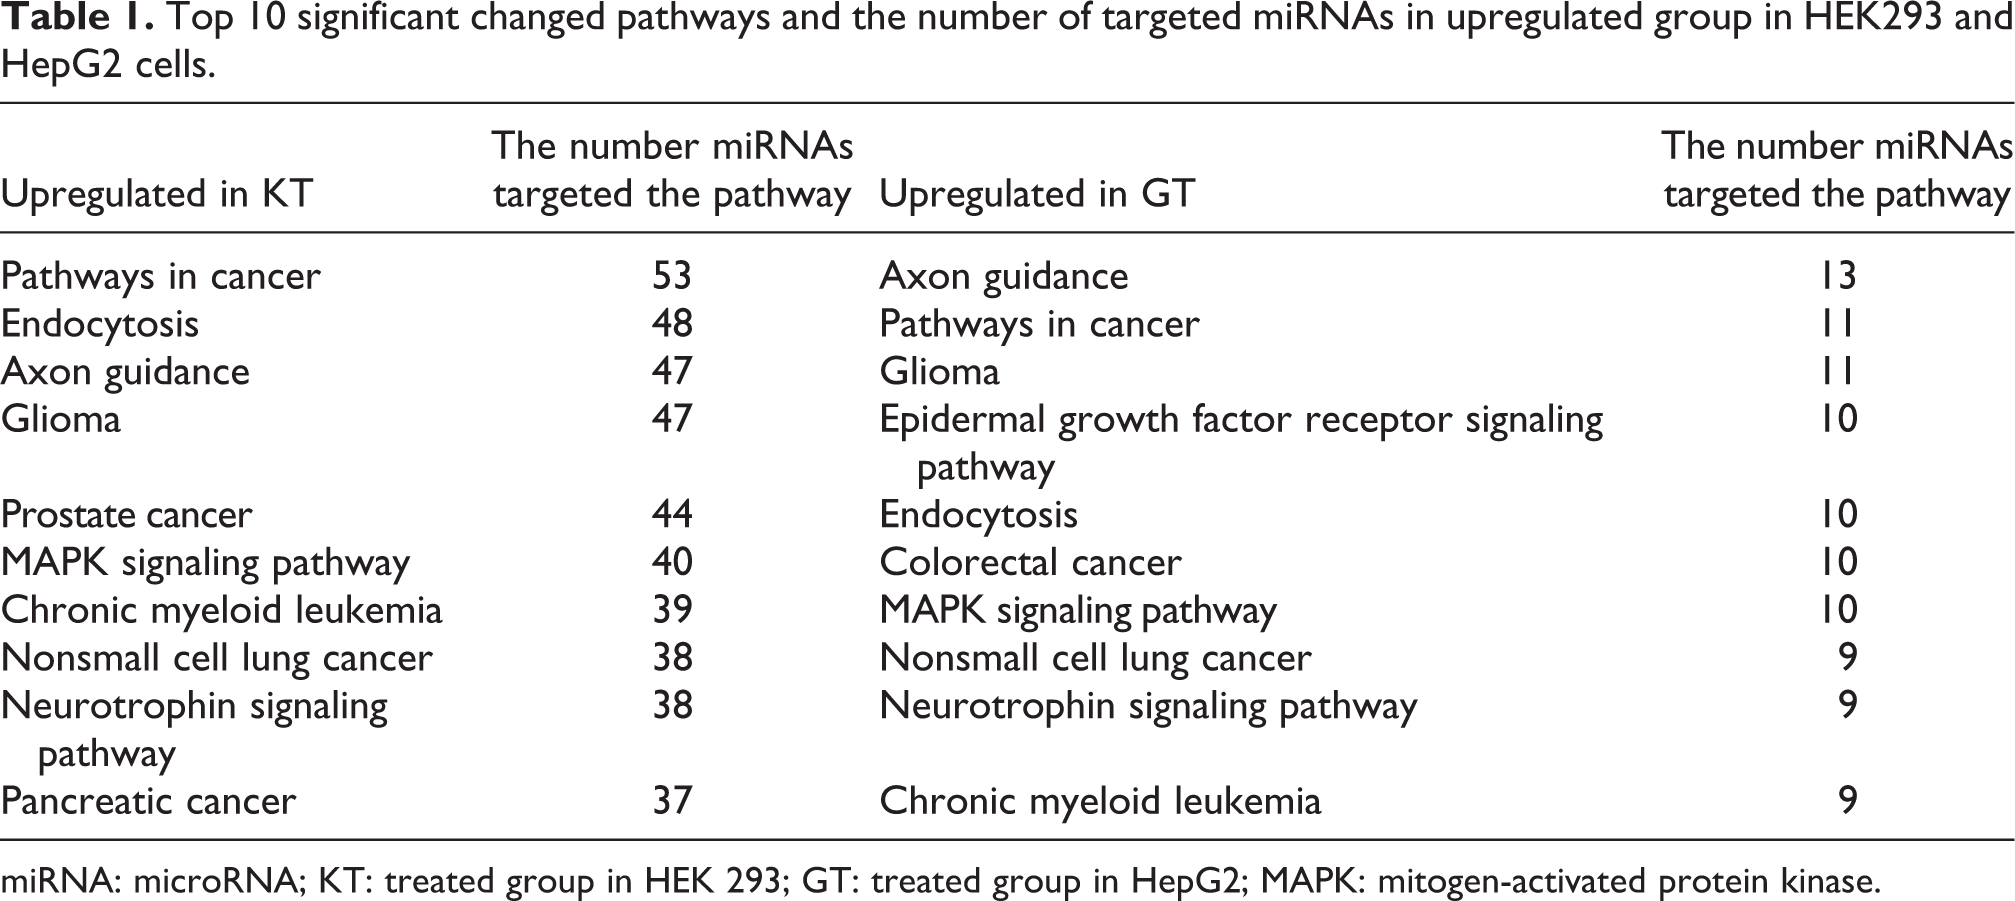
miRNA: microRNA; KT: treated group in HEK 293; GT: treated group in HepG2; MAPK: mitogen-activated protein kinase.
Top 10 significant changed pathways and the number of targeted miRNAs in downregulated group in HEK293 and HepG2 cells.

miRNA: microRNA; KT: treated group in HEK 293; GT: treated group in HepG2; MAPK: mitogen-activated protein kinase.
Damage to miRNA processing and PCR validation
The primary transcripts of miRNAs (pri-miRNAs) are processed in a two-step pathway mediated by two major enzymes, Dicer and Drosha, which belong to the class of RNAseIII endonucleases. 24 Drosha double-stranded RNA (dsRNA)-binding protein DGCR8 initiates cleavage of pri-miRNAs. To explore the damage to miRNA processing, we determined the expression of DGCR8, Drosha, and Dicer1 by RT-PCR.
According to the PCR results, DGCR8, Drosha, and Dicer1 were downregulated in both HEK293 and HepG2 cell lines (Figure 6). The expression levels of Drosha, Dicer1, and DGCR8 were all significantly reduced in HEK293 after OTA administration, while in HepG2, only Dicer1 was significantly reduced. All the primers used in quantitative RT-PCR are listed in Supplementary Table 4.

Expression of Drosha, Dicer1, and DGCR8 mRNA levels in KC, KT, GC, and GT groups by RT-PCR analyses. Expression levels were normalized using β-actin. Values are means ± SD (n = 3). *p < 0.05: when the treated group is compared with the control group. mRNA: messenger RNA; RT-PCR: reverse transcriptase polymerase chain reaction; KC: control group in HEK 293; KT: treated group in HEK 293; GC: control group in HepG2; GT: treated group in HepG2.
To explore the reliability of our sequencing data, four significantly altered miRNAs (miR-125b, miR-122, miR-4289, and miR-378d) were randomly selected and measured by RT-PCR (Figure 7). The RT-PCR results basically corresponded with the sequencing results. In the HEK293 treated with OTA group, both miR-122 and miR-4289 were significantly upregulated, while the expression of miR-125b and miR-378d decreased. Then miR-125b was significantly downregulated in HepG2 treated with OTA. These five miRNAs also showed significant changes in the high-throughput sequencing data. Also miR-122, miR-4289, and miR-378d in HepG2 treated with OTA group were not significantly changed through RT-PCR. However, the changing trends of these four miRNAs in the RT-PCR data agree with the sequencing results. Thus, the sequencing data were considered reliable.

Expression of miR-125b, miR-122, miR-4289, and miR-378d in KC, KT, GC, and GT groups by RT-PCR analyses. Expression levels were normalized using 5 s. Values are means ± SD (n = 3). *p < 0.05: when the treated group is compared with the control group. RT-PCR: reverse transcriptase polymerase chain reaction; KC: control group in HEK 293; KT: treated group in HEK 293; GC: control group in HepG2; GT: treated group in HepG2.
miRNAs with common and different expression trends in the two cell lines
Based on the fold changes >3 (p < 0.05), nine miRNAs showed common expression trends after OTA treatment in the two cell lines (Table 3). Also miR-184, miR-122-5p, miR-512-3p, and miR-1 were increased in HEK293 treated with OTA and HepG2 treated with OTA, while miR-125b-5p, miR-3529-3p, miR-92a-1-5p, mir-151a-5p, and miR-365a-5p were decreased simultaneously. Moreover, the increased miRNAs were upregulated much more in HEK293 than in HepG2. Interestingly, the decreased miRNAs were downregulated much more in HepG2 than in HEK293.
miRNAs with common expressed trends in HEK293 and HepG2 cells.

miRNA: microRNA.
We also analyzed the differentially deregulated miRNAs and found 15 miRNAs with opposite trends (fold change >3) in both cell lines. In addition, 15 miRNAs were significantly deregulated (fold change >3) in only one group, while they were expressed stably (fold change <1.5) in another group (Tables 4 and 5).
miRNAs with opposite trends in HEK 293 and HepG2 cells.

miRNA: microRNA.
miRNAs with only significantly changed in one group in HEK 293 and HepG2 cells.

miRNA: microRNA.
Then, collective KEGG enrichment analysis was performed with these nine commonly expressed miRNAs group (CEG) and 30 differentially expressed miRNAs group (DEG). Thirty-two pathways were identified. Selecting the pathway target with more than 5 miRNAs in CEG and 15 miRNA in DEG (≥50% of each group), we found that 10 pathways overlapped between CEG and DEG (Table 6). Only two of these 12 pathways are different in each group. The effect of the “ErbB signaling pathway” and the “calcium signaling pathway” are more obvious in CEG, while “renal cell carcinoma” and “colorectal cancer” are dramatically deregulated in DEG.
Top 12 significantly changed pathways and the number of targeted miRNAs in CEG and DEG.

miRNA: microRNA; CEG: commonly expressed miRNAs group; DEG: differently expressed miRNAs group; MAPK: mitogen-activated protein kinase.
Discussion
OTA mediates the induction of DNA damage, cytotoxicity, and apoptosis in cells. 25 Our study showed that OTA induce the cytotoxicity in HEK293 and HepG2 cells. After treatment with 25 μM OTA for 24 h, cell apoptosis, viability, and Δψm of HEK 293 and HepG2 were decreased significantly. It may be due to the increase in reactive oxygen species, inhibition of protein synthesis, and induction of stress response in cells. 26,27 Mounting studies indicate that miRNAs play a fundamental role in tumorigenesis, controlling cell proliferation, and apoptosis. 28 miRNAs can repress target genes expression and affect cell death. 29 Analysis of small RNA length distribution and validation of miR-125b, miR-122, miR-4289, and miR-378d ensure the reliability of sequencing data. OTA induced deregulation of a mass of miRNAs in HEK293 and HepG2, which indicated that miRNAs play an important role in OTA toxicity.
The differences and similarities between the two cell lines after OTA treatment through miRNA processing and pathway analysis
Although many studies have been performed on the nephrotoxicity and hepatotoxicity of OTA, studying the miRNA expression pattern in cell lines after OTA treatment will suggest a more comprehensive understanding of OTA toxicity. Our study showed that Dicer1, Drosha, and DGCR8 were all downregulated in HEK293 and HepG2 cell lines treated with OTA, which indicates that miRNA biogenesis processes have been hampered by OTA. Impaired miRNA processing may enhance cellular transformation and tumorigenesis. 30 Dicer1, Drosha, and DGCR8 were all significantly downregulated in HEK293 treated with OTA, while only DGCR8 was significantly downregulated in HepG2 treated with OTA. It seems that these key regulators of miRNA maturation process in HEK293 are more sensitive to OTA than that of HepG2. Stachurska et al. reported that DGCR8 was increased in cells stimulated with OTA. 27 It is possibly due to the different responses to OTA in different cells. Schaaf et al. also investigated OTA-mediated oxidative stress response by primary rat PT cells and LLC-PK1 cells. Some differences existed between the two cells. 31
Pathways in cancer, endocytosis, axon guidance, and the MAPK signaling pathway were the most significantly enriched pathways in both OTA-treated cell lines. In Dai’s research, MAPK signaling pathway was also enriched in rat kidney miRNAs. 16 Specifically, 40 upregulated miRNAs in HEK293 and 25 downregulated in HepG2 were related to the MAPK signaling pathway. MAPK pathways are known to play important roles in cell survival, antiapoptotic activity, and renal cancer development. 32 It has been reported that OTA can stimulate two members of the MAPK family, ERK1 and ERK2, in MDCK-C7 cells. 33 The MAPK pathway is found to be activated during OTA-induced cell proliferation. 34 In addition, activation of members of the MAP kinase family have been known to mediate the death of several cell types, including neuronal cells. 35 Through MAPK activation, stimulations of intracellular calcium signaling and cyclic adenosine monophosphate response element binding protein phosphorylation are related with neurotrophin signaling. 36 Interestingly, the neurotrophin signaling pathway also ranks highly in our study, which has been noted before. Previous studies in vivo indicate that OTA is a neurotoxicant during prenatal stages. Some results suggest that OTA specifically affects neurite formation in the neuronal retinas of Tetra SL chickens. 37 It seems that there is a connection between MAPK and the neurotrophin signaling pathway in the toxicity mechanism of OTA. It is difficult to ascertain the difference through KEGG analysis because the most enriched pathways in deregulated miRNAs were very similar, therefore it is hard to ascertain the difference between two cell lines. So we try to compare the two cell lines treated with OTA through CEG and DEG.
The connection between the two cell lines after OTA treatment through modulated miRNAs
We selected 9 CEG and 30 DEG to seek relationships between HepG2 and HEK 293 based on miRNA expression patterns, which indicated a common or specific toxicological mechanism of OTA in both cell lines. We found that many miRNAs in the CEG are related to signal transduction pathway. For example, miR-184 is remarkably increased in the two cell lines treated with OTA groups. The survival markers c-Myc was decreased significantly in our study. c-Myc was downregulated by miR-184 in previous study 38 (Supplementary Figure 1). Inducible expression of activated mitogen-activated/extracellular response kinase kinase (MEKK), which will selectively regulate apoptotic signal transduction pathways 39 can stimulate the transactivation of c-Myc. So miR-184 may be involved in the apoptotic signal transduction pathway through c-Myc. We also found that miR-1 may involve in the vascular endothelial growth factor signaling pathway through level histone deacetylase 4 (HDAC4). 40 –42 It was increased sharply in the HEK293 treated with OTA and HepG2 treated with OTA group.
However, in the DEG, we found that the deregulated miRNAs are more relevant to human cancer. For example, miR-7-5p was significantly increased in group HEK293 treated with OTA, but it nearly did not change in HepG2 treated with OTA. miR-7 has been shown to impair the Akt pathway which is overactive in many cancers, resulting in reduced apoptosis and driving tumor progression. 43 miR-520e was upregulated in HEK293 treated with OTA and stayed stably in group HepG2 treated with OTA. CD46 is positively correlated with the degree of differentiation and tumor. 21 miR-520b may play a role in human cancer pathways through CD46, which is one of the target genes of miR-520b and decreased in our study (Supplementary Figure 1). Moreover, miR-200c also increased in renal proximal tubular epithelial cells after the treatment with OTA. 27 The dysregulation of miR-200c expression occurs in multiple types of cancer cells and is linked to tumor occurrence and development. 44
Interestingly, we found that signal transduction pathway made up the largest part in CEG, and most of the deregulated pathways in DEG were related to human cancer. The mechanisms of pathways are complicated. 45 Many miRNAs and targets may involve the same pathway, and one miRNA can regulate a number of pathways. It was also mentioned in previous study on miRNAs and pathways. 46 Therefore, we cannot effectively distinguish the OTA toxicity in HEK 293 from HepG2 through DEG.
Differences and similarities between in vivo and in vitro models
It is of outstanding importance to investigate the similarities and differences between in vitro and in vivo models. All the sequencing data and RT-PCR results of Dicer, Drosha, and DGCR8 in vivo have been published on BMC Genomics 47 . The in vivo experiment found that MAPK pathway is critical in nephrotoxicity induced by OTA in rats. As our preliminary research have described the toxicological mechanism of OTA-induced nephrotoxicity and hepatoxicity in rats via miRNA profiling 47,48 (Supplementary Tables 1 and 2), we want to further study how OTA affects human cell lines. The comparative analysis of the regulated miRNAs, the classification of regulated pathways, and the comparison of the damage to miRNA processing are novel in this in vitro study.
From the perspective of miRNA processing, the trend in change of the gene expression related to miRNA processing, namely, Dicer1, Drosha, DGCR8, are consistent with the results in vitro. The gene expressions are more markedly influenced in vitro. In both in vitro and in vivo treatment groups, except the liver mid-dose group, Dicer1 decreased significantly. However, Drosha and DGCR8 were decreased only in kidney high-dose group, liver high-dose group, HepG2 treated with OTA, and HEK293 treated with OTA, respectively. Our data show that the decrease seemed more prominent in the cell culture. Some evidence supports the claim that the kidney is the major target of OTA. Notably, the genes related to miRNA processing changed much more in kidney cells.
Moreover, the study shows that more miRNAs are modulated in vivo compared with the in vitro models possibly due to the complexity of body system, which is similar to previous research. Soukas compared the patterns of gene expression in preadipocytes and adipocytes in vitro and in vivo. 49 They found a greater number of uncharacterized gene regulatory events are activated during adipocyte differentiation in vitro. In addition, the gene expression changes associated with adipocyte development in vivo and in vitro, while overlapping, are in some respects quite different. These data further suggest that one or more transcriptional programs are activated exclusively in vivo.
Viewed from the expression of modulated miRNAs, we found that the correlation between the in vivo and in vitro models was relatively poor. Selecting the miRNAs with ≥3-fold change, we found that only miR-92a-3p and miR-378b exist in both hepatocytes and the liver or in kidney cells and the kidney. miR-92a-3p was significantly upregulated in HepG2 and increased in both the liver mid-dose group and liver high-dose group. miR-92a is known to control angiogenesis in in vitro models rather than only affecting the proliferation of hepatoma cells. 50,51 miR-378b declines significantly both in the HEK293 treated with OTA and kidney high-dose group groups. The expression of miR-378 enhances cell survival and promotes tumor growth and angiogenesis. 52 Overexpression of miR-378 decreased p53, a well-known tumor suppressor that controls cell cycle checkpoints, apoptosis, and DNA repair. 53 p53 Activation inhibited apoptosis induction in Vero monkey kidney epithelial cells and in HEK293 in response to OTA exposure. Eva Rached et al. found the expression of putative marker genes in rat kidney but no significant increase in NRK-52E cells after exposure to OTA. 54 The difference between two models may be due to the lack of non-parenchymal cells. The kidney and liver consist of a great variety of different cell types. Some miRNAs may be specifically expressed or deregulated in renal or liver tissue samples but not in HEK293 or HepG2 cell lines. Many factors are critical determinants in the response to a toxic compound. The interactions of target cells with surrounding cells, matrix components, extracellular factors, and toxicokinetics may not be adequately reflected by cell culture models. 54 Moreover, species differences may also affect the results. 55 In addition, more novel miRNAs were found in the HEK293 treated with OTA group.
However, In the KEGG pathway analysis, the results of the in vivo model were similar to the results in vitro. However, in vivo signal transduction and genetic information processing are more common compared with in vitro model. In contrast to the in vivo model, cultured cells sometimes show weak special transport capacities and oxidative metabolism. 44 In addition, pathways related to cellular processes were more common in the kidney, 16 while pathways related to organismal systems were more common in the liver. 48 Most of the enriched pathways are overlapped after classification; most pathways are related to human cancer and signal transduction. Previous research also showed the similarity of pathways in different systems. Kienhuis et al. performed gene expression profiling on human hepatocytes treated with coumarin by toxicogenomics-based parallelogram approach. 56 The results were compared to a previously performed coumarin in vivo and in vitro rat toxicogenomics study. In all three systems, coumarin affected genes involved in the blood coagulation pathway.
Conclusion
This is the first comparative study to reveal the damage caused by OTA to HEK 293 and HepG2 cells through deregulated miRNAs. Although the complete replacement of animal studies is not feasible at present, cell culture models are useful tools to predict in vivo damage. This study is consultative and can be reference for in vitro studies. According to KEGG analysis, in the two kinds of cells, CEGs are mostly related to signal transduction pathways, and DEGs are mostly related to human cancer pathways. It provides a better understanding of OTA toxicity. Further studies are required to clarify the mechanisms of OTA and verify the targets of miRNAs in DEG and CEG.
Footnotes
Declaration of Conflicting Interests
The author(s) declared no potential conflicts of interest with respect to the research, authorship, and/or publication of this article.
Funding
The author(s) disclosed receipt of the following financial support for the research, authorship, and/or publication of this article: This work was funded by the Fundamental Research Funds for the Central Universities (grant nos 2012QJ151 and 2013QJ036).