
Abstract
In recent years, andrographolide sodium bisulfite (ASB) has been reported to cause acute renal failure frequently in clinical practice. We hypothesized that changes in metabolic profile could have occurred after administration of ASB. To investigate the metabolic changes caused by ASB-induced nephrotoxicity, metabonomics method was utilized to depict the urine metabolic characteristics and find the specific urine biomarkers associated with ASB-induced nephrotoxicity. Sprague-Dawley rats were randomly assigned into three experimental groups. They received a single daily injection of vehicle (0.9% sodium chloride solution) or ASB at a dose of 100 or 600 mg kg−1 day−1 for 7 days. Twelve-hour urine was collected after the last administration. The routine urinalysis was measured by a urine automatic analyzer while urinary metabolites were evaluated using gas chromatography/mass spectrometry. The acquired data were processed by multivariate principal component analysis (PCA), partial least squares discriminant analysis (PLS-DA), and orthogonal PLS-DA. After 7-day administration of ASB, the positive urine samples in protein, occult blood, and ketones were increased, presenting dose dependence. The PCA and PLS-DA models were capable of distinguishing the difference between ASB-treated group and control. Biomarkers such as 1,5-anhydroglucitol,
Introduction
Andrographolide sodium bisulfite (ASB, C20H29O7SNa, 436.23) is a water-soluble sulfonate of andrographolide (C20H30O5) that is synthesized by an addition reaction with sodium bisulfite. ASB has been widely used as an injection formulation, Lianbizhi (LBZ) injection, which contains ASB as its sole component, for the treatment of infectious diseases such as bacillary dysentery, mumps, laryngitis, tonsillitis, and upper respiratory tract infections in China for several decades. In recent years, some literatures reported that ASB also can be used to treat malignant tumor. 1,2 However, with the expansive use of LBZ in clinic, adverse drug reactions, acute renal failure especially, are reported more frequently, 1 –5 leading to the issue of a drug use warning from the State Food and Drug Administration of China. 6
We previously used purified ASB (>99% pure) to investigate its toxicity in mice. 7 After a 7-day administration, ASB (1000 mg kg−1) treated mice exhibited an increase in both the serum creatinine and blood urea nitrogen levels. Moreover, microscopic examination revealed the presence of tubular interstitial injury and cloudy swelling in the proximal tubule. The subsequent proteomics method showed six differential proteins after exposure to ASB, two of which were involved in stress response, including heat shock cognate 71 kDa protein (HSC70) and peroxiredoxin-6. The remaining four proteins were involved in cellular energy metabolism, including isoforms of methylmalonyl-coenzyme A mutase, nucleoside diphosphate-linked moiety X motif 19, mitochondrial nicotinamide adenine dinucleotide dehydrogenase 1 alpha subcomplex subunit 10, and nucleoside diphosphate kinase B. 8 Furthermore, ASB induced high levels of reactive oxygen species generation in human kidney 2 cells, activated c-Jun amino-terminal kinases signaling, induced cell apoptosis via the caspase-dependent mitochondrial pathway, and contributed to cellular autophagy by upregulating Beclin-1 expression. 9 However, little research has been done on the metabonomics of ASB.
Metabonomics, as an important component of systems biology, attempts to comprehensively analyze small molecule metabolites and their changes in biological samples. 10 It has the ability to rapidly distinguish toxicity group from normal group, and can be used to identify early toxicity biomarkers that are specific indicators of damage to a particular organ. It has been successfully applied to many studies of endogenous metabolic changes caused by drug toxicity. 11 –14
In this article, we studied the toxic effects of ASB on the metabolic profiles of rat urine using a metabonomics approach based on gas chromatography/mass spectrometry (GC/MS) with pattern recognition method.
Materials and methods
Animals and treatment
Twenty-four male Sprague-Dawley (SD) rats (approximately 180–220 g) bred in the animal house of Zhejiang Experimental Animal Center were used for the experiment. All animals were housed in standard animal cages with regulated temperature (approximately 22–24°C), relative humidity ( approximately 60–80%), and 12 h light/12 h dark cycle. Food and tap water were provided ad libitum. All experiments were carried out according to the guidelines of China for the care and use of laboratory animals. Each of the rats was randomly assigned to one of three experimental groups (each n = 8), namely, high-dose ASB (600 mg kg−1), low-dose ASB (100 mg kg−1), and a control group. The ASB groups were induced with daily tail intravenous injections of 10 mL kg−1 body weight of ASB (99%, Zhejiang Jiuxu Pharmaceutical Co., Ltd, China) in a 0.9% sodium chloride (NaCl) injection solution (Huadong Pharmaceutical Co., Ltd, Hangzhou, China) for 7 days. The control group received an equal volume of 0.9% NaCl injection solution.
Collection and preparation of urine sample
Urine samples were collected for 12 h after the last administration and urine volume was recorded. Before collection of urine, we weighed the body of rats. Kidneys were obtained and weighed after urine collection. The kidney coefficient was then obtained from the equation: kidney coefficient (mg/g) = kidney weight (mg)/body weight (g). A part of the urine samples were used for routine urinalysis and the other part were stored at −80°C for GC/MS analysis. Prior to the GC/MS analysis, 100 μL urine samples were mixed in 10 μL urease (160 mg mL−1 in water; Sigma type III enzyme, St Louis, Missouri, USA) and incubated for 60 min at 37°C, and then 0.35 mL methanol–chloroform solution (v/v = 3/1) and 50 μL L−1 2-chlorophenylalanine (0.2 mg mL−1 stock in distilled water, Hengbai Biotech, Shanghai, China) were added as an internal standard and vortexed for 10 s. Urine samples were then centrifuged at 12,000 r min−1 for 10 min at 4°C. Then, 0.35 mL supernatant was removed to a fresh 2 mL GC/MS glass vial and dried in vacuum. The dried extract was derived using the pyridine solution of methoxyl amine (80 μL, 20 mg mL−1) at 37°C for 2 h and N,O-bistrifluoroacetamide (10 μL; 1% Trimethylchlorosilane (TMCS), v/v; Regis Technologies, Inc., Morton Grove, USA) at 70°C for 1 h. GC/MS analysis was performed when the temperatures got down to the room temperature.
GC/MS analysis of urine samples
GC/time-of-flight MS (TOF MS) analysis was performed using an Agilent 7890A GC system (Agilent Technologies, Wilmington, Delaware, USA) coupled with a Pegasus 4D TOF MS(LECO Chroma TOF Pegasus 4D, LECO, St. Joseph, Michigan, USA). The system utilized a DB-5MS capillary column coated with 5% diphenyl cross-linked with 95% dimethylpolysiloxane (30 m × 250 μm inner diameter, 0.25 μm film thickness; J&W Scientific, Folsom, California, USA). A 1 μL aliquot of the analyte was injected in splitless mode. Helium was used as the carrier gas, the front inlet purge flow was 3 mL min−1, and the gas flow rate through the column was 1 mL min−1. The initial temperature was kept at 80°C for 0.2 min, then raised to 180°C at a rate of 5°C min−1, then to 220°C at a rate of 4°C min−1, and finally to 285°C at a rate of 20°C min−1 for 10 min. The injection, transfer line, and ion source temperatures were 280, 270, and 220°C, respectively. The energy was −70 eV in electron impact mode. The MS data were acquired in full-scan mode with the m/z range of 20–600 at a rate of 100 spectra per second after a solvent delay of 492 s.
Routine urinalysis
Qualitative examination of urine was performed by a urine analyzer (AU-4290, Arkray, Japan), including urine specific gravity (SG), pH, white blood cell (WBC), nitrite (NIT), urine protein (PRO), glucose (GLU), ketones (KET), urobilinogen (URO), bilirubin (BIL), and urine occult blood (BLD).
Data analysis
All values are expressed as mean ± standard deviation and SPSS data analysis software Version 19 was used for data processing. Statistical analysis was performed using student’s t test. p Values less than 0.05 were considered significant.
For GC/MS, Chroma TOF4.3X software of LECO Corporation and LECO-Fiehn Rtx5 database were used for raw peaks extracting, data baselines filtering, and calibration of the baseline, peak alignment, deconvolution analysis, peak identification, and integration of the peak area. 15 Missing values of raw data were filled up by half of the minimum value, and then 582 peaks were detected and 571 metabolites could be left through interquartile range deionizing method. In addition, internal standard normalization method was employed in this data analysis. The resulted three-dimensional data involving the peak number, sample name, and normalized peak area were fed to SIMCA-P 13.0 software package (Umetrics, Umea, Sweden) for principal component analysis (PCA), partial least squares discriminant analysis (PLS-DA), and orthogonal PLS-DA (OPLS-DA).
Results
Body weight, kidney coefficient, and urine volume changes in the ASB-treated rats
After a 7-day administration of ASB, obvious differences in body weight were observed in ASB (100 mg kg−1) or ASB (600 mg kg−1)-exposed groups (Figure 1(a)). ASB-treated rats exhibited a significant decrease in body weight (p < 0.01 for 600 mg kg−1 and p < 0.05 for 100 mg kg−1) compared with the control. The kidney coefficients were significantly increased in ASB (600 mg kg−1)-exposed group compared with the control (p < 0.01, Figure 1(b)). ASB also caused an obvious increase in 12 h urine volume after the last administration compared with the control, however, there was no significant difference (Figure 1(c)).
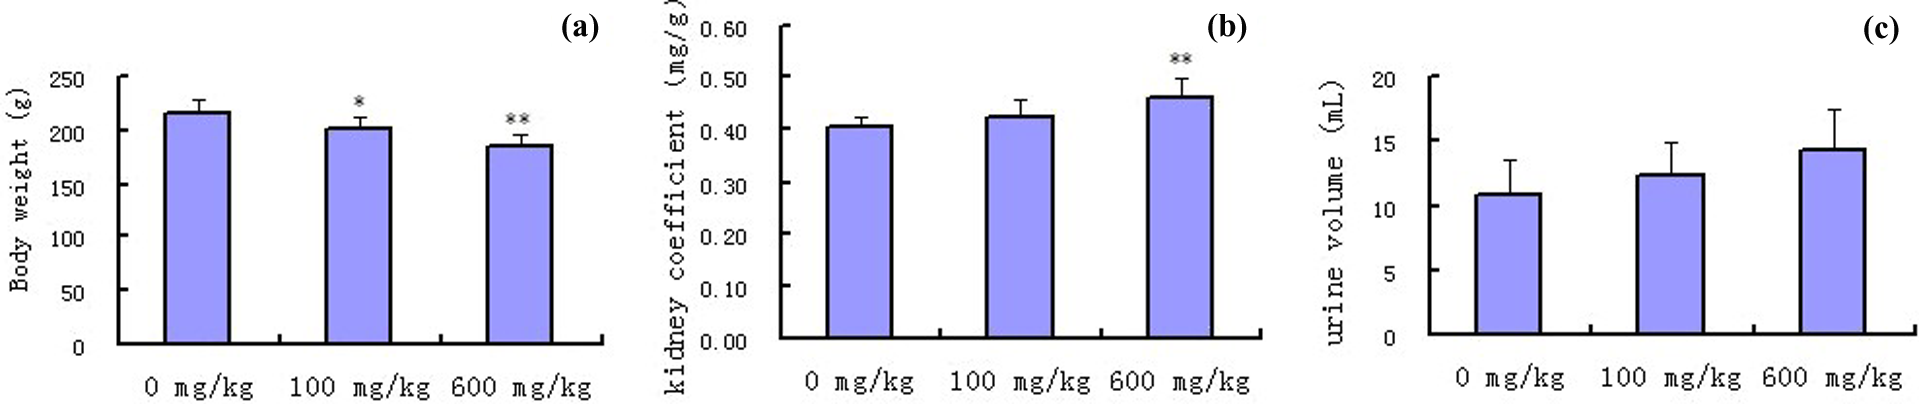
Effects of ASB on body weight (a), kidney coefficient (b), and urine volume (c) of rats (n = 8). *p < 0.05: compared with control; **p < 0.01: compared with control. ASB: andrographolide sodium bisulfite.
Urinalysis
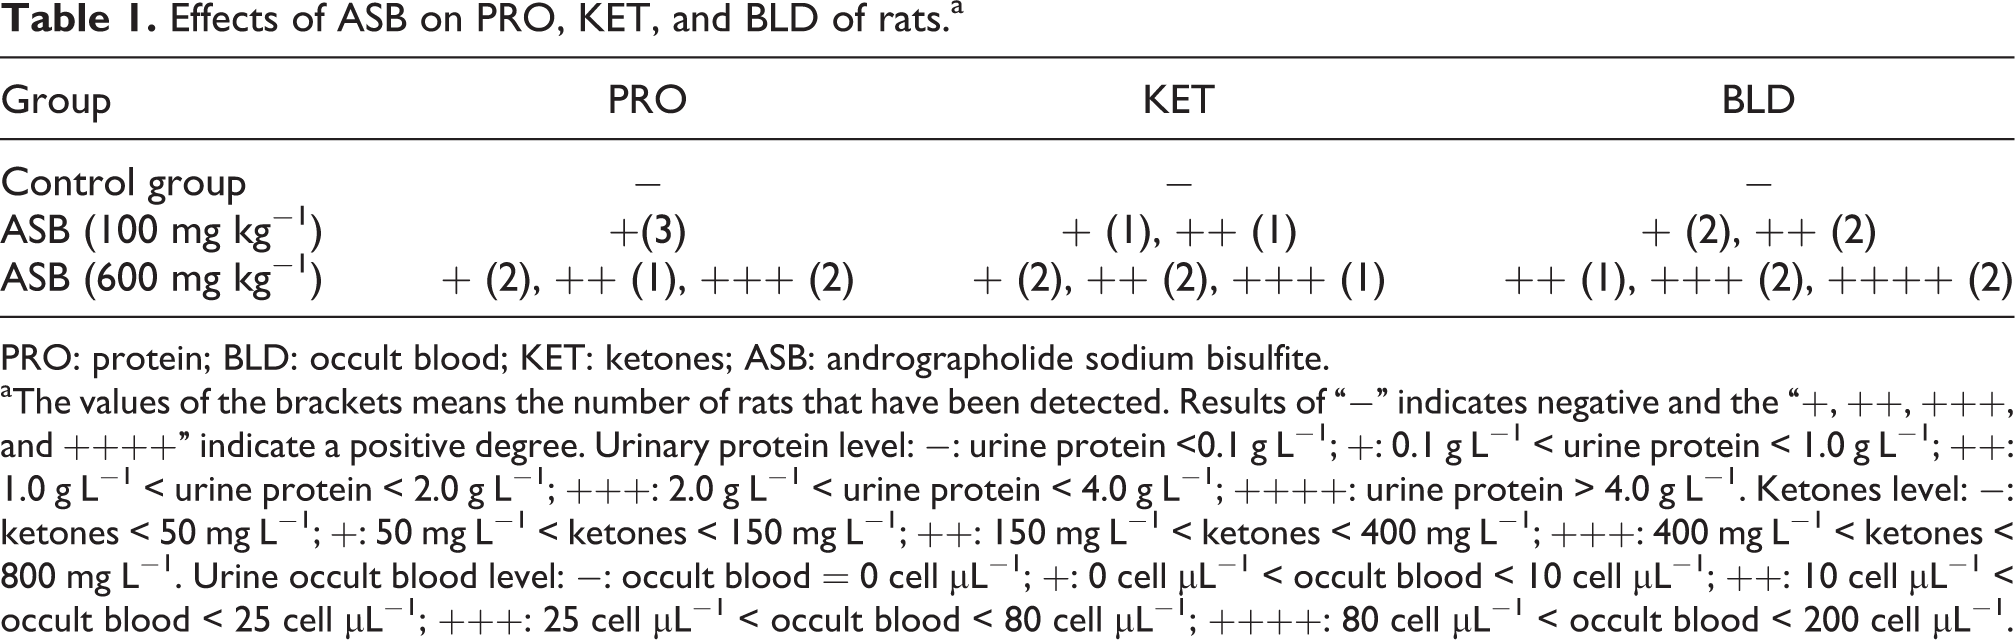
Urine SG, pH, WBC, NIT, GLU, URO, and BIL were unaltered in urine after 7-day administration of ASB (100 mg kg−1) or ASB (600 mg kg−1) compared with control rats. However, PRO, KET, and BLD changed in several rats after 7-day administration of ASB (100 mg kg−1) or ASB (600 mg kg−1; Table 1). These data indicated that the exposure to ASB may result in impairment of the function of the rat kidney.
Effects of ASB on PRO, KET, and BLD of rats.a
PRO: protein; BLD: occult blood; KET: ketones; ASB: andrographolide sodium bisulfite.
aThe values of the brackets means the number of rats that have been detected. Results of “−” indicates negative and the “+, ++, +++, and ++++” indicate a positive degree. Urinary protein level: −: urine protein <0.1 g L−1; +: 0.1 g L−1 < urine protein < 1.0 g L−1; ++: 1.0 g L−1 < urine protein < 2.0 g L−1; +++: 2.0 g L−1 < urine protein < 4.0 g L−1; ++++: urine protein > 4.0 g L−1. Ketones level: −: ketones < 50 mg L−1; +: 50 mg L−1 < ketones < 150 mg L−1; ++: 150 mg L−1 < ketones < 400 mg L−1; +++: 400 mg L−1 < ketones < 800 mg L−1. Urine occult blood level: −: occult blood = 0 cell μL−1; +: 0 cell μL−1 < occult blood < 10 cell μL−1; ++: 10 cell μL−1 < occult blood < 25 cell μL−1; +++: 25 cell μL−1 < occult blood < 80 cell μL−1; ++++: 80 cell μL−1 < occult blood < 200 cell μL−1.
Multivariate data analysis
The total ion chromatographic chromatogram (Figure 2(a)) of urine of ASB-treated rats did not show obvious difference in comparison with the control group. In order to have a comprehensive view of the metabonome, pattern recognition method was used in the subsequent data analysis by SIMCA-P, a statistics software package.
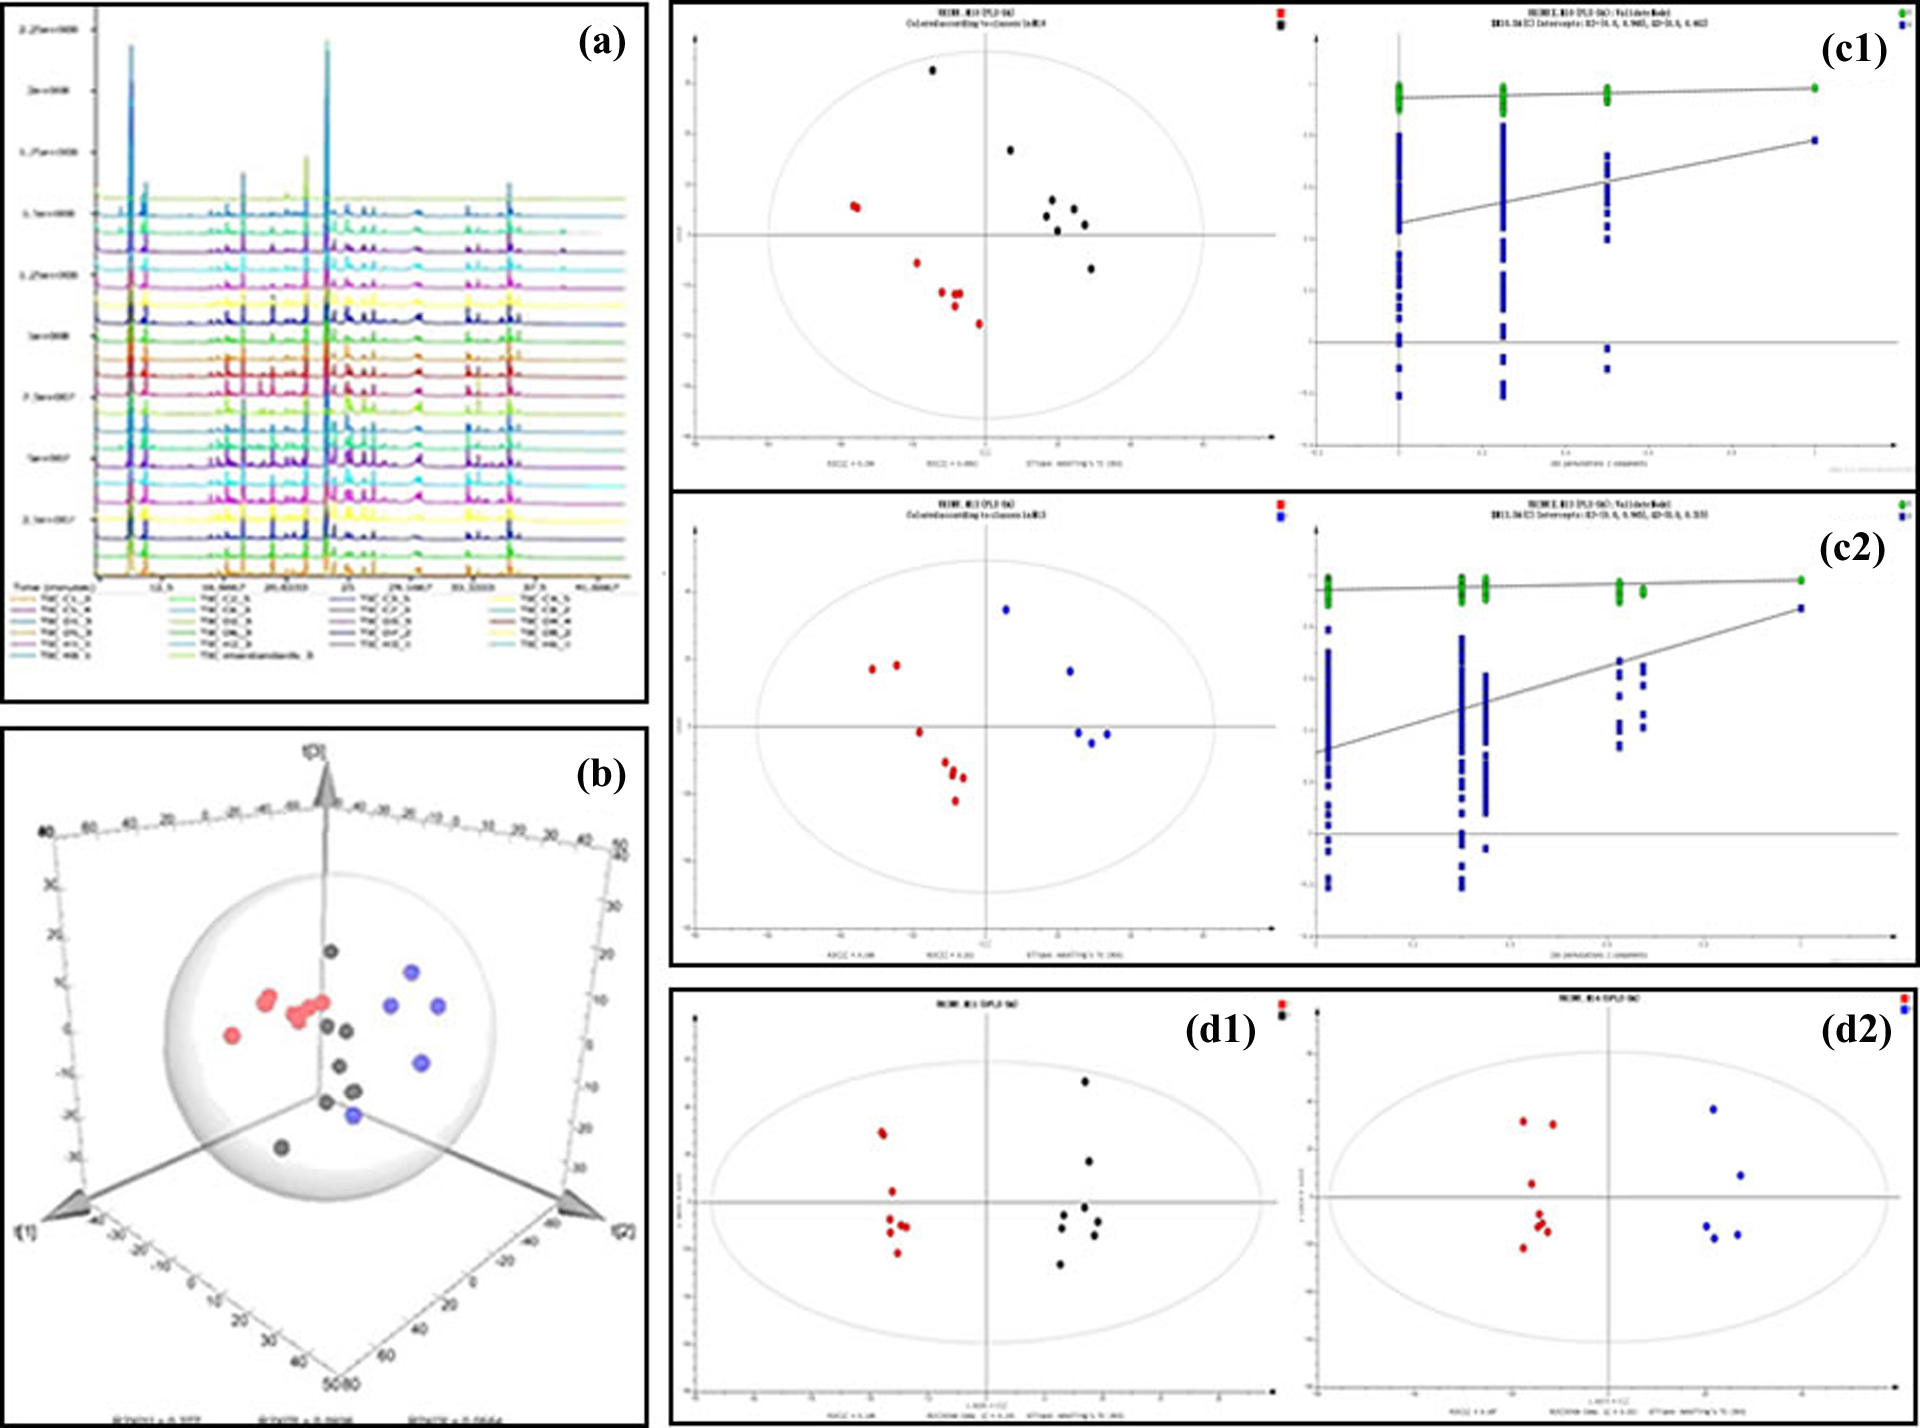
(a) TIC of urine of rats by GC/MS. (b) 3D-PCA score plot of GC/MS spectral data of urine samples obtained from ASB 600 mg/kg group (blue), 100 mg kg−1 group (black), and control group (red). (c) Scores plot of PLS-DA analysis of urine samples obtained from ASB 100 mg kg−1 group (black) and control group (red). Two hundred permutations were performed, and the resulting R 2 (green triangle) and Q 2 (blue square) values were plotted. The green line represents the regression line for R 2 and the blue line for Q 2. (c) Scores plot of PLS-DA analysis of urine samples obtained from ASB 600 mg kg−1 group (blue) and control group (red). Two hundred permutations were performed, and the resulting R 2 (green triangle) and Q 2 (blue square) values were plotted. The green line represents the regression line for R 2 and the blue line for Q 2. (d) Metabolic profile was depicted by OPLS-DA sores plot of GC/MS spectral data from urine samples of ASB 100 mg kg−1 group (black) and control group (red). (d) Metabolic profile was depicted by OPLS-DA scores plot of GC/MS spectral data from urine samples of ASB 600 mg kg−1 group (blue) and control group (red). TIC: total ion chromatography; GC/MS: gas chromatography/mass spectrometry; PCA: principal component analysis; ASB: andrographolide sodium bisulfite; PLS-DA: partial least squares discriminant analysis; OPLS-DA: orthogonal partial least squares discriminant analysis.
The data matrix was imported into SIMC-P to multivariate statistical analysis in order to visualize clusters and to detect the metabolites that are able to differentiate ASB injected rats from controls. Metabolite fingerprinting of samples using GC/MS followed by unsupervised PCA, which was a chemometrics model that reduces the matrix of the data to the lowest dimensions of the most significant factors, showed clear separation between ASB-treated and control groups by 3D-PCA score plots (Figure 2(b)), which indicated that urinary biochemical changes had occurred in the ASB-treated rats.
In order to obtain a higher level of group separation and get a better understanding of variables responsible for classification, a supervised PLS-DA was applied. The PLS-DA score plot could be readily divided into two clusters, which indicated that urine metabolic pattern significantly changed after the treatment of ASB (Figure 2(c1) and (c2)). The performance parameters of R 2(x) = 0.384, R 2(y) = 0.985, and Q 2 = 0.784 > 0.5 for ASB 100 mg kg−1 group and control group, and R 2(x) = 0.42, R 2(y) = 0.983, and Q 2 = 0.873 > 0.5 for ASB 600 mg kg−1 group and control group, respectively, suggested that the model was reliable and highly predictive.
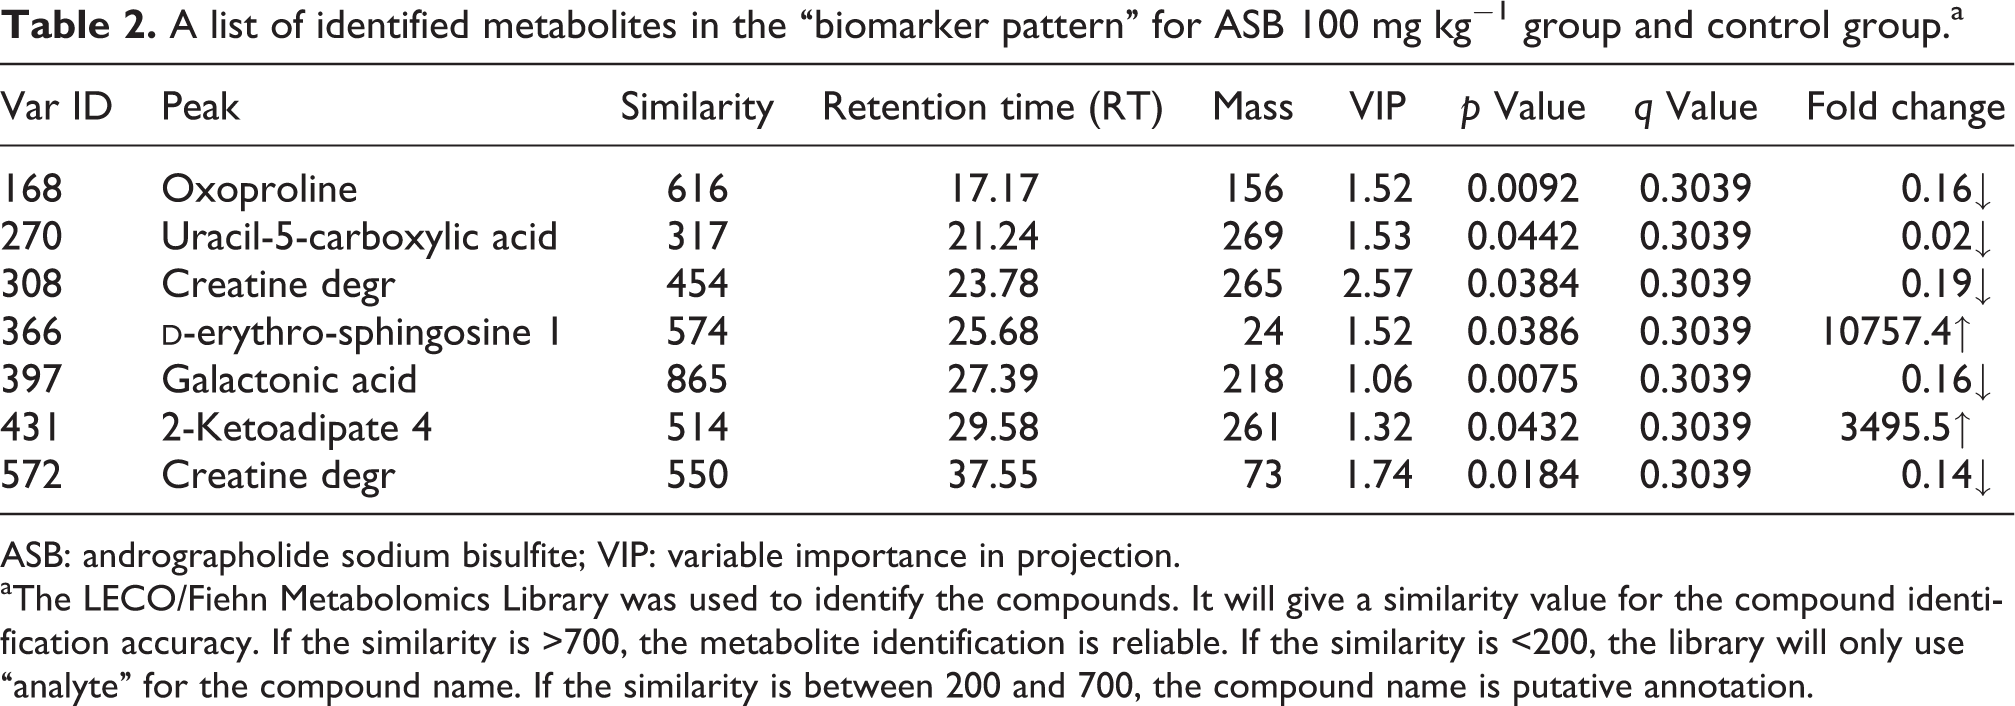
The OPLS-DA was then used to isolate the variables responsible for differences among the various groups. As shown in Figure 2(d1) and (d2), the data depicted a clear separation between ASB-treated and control groups. The OPLS-DA score plot revealed high predictability of the OPLS-DA model with high statistical values of Q 2 = 0.616 and 0.783, respectively. We then identified seven marker metabolites with variable importance in projection >1 and Student’s t test (p < 0.05), which differentiated 100 mg kg−1 ASB-treated group from control group, as shown in Table 2. Four metabolites were found to contribute to the differentiation between 600 mg kg−1 ASB-treated group and control group, as shown in Table 3. Identification of metabolites was performed using the LECO/Fiehn database by comparing their MS spectra and retention time. Marker metabolites were interpreted with available biochemical databases, such as Kyoto Encyclopedia of Genes and Genomes (http://www.genome.jp/kegg/) and National Institute of Standards and Technology (http://www.nist.gov/index.html).
A list of identified metabolites in the “biomarker pattern” for ASB 100 mg kg−1 group and control group.a
ASB: andrographolide sodium bisulfite; VIP: variable importance in projection.
aThe LECO/Fiehn Metabolomics Library was used to identify the compounds. It will give a similarity value for the compound identification accuracy. If the similarity is >700, the metabolite identification is reliable. If the similarity is <200, the library will only use “analyte” for the compound name. If the similarity is between 200 and 700, the compound name is putative annotation.
A list of identified metabolites in the “biomarker pattern” for ASB 600 mg kg−1 group and control group.a
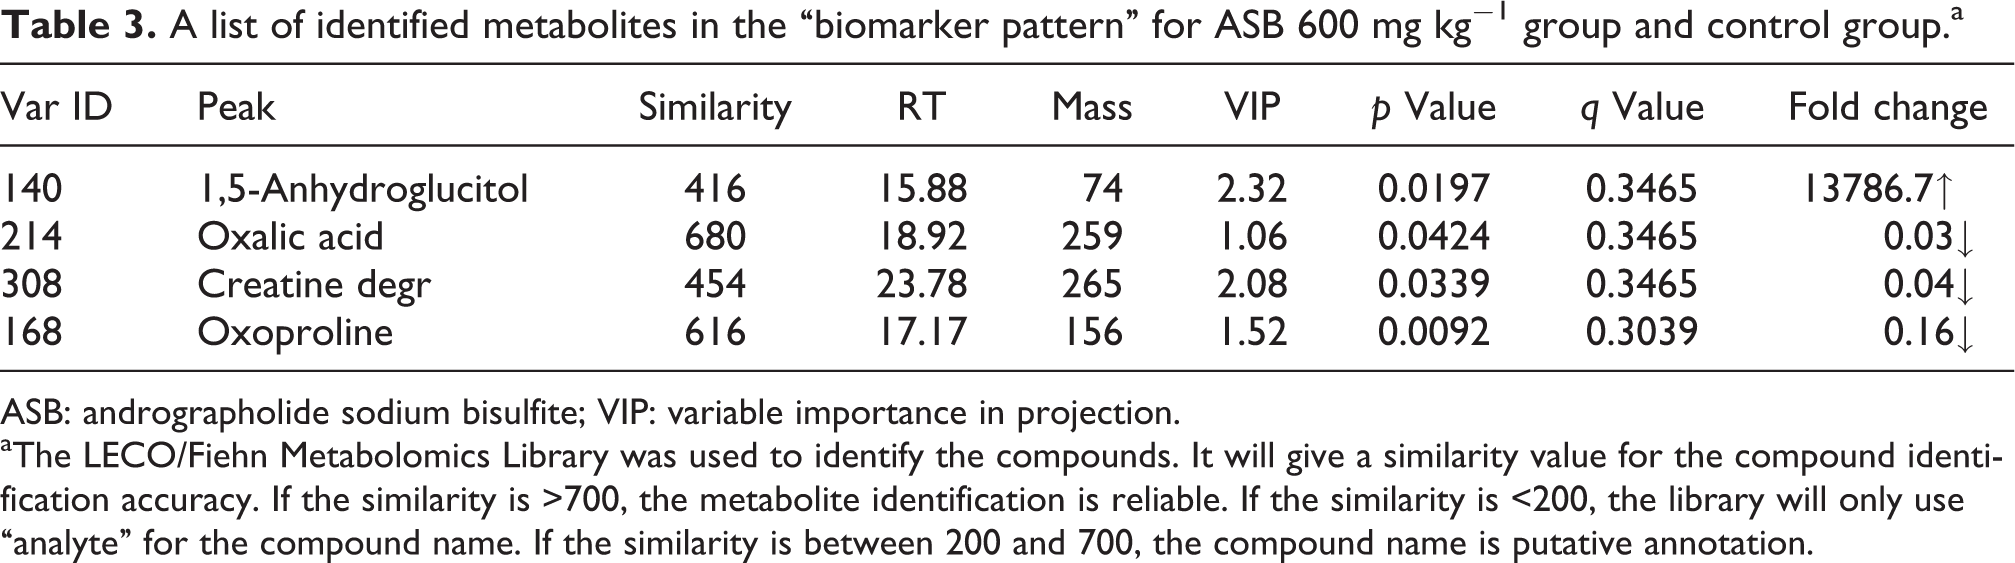
ASB: andrographolide sodium bisulfite; VIP: variable importance in projection.
aThe LECO/Fiehn Metabolomics Library was used to identify the compounds. It will give a similarity value for the compound identification accuracy. If the similarity is >700, the metabolite identification is reliable. If the similarity is <200, the library will only use “analyte” for the compound name. If the similarity is between 200 and 700, the compound name is putative annotation.
Discussion
In the present study, ASB (100 mg kg−1) and ASB (600 mg kg−1) treated rats showed obvious body weight loss and kidney coefficient gain compared with controls. ASB also caused an increase in 12 h urine volume after the last administration compared with the control. Weight loss and urine volume increase are likely to be associated with direct renal tubular injury. Injury of the renal tubules leads to subsequent loss of renal water reabsorption function. This subsequently leads to dehydration and loss of body weight. 16 Kidney coefficient gain was probably explained by the edema that was caused by ASB-induced tubular injury. In addition, PRO, KET, and BLD levels changed in several rats after 7-day administration of ASB (100 mg kg−1) or ASB (600 mg kg−1). These data further explained the impairment of kidney functions caused by ASB. 17 –20
Routinely used measures of renal function are not sufficiently sensitive. They increase significantly only after severe kidney injury occurs, generally after a loss of two-thirds or greater of nephron functional capacity. 13 Therefore, a more sensitive method for the detection of kidney injury is required. Metabonomics not only can be used to distinguish different states of intoxication but also to identify early toxicity biomarkers that are specific damage indicators of a particular organ. Metabonomics as a new technical platform has been widely used in toxicology. 21 –23 In our study, PCA score plot and PLS-DA score plot showed clear separation between ASB-treated and control groups, which indicated that urine metabolic pattern significantly changed after the treatment of ASB.
OPLS-DA results showed that seven metabolites distinguished the 100 mg kg−1 ASB-treated group from control group, including oxoproline, uracil-5-carboxylic acid, creatine degradation (Var ID 308),
1,5-Anhydroglucitol is a naturally occurring polyol that is normally filtered and completely reabsorbed in the kidneys. Increased level of 1,5-anhydroglucitol has been determined in urine of kidney injured rats. 13 Sphingosine is the main metabolite of sphingomyelin 24,25 and it can be catalyzed to sphingosine-1-phosphate by sphingosine kinase. 26 Several literatures have reported that increased sphingosine can inhibit cell growth and induce cell apoptosis. On the contrary, increased sphingosine-1-phosphate can promote cell proliferation and inhibit cell apoptosis. 27,28 Some researches indicated that sphingosine might serve as a biomarker to identify kidney injury. 29 2-Ketoadipate, a kind of α-ketoacid, is a product of tryptophan metabolism. 30 The increase in the level of 2-ketoadipate in urine observed in this study may reflect that ASB has interrupted the metabolic pathway of tryptophan metabolism. Oxalic acid is the metabolite of glyoxylic acid, implying that ASB may disturb glyoxylic acid metabolism. Furthermore, oxalic acid is involved in the formation of calcium oxalate renal stone and several literatures reported that the decrease in oxalic acid excretion may reflect the kidney injury. 31 Oxoproline participates in arginine and proline metabolism and glutathione metabolism. 32,33 Uracil-5-carboxylic acid participates in thymine metabolism. 34 Galactonic acid participates in galactose metabolism. 35 The altered levels of these biomarkers indicated that ASB may induce kidney injury by disrupting these metabolism pathways. The decrease in creatine degr excretion probably reflected the impairment of glomeruli filtration as well as concentrating and diluting capacity of tubular functions of the kidneys, just as creatinine. 14
In summary, we applied a GC/MS-based metabonomics approach to investigate the metabolic changes caused by ASB-induced nephrotoxicity in SD rats. In our study, the presence of renal dysfunction after the administration of ASB was confirmed and the metabonomics study could be used to indicate whether the animal had been dosed with ASB or not. Furthermore, 1,5-anhydroglucitol,
Footnotes
Authors’ Note
JDX and WMX contributed equally to this work.
Conflict of interest
The authors declared no conflicts of interest.
Funding
This work was supported by the National Natural Science Foundation of China (no. 81173650), Medicine and Health Science and Technology Plan projects support of Zhejiang Province (no. 2011KYB056), and Medical Science and Technology project of Zhejiang Province (no. 2012ZA007).