
Abstract
Monosodium glutamate (MSG) has been widely used throughout the world as a flavoring agent of food. However, MSG at certain dosages is also thought to cause damage to many organs, including cerebellum. This study aimed at investigating the effects of different doses of MSG on the motor coordination and the number of Purkinje cells of the cerebellum of Wistar rats. A total of 24 male rats aged 4 to 5 weeks were divided into four groups, namely, control (C), T2.5, T3, and T3.5 groups, which received intraperitoneal injection of 0.9% sodium chloride solution, 2.5 mg/g body weight (bw) of MSG, 3.0 mg/g bw of MSG, and 3.5 mg/g bw of MSG, respectively, for 10 consecutive days. The motor coordination of the rats was examined prior and subsequent to the treatment. The number of cerebellar Purkinje cells was estimated using physical fractionator method. It has been found that the administration of MSG at a dosage of 3.5 mg/g bw, but not at lower dosages, caused a significant decrease of motor coordination and the estimated total number of Purkinje cells of rats. There was also a significant correlation between motor coordination and the total number of Purkinje cells.
Introduction
Monosodium glutamate (MSG), a salt form of
Several lines of studies using animal models seemed to indicate that MSG with its glutamate excitatory characteristics disrupts the metabolism, the development, and the functions of various organs, such as liver, thymus, ovaries, kidney, and many parts of brain, including cerebellum. 9 –14 Investigations reported that MSG administered orally at dosages of 3 g/kg bw 15 or 3 g and 6 g 16 daily for 14 consecutive days caused degeneration and cellular deaths of Purkinje cells of adult rats. 15,16 In addition, newborn rats treated with subcutaneous injection of MSG with a dose of 4 mg/g bw given every other day for 10 days showed transient disturbance of motor coordination performance. 17 Our laboratory has recently engaged in a study on the effects of combined administration of black garlic and MSG on the motor coordination and the number of Purkinje cells of cerebella of rats. In this study, we cautioned that intraperitoneal injection of MSG at a dosage of 2 mg/g bw for 10 consecutive days did not convincingly cause deficits of the number of the cells and the motor coordination. On the other hand, we also found that a dosage of 4 mg/g bw was evidenced to be lethal for most of the rats. 18 Given this problem, we therefore extended our previous study by scrutinizing different dosages of MSG that may cause deficits on the number of Purkinje cells and the motor coordination of rats.
Material and methods
Animals and treatments
Twenty-four male Wistar rats aged 4–5 weeks were randomly divided into 4 groups, following 7 days of adaptation. They were T2.5, T3.0, and T3.5 groups, which were given daily intraperitoneal injection of MSG of 2.5, 3, and 3.5 mg/g bw, respectively. Another group served as a control group (C), which was given intraperitoneal injection of 2 ml of 0.9% sodium chloride (NaCl). All treatments were carried out for 10 consecutive days. The MSG produced by a company was obtained from the market and available in the form of powder at a concentration of 99+%. The powder was dissolved in 2 ml of 0.9% NaCl and was prepared fresh daily (prior to the treatment) in order to avoid crystallization.
All rats were placed in cages for 12 h under natural dark–light cycles. Unhindered access to food and water was provided for all rats during the experiment. The experimental procedure was approved by the Ethics Committee of the Faculty of Medicine, Universitas Gadjah Mada (approval number KE/FK/81/EC).
Motor coordination test
The motor coordination of the rats was examined using a rotarod apparatus for rats (Ugo Basile model 7700, Italy). The protocol used for the test was based on the protocol of previous studies 18 –20 with a slight modification. Briefly, the test began with any given rat was placed on top of the running surface of the rotarod at a stationary position and left to stay there for 1 min in order to familiarize with the apparatus. The rat was removed from the rotarod, and the rotarod was subsequently turned on at a speed of 16 rotations/min. The rat was then replaced back on the running surface with its head facing to the opposite direction of the direction of rotation of the rotarod. The rat had to walk forward in order to prevent itself from falling off the rotarod.
Two parameters were recorded during the tests, namely, the number of falls and the latency of the rats on the running surface. These motor coordination tests were performed on day 1 (1 day prior to treatment), day 12 (1 day after the treatment), and day 32 (21 days after the treatment). In any given day of examination, the rats were tested in 3 sessions, for a maximum of 180 s for each session, without any prior warming up session. The interval between each test session was ±30–60 min. The number of falls of each rat per day was averaged from the number of falls of the three test sessions during the day. The latency data were calculated from the average of two longest times spent on the rotating rod divided by 180 s and hence were presented in the form of percentages. 21
Histological procedures
Following the end of the motor coordination tests, all rats were euthanized. They were first anesthetized using ketamine 0.15 cc/100 g bw (PT. Guardian Pharmatama, Jakarta, Indonesia) and subsequently underwent transcardiac perfusion with 4% formaldehyde in phosphate buffer solution. The skulls of the rats were opened and their cerebella were immediately dissected out and weighed. The cerebella were then immersed in 4% formaldehyde solution for 24 h.
The cerebella of the rats were cut according to multistage physical fractionator procedure as was explained in other studies. 18,20,22,23 The entire cerebellum of a given rat was cut parasagitally into slices with a thickness of approximately 2–3 mm. In order to obtain the first sampling fraction (f1), a number between 1 and 2 was selected randomly. Hence f1 = 2. If number 1 was selected, every first slices of two repeated slices fractionation were taken for the second-stage fractionation. At the second-stage fractionation (f2), the selected slices of the cerebellum were cut and the procedure was repeated with f2 = 3. Therefore one of every three repeated slices fractionation was taken for the third-stage fractionation. These slices were subsequently dehydrated in graded concentration of alcohol, cleared in toluene solution, infiltrated, and eventually embedded in paraffin blocks.
The blocks were sectioned at a thickness of 6 µm using a Leica RM 2235 microtome (Biosystems Nussloch GmbH, Germany). A number between 1 and 20 was randomly chosen, and this number pointed to the number of sections of every 20 sections systematically taken for stereological analyses (f3 = 20). The specimens were mounted onto glass slides and stained with toluidine blue.
Stereological analyses
All sections of the cerebella of the third-stage fractionation were viewed and examined under Olympus CX21 binocular microscope (Olympus Singapore PTE, Ltd) with 400× magnification. All Purkinje cells in the field of views showing visible nucleoli were counted and summed up for each animal (n) (Figure 1). In order to increase the reliability of the counting, two independent experimenters were assigned to the counting. The examinations of the specimens were carried out blindly with both experimenters not knowing to which groups the specimens belonged. The estimates of the total number of Purkinje cells (N) were calculated using the formula:

Representatives of cerebellar layers of each of the four groups of rats. The arrows point to the Purkinje cells showing visible nucleoli and hence being counted; PL: Purkinje cells layer; ML: molecular layer; GL: granule cells layer.
Statistical analyses
The differences in body weights of rats between groups were analyzed using one-way analysis of variance (ANOVA) procedure. The comparisons of the data of body weights of rats within groups were analyzed using paired t-test. The data of the number of falls in the motor coordination test were not normally distributed and some values of the number of falls were zero. Thus, in order to meet the requirement of the analysis of variance and to avoid inaccuracies in the calculations due to some values being zero, the data were then transformed using the following formula:
19,20

where x is the number of falls documented in a given session, and X(t) is the transformed data that were later used in the statistical analyses. The transformed data of the number of falls and the latency spent on the rotarod on days 1, 12, and 32 were analyzed using two-way ANOVA procedure.
One-way ANOVA analyses were used to determine the differences between groups in the mean cerebellar weights and estimated total number of Purkinje cells. The analyses were followed by a post hoc multiple comparisons test whenever necessary. Correlations among variables were analyzed with the bivariate correlation analysis. To determine the relationship between the number of Purkinje cells and the motor coordination (number of falls and latency) Pearson’s product–moment correlation coefficient test was used. All data were analyzed using SPSS version 19 (IBM Company).
Results
Body weights
Table 1 shows the body weights of rats prior and subsequent to treatments. Paired t-test analysis showed that there were significant increases in body weights during the treatment in all groups. One-way ANOVA of these data showed no significant main effect of groups, both before and after treatments.
Means ± SEM of body weights of rats before and after treatment.a

ANOVA: analysis of variance; C: control; NaCl: sodium chloride; MSG: monosodium glutamate; ip: intraperitoneal; bw: body weight.
aC = 2 ml NaCl 0.9% (ip); T2.5 = 2.5 mg/g bw MSG + 2 ml NaCl 0.9% (ip); T3.0 = 3.0 mg/g bw MSG + 2 ml NaCl 0.9% (ip); T3.5 = 3.5 mg/g bw MSG + 2 ml NaCl 0.9% (ip).
bp Values of one-way ANOVA.
cp Values of paired t-test.
Motor coordination
The data of the number of falls of the rats during the rotarod tests are presented in Table 2. The two-way ANOVA analysis showed that there were significant main effects of groups and days, but not the interaction between groups and days, in the number of falls. Post hoc Tukey’s honest significant difference (HSD) analysis revealed that T3.5 group fell off the rotarod significantly more frequent than any other groups under study. Accordingly, Table 3 shows that there was a significant main effect of groups, but not days and Groups × Days interaction in the latency of the rats spent on the rotarod. Post hoc Tukey HSD analysis showed that T3.5 group spent significantly shorter time than C group on the rotarod.
Means ± SEM of total number of falls of rats on rotarod test.a

ANOVA: analysis of variance; n: number of rats; df: degrees of freedom; F: F value; C: control; NaCl: sodium chloride; MSG: monosodium glutamate; ip: intraperitoneal; bw: body weight.
aC = 2 ml NaCl 0.9% (ip); T2.5 = 2.5 mg/g bw MSG + 2 ml NaCl 0.9% (ip); T3.0 = 3.0 mg/g bw MSG + 2 ml NaCl 0.9% (ip); T3.5 = 3.5 mg/g bw MSG + 2 ml NaCl 0.9% (ip). Results of two-way ANOVA: days: df = 2, 60; F = 4.75; p = 0.012*; groups: df = 3, 60; F = 7.89; p = 0.000*; Groups × Days interaction: df = 6, 60; F = 0.53; p = 0.785; *p < 0.05.
Means ± SEM of two best latency values (% of 180 s) spent on the rotarod of the rats.a

ANOVA: analysis of variance; n: number of rats; df: degrees of freedom; F: F value; C: control; NaCl: sodium chloride; MSG: monosodium glutamate; ip: intraperitoneal; bw: body weight.
aC = 2 ml NaCl 0.9% (ip); T2.5 = 2.5 mg/g bw MSG + 2 ml NaCl 0.9% (ip); T3.0 = 3.0 mg/g bw MSG + 2 ml NaCl 0.9% (ip); T3.5 = 3.5 mg/g bw MSG + 2 ml NaCl 0.9% (ip). Results of two-way ANOVA: days: df = 2, 60; F = 2.9; p = 0.062; groups: df = 3, 60; F = 4.3; p = 0.009*; Groups × Days interaction: df = 6, 60; F = 0.4; p = 0.906; *p < 0.05.
Cerebellar weights and Purkinje cells number
The data of cerebellar weight and estimated Purkinje cell number are presented in Table 4. One-way ANOVA statistical analysis showed that there was no significant difference between groups in the cerebellar weights. On the other hand, there was a significant main effect of groups in the estimated total number of Purkinje cells. Post hoc multiple comparison least significant difference procedure revealed that the number of Purkinje cells of T3.5 group was significantly lower than any other groups of rats.
Means ± SEM of cerebellar weights (mg) and the estimated total number of Purkinje cells (×10 3 ) of the rats.a
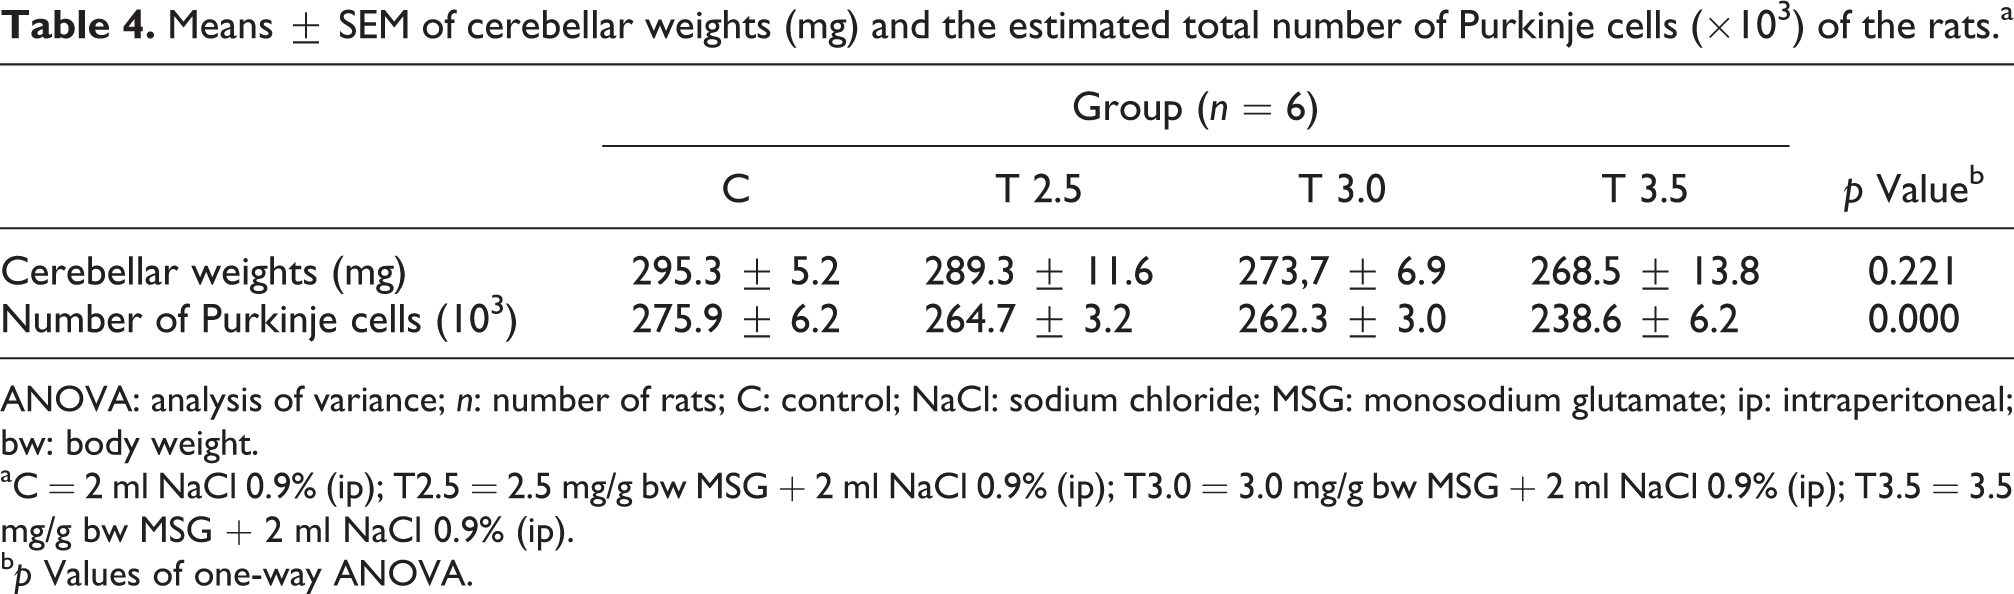
ANOVA: analysis of variance; n: number of rats; C: control; NaCl: sodium chloride; MSG: monosodium glutamate; ip: intraperitoneal; bw: body weight.
aC = 2 ml NaCl 0.9% (ip); T2.5 = 2.5 mg/g bw MSG + 2 ml NaCl 0.9% (ip); T3.0 = 3.0 mg/g bw MSG + 2 ml NaCl 0.9% (ip); T3.5 = 3.5 mg/g bw MSG + 2 ml NaCl 0.9% (ip).
bp Values of one-way ANOVA.
The correlation between the motor coordination and the estimated total number of Purkinje cells
The Pearson’s product–moment correlation coefficient test showed that there was a significant correlation between the number of cerebellar Purkinje cells and both the number of falls (p = 0.002) and the latency spent on the rotarod (p = 0.00). The r value between the number of Purkinje cells and the number of fall was (−) 0.342, whereas that between the number of Purkinje cells and the latency of rats on the rotarod was (+) 0.416.
Discussion
Our study revealed that MSG with a dosage of 3.5 mg/g bw administered daily for 10 days, but not with lower dosages, caused the deficits of the motor coordination and the estimated total number of Purkinje cells of the cerebella of rats. Such decrease of the number of Purkinje cells was closely correlated to the deterioration of the motor coordination, in which the number of the cells was inversely proportional to the number of falls and directly proportional to the latency spent on the rotarod.
A limited number of studies concerning the effects of MSG on Purkinje cells reported that the administration of MSG gave rise to damage or pyknotic Purkinje cells. 15,16 Our study lends support to these investigations by providing quantitative data that MSG reduced the number of Purkinje cells at a dosage of 3.5 mg/g bw (Table 4). We also observed degenerative changes of Purkinje and granule cells similar to those of Eweka and Om’Iniaboh 16 and Hashem et al. 15 studies in all MSG treated groups, albeit the absence of the reduction of the number of Purkinje cells in the T2.5 and T3 groups. Considering that the motor coordination disturbance occurred only in the T3.5 group (Tables 2 and 3), one may argue that the manifestation of motor performance dysfunction necessitates both the degeneration and the reduction of the number of cerebellar cells. The degenerative process per se may not be sufficient to disrupt motor coordination functions.
MSG, having glutamate as its main component, may have caused death of Purkinje cells by excessively activating glutamate receptors, although the precise mechanism of this glutamate excitotoxicity remains yet to be explained. 24 Glutamate is known to be a neurotransmitter that normally serves the signaling between neurons. In normal conditions, the extracellular and the synaptic clefts’ glutamate level was maintained at a relatively low concentration by excitatory amino acids transporters in order to prevent neurons from excitotoxicity. 25,26 An accumulation of glutamate in the synapses, however, may exceed neuronal ability to maintain this relatively safe level of glutamate. 27 –29 Hence this triggers overstimulation of both A-amino-3-hydroxy-5-methyl-4-isoxazolepropionate (AMPA) and metabotropic glutamate receptors, which then instigate a sequence of molecular cascade. This results in the increase of intracellular calcium levels which in turn activates calcium-dependent degradative enzymes and apoptotic pathways and eventually leads to neuronal demise. In addition, the massive influx of calcium ions yields the anomalous modification of dendritic structure and hence disrupts normal synaptic functions. 1,24,30,31 Such a synaptic accumulation of glutamate is even facilitated by the ability of glutamate to penetrate the brain via circumventricular organs of the brain, despite the low permeability of blood–brain barrier (BBB) to MSG. Furthermore, glutamate transporters that are present in BBB capillary membrane assist the uptake of MSG into the brain. 32 Receiving two main glutamatergic inputs, that is, parallel fibers and climbing fibers, 33 Purkinje cells seem to be vulnerable targets of glutamate excitotoxicity. One-to-one connection is present between climbing fibers and Purkinje cells. However, each climbing fiber gives branches of many axon terminals to any given Purkinje cell, 34 and thus any stimulation to each climbing fiber causes simultaneously numerous glutamatergic excitations on the Purkinje cell. 31 This possible mechanism of glutamate excitotoxicity may also occur in various neurodegenerative disorders including stroke, 35,36 Alzheimer’s disease, 37 epilepsy, 35 amyotrophic lateral sclerosis, 38 and schizophrenia. 39
Caution should be exercised, however, in drawing a conclusion as to the effects of MSG on Purkinje cells, especially, when the results of this study are interpreted in the context of human subjects. Our study showed that the number of Purkinje cells was reduced in the group of rats having MSG of 3.5 mg/g bw daily (Table 4) administered parenterally, but not orally. Converted to the dose for human subjects, 40 this dose given to is equivalent to 560 mg/kg bw for humans. As for a human with a body weight of 70 kg, it may require a daily dose of approximately 39.2 g of MSG to demonstrate similar cerebellar effects of MSG shown in a 200 g rat. One might have considered further as to convert this parenteral dose into a practically oral dose, which might be necessarily higher to obtain an equivalent outcome. Given the average daily intake of MSG in general population of more or less 2.2 g 8 or perhaps even up to 10 g/day in some countries, 41,42 this parenteral dose seems to be extraordinarily high. Nonetheless, meticulous studies pertaining to the measurement of accurate amount of MSG consumption in human population are warranted, since records of MSG intake in previous studies 42,43 were probably underestimated due to the unavailability of data of MSG contents in the ingredient labels of processed food. 7,8
The investigation by Hashem et al. 15 applied a relatively high oral dose of 3 mg/g bw/day, which was similar to the dose used in our study, to demonstrate degenerative changes of Purkinje and granule cells of the cerebella of rats. On the other hand, Eweka and Om’Iniabohs 16 administered 3 and 6 g of MSG mixed with their rat feed and found similar findings with that of Hashem et al.’s study. 15 Of note, the dosage applied by Eweka and Om’Iniabohs 16 seemed not to be adjusted with the body weights of the individual rats. It was possible that the rats in this study consumed different amount of MSG, and therefore, by chance, some rats might have consumed relatively low amount of MSG. This low dose, however, already caused damage to cerebellar Purkinje and granule cells. Nevertheless, there is no data available up to date, which confirm whether or not these low oral dosages cause the deficits of the number of Purkinje cells and motor coordination performance.
This study found that the decrease of the number of Purkinje cells strongly correlated to the deterioration of motor coordination function of the rats. Being the sole outputs of the cerebellar cortex, Purkinje cells play a crucial role in cerebellar functions, which mainly implicate motor coordination. 34 Hence any disturbance on the structure or functions of Purkinje cells will obviously impair the motor coordination functions. MSG at a dosage of 3.5 mg/g bw effectively disrupted the motor coordination of rats as was shown in the statistical analyses that there were significant main effects of groups in both the number of falls (p = 0.000; Table 2) and the latency of the rats (p = 0.009; Table 3). There was also a significant main effect of days in the number of falls (p = 0.012; Table 2), which indicated the apparent worsening of the motor coordination performance of rats along the 3-day rotarod tests. This worsening, however, may have arisen from factors other than MSG, such as the increase of body weights, since there was no significant main effect of the Groups × Days interaction in the number of falls of rats (p = 0.785; Table 2). The increase in body weights may confound the observation on rotarod tests. 18,44,45 Our present study was also consistent with the previous study in our laboratory 18 and another, 46 which found that MSG did not affect the body weight, but at variance with other studies. 8,47 –49 The increase of body weights observed in the present investigation (Table 1) seems to be purely due to normal body growth of rats since there was a lack of difference between groups in body weights prior and subsequent to treatment.
The deficits of motor coordination performance observed in this study might also be contributed by the damage due to glutamate-induced excitotoxicity on other central nervous system structures and circuitries entailed directly or indirectly in the production of voluntary movement, including motor cortex, basal ganglia, motor centers of brain stem and spinal cord, as well as other brain areas. Studies that were mainly carried out on neonatal rats reported that MSG caused neuronal disruption in the cerebral cortex, 50 prefrontal cortex, 51 and hippocampus. 52,53 Other studies found that MSG also exerted detrimental effects on the visual pathway, including optic nerve, 54 superior colliculus, 54,55 and retina. 56,57 . Such defect on the visual system may also play a role in motor performance deterioration.
In conclusion, our study provide novel data on the parenteral dosage of MSG at which it definitely exerts deleterious effects on the number of Purkinje cells of the cerebella as well as the motor coordination performance of rats. Future studies are undoubtedly awaited to reveal the precise mechanisms on how MSG affects the Purkinje cells and overall circuitry of cerebellum in relation to motor coordination functions. Finally, given that many brain disorders may implicate glutamate excitotoxicity, our study sheds light on the parenteral dose of glutamate required for studies on these disorders using rats model.
Footnotes
Acknowledgments
The authors would like to thank Suparno, Wakidi (Department of Physiology, Faculty of Medicine, Universitas Gadjah Mada (UGM), Indonesia), and Wiwit Setyowati (Department of Histology and Cell Biology, Faculty of Medicine, UGM, Indonesia) for their technical assistance.
Conflict of interest
The authors declared no conflicts of interest.
Funding
This research was supported by public funding of Pekalongan University (grant number 37/KEP/A.17/01/I/2010). The preparation of the manuscript was partially funded by Scheme for Academic Mobility and Exchange (SAME) project of Directorate General of Higher Education (DGHE) of the Ministry of Education and Culture, Indonesia (grant number 1393.1/E4.2/2014).