Levo-Carnitine (l-carnitine) is widely used in health and food. This study was to focus on the adverse effects of 8-week oral supplementation of l-carnitine (0.3 and 0.6 g/kg) in female and male Sprague Dawley rats. l-carnitine reduced body and fat weights, as well as serum, liver, and kidney lipid levels in rats. Simultaneously, hepatic fatty acid β-oxidation and lipid synthesis were disturbed in l-carnitine-fed rats. Moreover, l-carnitine accelerated reactive oxygen species production in serum and liver, thereby triggering hepatic NOD-like receptor 3 (NLRP3) inflammasome activation to elevate serum interleukin (IL)-1β and IL-18 levels in rats. Alteration of serum alkaline phosphatase levels further confirmed liver dysfunction in l-carnitine-fed rats. Additionally, l-carnitine may potentially disturb kidney function by altering renal protein levels of rat organic ion transporters. These observations may provide the caution information for the safety of long-term l-carnitine supplementation.
Levo-Carnitine (l-carnitine), the biologically active form of carnitine, plays a vital role in acyl-CoA transport from cytosol to mitochondrial matrix for fatty acid β-oxidation. In 1986, US Food and Drug Administration (FDA) suggest 1 g of l-carnitine/day for 2–4 months in the treatment of primary carnitine deficiency. Nowadays, l-carnitine is also introduced into the diet of infants who are unable to synthesize l-carnitine in early years. Consequently, it is imperative to add l-carnitine to the diet for humans or pets to control body weight. Studies from the National Institutes of Health have demonstrated that l-carnitine supplementation has no major side effects except some minor symptoms including vomiting, nausea, diarrhea, cramps, and a “fishy” body odor, as well as occasionally muscle weakness and seizures in humans, and also suggest an appropriate dose of 3 g l-carnitine/day for controlling body weight.1
In fact, body fat reduction induces some metabolic disturbances including insufficient energy storage, subcutaneous adipose tissue dysfunction, and cell membrane damage of crucial tissues and organs.2l-carnitine supplementation promotes insulin secretion to disturb serum glucose homeostasis in lean male participants compared with obese humans, without change of serum levels of non-esterified fatty acids,3 questioning its regulatory role in fatty acid β-oxidation and energy metabolism. Recently, dietary l-carnitine supplementation is considered to be a risk factor for cardiovascular disease in both mice and humans.4 Ingesting red meat containing high percentages of l-carnitine, omnivorous human subjects are more likely to suffer from atherosclerosis than vegans or vegetarians.4 Similar results for the impact of dietary l-carnitine supplementation on the extent of atherosclerosis are also observed in mice.4 Efficiency and safety of dietary l-carnitine supplementation on health status are doubted recently.
It is noted that mitochondrial fatty acid β-oxidation acceleration produces a large amount of reactive oxygen species (ROS) that trigger NOD-like receptor family, pyrin domain-containing 3 (NLRP3) inflammasome. The NLRP3 inflammasome activation acts as a danger signal subsequently inducing maturation and secretion of pro-inflammatory cytokines interleukin (IL)-1β and IL-18, playing a crucial role in inflammation response, as well as liver and kidney damage.5–10 Kidney is an important organ for homeostatic regulation of l-carnitine and other organic ion levels. Renal organic cation/carnitine transporters OCTN-1 (encoded by SLC22A4) and OCTN-2 (encoded by SLC22A5) mediate reabsorption and distribution of l-carnitine.11–12 OCTN-2−/− mice show severe carnitine deficiency, early signs of inflammation, and gut injury.13 Lipopolysaccharide-induced inflammation downregulates OCTN-1 and OCTN-2 messenger RNA (mRNA) expression in mammary gland of both early lactation and mid-lactation rats.14 In inflammatory bowel disease patients, intestine OCTN-2 mRNA expression is significantly decreased.15 These observations demonstrate the possible role of inflammatory signaling in regulating l-carnitine transporter expression. In addition, organic cation transporters OCT-1 (encoded by SLC22A1) and OCT-2 (encoded by SLC22A2) expressed in renal proximal tubules are responsible for excretion of organic cations and most exogenous drugs. Inflammatory cytokines downregulate OCT-1 mRNA expression in primary human hepatocytes.16 Lipopolysaccharide-induced inflammation and reduction of renal OCT-1 and OCT-2 mRNA and protein levels are also detected in Wistar Hannover rats.17 Expression change of OCTN-2, OCT-1 and OCT-2 causes renal l-carnitine and organic ion imbalance to aggravate the progression of renal failure.18 These observations indicate that a long-term supplementation of exogenous l-carnitine possibly causes lipid disorder and inflammation, which may be associated with dysregulation of organic ion transporters to induce metabolic disturbance and tissue function disturbance. Thus, it is important to reevaluate the safety of l-carnitine supplementation.
Materials and methods
Materials
l-carnitine (99.28%) was purchased from Aoduofuni Biotech (Nanjing, People’s Republic of China). Assay kits of triglycerides (TG), total cholesterol (TC), free fatty acids (FFA), creatinine, blood urea nitrogen (BUN), and alkaline phosphatase (AKP) were obtained from Jiancheng Biotech (Nanjing, People’s Republic of China). An enzyme-linked immunosorbent assay (ELISA) kit for very low-density lipoprotein (VLDL) assay was obtained from Cusabio (Wuhan, People’s Republic of China). An ELISA kit for ROS assay was purchased from Yanhui Biotech (Shanghai, People’s Republic of China). ELISA kits for IL-1β and IL-18 assays were purchased from IBL (Suite P, Minneapolis, USA). Oil red O reagent was purchased from Sigma Aldrich (St Louis, Missouri, USA). Antibodies of rOCT-1 and rOCT-2 were obtained from SaiChi Biotech (Beijing, People’s Republic of China), of rOCTN-1 and rOCTN-2 were obtained from Alpha Diagnostic Intl Inc. (San Antonio, Texas, USA); of peroxisome proliferator-activated receptor α (rPPAR-α), carnitine palmitoyltransferase 1 (rCPT-1) and rCPT-2, sterol regulatory element binding protein-1c (rSREBP-1c), acetyl coenzyme A carboxylase 1 (rACC-1) and rACC-2, fatty acid synthase (rFAS), stearoyl-CoA desaturase-1 (rSCD-1), rNLRP3, apoptosis-associated speck-like protein (rASC), and rCaspase-1 were obtained from Santa Cruz Biotech (Dallas, Texas, USA). Glyceraldehyde-3-phosphate dehydrogenase (rGAPDH) monoclonal antibody (KC-5G5) was from Kangcheng Biotech (Shanghai, People’s Republic of China). Goat anti-rabbit-immunoglobulin G (IgG) horseradish peroxidase (HRP) (SB-200) was obtained from Jingmei Biotech (Shanghai, People’s Republic of China). 3, 3′,5,5′-Tetramethylbenzidine (TMB) reagent was purchased from Beyotime (Haimen, People’s Republic of China). Methanol, ethanol, isopropyl alcohol, chloroform, dimethyl sulfoxide, sodium chloride, formalin, xylene, paraffin, and neutral balsam were of analytical grade and purchased from Sinopharm Chemical Reagent (Shanghai, People’s Republic of China).
Animals
Healthy adult Sprague Dawley rats, weighing 180–250 g (female) and 350–400 g (male), were purchased from the Experimental Animal Center of Nanjing Medical University (Nanjing, People’s Republic of China; production license: SCXK2008-0004). Rats were housed in plastic cages and maintained with free access to water and food, with ambient temperature (22 ± 2°C), relative humidity of 50 ± 10%, and 12-h light per day (07:00 a.m.–07:00 p.m.).
Female and male rats were randomly divided into three groups (n = 15 per group), receiving water (vehicle) and l-carnitine (0.3 and 0.6 g/kg) by oral gavage once daily at 02:00–03:00 p.m. for consecutive 8 weeks as a long-term treatment, respectively. In humans, daily requirement of l-carnitine either through diet or endogenous synthesis is suggested to be approximately 2 g/day.19 The recommended dosage of l-carnitine is 1–3 g for clinical and weight loss purposes without explicit restriction of administration time by FDA and the National Institutes of Health. As the average body weight is 60 kg for human, oral ingestion dosage of l-carnitine is about 3 g/kg/day. On the basis of body surface area calculation in animal experiments, equivalent dosage for rats is about 18 g/kg/day. The average oral administration dosage of l-carnitine for pharmacological analysis in rats is 0.1-0.6 g/kg/day for about 30 days.20 Thus, according to these reports and our preliminary study, the tested dosages of l-carnitine in this study were 0.3 and 0.6 g/kg/day, respectively.
All procedures on animals were made in strict accordance with the Institutional Animal Care Committee at the Nanjing University and the China Council on Animal Care at Nanjing University (SYXK (SU) 2009—0017).
Collection of blood, urine, and tissue samples
Rat body weight was measured weekly. Rats were placed in individual metabolic cages for 24 h urine collection. Each urine sample was centrifuged (2000g) at 4°C for 10 min to remove the particulate contaminants and record the volume. The supernatant samples were used for creatinine and BUN assays, respectively. At the end of experimental period, the rats were killed by decapitation at 9:00 a.m.–10:00 a.m. after a 12-h fast (9:00 p.m.–9:00 a.m.) to avoid the fluctuation of hormone levels due to circadian rhythms. Blood samples were centrifuged (3000g) at 4°C for 10 min to get serum frozen at −80°C for biochemical assays. Body fats in white adipose tissue (WAT) from subcutaneous (scapular, rump, and ventral) and intra-abdominal (omental, mesenteric, and retroperitoneal) layers were stripped and weighed, respectively. Simultaneously, liver and kidney cortex tissues were rapidly separated on ice-plate and stored at −80°C until biochemical, histopathological staining, and Western blot analyses.
Determination of lipid levels in serum, liver, and kidney
Tissue lipids were extracted according to the method described by our previous report.9 Briefly, liver and kidney tissues were homogenized with chloroform/methanol (2/1). The homogenate was centrifuged (12,000g) at 4°C for 10 min to get liquid phase for assays. TG, TC, VLDL, and FFA levels in serum, as well as TG, TC, and VLDL levels in liver and kidney were determined using standard diagnostic kits, respectively.
Determination of serum and liver ROS levels
Liver tissues were weighed and homogenized in 10% (wt/vol) sodium chloride on ice and then centrifuged at 3000g for 10 min at 4°C. The supernatants were collected for ROS assay. Serum and hepatic ROS levels were determined by commercially available ELISA kit according to the manufacturer’s instruction. This ELISA kit comprises a monoclonal anti-ROS antibody, which reacts with the substances such as hydroxyl radicals, superoxide anion radicals, hydrogen peroxide, and other ROS.
Determination of serum IL-1β and IL-18 levels as well as liver and kidney function parameters
Serum IL-1β and IL-18 levels were measured using commercial ELISA kits, respectively. Serum AKP level was detected as liver function parameter using the method of diagnostic kit. Serum and urine creatinine and BUN levels, the major kidney function parameters, were determined spectrophotometrically following the protocols of kits, respectively.
Histopathological staining analysis of liver and kidney tissues
Liver and kidney were removed and snap-frozen immediately at −70°C. Liver and kidney specimens were cut in 6 µm-thick section on a cryostat and mounted on 3-aminopropyltriethoxysilane-coated glass slide. Each section was washed by distilled water and then stained with oil red O reagent for 5–10 min to detect fat accumulation in tissues.
Western blot analysis
The liver and kidney cortex tissues were homogenized on ice in 10% (wt/vol) of homogenate solution in 1 mL radioimmunoprecipitation assay buffer and centrifuged at 3000g for 15 min at 4°C. The supernatant was centrifuged for an additional 20 min at 12,000g at 4°C to get supernatant for further analyses, respectively. Its protein concentrations were determined by Bradford protein assay with bovine serum albumin as a standard.
After resolution of liver and renal proteins (equal loading for each sample) by 10% sodium dodecyl sulfate (SDS)–polyacrylamide gel electrophoresis (PAGE), these protein samples were electrophoretically transferred onto polyvinylidene difluoride membranes (Millipore, Billerica, Massachusetts, USA), which were then blocked with 5% skim milk and subsequently incubated with primary antibody described above and goat anti-rabbit IgG HRP antibody. Immunoreactive bands were visualized by TMB reagent. Relative quantification for protein products were calculated by normalization to the amount of rGAPDH levels.
Statistical analysis
All data were expressed as mean ± SD and analyzed by a one-way analysis of variance, followed by the post hoc least significant difference test to determine the level of significance. A value of p < 0.05 was considered statistically significant. Figures were obtained by the GraphPad Prism 5 statistical analysis software (GraphPad Software, Inc., San Diego, California, USA).
Results
l-Carnitine supplementation reduced body and fat weights as well as serum TG, TC, VLDL, and FFA levels in rats
As shown in Figure 1, body weights of both female (Figure 1(a)) and male (Figure 1(b)) rats fed with 0.3 and 0.6 g/kg l-carnitine were slowly declined throughout the experimental period compared with the control group. There was no significant difference in water and food intakes among control and l-carnitine-fed rats (data not shown). Moreover, weights of WAT (including scapular, rump, ventral, omentum, mesenterium, and peritoneum) were significantly decreased in l-carnitine-fed rats compared with the control group at the end of 8 weeks (Figure 1(c)).
Effects of l-carnitine supplementation on body and fat weights in female and male Sprague Dawley rats. The animals were gavaged daily with water as control (Veh) and 0.3 and 0.6 g/kg l-carnitine for 8 weeks, respectively. Body fats in WAT were from subcutaneous (scapular, rump, and ventral) and intra-abdominal (omental, mesenteric, and retroperitoneal) layers. Data were shown as mean ± SD (n = 15) *p < 0.05; **p < 0.01 compared with the control. WAT: white adipose tissue.
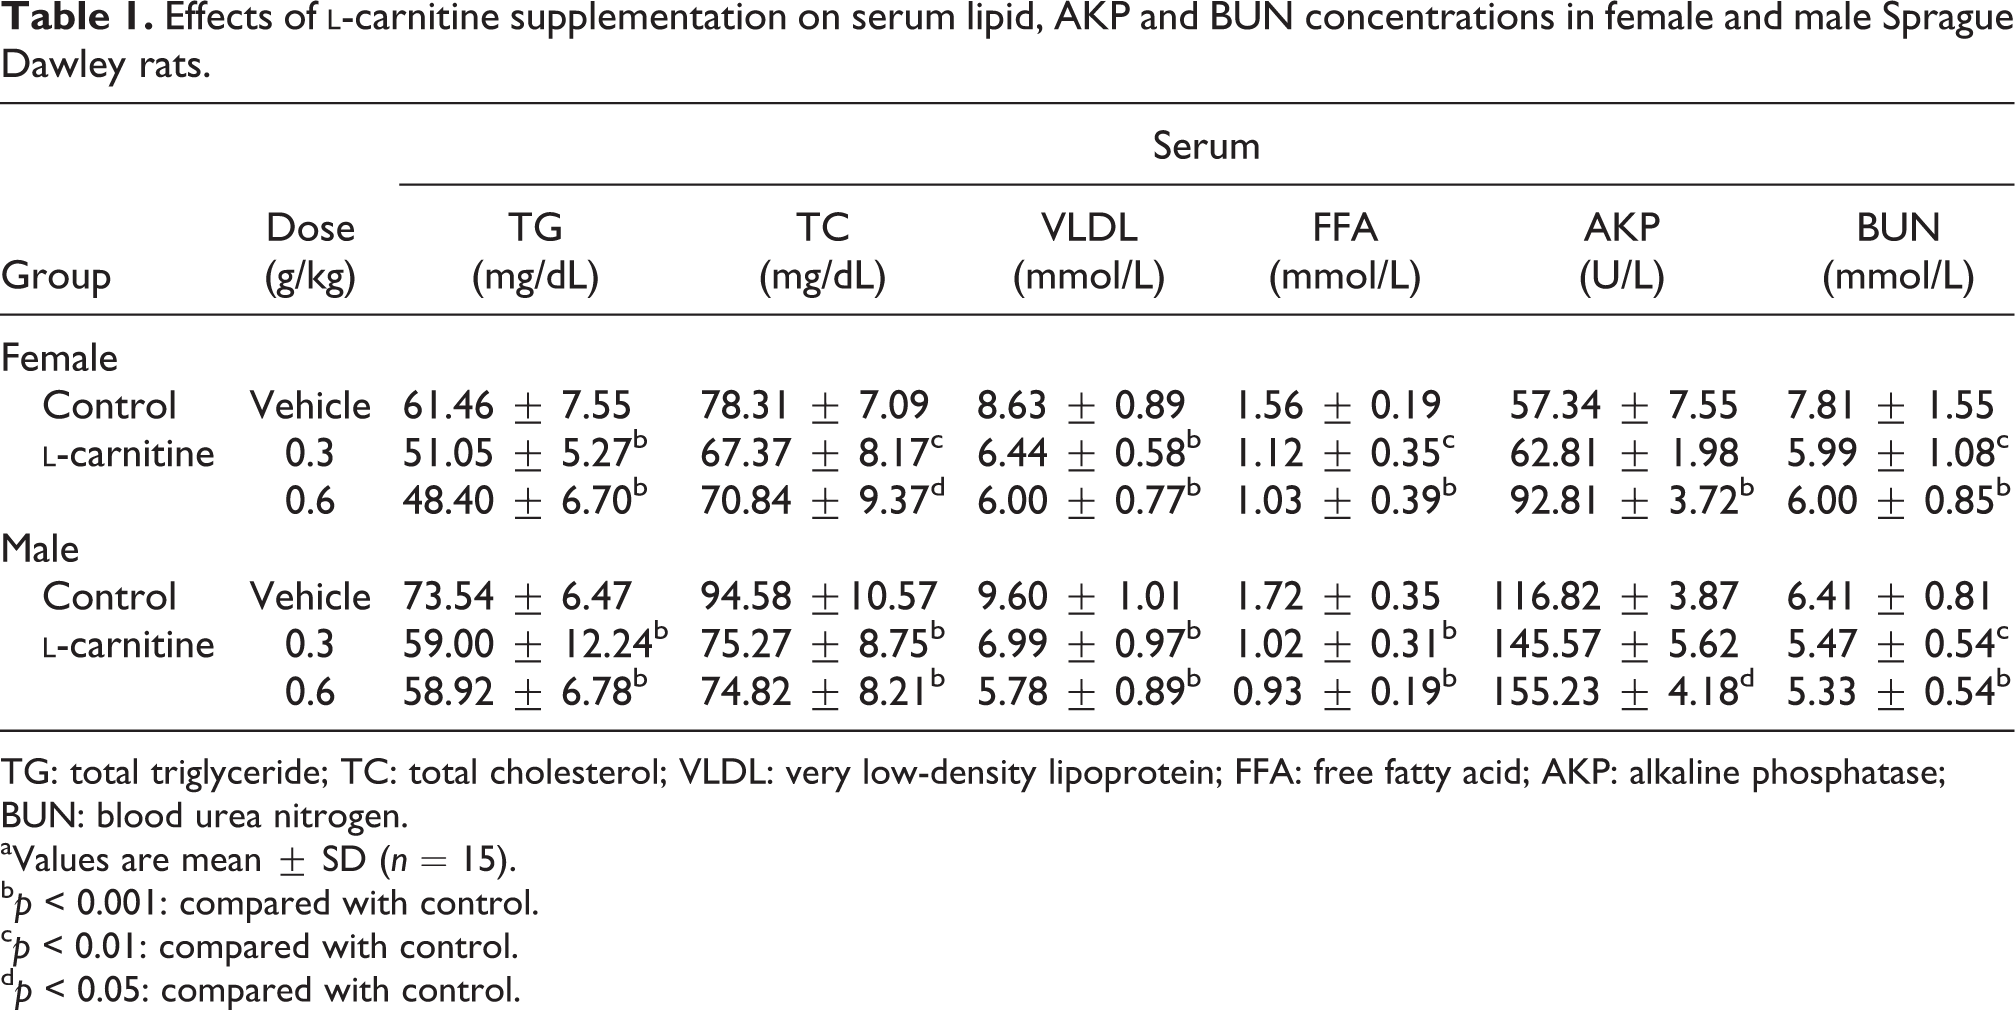
Side effects of 8-week l-carnitine supplementation on lipid metabolism were characterized by serum lipid level reduction. As shown in Table 1, 0.3 and 0.6 g/kg l-carnitine-fed female and male rats developed significant reduction of serum TG, TC, VLDL, and FFA levels, the latest was decreased almost 40% with that of control group, indicating that l-carnitine supplementation may probably cause lipid metabolism disorder in rats.
Effects of l-carnitine supplementation on serum lipid, AKP and BUN concentrations in female and male Sprague Dawley rats.
Serum
Group
Dose (g/kg)
TG (mg/dL)
TC (mg/dL)
VLDL (mmol/L)
FFA (mmol/L)
AKP (U/L)
BUN (mmol/L)
Female
Control
Vehicle
61.46 ± 7.55
78.31 ± 7.09
8.63 ± 0.89
1.56 ± 0.19
57.34 ± 7.55
7.81 ± 1.55
l-carnitine
0.3
51.05 ± 5.27b
67.37 ± 8.17c
6.44 ± 0.58b
1.12 ± 0.35c
62.81 ± 1.98
5.99 ± 1.08c
0.6
48.40 ± 6.70b
70.84 ± 9.37d
6.00 ± 0.77b
1.03 ± 0.39b
92.81 ± 3.72b
6.00 ± 0.85b
Male
Control
Vehicle
73.54 ± 6.47
94.58 ±10.57
9.60 ± 1.01
1.72 ± 0.35
116.82 ± 3.87
6.41 ± 0.81
l-carnitine
0.3
59.00 ± 12.24b
75.27 ± 8.75b
6.99 ± 0.97b
1.02 ± 0.31b
145.57 ± 5.62
5.47 ± 0.54c
0.6
58.92 ± 6.78b
74.82 ± 8.21b
5.78 ± 0.89b
0.93 ± 0.19b
155.23 ± 4.18d
5.33 ± 0.54b
TG: total triglyceride; TC: total cholesterol; VLDL: very low-density lipoprotein; FFA: free fatty acid; AKP: alkaline phosphatase; BUN: blood urea nitrogen.
aValues are mean ± SD (n = 15).
bp < 0.001: compared with control.
cp < 0.01: compared with control.
dp < 0.05: compared with control.
l-carnitine supplementation significantly decreased lipid levels by disturbing lipid metabolism-related proteins in the liver of rats
l-carnitine supplementation at 0.3 and 0.6 g/kg remarkably decreased liver TG, TC and VLDL contents in female and male rats compared with the control group (Table 2). This induction of hepatic lipid level reduction by l-carnitine supplementation was further confirmed in the results of oil red O staining analyses (Figure 2(a)). Small and large lipid deposits were positively detected in the cytoplasm of liver cells of non-l-carnitine-fed female and male rats. l-carnitine at 0.3 g/kg significantly decreased lipid deposits, while at 0.6 g/kg almost completely removed liver lipid droplets in these animals.
Effects of l-carnitine supplementation on lipid deposits and expression levels of lipid metabolism-related proteins in the liver of female and male Sprague Dawley rats. The animals were gavaged daily with water as control (Veh) and 0.3 and 0.6 g/kg l-carnitine for 8 weeks, respectively. Liver frozen sections by oil red O staining from these groups at a magnification of ×200 (a). Hepatic protein levels of rPPAR-α (b), rCPT-1 (c), rCPT-2 (d), rOCTN-2 (e), rSREBP-1c (f), rACC-1 (g), rACC-2 (h), rFAS (i) and rSCD-1 (j) were detected in rats, which were normalized by the abundance of rGAPDH protein and then represented relative to the mean value of control, respectively. Data were shown as mean ± SD (n = 4). *p < 0.05; **p < 0.01; ***p < 0.001: compared with the control. rPPAR-α: peroxisome proliferator-activated receptor α; rCPT-1: carnitine palmitoyltransferase 1; rCPT-2: ; rOCTN-2: carnitine palmitoyltransferase 2; rSREBP-1c: sterol regulatory element binding protein-1c; rACC-1: acetyl coenzyme A carboxylase 1; rACC-2: acetyl coenzyme A carboxylase 2; rFAS: fatty acid synthase; rSCD-1: stearoyl-CoA desaturase-1; rGAPDH: glyceraldehyde-3-phosphate dehydrogenase.
Effects of l-carnitine supplementation on liver and kidney lipid levels in female and male Sprague Dawley rats.
Liver
Kidney
Group
Dose (g/kg)
TG (mg/g wet tissue)
TC (mg/g wet tissue)
VLDL (mg/g wet tissue)
TG (mg/g wet tissue)
TC (mg/g wet tissue)
VLDL (mg/g wet tissue)
Female
Control
Vehicle
12.77 ± 0.93
7.98 ± 0.62
244.9 ± 16.3
8.47±1.51
4.28±0.62
0.2449±0.0163
l-carnitine
0.3
10.72 ± 1.70b
6.04 ± 1.24c
137.3 ± 19.4b
6.56±1.16b
3.72±0.74d
0.2032±0.0229b
0.6
8.88 ± 2.75c
6.22 ± 1.05c
203.2 ± 22.8c
6.62±0.89b
3.61±0.89d
0.2027±0.0244c
Male
Control
Vehicle
13.28 ± 0.89
5.36 ± 1.32
233.8 ± 26.3
9.04±0.89
4.20±0.54
0.2338±0.0263
l-carnitine
0.3
10.25 ± 0.89c
4.29 ± 0.77d
177.0 ± 26.7c
6.97±0.81c
3.52±0.46b
0.1974±0.0271b
0.6
11.33 ± 1.24c
4.26 ± 0.58b
197.4 ± 27.1b
6.77±0.58c
3.62±0.27b
0.1912±0.0108c
TG: total triglyceride; TC: total cholesterol; VLDL: very low-density lipoprotein. aValues were mean ± SD (n = 15).
bp < 0.01: compared with control.
cp < 0.001: compared with control.
dp < 0.05: compared with control.
Therefore, hepatic protein levels of key enzymes and regulators in lipid metabolism in l-carnitine-fed rats were examined. l-carnitine at 0.3 and 0.6 g/kg significantly upregulated hepatic protein levels of rPPAR-α (Figure 2(b)), rCPT-1 (Figure 2(c)), rCPT-2 (Figure 2(d)) and rOCTN-2 (Figure 2(e)) in female and male rats, exhibiting fatty acid β-oxidation acceleration. Furthermore, 0.3 and 0.6 g/kg l-carnitine-fed female and male rats developed reduction in protein levels of hepatic rSREBP-1c (Figure 2(f)), rACC-1 (Figure 2(g)), rACC-2 (Figure 2(h)), rFAS (Figure 2(i)) and rSCD-1 (Figure 2(j)) showing lipid synthesis inhibition. These alterations may be associated with hepatic lipid metabolism disorder in l-carnitine-fed animals.
Hepatic lipid metabolism disorder associated liver dysfunction in l-carnitine-fed rats was illustrated by serum parameter of liver function analysis. As shown in Table 1, serum AKP level was significantly increased in both female and male rats fed with 0.6 g/kg l-carnitine. These data confirm the potential existence of liver dysfunction in rats induced by 8-week exogenous l-carnitine supplementation.
l-carnitine supplementation induced whole body and hepatic oxidative stress and triggered hepatic NLRP3 inflammasome activation with elevation of serum IL-1β and IL-18 levels in rats
As shown in Figure 3(a) to (b), serum and liver ROS levels were increased dramatically in 0.3 and 0.6 g/kg l-carnitine-fed female and male rats compared with the control group. In parallel, 8-week l-carnitine intake significantly upregulated hepatic rNLRP3, rASC and rCaspase-1 protein levels in both female and male rats (Figure 3(c) and (d)). Simultaneously, significant elevation of serum IL-1β (Figure 3(e)) and IL-18 (Figure 3(f)) levels was observed in these animals. These results suggest that l-carnitine-induced ROS in fatty acid β-oxidation may cause hepatic inflammation in rats.
Effects of l-carnitine supplementation on serum and liver ROS levels as well as hepatic rNLRP3, rASC, and rCaspase-1 protein levels in female and male Sprague Dawley rats. The animals were gavaged daily with water as control (Veh) and 0.3 and 0.6 g/kg l-carnitine for 8 weeks, respectively. Serum and liver ROS levels (a and b), hepatic rNLRP3, rASC, and rCaspase-1 protein levels (c and d) as well as serum IL-1β and IL-18 levels (e and f) in rats were showed, respectively. Protein levels were normalized by the abundance of rGAPDH protein and then represented relative to the mean value of control, respectively. Data were shown as mean ± SD (n = 6 for ROS, IL-1β, and IL-18 determination; n = 4 for Western blot analysis). *p < 0.05; **p < 0.01; ***p < 0.001: compared with control. ROS: reactive oxygen species; rNLRP3: NOD-like receptor 3; rASC: apoptosis-associated speck-like protein; IL-1β: interleukin-1β; IL-18: interleukin 18; rGAPDH: glyceraldehyde-3-phosphate dehydrogenase.
l-carnitine supplementation decreased renal lipid levels and caused kidney function disturbance in rats
Oil red O staining showed renal lipid depletion in l-carnitine-fed female and male rats (Figure 4(a)), in parallel with significant reduction of renal TG, TC, and VLDL levels (Table 2). Moreover, significant reduction of serum BUN level was detected in these rats (Table 1), without alteration of creatinine levels in serum and urine, as well as BUN in urine (data not shown). Kidney performs the essential function in mediating conservation, reabsorption and excretion of l-carnitine and other organic ions. Inflammation may change expression levels of organic ion transporters.13–17 In this study, l-carnitine greatly increased serum and urinary l-carnitine levels in both female and male rats at an obvious dose-dependent manner (Figure 4(b) and (c)). Importantly, 8-week supplementation of l-carnitine significantly decreased protein levels of its special transporter rOCTN-2 in both groups (Figure 4(d)) but failed to alter renal expression levels of major proteins participating in lipid metabolism (data not shown). Thus, l-carnitine-mediated renal rOCTN-2 downregulation may be associated with renal lipid level reduction in rats. Furthermore, l-carnitine at 0.3 and 0.6 g/kg significantly suppressed renal rOCTN-1, rOCT-1 and rOCT-2 protein levels in female and male rats (Figure 4(e) to (g)), suggesting that l-carnitine may have influence on renal reabsorption/excretion of l-carnitine, exogenous drugs or other toxic ions. These results demonstrate the potential induction of 8-week exogenous l-carnitine supplementation on rat kidney metabolism change, resulting in potential pressures on kidney function.
Effects of l-carnitine supplementation on renal lipid deposits, serum and urinary l-carnitine levels as well as renal rOCTN-1, rOCTN-2, rOCT-1 and rOCT-2 protein levels in female and male Sprague Dawley rats. The animals were gavaged daily with water as control (Veh) and 0.3 and 0.6 g/kg l-carnitine for 8 weeks, respectively. Kidney sections by oil red O staining from these groups at a magnification of ×200 (a). Serum and urinary l-carnitine levels (b and c) as well as renal protein levels of rOCTN-2 (d), rOCTN-1 (e), rOCT-1 (f), and rOCT-2 (g) in rats were showed, respectively. Protein levels were normalized by the abundance of rGAPDH protein and then represented relative to the mean value of control, respectively. Data were shown as mean ± SD (n = 6 for l-carnitine determination; n = 4 for Western blot analysis). *p < 0.05; **p < 0.01; ***p < 0.001: compared with control. rOCTN-1: renal organic cation/carnitine transporter 1; rOCTN-2: renal organic cation/carnitine transporter 2; rOCT-1: organic cation transporter 1; rOCT-2: organic cation transporter 2.
Discussion
It is generally accepted that l-carnitine as a nutrition element or weight control agent is used in foods for healthy humans. Recently, Koeth et al. evaluates pathological risks associated with the rapidly growing practice of l-carnitine consumption.4 High dietary l-carnitine supplementation in humans or mice is demonstrated to have close association with cardiovascular disease risk. Short-term supplementation of l-carnitine is dose dependently detrimental to isolated rat hearts before ischemia, having close relationship with incomplete fatty acid β-oxidation.21 These observations indicate the potential adverse effects of l-carnitine. It is known that adipose tissues participate in a wide range of physiological processes. WAT has the function of keeping the body warm and protecting the organ, which is being considered as a part of endocrine system involved in lipid metabolism.22 Reduction of an excessive body fat causes metabolic disturbance and tissue injury.2 This study further confirmed that oral administration of 0.3 and 0.6 g/kg l-carnitine for 8 weeks induced an obvious body weight reduction as well as WAT weight loss in subcutaneous and intra-abdominal tissues of rats, being consistent with other reports of the efficacy of l-carnitine supplementation for weight control.22,23 Accordingly, the results of biochemical parameter and histological analysis from this study revealed significant decline of lipid levels in serum, liver and kidney in l-carnitine-fed rats. Therefore, it is more important to investigate the possible disturbance of l-carnitine on major tissue function and metabolism in normal organisms.
The acceleration of fatty acid β-oxidation is the major biological activity of l-carnitine in clinical use or daily supplementation for overweight humans or animals. In this study, significant change of serum FFA levels revealed that l-carnitine promoted hepatic fatty acid β-oxidation in female and male rats. In fatty acid β-oxidation, the translocation of long-chain fatty acyl-CoA from cytosol to mitochondria is the rate-limiting step, which is catalyzed by CPT-1 and CPT-2 and regulated by ACC-2. PPAR-α as a nuclear hormone receptor is responsible for lipid metabolism by inducing mitochondrial fatty acid β-oxidation and directly upregulates OCTN-2 expression and increases l-carnitine uptake via OCTN-2 in liver.24 ACC-1, ACC-2, FAS and SCD-1 are crucial enzymes for de novo synthesis of lipids. Moreover, SREBP-1c is recognized as a key regulator of fatty acid and TG synthesis in the liver of rodents and humans. In this study, l-carnitine elevated protein levels of rPPAR-α, rCPT-1 and rCPT-2 as well as reduced protein levels of rSREBP-1c, rACC-1, rACC-2, rFAS and rSCD-1 in the liver of female and male rats. These expression changes caused hepatic fatty acid β-oxidation acceleration and lipid synthesis suppression in l-carnitine-fed rats, being consistent with hepatic histopathological changes revealed by oil red O staining analysis. Meanwhile, upregulation of hepatic rOCTN-2 protein levels increased l-carnitine uptake and further accelerated liver lipid metabolism disorder in these rats.
On the other hand, lipid oxidation acceleration generates adenosine triphosphate mainly in liver mitochondria via the electron transport chain, while ROS are produced correspondently.25 There is a link between ROS-related mitochondrial malfunction and chronic inflammatory diseases. The NLRP3 inflammasome is a molecular platform triggered by a variety of situations of cellular “danger,” including ROS overproduction.5–6 In this study, l-carnitine activated hepatic NLRP3 inflammasome components, being consistent with serum and liver ROS overproduction in rats. Therefore, high ROS levels produced by l-carnitine-mediated fatty acid β-oxidation triggered liver NLRP3 inflammasome activation. More importantly, serum levels of IL-1β and IL-18, two inflammatory injury biomarkers, were increased significantly in l-carnitine-fed female and male rats, disturbing liver function and injury. Abnormally high serum AKP level is recognized as a biomarker of liver injury or some degree of cellular integrity.26 In this study, high serum AKP levels were observed, confirming liver dysfunction and injury in l-carnitine-fed female and male rats. These results firstly demonstrated that 8-week exogenous l-carnitine supplementation-induced liver side effects included hepatic lipid metabolism disorder, ROS-mediated NLRP3 inflammasome activation, and inflammation response in female and male rats.
Moreover, 8-week supplementation of l-carnitine altered serum BUN levels in different sexual groups. Since l-carnitine alters the expression of glutamate dehydrogenase, which is involved in urea cycle, it seems likely that changes in BUN levels are independent from the effects of l-carnitine on kidney function but is caused by altered urea production in the liver.27l-carnitine homeostasis is maintained by acquisition of l-carnitine from dietary sources, modest endogenous carnitine biosynthesis and efficient reabsorption and excretion of l-carnitine in mammal kidney.28 OCTN-2 has a pivotal role in renal tubular reabsorption of l-carnitine and maintains blood l-carnitine levels.29 In juvenile visceral steatosis mice, high expression of OCTN-2 as well as low level of l-carnitine and lipids are simultaneously detected in spleen, kidney, liver, heart, and brown adipose tissues.30–32 Inflammatory signaling is confirmed to regulate expression of organic ion transporters.13–17 Downregulation of OCTN-2 expression is observed in patients with inflammatory disease15 and in rats with lipopolysaccharide exposure.14 OCTN-2 knockout mice develop intestinal and colonic inflammation to cause gut injury.13 Being responsible for serum IL-1β and IL-18 levels elevation, this study confirmed that l-carnitine markedly downregulated renal rOCTN-2 protein levels to promote elimination efficiency of l-carnitine in both female and male rats, which were consistent with renal lipid depletion as well as TG, TC and VLDL level reduction. However, l-carnitine failed to change renal expression levels of major proteins participating in lipid metabolism in rats. Therefore, 8-week exogenous l-carnitine supplementation reducted renal lipid levels possibly by alterating OCTN-2-mediated transmembrane transport of FFAs in mitochondrial.
Inflammation is also associated with OCT-1 and OCT-2 expression alterations with tissue injury. Significant reduction of OCT-1 gene expression is observed in vivo and in vitro models of liver inflammation16,33 as well as rodent model of lung inflammation.34 Lipopolysaccharide also induces reduction of rat kidney OCT-1 and OCT-2 mRNA and protein levels during endotoxemia.17 Moreover, expression reduction of renal rOCTN-1, rOCTN-2, rOCT-1 and rOCT-2, as well as dysregulation of renal rPPAR-α, rCPT-1, rACC-1 and rACC-2 are detected in aristolochic acid-induced nephropathy with kidney injury and lipid metabolic disorder in rats.35 This study showed that l-carnitine altered renal rOCTN-1, rOCT-1 and rOCT-2 protein levels in female and male rats. These observations indicate that l-carnitine may negatively affect renal reabsorption and excretion for exogenous drugs or toxics and then probably disturb renal metabolism function by its induction of systematic inflammation associated ROS in fatty acid β-oxidation acceleration. Therefore, these results may provide the evidence that 8-week exogenous l-carnitine supplementation-induced dysregulation of these renal organic ion transporters may contribute to kidney metabolism pressure with potential function disturbance in female and male rats.
Conclusion
This study firstly demonstrated the adverse effects of 8-week oral supplementation of exogenous l-carnitine on liver and kidney function in both female and male rats. l-carnitine supplementation induced rat liver inflammation response and injury possibly mediated by hepatic fatty acid β-oxidation acceleration-related ROS overproduction, NLRP3 inflammasome activation and serum IL-1β and IL-18 elevation. Furthermore, this systemic inflammation state of l-carnitine-fed rats may aggravate kidney absorption and excretion balance for l-carnitine or organic compounds in animals. For the application of l-carnitine in food supplementation, more studies on l-carnitine supplementation-induced adverse side effects with lipid metabolism disorder and major organ function disturbance should be carried out.
Footnotes
Authors’ Note
LDK derived the hypothesis. LDK, DMZ, and LL contributed to experimental design, data analysis, and manuscript writing. LL, MXW, CYF, FZ, and SJW conducted animal experiments, biochemical determination, histopathological study, Western bolting, and data analysis. LDK and DMZ edited the manuscript. LL and DMZ contributed equally to this work.
Conflict of interest
The authors declared no conflicts of interest.
Funding
This work was supported by grants from NSFC (no. 81373788, J1103512) and IRT14R27.
References
1.
ReboucheCJ. Carnitine. In: ShilsMEShikeMRossACCaballeroBCousinsRJ (eds) Modern nutrition in health and disease. 10th ed. Philadelphia: Lippincott Williams & Wilkins, 2006, pp. 537–544.
2.
FrühbeckG. Overview of adipose tissue and its role in obesity and metabolic disorders. Meth Mol Biol2008; 456: 1–22.
3.
GallowaySDCraigTPClelandSJ. Effects of oral l-carnitine supplementation on insulin sensitivity indices in response to glucose feeding in lean and overweight/obese males. Amino Acids2011; 41: 507–515.
4.
KoethRAWangZLevisonBS. Intestinal microbiota metabolism of l-carnitine, a nutrient in red meat, promotes atherosclerosis. Nat Med2013; 19: 576–585.
5.
FranchiLEigenbrodTMuñoz-PlanilloR. The inflammasome: a caspase-1-activation platform that regulates immune responses and disease pathogenesis. Nat Immunol2009; 10: 241–247.
6.
FritzJHFerreroRLPhilpottDJ. Nod-like proteins in immunity, inflammation and disease. Nat Immunol2006; 7: 1250–1257.
7.
MenzelCLSunQLoughranPA. Caspase-1 is hepatoprotective during trauma and hemorrhagic shock by reducing liver injury and inflammation. Mol Med2011; 17: 1031–1038.
8.
WangCPanYZhangQY. Quercetin and allopurinol ameliorate kidney injury in STZ-treated rats with regulation of renal NLRP3 inflammasome activation and lipid accumulation. PLoS One2012; 7: e38285.
9.
HuQHZhangXPanY. Allopurinol, quercetin and rutin ameliorate renal NLRP3 inflammasome activation and lipid accumulation in fructose-fed rats. Biochem Pharmacol2012; 84: 113–125.
10.
WangWWangCDingXQ. Quercetin and allopurinol reduce liver thioredoxin-interacting protein to alleviate inflammation and lipid accumulation in diabetic rats. Br J Pharmacol2013; 169: 1352–1371.
11.
LahjoujiKMitchellGAQureshiIA. Carnitine transport by organic cation transporters and systemic carnitine deficiency. Mol Genet Metab2001; 73: 287–297.
12.
TeinI. Carnitine transport: pathophysiology and metabolism of known defects. J Inherit Metab Dis2003; 26: 147–169.
13.
SonneSShekhawatPSMaternD. Carnitine deficiency in OCTN2−/− newborn mice leads to a severe gut and immune phenotype with widespread atrophy, apoptosis and a pro-inflammatory response. PLoS One2012; 7: e47729.
14.
LingBAlcornJ. LPS-induced inflammation downregulates mammary gland glucose, fatty acid, and l-carnitine transporter expression at different lactation stages. Res Vet Sci2010; 89: 200–202.
15.
WojtalKAElorantaJJHruzP. Changes in mRNA expression levels of solute carrier transporters in inflammatory bowel disease patients. Drug Metab Dispos2009; 37: 1871–1877.
16.
Le VeeMLecureurVStiegerB. Regulation of drug transporter expression in human hepatocytes exposed to the proinflammatory cytokines tumor necrosis factor-alpha or interleukin-6. Drug Metab Dispos2009; 37: 685–693.
17.
HeemskerkSWouterseACRusselFG. Nitric oxide down-regulates the expression of organic cation transporters (OCT) 1 and 2 in rat kidney during endotoxemia. Eur J Pharmacol2008; 584: 390–397.
18.
EnomotoANiwaT. Roles of organic anion transporters in the progression of chronic renal failure. Ther Apher Dial2007; 11: S27–S31.
19.
WalkerJB. Creatine: biosynthesis, regulation, and function. Adv Enzymol Relat Areas Mol Biol1979; 50: 177–242.
20.
AliSAFaddahLAbdel-BakyA. Protective effect of l-carnitine and coenzyme Q10 on CCl4-induced liver injury in rats. Sci Pharm2010; 78: 881–896.
21.
AdamczakMWiecekA. The adipose tissue as an endocrine organ. Semin Nephrol2013; 33: 2–13.
22.
DerosaGCiceroAFGaddiA. The effect of l-carnitine on plasma lipoprotein (a) levels in hypercholesterolemic patients with type 2 diabetes mellitus. Clin Ther2003; 25: 1429–1439.
23.
RahbarARShakerhosseiniRSaadatN. Effect of l-carnitine on plasma glycemic and lipidemic profile in patients with type II diabetes mellitus. Eur J Clin Nutr2005; 59: 592–596.
24.
MaedaTWakasawaTFunabashiM. Regulation of Octn2 transporter (SLC22A5) by peroxisome proliferator activated receptor alpha. Biol Pharm Bull2008; 31: 1230–1236.
25.
BrookesPSYoonYRobothamJL. Calcium, ATP, and ROS: a mitochondrial love-hate triangle. Am J Physiol Cell Physiol2004; 287: C817–C833.
26.
MusanaKAYaleSHAbdulkarimAS. Tests of liver injury. Clin Med Res2004; 2: 129–131.
27.
MusiccoCCapelliVPesceV. Rat liver mitochondrial proteome: changes associated with aging and acetyl-l-carnitine treatment. J Proteomics2011; 74: 2536–2547.
28.
ReboucheCJ. Kinetics, pharmacokinetics, and regulation of l-carnitine and acetyl-l-carnitine metabolism. Ann N Y Acad Sci2004; 1033: 30–41.
29.
TamaiIOhashiRNezuJI. Molecular and functional identification of sodium ion-dependent, high affinity human carnitine transporter OCTN2. J Biol Chem1998; 273: 20378–20382.
30.
OzakiKSanoTTsujiN. Carnitine is necessary to maintain the phenotype and function of brown adipose tissue. Lab Invest2011; 91: 704–710.
31.
LuKNishimoriHNakamuraY. A missense mutation of mouse OCTN2, a sodium-dependent carnitine cotransporter, in the juvenile visceral steatosis mouse. Biochem Biophys Res Commun1998; 252: 590–594.
32.
YokogawaKHigashiYTamaiI. Decreased tissue distribution of l-carnitine in juvenile visceral steatosis mice. J Pharmacol Exp Ther1999; 289: 224–230.
33.
HanafySEl-KadiAOJamaliF. Effect of inflammation on molecular targets and drug transporters. J Pharm Pharm Sci2012; 15: 361–375.
34.
LipsKSLührmannATschernigT. Down-regulation of the non-neuronal acetylcholine synthesis and release machinery in acute allergic airway inflammation of rat and mouse. Life Sci2007; 80: 2263–2269.
35.
LouYJLiJMLuY. Aristolochic acid-induced destruction of organic ion transporters and fatty acid metabolic disorder in the kidney of rats. Toxicol Lett2011; 201: 72–79.