
Abstract
Fungal growth in human foods and animal feeds causes profound damage indicating a general spoilage, nutritional losses, and the formation of mycotoxins. Thirty apparently contaminated maize and grass silage samples were analyzed for the presence of total fungi. Penicillium roqueforti were isolated from all (100%) moldy silage samples on general and selective culture media. Furthermore, P. roqueforti-positive samples culture media subjected to the toxin extraction and toxins of patulin, penicillic acid, mycophenolic acid, and roquefortin-C (ROQ-C) were identified by means of high-performance liquid chromatography method. Cytotoxicity of identified toxins was investigated on neuro-2a cells. Alamar blue reduction, neutral red uptake, and intracellular adenosine triphosphate (ATP) content assays indicated that patulin and ROQ-C exert the strongest and weakest toxicity, respectively. Reactive oxygen species (ROS) generation by the toxins-exposed cells was measured, and the results supported the mitochondrial and lysosomal dysfunction and ATP depletion in exposed cells. Our data suggest that P. roqueforti is the widely present mold in analyzed maize and grass silage samples, which is able to produce toxins that cause neurotoxicity. This finding may explain in part some neuronal disorders in animals, which are fed contaminated feedstuffs with mentioned fungus. Moreover, mitochondrial and lysosomal dysfunction, intracellular ATP depletion, and the excessive ROS generation were found as the mechanisms of cytotoxicity for P. roqueforti-produced toxins.
Introduction
One way of preserving grass and maize forage is ensiling, in which organic acids produced by lactic acid bacteria and low oxygen pressure prevent growth of many molds and bacteria. However, not uniform distribution of acids or failure to maintain a low oxygen pressure often induces the growth of microaerophilic acid-tolerant molds. Penicillium members are frequently isolated from foods and feeds and commonly found in temperate climates. Penicillium roqueforti is used as starter cultures for mold-ripened blue cheeses. 1 It has also been identified that P. roqueforti due to capability to grow on organic acids and low oxygen is the dominant fungus in silage samples. 2,3
Fungal growth in foods and animal feeds leads to substantial damage manifested as general spoilage, nutritional losses, formation of mycotoxins, and potentially allergic spores. Previous studies determined highly prevalence (40%) of P. roqueforti in sugar beet pulp, a residue of sugar extraction process, which is a high-energetic animal feed ingredient. This fungal growth is indicated by blue, green, red, yellow, or white layers, lumps, or surface discoloration. 4 Penicillium mainly grow on foods and feed during storage and are referred as storage fungi. 5 Another report using specific polymerase chain reaction methods showed that three major groups of toxigenic fungi like aflatoxin-producing Aspergilli, fumonisin- and trichothecene-producing Fusaria, and the ubiquitous mold of Aspergillus fumigatus are found in mature maize silage samples. 6
Likewise other fungi, in addition of nutritional spoilage of food and feedstuffs, P. roqueforti produces a variety of mycotoxins such as roquefortins (ROQ), patulin (PAT), mycophenolic acid (MPA), penicillic acid (PA), and P. roqueforti toxin (PR-toxin). Neurotoxicity of ROQs with clinical symptoms of ataxia, convulsions, muscle seizers, and tremors in dog has been reported. 7,8 Moreover, toxicity of PAT as mutagenic, immunotoxic, and neurotoxic 3 and PR-toxin as nephrotoxic, hepatotoxic, and cardiotoxic has long been documented. 9
Despite the tremendous evidence about the toxicity of PAT, including mechanism of toxicity on either in vivo or in vitro models, 10,11 there is little known about the other PR-toxins. Among the other toxins, toxicity and mechanism of toxicity of PA, MPA, and ROQ-C are not fully understood. Hence, we aimed to isolate and identify the major fungus from two commonly used maize and grass silages. To examine the toxicogenic potency of grown fungus in the selected medium, extraction of the purified grown colonies was conducted. To identify the produced mycotoxin(s), we performed high-performance liquid chromatography (HPLC) analyses using pure standard of each toxin. Furthermore, the cytotoxic effects of isolated mycotoxins from P. roqueforti (Figure 1) were investigated by using neuro-2a cells as a neuronal cell line and by means of several known cytotoxicity end points. The neuro-2a neuroblastoma cell-based bioassay has been already used to detect and distinguish several neurotoxic compounds. This cell line is suitable for neurotoxicity studies due to their high sensitivity and providing accurate estimate of neurotoxicity without any genetic manipulation. 12 Subsequently, the effect of toxins on reactive oxygen species (ROS) generation as a possible initiative pathway of toxicity was evaluated.

Chemical structure of isolated mycotoxins from Penicillium roqueforti.
Materials and methods
Chemicals
PAT, PA, MPA, ROQ-C, luciferase/luciferin (L/L) reagent, and diaminocyclohexane-N,N,N′,N′-tetra acetic acid were purchased from Sigma Chemical Co (St Louis, Missouri, USA). Chloroform, dichloromethane, ethyl acetate, formic acid, and methanol were obtained from Lab Scan-Ltd (Dublin, Ireland). Malt extract agar (MEA), MEA-lactate, peptone water, and saline normal were obtained from bioTRADING BENELUX B. V. (Mijdrecht, the Netherlands). 2′,7′-Dichlorodihydrofluorescein diacetate (H2DCF-DA) was obtained from Molecular probes (Leiden, The Netherlands). Alamar blue (AB) was supplied by Biosource International (the Netherlands B.V.). 3-Amino-7-dimethylamine-2-methyl-phenazine hydrochloride, Dulbeco’s modified Eagle’s medium (DMEM), penicillin and streptomycin, nonessential amino acids (NEAA), fetal calf serum (FCS), and trypsin–ethylenediaminetetraacetic acid were supplied by Invitrogen (Breda, the Netherlands).
Thirty maize and grass silage samples (each silage 15 samples) were collected from different farms around The Netherlands. Neuro-2a cells were obtained from ECACC (89121404, CAMR, Salisbury, UK).
Isolation and culture of fungi
Five grams of each chapped silage sample were added to 20 mL peptone water (0.1% wt/v) and kept at room temperature for 30 min. This mixture was then shaken slightly for 15 s and 1 mL was transferred on the surface of solid MEA medium. All silage samples (30 samples) were cultivated on MEA and P. roqueforti-positive samples recultivated on MEA-lactate as a selective medium for P. roqueforti at 25°C and in the humidified and dark environment for 7–14 days. At the end of 14 days, for identification of grown fungi, the plates were examined under light microscope according to the method followed by Samson et al. 13
Extraction of toxins
Analysis of secondary metabolites is a useful adjunct whenever any uncertainty exists with regard to the identification of certain fungus including P. roqueforti. Cultured extracts were prepared based on the method of Smedsgaard with minor modifications. 14 Five plugs of 14 mm diameter (approximately 153.86 mm2 of surface) were cut from five different sites of petri dishes that containing P. roqueforti colonies on selective medium. The plugs were transferred to a 15-mL glass tube and 5 mL of the solvent mixture methanol–dichlromethane–ethylacetate (1:2:3) containing 1% (v/v) formic acid was added. The plugs were extracted ultrasonically for 60 min. The extracts were filtered by 0.45 μm disposable syringe filter (25 mm; Alltech Associated Inc, Lokeren, the Netherlands). The extract was then transferred to a clean glass tube and the organic phase was evaporated to dryness under a gentle stream of nitrogen. The residues were redissolved ultrasonically for 15 min in 250 μL of mobile phase of HPLC analysis.
HPLC analysis
In order to analyze the extracted samples, HPLC analysis was performed according to the method designed by Muller and Amend 15 with minor modifications. In short, 50 μL from each extracted and redissolved solution was injected into a CHROMPACK Spherisorb 5 ODS-2 (250 × 4.6 mm2) column. The chromatographic system consisted of autosampler (Promis Autosampler Model ABI Analytical, Gynkotek Model Gina 50, Germering, Germany), and two separations high precision pumps (model 300). The mobile phase for isolation of PAT, PA, and MPA consisted from two parts of solution A (distilled water/glacial acid, 100/2, v/v) and solution B (distilled water/acetonitrile/glacial acid, v/v/v) and ROQ-C mobile phase, consisted of distilled water/ammonium dihydrophosphate/methanol (30%/0.575%/70%, v/w/v) at pH 5.9. Mobile phase was eluted at a flow rate of 1 mL/min for PAT, PA, and MPA in a gradient program of 11% solution B in first 10 min, followed by second 10 min with 45% solution B, and persuaded again with 11% solution B till end of run. Mobile phase was eluted at a flow-rate of 0.7 mL/min for ROQ-C. The ultraviolet detector was set at 240 nm for detection of PAT, PA, and MPA and at 328 nm for ROQ-C. Standard compounds were used for confirmation of extracted mycotoxins as shown in the chromatograms.
Cell culture and exposure to test chemicals
Neuro-2a cells were grown in DMEM supplemented with 10% FCS, 1% penicillin (100 units/mL), streptomycin (100 µg/mL), 1% NEAA, and 1%
AB reduction assays and NR uptake measurement
Cell viability was measured following treatment with mycotoxins using AB reduction assay according to Bull et al. 16 Briefly, following incubation with the test compounds, the medium was removed and the cells were washed with pre-warmed phosphate-buffered saline (PBS). Medium containing AB (diluted, 1:10) was added, and the cells were incubated for 3 h at 37°C. Fluorescence of reduced AB was measured using an excitation wavelength of 560 nm and an emission wavelength of 590 nm (Cytoflour 2300 Fluorescence Measurement System, Millipore Corp., Bedford, Massachusetts, USA).
To measure the lysosomal activity in neutral red (NR) uptake, the medium was removed after incubation of the cells with the test compounds and thereafter the cells were washed with pre-warmed PBS. NR destain solution (50% ethanol, 49% distilled water, and 1% acetic acid) was added to the cells and the plate containing the cells was shaken on the orbital shaker at room temperature for 15 min. Lysosomal uptake of NR was determined spectrophotometrically at 540 nm. Viability was expressed as: (A520 treated cells / A520 control cells) × 100.
Intracellular ATP level measurement
Following exposure to the test toxins for 24 h, the medium was removed, and the cells were washed with pre-warmed PBS and then lysis1× reagent (25 mM Tris-phosphate, pH 7.8, 2 mM dithiothreitol, 2 mM 1,2 diaminocyclohexane-N,N, N′,N′-tetra acetic acid, 10% glycerol, and 1% Triton X-100) was added to the cells, and the cells were shaken for a short time. L/L reagent was added to supernatant/lysis reagent, and luminescence was measured at 520 nm (Fluostar Optima, BMG Labtechnologies GmbH, Ortenbery, Germany). The relative light unit was expressed as: (A540 treated cells / A540 control cells) × 100.
Determination of ROS generation
Production of ROS was measured using H2DCF-DA, according to Hempel et al. 17 Briefly, neuro-2a cells were plated in 96-well culture plates. After 24 h, the cells were washed with pre-warmed PBS and pre-incubated for 60–80 min with 20 μM H2DCF-DA in 50 μL Krebs-Ringer phosphate glucose solution (10 mM glucose, 10 mM 4-(2-hydroxyethyl)-1-piperazineethanesulfonic acid, 140 mM sodium chloride, 5 mM potassium chloride, 1.8 mM calcium cloride, and 1 mM magnesium sulfate, pH 7.4). After the mentioned incubation time, H2DCF-DA solution was removed, and the cells were rinsed with PBS and treated with different concentrations of P. roqueforti mycotoxins. Following 24 h treatment, ROS production was measured using a spectofluorometer microplate reader at an emission wavelength of 538 nm and an excitation wavelength of 485 nm. Relative ROS production was expressed as an increase in fluorescence compared to fluorescence of the appropriate control (100%).
Statistical analysis
All data were expressed as mean ± SEM. Significance of difference effects between various concentrations of individual mycotoxin was determined using a one-way analysis of variance, and then Bonferroni test was used as post hoc test to comparison of the groups of data using Graphpad Prism software (Version 4.0). Differences were considered significant if p < 0.05.
Results
P. roqueforti was found as the widely present fungus of silage samples
All 30 silage samples (100%) including maize and gross samples were found P. roqueforti positive in both general and selective media (Table 1). P. roqueforti on MEA and in much more extend in MEA-lactate media was grown rapidly at 25°C and attained a diameter of 2–3 and 1–2 cm, respectively, within 14 days. The colony color of P. roqueforti was found initially bluish green, later becoming darker. Exudates and soluble pigment were absent on MEA (data not shown). Some other fungi, those were grown in MEA culture medium but not in MEA-lactate, are also listed in Table 1.
Fungi isolated from silage samples in MEA and MEA-lactate media.

MEA: malt extract agar.
Secondary metabolites of P. roqueforti were isolated from cultured medium and identified
Figure 2 shows the chromatograms belong to secondary metabolites of P. roqueforti, which were extracted from its selective growing medium. Chromatogram A shows three mycotoxins of PAT, PA, and MPA picks, which indeed are in accordance with standards, and chromatogram B represents the ROQ-C pick in parallel with provided standard. Retention time for PAT, PA, and MPA was 5.289, 8.78, and 18.15 min and for ROQ-C, 12.273 min, respectively. Obviously, in addition of mentioned metabolites that they were fitted with standard peaks, there are several other peaks, which are thought they might include the other mycotoxins such as PR-toxin, botryodiploidin, and other metabolites.

HPLC profile of Penicillium roqueforti produced secondary metabolites: (a) shows a chromatogram with three mycotoxins of PAT (1–5.289 min), PA (2–8.78 min), and MPA (3–18.815 min) and (b) represents a chromatogram with roquefortin-C (1–12.273 min). HPLC: high-performance liquid chromatography; PAT: patulin; PA: penicillic acid; MPA: mycophenolic acid.
PAT exerted the strongest cytotoxicity against neuro-2a cells
Cytotoxicity of mycotoxins, as tested by AB reduction showed a dose-dependent decrease in cell viability (Figure 3). The results indicated that cytotoxicity of test compounds are in following order: PAT > MPA > PA > ROQ-C. To compare the cytotoxic potency of tested toxins, half maximal inhibitory concentration (IC50) and inhibitory concentration at 10% (IC10) values were calculated and presented in Table 2. The estimated IC10 and IC50 values indicate that ROQ-C was the weakest (46.4 ± 1.6 and 85.1 ± 3.5 μM, respectively) and PAT was found to be the strongest (0.4 ± 0.01 and 8.7 ± 0.2 μM, respectively) tested toxins. We found the same order of cytotoxicity for PR-toxins on neuro-2a cell based on NR uptake measurement. The only remarkable difference was found in the estimated IC50 values, which unlike other toxins showed strong toxicity and lower IC50 values in the AB reduction assay, MPA showed lower IC50 value in NR uptake measurement.

PR-toxins’ cytotoxicity on neuro-2a cells according to: (a) AB reduction assay and (b) NR uptake measurement. ♦Data points indicate the mean of three independent experiments and error bars indicate the SEM. PR-toxin: Penicillium roqueforti toxin; AB: Alamar blue; NR: neutral red.
IC10 and IC50 (μM) values for PR-toxins on neuro-2a cells based on AB and NR assays.

IC10: inhibitory concentration at 10%; IC50: half maximal inhibitory concentration; PR-toxin: Penicillium roqueforti toxin; ROQ-C: roquefortin C; PAT: patulin; PA: penicillic acid; MPA: mycophenolic acid; AB: alamar blue; NR: neutral red.
PR-toxins depleted the intracellular ATP content of neuro-2a cells
The results of ATP-content assay demonstrated the same ranking of cytotoxicity for studied mycotoxins as AB reduction assay (Figure 4). Neither ROQ-C nor PA could inhibit the 50% of intracellular ATP generation. PAT showed the potent toxicity in reducing the intracellular ATP content for lowest examined concentrations of PAT, a significant reduction of ATP was occurred (p < 0.05).

ATP-content assay of neuro-2a cells after exposing to Penicillium roqueforti mycotoxins. ♦Data points show the mean values of at least three independent experiments and error bars indicate the SEM. ATP: adenosine triphosphate.
PR-toxins elevated the intracellular ROS generation in neuro-2a cells
All tested mycotoxins enhanced the level of ROS after 24-h exposure period (Figure 5). The ROS production after 24 h exposure against PR-toxins increased in a concentration-dependent fashion. The ROS generation following exposure to test toxins is consistent with AB reduction and the intracellular ATP assays. We found the highest level of ROS at 100 μM PAT exposure, while the least level of ROS was generated at 100 μM concentration of ROQ-C.

Effect of Penicillium roqueforti mycotoxins on the ROS generation in neuro-2a cells, Columns indicate the mean of three independent experiments and error bars show the SEM. ROS: reactive oxygen species.
Discussion
In this study, we showed that P. roqueforti is the widely present fungus, which is growing in the maize and grass silages and producing toxicogenic mycotoxins. Because of being 100% positive for P. roqueforti from all silage samples that were analyzed for fungi, it became obvious that there are favorite conditions for growing of fungi especially for P. roqueforti but apparently not favorite conditions for good sealing of animal feeds. Selective conditions for growing and toxin production of the mentioned fungus are temperature between 20°C and 25°C, pH between 5.6 and 6.8, and high water availability. It is thought that low pH is the first stimulator for growing of P. roqueforti in silage. P. roqueforti also grows in the presence of 5% lactic acid. It resumes active growth when the atmosphere in its environment contains at least 10% of the normal oxygen of the air. 18
Silage quality is influenced by microbial activities during production, storage, and feed out phase, and among the other microorganisms including homofermentative and heterofermantative lactic acid bacteria, Entrobacteria, species of Bacillus and Clostridium, and yeasts, 19,20 molds are also playing a very major role in sealing processes. Indeed, this study demonstrated that one of the key elements in silage production is P. roqueforti. Since lactic acid bacteria will quickly acidify the environment and prevent other competing organisms to survive, thus the end result will be stable and low pH silage; which might explain why P. roqueforti is the major fungus in silage. It has been demonstrated that P. roqueforti is the main fungus of sugar beet press silage. 15 Keller et al. reported that Penicillium species were dominant fungi that were presented in about two-third of the feed samples. 21
The production of mycotoxins in contaminated food and feeds following the fungal growth in most of the cases—if not all—can cause certain disorders in animals and humans, which is so called “mycotoxicoses”. In this study, four well-known and potentially toxic secondary metabolites of P. roqueforti were extracted and identified using HPLC. The production of PAT, MPA, and PA but not ROQ-C by contaminated maize silage has already been reported. 15 Nevertheless, in that particular study it has been addressed that the chance of detection under practical condition is low. Indeed, we could additionally demonstrate the production of ROQ-C by P. roqueforti which was isolated from maize and grass silage samples. Moreover, Schneweis et al. reported that MPA was detected in 74 of 233 grass and maize silage samples collected in Bavaria, Germany. 22
The second part of this study devoted to investigate the cytotoxic effects of isolated toxins from P. roqueforti on neuro-2a cells. Although the acute toxicity of P. roqueforti-produced toxins has been already reported, we however in this study performed studies such as the AB reduction assay and intracellular ATP content measurement to demonstrate their toxicity on neuronal cells. ROS generation as an approach to end up to cytotoxicity was also studied. We selected the neuro-2a cells as a model of neuronal cells because they contain higher intracellular levels of antioxidant defense factors and providing accurate estimate of neurotoxicity without any genetic manipulation. 23
All four studied mycotoxins caused toxic effects on mitochondrial function as demonstrated by AB reduction assay. Mitochondria are important cell apparatus, playing vital role in cell breathing, oxygen metabolism, enzyme activity, and energy supply. All of those functions are related to the permeability of the mitochondria and mitochondria transmembrane potential. 24,25 The oxidation–reduction potential of AB is +380 mV at pH 7.0; therefore, AB reduction in cells is a major indicator of nicotinamide adenine dinucleotide conversion and in a lesser extent of nicotinamide adenine dinucleotide phosphate, flavin adenine dinucleotide, and semiquinone Flavin mononucleotide (FMNH). 26,27
The potent toxic effect of PAT probably associated to multi-pathogenesis of PAT, including the inhibition of key transferral enzyme of sodium–potassium ions ATPase in cell membrane and main transcriptional enzyme of RNA polymerase. 28 There is lack of knowledge about the mechanism of PA and ROQ-C toxicity. However, relatively higher IC10 or IC50 values of both toxins in neuron-2a cells might explain that these two toxins possess a weaker cytotoxicity. At the same time, a lower IC50 value of MPA in NR uptake assay may indicate its mechanism of cytotoxicity and highlights its cytotoxicity via lysosomal disturbance.
The intracellular ATP content assay confirmed the results of previous end point, indicating the important role of mitochondrial activities in energy supply for cell survival. There are reports indicating that the determination of intracellular ATP content in live cells allows a real-time kinetic study and could be promising tool for high throughput drug screening and cytotoxicity assays. 29 As ATP plays a vital role in cellular metabolism, its intracellular level is tightly regulated in healthy cells. Therefore, early cell damage results in both decreased ATP synthesis and also rapid depletion of endogenous ATP caused by the release of ATP-converting enzymes such as ATPase. 30 Thus, measurement of the intracellular ATP content is critical for determining the status of cellular toxicity.
The increased level of ROS has been reported due to mitochondrial dysfunction and aberrant metabolism in cancer cells. 31 In order to better understand how mitochondrial activities are affected following exposing the selected cells against PR-toxins, and also make any link between the ATP depletion and cytotoxicity of mentioned toxins, the ROS production in exposed cells was performed. Our results showed that all of tested toxins enhanced the ROS generation at least at high studied concentrations, suggesting a pathway which the PR-toxins, and in particular, PAT with disturbing the mitochondrial function and later on ATP depletion or ATP reduction result in the ROS generation in neuro-2a cells.
In summary, our results indicate that P. roqueforti is the widely present fungus in maze and grass silages, which can be accompanied with other fungi such as Aspergilla and Mucor spp. Using selective medium for fungal isolation and HPLC method for further analyses of fungal extracts could be useful and inexpensive tools in mycology and mycopathology studies. Although the silage samples themselves were not analyzed for the presence of the toxins, toxins production in culture and high percent of positive samples for P. roqueforti suggest a high possibility of their presence in silage samples. Although, to date, published data indicate low bioavailability of PR-toxins in rodents (see Table 3), there are some concerns to avoid feeding of farm animals with heavily P. roqueforti-contaminated feed, due to possible accumulation of toxins in certain tissues including neuronal system and altering the gastrointestinal bacterial and protozoa population. Our results also suggest that the toxic effects as observed in animals following exposure to P. roqueforti-contaminated feeds could be attributed mainly to the presence of PAT, PA, MPA, and ROQ-C. The mitochondrial dysfunction, intracellular ATP depletion, and excessive ROS generation were the cytotoxic effects of P. roqueforti-produced toxins in neuro-2a cells.
Acute toxicity of PR-toxins in mouse.
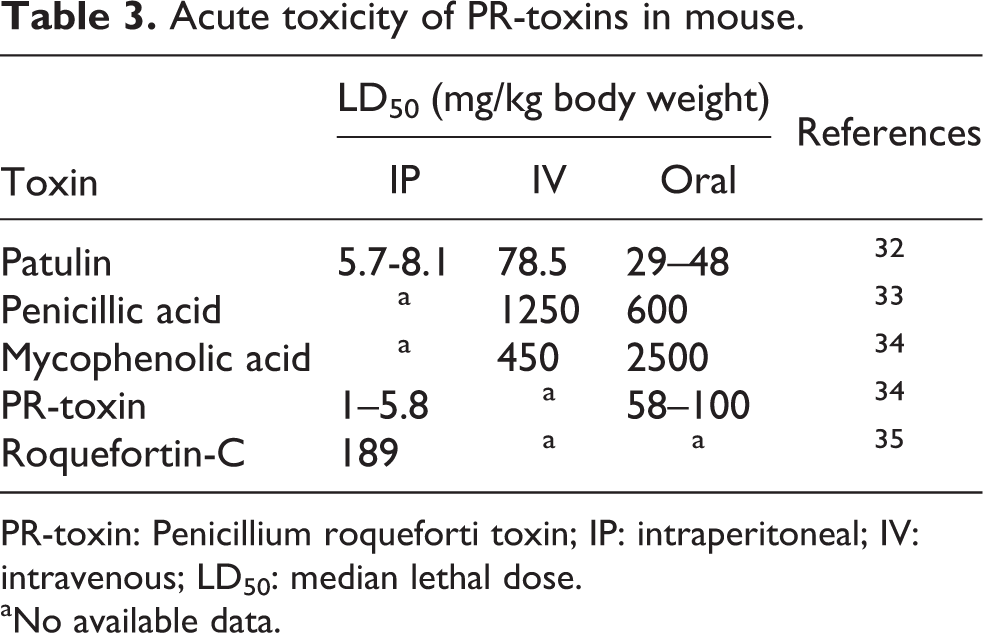
PR-toxin: Penicillium roqueforti toxin; IP: intraperitoneal; IV: intravenous; LD50: median lethal dose.
aNo available data.
Footnotes
Conflict of interest
The authors declared no conflicts of interest.
Funding
This research received no specific grant from any funding agency in the public, commercial, or not-for-profit sectors.