
Abstract
Chronic air pollution exposure during pregnancy can cause oxidative stress leading to adverse birth outcomes. The aim of this study was to assess and compare oxidative stress response in peripheral lymphocytes isolated from pregnant women from a highly industrialized locale (south Durban (SD); n = 50) and a control with lower air pollutant levels (north Durban (ND); n = 50). Oxidative stress response was measured by quantifying malondialdehyde (MDA) levels and a SuperArray gene panel. Mitochondrial function (adenosine triphosphate (ATP) levels and mitochondrial depolarization), DNA integrity (comet assay and mitochondrial DNA (mtDNA) viability) and DNA repair (OGG1) were assessed. Antioxidant response was assessed by quantification of glutathione (GSH) and SOD2, nuclear factor erythroid 2-related factor 2 (Nrf2) and uncoupling protein 2 (UCP2) protein and messenger RNA (mRNA) expression. Levels of MDA (p = 0.9), mitochondrial depolarization (p = 0.88), ATP (1.89-fold), SOD2 (1.23-fold) and UCP2 (1.58-fold) gene expression were elevated in the SD group with significantly higher UCP2 protein levels (p = 0.05) and longer comet tail length (p = 0.0004). The expression of Nrf2 protein (p = 0.03) and mRNA levels (−1.37-fold), GSH concentration (p < 0.0001), mtDNA amplification (−2.04-fold) and OGG1 mRNA (−2.78-fold) activity were decreased in the SD group. Of the 84 oxidative stress-related genes evaluated, 26 were differentially regulated. Pregnant women exposed to higher air pollutant levels showed increased markers for oxidative stress and compromised DNA integrity and repair.
Introduction
The south Durban (SD) basin in the province of KwaZulu Natal, South Africa (SA), is a mix of closely situated residential and heavy industrial areas. High air pollutant levels have been consistently observed in SD. As a consequence, adverse health outcomes are prominent in residents of the area. 1 The health concerns raised due to the toxic emissions from these industries has led to strict monitoring of air pollutant levels in the SD area. High levels of sulphur dioxide (SO2), nitrogen dioxide and nitrous oxide (collectively known as NO x ), carbon monoxide (CO), particle matter (PM10), ozone (O3) and lead have been recorded.2,3 These air pollutants have been implicated in free radical production, mitochondrial dysfunction and inflammation.4–7
The health risk that long-term exposure to ambient air pollution (AAP) poses to humans is increased due to the rapid expansion of industries. Examples of adverse health effects include asthma, chronic obstructive pulmonary disorders, decreased lung function, mitochondrial dysfunction and oxidative stress.4,7,8 The risk profile is exacerbated in pregnant women. Air pollution exposure can affect both mother and the developing foetus. Exposure to AAP during pregnancy has been associated with birth outcomes such as low birth weight, premature birth, and intrauterine growth retardation (IUGR). 9 The precise molecular mechanism that led up to AAP-associated health outcomes has not been clearly elucidated. Several adverse birth and health outcomes associated with AAP exposure have been attributed to oxidative stress. 10 Pregnant women are more susceptible to oxidative stress due to altered physiological processes and increased energy expenditure. 4,11
Mitochondria are the main source of endogenous reactive oxygen species (ROS). A potent-free radical, superoxide (O2 •−), is a natural by-product of mitochondrial respiration. Due to the close proximity of O2 •− production and lack of repair mechanisms, mitochondrial DNA (mtDNA) is highly susceptible to oxidative damage. 12 It is imperative that mechanisms are in place to regulate mitochondrial ROS production.
A group of mitochondrial anion carriers known as uncoupling proteins (UCPs) found in the inner mitochondrial membrane uncouple oxidative phosphorylation from adenosine triphosphate (ATP) synthesis. 13 UCPs increase the rate of electron transfer across the inner mitochondrial membrane and reduce mitochondrial membrane potential (Δψ m). Several homologues have been discovered, each displaying different tissue specificity and biological functions. 14 Uncoupling protein 2 (UCP2) is the most widely expressed UCP and has been shown to negatively regulate mitochondrial ROS production. 14 Studies have shown that O2 •− and products of lipid peroxidation are potent inducers of UCP2 expression.15–18 The proposed mechanism by which UCP2 reduces mitochondrial ROS production by increasing proton conduction across the inner mitochondrial membrane, thus lowering Δψ m. 14 This reduces mitochondrial O2 •− production.
Endogenous antioxidant systems such as superoxide dismutase (SOD), glutathione peroxidase (GPx), glutathione reductase (GR) and catalase (CAT) exist to reduce oxidative damage. These antioxidant enzymes are regulated at a transcriptional level by nuclear factor erythroid 2-related factor 2 (Nrf2). When intracellular ROS levels increase, Nrf2 translocates from the cytoplasm to the nucleus. Nrf2 binds to the antioxidant response element (ARE) in the nucleus and initiates transcription of antioxidant genes, including an important endogenous antioxidant and reduced glutathione (GSH). 19
Oxidative damage to DNA also initiates repair mechanisms. The formation of the 8-oxo-7,8-dihydro-2′-deoxyguanosine (8-oxodG) adduct initiates the base excision repair mechanism via 8-oxoguanine DNA glycosylase (OGG1). 20 Under the circumstances where oxidative stress outweighs the antioxidant defence system, the oxidative damage to biological molecules may lead to adverse health outcomes.
Identifying oxidative stress as a molecular mechanism in the aetiology of AAP-associated adverse health outcomes (IUGR and low birth weight) can lead to therapeutic interventions, such as administration of antioxidants. Despite the rapid pace of industrialization in Africa, very few studies have investigated biochemical markers in relation to oxidative stress and AAP exposure. The SD industrial basin presents the opportunity to investigate the health implications of long-term AAP exposure, especially in pregnant mothers. Normal pregnancy favours oxidative stress due to increased energy expenditure and physiological changes. 21 The close proximity of heavy industry to residential areas has led to the SD industrial basin being densely populated. This population also has a high population of pregnant females who are exposed to the emissions from the nearby industries. This pilot study investigated the biochemical markers for oxidative stress response in pregnant women from the SD industrial basin.
Methods
Study subjects
Pregnant women attending antenatal clinics in SD (n = 50) and the less industrialized north Durban (ND; n = 50) were recruited for the pilot of the Mother and Child in the Environment (MACE) cohort. Institutional ethical approval was obtained (BF023/09), and informed consent was obtained from each participant. The pregnant women selected were in the third trimester of pregnancy and resided in the given geographical location for the full duration of their pregnancy. Exclusion criteria included hypertension, diabetes, placenta pervia, genital tract infections and multiple pregnancies.
PBMC isolation
Peripheral blood mononuclear cells (PBMCs) and serum were isolated from heparinized whole blood by density gradient centrifugation. Equal volumes of blood and Histopaque 1077 (Sigma, Germany) were aliquoted into 15 ml conical tubes and centrifuged (400g, 30 min). The buffy coated layer containing the PBMCs was aspirated and washed twice with 0.1 M phosphate-buffered saline (PBS; 400g, 10 min). Similarly plasma was aspirated. Serum and PBMCs were stored at −85°C.
Lipid peroxidation
Lipid peroxidation was used as a marker of oxidative stress. The thiobarbituric acid reactive substances (TBARS) assay was performed to quantify malondialdehyde (MDA) as per the method described by Halliwell and Gutteridge. 22 Then, 500 µl of plasma was added to glass tubes containing 400 µl of 7% phosphoric acid and 400 μl of thiobarbituric acid (1%, w/v)/0.1 mM butylated hydroxytoluene solution (TBA/BHT). A positive control was prepared containing 1 µl of 1% MDA and a blank was prepared (400 µl of 3 mM hydrochloric acid (HCl)). Samples were boiled for 15 min and cooled to room temperature (RT). Butanol (1.5 ml) was added to each tube. The tubes were vortexed, and the solution was allowed to settle into two phases. The butanol phase was aspirated and centrifuged (840g, 10 min) before being transferred to a 96-well microtitre plate (200 µl well−1 in triplicate). Absorbance of the samples was read using a spectrophotometer, λ = 532/600 nm (Bio-Tek µQuant, USA). MDA concentrations were calculated by dividing the mean absorbance of the samples by the absorption coefficient (156 mM−1).
Adenosine triphosphate
ATP was measured by the luminometric Cell Titer-Glo® assay (G775A, Promega, Madison, Wisconsin, USA). Cells were aliquoted in a white microtitre plate (20,000 cells per well) in a 1:2 ratio with ATP Cell Titer-Glo® Reagent . The plate was incubated for 30 min at RT. Luminescence was measured on a Modulus™ microplate luminometer (Turner BioSystems, Sunnyvale, California, USA). Luminescence is proportional to ATP concentration and was expressed as relative light units (RLU).
Mitochondrial depolarization
The percentage Δψ m was measured using fluorescence-activated cell sorting (FACS) and JC-1 Mitoscreen (BD Biosciences, Franklin Lakes, New Jersey, USA). Briefly, JC-1 stock solution was diluted in 1× assay buffer (37°C) to make up a working solution. Approximately 10,000 cells from each sample were transferred to polystyrene cytometry tubes. JC-1 dye (150 μl) was added to each tube, and the cells were incubated for 10 min at 37°C, 5% carbon dioxide. Cells were washed in JC-1 Mitoscreen wash buffer (400g, 5 min). Cells were then resuspended in 300 μl of flow cytometry sheath fluid. A FACSCalibur (BD Biosciences) flow cytometer and CellQuest PRO v4.02 software (BD Biosciences) were used to capture and analyse data of the stained cells. Cells were gated using FlowJo v7.1 software (Tree Star Inc., Ashland, Oregon, USA).
Comet assay
The comet assay was performed using an in-house protocol to determine DNA fragmentation. 23 Briefly, slides were prepared with 1% low-melting point agarose (LMPA). Fresh whole blood (25 µl) was mixed in 0.5% LMPA gel (200 µl) and added to the prepared slides. Once the gel had set, the slides were submerged in cell lysis buffer (2.5M sodium chloride, 100 mM ethylenediaminetetraacetic acid (EDTA), 1% Triton X-100, 10 mM Tris (pH 10), 10% dimethyl sulphoxide) for 1 h at 4°C. Following lysis, the slides were equilibrated in electrophoresis buffer [300 mM sodium hydroxide, 1 mM disodium salt of EDTA (pH 13)] for 20 min before a 300-mA current was applied for 35 min. The slides were washed with neutralization buffer (0.4 M Tris; pH 7.4) and stained with ethidium bromide (20 µg ml−1). The slides were left to incubate overnight at 4°C. Images were captured using a fluorescent microscope (filter 4; Olympus IXSI inverted microscope, Japan) with 510–560 excitation and 590 emission filters. Images included at least 50 comets per sample.
mtDNA viability
DNA was isolated from whole blood as per the method described by Sambrook and Russell. 24 Isolated DNA was quantified using the Nanodrop 2000 spectrophotometer and standardized to 5 ng µl−1. A reaction volume of 25 µl consisting of 12.5 µl SYBR Green Supermix (BioRad), 10 pmol of forward and reverse primer (Table 1) and approximately 10ng DNA template made up in nuclease-free water. A reference gene, β-Globin (Table 1), was amplified under the same conditions. Initial denaturation was applied (94°C; 3 min), followed by 28 cycles of denaturation (94°C; 20 s); annealing (58°C; 10 min), extension (72°C; 10 min) and a plate read. This was followed by a melt curve and a final hold (25°C; 5 min).
Primer sequences for qPCR and PCR-RFLP.
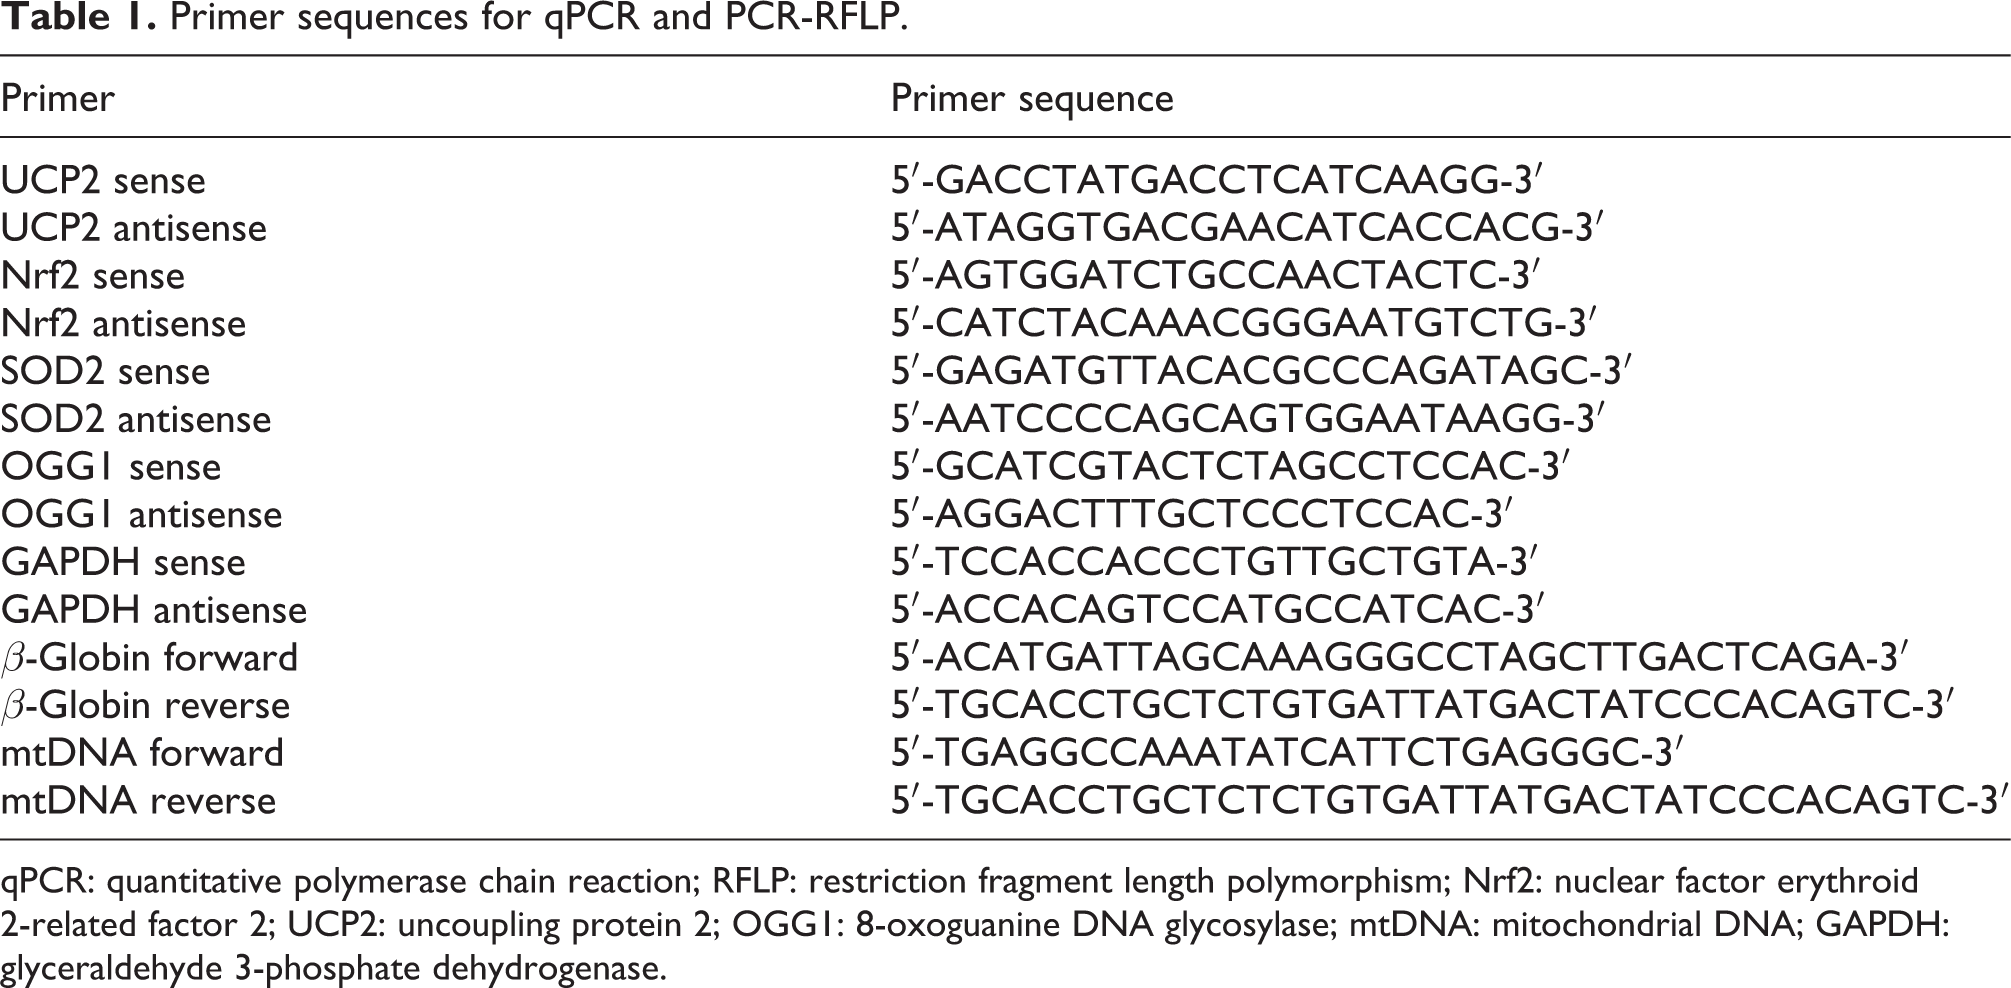
qPCR: quantitative polymerase chain reaction; RFLP: restriction fragment length polymorphism; Nrf2: nuclear factor erythroid 2-related factor 2; UCP2: uncoupling protein 2; OGG1: 8-oxoguanine DNA glycosylase; mtDNA: mitochondrial DNA; GAPDH: glyceraldehyde 3-phosphate dehydrogenase.
Reduced GSH
GSH was measured by the GSH-Glo™ glutathione assay (V6911, Promega) as per the manufacturer’s instructions. Briefly, six GSH standards were prepared (0–50 µM) so as to derive a standard curve to extrapolate GSH concentrations (in micomolar) for the patient samples. Then, 50 µl of cell suspension (20,000 cells)/standard solution was aliquoted in a white microtitre plate. Again, 50 µl GSH-Glo™ reagent was added per well and incubated for 15 min. Luminescence was measured on a Modulus™ microplate luminometer (Turner BioSystems).
RNA isolation and cDNA synthesis
Complementary DNA (cDNA) was synthesized from RNA for quantitative polymerase chain reaction (qPCR). Total RNA was isolated from 500,000 PBMCs per subject using an in-house protocol. Equal volumes of cell suspension and TRIzol reagent were mixed and incubated overnight at −80°C. Chloroform (100 µl) was added, mixed vigorously and centrifuged (15 min, 2000g, 4°C). The aqueous phase was transferred into clean 1.5 ml tubes containing 250 µl isopropanol and incubated overnight at −80°C. Following centrifugation (20 min, 12,000g, 4°C) the supernatant was removed and each pellet was washed with 75% ethanol (7,400g, 4°C, 15 min). The ethanol was aspirated, and the samples were allowed to air-dry. RNA was reconstituted in 12.5 µl of nuclease-free water. RNA concentrations were determined (Nanodrop 2000) and standardized to a concentration of 1000 ng µl−1.
RNA was then pooled according to the geographical location of the patients (ND and SD) and converted to cDNA using the iScript™ cDNA synthesis kit (BioRad; cat. no. 107-8890). A reaction volume of 20 µl containing 4 µl of 5× iScript reaction mix, 1 µl of iScript reverse transcriptase and 2000 ng of RNA template were made up in nuclease-free water. Thermocycler conditions for cDNA synthesis were 25°C for 5 min, 42°C for 30 min, 85°C for 5 min and a final hold at 4°C.
Oxidative stress gene expression
qPCR was used to determine the relative expression of 84 genes involved in oxidative stress response in women from ND and SD. A commercially available PCR array was used (RT2 Profiler Human Oxidative Stress and Antioxidant Defence PCR Array; Qiagen, Netherlands). cDNA template from women from ND and SD was diluted and added to qPCR master mix (RT2 SYBR Green; Qiagen) according to the manufacturer’s instructions in a 96 well PCR array plate. Thermocycler conditions were initial denaturation at 95°C for 10 min, followed by 40 cycles of 95°C; 15 s and a plate read for 1 min at 60°C. Five standard internal housekeeping genes were used for the calculation of fold change using the Qiagen online analysis software.
UCP2, Nrf2, SOD2 and OGG1 mRNA expression
Antioxidant gene expression (UCP2, Nrf2 and SOD2) and oxidative DNA damage (OGG1) was evaluated by qPCR. The commercially available kit, iQ™ SYBR® Green Supermix (BioRad, 170-880) was used to measure mRNA expression of the genes. Briefly, 4 µl of cDNA template was added to 30 nM of sense primer, 30 nM antisense primer (Table 1), 5X iScript reaction mix and nuclease-free water in a final reaction volume of 25 µl. Initial denaturation was conducted at 95°C for 4 min, followed by 37 cycles of denaturation (95°C; 15 s), annealing (57°C; 40 s), extension (72°C; 30 s) and a plate read for 37 cycles.
All qPCR’s were conducted using the CFX96 Touch™ Real-Time PCR Detection System (BioRad). Analysis was performed, as described by Livak and Schmittgen 25 to calculate fold change (2−ΔΔCt). A housekeeping gene (glyceraldehyde 3-phosphate dehydrogenase) was amplified under the same conditions.
Western blot
Protein expression of UCP2 and Nrf2 were determined using Western blots. Briefly, 200 µl of Cytobuster (Novagen, South Africa) supplemented with protease and phosphatase inhibitors (Roche, Switzerland) was added to isolated PBMCs and kept on ice for 30 min before being centrifuged (13,000g, 10 min).The crude protein was quantified using the bicinchoninic assay. All protein samples were standardized to 0.5 mg ml−1 (λ = 562 nm). Laemmeli buffer (dH2O, 0.5 M Tris–HCl (pH 6.8), glycerol, 10% sodium dodecyl sulphate (SDS), β-mercaptoethanol and 1% bromophenol blue) was added to the samples (1:1 ratio) and boiled for 5 min. Samples were separated by electrophoresis on a SDS polyacrylamide gel (4% stacking, 10% resolving) for 1 h at 150 V. The separated proteins were transferred to a nitrocellulose membrane using the TransBlot Turbo Transfer System (BioRad) at 400 mA for 45 min. Membranes were incubated in a blocking solution of 5% bovine serum albumin (BSA) in Tween 20-Tris-buffered saline (TTBS) for 1 h at RT. The membranes were incubated with primary antibody (goat anti-UCP2 (ab77363), rabbit anti-Nrf2 (ab31163) 1:1 000 in 1% BSA) for 1 h at RT and then overnight at 4°C. The membranes were washed five times with TTBS (10 min) before being incubated in horseradish peroxidise (HRP)-conjugated secondary antibody (rabbit anti-goat (ab6742); goat anti-rabbit (ab6112) 1:10,000 in 1% BSA) for 1 h at RT. The membranes were then washed five times in TTBS (10 min). LumiGLO® chemiluminescent substrate system (KPL, USA) was used to detect protein bands. Images were captured using chemiluminescence documentation system Alliance 2.7 (Uvitech). Relative band density (RBI) was measured by densitometric analysis Uvitech Alliance Analysis software.
Membranes were stripped with 5% hydrogen peroxide (H2O2), incubated in blocking solution (3% BSA; 1 h; RT), rinsed twice in TTBS and probed with HRP-conjugated anti-β-actin (Sigma, St Louis, Missouri, USA). The RBI is reported relative to the loading control and housekeeping protein β-actin.
Statistical analysis
Statistical analyses were performed using the GraphPad Prism V5 software package (GraphPad Software Inc., San Diego, California, USA). All data sets were assessed for Gaussian distributions using the D’Agostino and Pearson omnibus normality test. Comparisons between SD and ND were done by performing Mann–Whitney U tests (non-parametric distributions).
Results
Mitochondrial integrity
A −2.04-fold change in amplification of mtDNA was observed in the SD group. ATP levels and percentage Δψ m of the pregnant women were used as an indicator of mitochondrial and UCP2 function, respectively. Mitochondrial depolarization (Table 2; p = 0.88) and ATP levels were higher in the SD women than in the ND group (Table 2).
Biochemical markers of oxidative stress in pregnant women from ND (control) and SD.

Nrf2: nuclear factor erythroid 2-related factor 2; UCP2: uncoupling protein 2; RBI: relative band density; ATP: adenosine triphosphate; MDA: malondialdehyde; GSH: glutathione; mtDNA: mitochondrial DNA; SD: south Durban; ND: north Durban.
ap < 0.05: compared with ND.
Oxidative stress and DNA damage
The level of systemic oxidative stress (as indicated by lipid peroxidation measured by MDA levels) of pregnant mothers was higher in the SD group compared with the ND (p = 0.89; Table 2). Oxidative DNA damage was evaluated by measuring the activity of base excision repair gene, OGG1, in response to the 8-oxoG adduct formation. The SD group had a −2.78-fold lower expression of OGG1 compared to the ND control group (Figure 1). Results from the comet DNA fragmentation assay showed significantly longer comet tails in women from SD than ND (p = 0.0004; Table 2).

Messenger RNA expression of antioxidant response genes (Nrf2, SOD2, UCP2) and base excision repair response to oxidative DNA damage (OGG1). Nrf2: nuclear factor erythroid 2-related factor 2; OGG1: 8-oxoguanine DNA glycosylase.
Oxidative stress gene response
Oxidative stress gene expression was evaluated in 84 genes, with a fold change >2.0 being considered significantly different (Table 3). Of the 84 genes evaluated, 3 genes showed significantly lower expression (GSS, B2M and ANGPTL7), whilst 26 genes involved in oxidative stress response and antioxidant defence were significantly up-regulated in the women from SD compared to ND. The significantly higher expression of genes in women from SD included three glutathione peroxidases (GPX7, GPX2 and GSTZ1), six peroxidases (EPX, PXDNL, PXDN, MPO, LPO and TPO), two antioxidants (ALB and SRXN1), four genes involved in O2 •− metabolism (NOX5, ALOX12, NCF2 and NOS2), two genes involved in ROS metabolism (AOX1 and MPV17) and six genes associated with oxidative stress response (SIRT2, MBL2, OXSR1, OXR1, NUDT1 and DUOX2).
SuperArray gene panel data on oxidative stress response gene expression of women from south Durban.

NADPH: nicotinamide adenine dinucleotide phosphate.
Antioxidant response
Endogenous antioxidant, GSH was significantly depleted in the SD group (p < 0.0001; Table 2). Western blot and qPCR results, assessing antioxidant response, showed that Nrf2 was significantly depleted in women from SD at both the protein level (p = 0.03, Table 2) and transcriptional level (−1.37-fold; Figure 1). The antioxidant enzyme, SOD2, which is regulated by Nrf2, showed 1.23 higher transcriptional activity in women from SD than those from ND (Figure 1). Mitochondrial ROS regulator, UCP2, was significantly elevated in SD women at both the transcriptional (1.58-fold; Figure 1) and protein level (p = 0.049; Table 2). Images for the Western blot results are shown in Figure 2.

Protein expression from Western blot for mitochondrial protein UCP2 and antioxidant transcription factor Nrf2. Nrf2: nuclear factor erythroid 2-related factor 2; UCP2: uncoupling protein 2.
Discussion
In this study, pregnant females (from SD and ND) exposed to varying levels of ambient pollution were compared using markers of oxidative stress and oxidative DNA damage. The results show that oxidative stress and DNA damage markers were significantly higher in the SD pregnant women who are exposed to higher levels of pollutants. This is the first study in Africa to assess a panel of 84 genes associated with oxidative stress, with 26 genes significantly up-regulated by at least twofold in the higher exposed group (SD).
Previous studies in the SD industrial basin found associations between air pollutants (SO2, PM10, NO x ) and the incidence of asthma in children of school-going age. 1,3,26 The association of AAP exposure with oxidative stress markers in pregnant women has not been assessed in SD. The exact mechanism by which AAP causes adverse health outcomes is difficult to determine as interactions between pollutants and variations in pollutant levels between different environments need to be taken in to account. Oxidative stress has been identified as a molecular mechanism in AAP-associated adverse health and birth outcomes. 9,10,27 If oxidative stress plays a role in AAP toxicity, genes involved in oxidative stress response could influence susceptibility to AAP-associated health outcomes.
Women from SD are exposed to higher levels of pollutants that are associated with inducing free radical production. 2 PM10 has been recognized as a potent stimulus for mitochondrial ROS production via disruption of the mitochondrial ETC. 27 SO2 was found to elevate MDA levels 28 and deplete the antioxidant, vitamin C, in plasma. 29 Upon inhalation, NO x dissolves in lung-lining fluid and is converted to a free radical in solution. 4 We set out to determine whether pregnant women from SD displayed elevated markers for oxidative stress and damage than those from the less industrialized ND.
Twenty six genes related to oxidative stress related genes were up-regulated at least twofold in the SD group strongly suggests that AAP contributes to the enhanced adaptive response of immune cells to oxidative stress. This was noted by the increased MDA levels (Table 2) and the genes associated with O2 •− production (AOX1, NOX5 and DUOX2) were significantly up-regulated (Table 3). In addition, the elevated ATP levels and Δψ m (Table 2) in the SD group will favour mitochondrial free radical production as increased ATP production promotes O2 •− production via the ETC. 16 mtDNA is not associated with histones and is susceptible to oxidative damage. The close proximity of mtDNA to the ETC may explain why the SD group had only half as much viable mtDNA in comparison with the ND group (Table 2). Higher ROS production in the SD group increases oxidative damage to mtDNA and reduces the amount of viable mtDNA for successful amplification, which was also observed in a previous study. 30
Elevated levels of ROS may lead to DNA lesions. The SD group had significantly longer comet tails which may be due to the increased levels of ROS. MDA has a high affinity for deoxyguanine and deoxyadenine in DNA contributing to DNA lesions. 31 Interaction of free radicals, such as O2 •−, with DNA results in the formation of the 8-oxodG adduct, which in turn activates the OGG1 base excision repair mechanism. 20 The SD group had lower expression of the OGG1 gene, an indication of compromised DNA repair. This may explain the increased DNA fragmentation in this group.
The longer comet tail lengths in the SD group may also be attributed to the unwinding of DNA due to increased gene expression or increased apoptosis. As noted in the SD group, several genes related to oxidative stress response and antioxidant defence were up-regulated. The up-regulation of ALOX1 was associated with increased apoptosis and depleted GSH. 32 The SD group had higher expression of ALOX1 and lower expression of GSS (Table 3), which catalyzes the second step in GSH synthesis. This is supported by significant depletion of GSH in the SD group (Table 2). Furthermore, apoptosis, being an active process, requires ATP, and this may explain elevated ATP levels in the SD group.
The SD group also had increased SOD2 mRNA and UCP2 mRNA and protein expression (Figure 1), further indicating an endogenous biological response to higher levels of O2 •−. Superoxide is a potent stimulator of UCP2 expression. When O2 •− levels increase, UCP2 alters mitochondrial membrane proton conductance to limit ATP production and thus decrease O2 •− generation. 16 The major antioxidant enzyme involved in the detoxification of mitochondrial O2 •− is SOD2, which is converts O2 •− to H2O2. 33 The increased expression of both SOD2 and UCP2 in the SD group indicates that these pregnant women were responding to higher levels of ROS. Further evidence to substantiate elevated ROS in the SD group is the increased expression of several peroxidase genes involved in H2O2 metabolism such as GPX7, GPX2, GSTZ1, EPX, PXDNL, PXDN, MPO, LPO and TPO (Table 3).
The transcription factor Nrf2 is regarded as the master regulator of antioxidant response genes. The SD group had decreased levels of Nrf2 mRNA expression (Table 2), with significant decline in Nrf2 protein expression (Table 2). The significantly lower GSH levels in the SD group could be due to the depletion in Nrf2, as Nrf2 is required for the transcription of GSH. The binding of Nrf2 to the ARE is an early response to oxidative stress. 34 The women from SD have been exposed to pro-oxidant air pollutants over a long period of time. Previous studies have found that long-term exposure to oxidative agents causes reduced expression of an Nrf2-stabilizing protein DJ-1. 31 This protein also acts as a scavenger for free radicals; hence a possible reason for the decline in Nrf2 expression in women from DS may be due to depleted DJ-1. This may also explain the threefold increase ALB expression (Table 3). Albumin, albeit being an important transport protein, is also a circulating antioxidant. 35
Conclusion
From this study, we can conclude that women from the more industrialized SD displayed higher markers for oxidative stress and compromised DNA repair mechanisms. This study suggests that women with higher exposure to air pollutants not only have increased response to oxidative stress but also show markers for increased O2 •− production and mitochondrial-derived ROS. This indicates that air pollution exposure during pregnancy does increase the susceptibility of mothers to oxidative stress, which may contribute to the understanding of the aetiology of adverse health outcomes that are associated with air pollution exposure. The integrity of mitochondrial function and endogenous antioxidant systems are imperative to maintaining cellular ROS levels that may become elevated in the presence of air pollutants.
Footnotes
Acknowledgements
The author would like to acknowledge the National Research Foundation (Grant UID: 80257), Medical Research Council and College of Health Science, UKZN for funding during this study.
Conflict of interest
The authors declared no conflicts of interest.
Funding
This research received no specific grant from any funding agency in the public, commercial or not-for-profit sectors.