
Abstract
The purpose of this study was to investigate the long- and short-term inflammatory and apoptotic effects of whey protein on the livers of non-exercising rats. Thirty rats were divided into three groups namely (1) control group, (2) short-term whey (WS) protein diet (252 g/kg for 5 days), and (3) long-term whey (WL) protein diet (252 g/kg for 4 weeks). Interleukin 1β (IL-1β), IL-6, tumor necrosis factor α (TNF-α), and cytokeratin 18 (CK-18-M30) were assessed using enzyme-linked immunosorbent assay and immunohistochemical methods. Apoptosis was evaluated using the terminal transferase-mediated deoxyuridine triphosphate nick-end labeling (TUNEL) method. Hepatotoxicity was evaluated by quanitation of serum aspartate aminotransferase (AST) and alanine aminotransferase (ALT). Based on the biochemical levels and immunohistochemical results, the highest level of IL-1β was identified in the WL group (p < 0.01). The IL-6 and TNF-α results were slightly lower in the WS group than in the control group and were highest in the WL group (p < 0.01). The CK-18-M30 and TUNEL results were highest in the WS group and exhibited medium intensity in the WL group (p < 0.01). AST results were statistically significant for all groups, while our ALT groups were particularly significant between the WL and control groups (p < 0.01). The results showed that when whey protein is used in an uninformed manner and without exercising, adverse effects on the liver may occur by increasing the apoptotic signal in the short term and increasing inflammatory markers and hepatotoxicity in the long term.
Introduction
Most athletes and bodybuilders use protein supplements to enhance the development and strength of their muscles and to accelerate the release of growth hormone. 1 Casein, whey, and soy proteins are the most popular protein supplements. Whey protein is the most frequently used protein because it has a higher caloric value and increases muscle mass. Whey protein contains total cow’s milk protein (approximately 20%), lactoglobulin (50%), β-lactalbumin (25%), serum albumin (7%), and immunoglobulins (5%). Due to the high concentrations of amino acid chains in its structure, whey protein plays a significant role in the protein synthesis and carbohydrate metabolism that supply energy requirements during exercise. 2 Glycogen stores in the liver are depleted after exhausting and prolonged exercise. 3 Maintaining adequate stores of tissue glycogen is therefore important in sports-related situations. Although whey protein is considered an effective supplement for tissue glycogen and the liver during exercise, 4 no previous studies have investigated the harmful effects on the liver caused by consuming protein diets without exercise. It is generally agreed that milk proteins play an important role in the durability of the immune system, antibacterial protection, in vitro antioxidative mechanisms, and the restoration of damaged gastrointestinal tissues. 5 –7 One benefit of whey protein is that it has a protective effect against experimental colorectal cancers and reduces aberrant crypt foci. 8 Despite the beneficial effects of whey protein, however, its potential effects on the liver in case of chronic use without exercising are unknown.
The protection and regeneration of the liver is a systemic inflammation-dependent complex associated with the release of a variety of cytokines. Tumor necrosis factor α (TNF-α), interleukin 1β (IL-1β), and IL-6 are the pro-inflammatory cytokines that are of critical importance. These molecules are released into systemic circulation in case of aggressive stimuli, such as in postoperative complications and infectious processes, and the extent of this response depends on the severity of aggression. 9
Hepatocellular apoptosis has been proven to play the major role in chronic hepatic diseases. 10 Cytokeratin 18 (CK-18-M30) is a major cytoplasmic intermediate filament for hepatocytes. Serum levels in chronic liver diseases become elevated as a result of hepatic inflammation, and their expression is considered an indication of the cellular apoptotic process. 11
In this study, the effects of whey protein on inflammatory liver cytokine levels in young adult male rats were evaluated by investigating IL-1β, IL-6, and TNF-α. The presence of apoptosis was measured using CK-18-M30 levels and the terminal transferase-mediated deoxyuridine triphosphate nick-end labeling (TUNEL) method. Hepatotoxicity was evaluated by quantitation of serum aspartate aminotransferase (AST) and alanine aminotransferase (ALT). This is also the first study to show inflammatory and apoptotic differences between long- and short-term whey protein applications in unexercised rats in terms of liver injury.
Materials and methods
Experimental animals
Young male Wistar albino rats were used. All rats were kept in the Ege University Experimental Animals Center, Turkey, at a constant room temperature (21–22°C) under a 12-h dark/12-h light cycle. All animal experiments were carried out in accordance with the European Communities Council Directive of 24 November 1986 (86/609/EEC) and were approved by the Animal Care Committee of Ege University.
Feeding
The experimental whey diet (15% kcal fats, 24% kcal protein, and 61% kcal carbohydrate) was prepared in accordance with the AIN-93 protocol 12 ; Table 1 shows the ingredients. Protein content, calculated as nitrogen concentration multiplied by 6.38, was measured using Kjeldahl’s method. 13 Whey protein (79.3 g crude protein/100 g) was added in the form of 200 g/kg protein.
Composition of the whey protein diet in gram per kilogram.a

aResearch Diets Co. Ltd, New Brunswick, New Jersey, USA.
Experiment protocol
A total of 30 young male Wistar albino rats (n = 10 per group) weighing approximately 170 g were used in the study and were allowed food and water ad libitum. These rats were randomized into three groups as control group (group 1), short-term (5 days) whey (WS) protein group (group 2), and long-term (4 weeks) whey (WL) protein group (group 3). Here, 5 days correspond to 6 months and 4 weeks to 2.5 years of human life. 14 In order to eliminate probable variation in histological and biochemical parameters due to the difference between the ages of the groups undergoing short- and long-term whey applications, all groups were killed on the same day. The long-term application was started first. The short-term application was started 5 days before the end of the long-term application. All rats were killed at the end of the fourth week, at 10.00 a.m. Arteriovenous blood samples were collected from all rats under xylazine (5 mg/kg, intraperitoneally (i.p.)) and ketamine (50 mg/kg, i.p.) anesthesia. Serum samples were centrifuged at 3000g for 15 min and stored at −80°C. After blood specimen collection, the abdominal cavities were opened, and liver tissues were rapidly excised and washed. One half was placed in 10% neutral formalin for histological investigation, and the remaining tissues were homogenized in phosphate-buffered saline (pH 7.2) containing 0.05% sodium azide, 0.5% Triton X-100, and a protease inhibitor cocktail and then stored at −80°C.
Biochemical analysis
Measurement of CK-18 and inflammation markers
CK-18-M30 levels in serum were measured using the M30-enzyme-linked immunosorbent assay (ELISA) kit (Peviva AB, Sweden), which was developed for specific quantitative and sensitive measurement of caspase-cleaved CK-18 (CK-18Asp396-NE: M30 neo-epitope). TNF-α, IL-1β, and IL-6 expression levels in homogenized liver tissues were analyzed using ELISA (Ebioscience, San Diego, California, USA) kits. All techniques were performed in accordance with the procedures indicated on the kits.
Determination of serum AST and ALT
Hepatotoxicity was followed by serum AST and ALT levels. Both enzymes were measured using enzymatic kits specific to the AU5800 autoanalyzer system (Beckman Coulter, Brea, California, USA).
Histological analysis
Histochemical and immunohistochemical methods
At the end of the experiment, liver tissues from the rats were removed. Tissue samples were fixed in a 10% neutral formalin solution for 48 h and processed for embedding in paraffin wax according to routine protocols. Sections of 5 μm thickness were cut by microtome and stained with hematoxylin and eosin.
For immunohistochemistry, sections were treated with 2% trypsin in Tris buffer (Sigma-Aldrich, St Louis, Missouri, USA) at 37°C for 15 min. After treatment with 0.3% hydrogen peroxide in methanol for 15 min, sections were incubated in a blocking solution (Invitrogen, Carlsbad, California, USA) for 10 min. They were then incubated in a humid chamber for 1 h at 4°C with primary antibody agonists IL-1β (SC-7884, rabbit polyclonal antibody; Santa Cruz Biotechnology, Santa Cruz, California, USA), IL-6 (SC-1265-R, rabbit polyclonal antibody; Santa Cruz Biotechnology), TNF-α (SC-52746, mouse monoclonal antibody; Santa Cruz Biotechnology), and CK-18 (SC-32329, mouse monoclonal antibody; Santa Cruz Biotechnology), all diluted to 1:100. Sections were then incubated with biotinylated secondary antibody and then with streptavidin conjugated to horseradish peroxidase for 30 min each (Invitrogen) following the instructions on the kit. Finally, they were incubated with 3-amino-9-ethylcarbazole (AEC) (Spring, Pleasanton, California, USA), prepared according to the manufacturer’s instructions, for 3–5 min, after which the nuclei were counterstained with Mayer’s hematoxylin. Sections were analyzed using a CX41 bright-field microscope (Olympus, Tokyo, Japan). Control samples were processed in an identical manner, but incubation with the primary antibody was omitted (data not shown). Two observers blinded to the experimental data evaluated the immunolabeling scores independently. The staining intensity of slides processed using the immunohistochemical protocol was graded semiquantitatively, and the H-score was calculated using the equation HSCORE = ΣPi (i + 1), where i is the intensity of staining, with a value of 1, 2, or 3 (weak, moderate, or strong, respectively), and Pi is the percentage of stained cells for each intensity, varying from 0% to 100%. 15
TUNEL method
Deparaffinized and rehydrated sections, prepared as described above, were stained using a commercial kit (ApopTag, S7101, Chemicon, Temecula, California, USA) according to the manufacturer’s instructions. All methods were performed in accordance with the procedures indicated on the kits. Slides stained using the TUNEL technique were evaluated using a CX41 bright-field microscope (Olympus). The average number of apoptotic cells was determined by counting the TUNEL-positive cells in randomly chosen fields per case. In each case, a total of 100 TUNEL-positive and -negative cells were calculated, and the number of TUNEL-positive cells was expressed as a percentage of the total. Cells in areas with necrosis or poor morphology or on borders of sections were not included.
Statistical analysis
Numbers, percentages, and averages of the histological and biochemical values obtained from the study groups were analyzed using Kruskal–Wallis nonparametric tests. The value of p < 0.01 was considered significant. All statistical analyses were conducted using SPSS version 11.5 for Windows software.
Results
Body and liver weight measurements
The group that exhibited the highest increase in body weight compared with the threshold values was WL (227.64 ± 28.24; p < 0.01). At the end of the experiment, body weight had increased slightly in the WS group compared with the control group (206.26 ± 17.86; p < 0.01; Table 2). There was a significant difference in liver weights (p < 0.01), the highest value being determined in the WL group (9.70 ± 1.49). The value in the WS group (8.09 ± 1.29) was higher than that in the control group (7.56 ± 1.54; Table 2).
Initial and final body and liver weights in the control, WS, and WL groups.

WS: short-term whey; WL: long-term whey; SD: standard deviation.
a p < 0.01 (Kruskall–Wallis test).
ELISA results
Mean IL-1β values were significantly higher in the WL group (82.14 ± 31.64 ng/mg protein) than in both the WS (34.48 ± 12.17 ng/mg protein) and control groups (9.51 ± 7.97 ng/mg protein; p < 0.01). IL-6 and TNF-α levels in tissues were similar, and there was no significant difference between the groups (p = 0.01). However, the highest levels were in the WL group (158.12 ± 38.74 ng IL-6/mg protein and 70.71 ± 16.46 ng TNF-α/mg protein). The WS group (120.87 ± 33.78 ng IL-6/mg protein, 58.19 ± 11.66 ng TNF-α/mg protein) had lower levels than the control group (128.71 ± 56.97 ng IL-6/mg protein, 61.18 ± 7.90 ng TNF-α/mg protein; Table 3).
IL-1β, IL-6, TNF-α, and CK-18 ELISA levels in the control, WS, and WL groups.
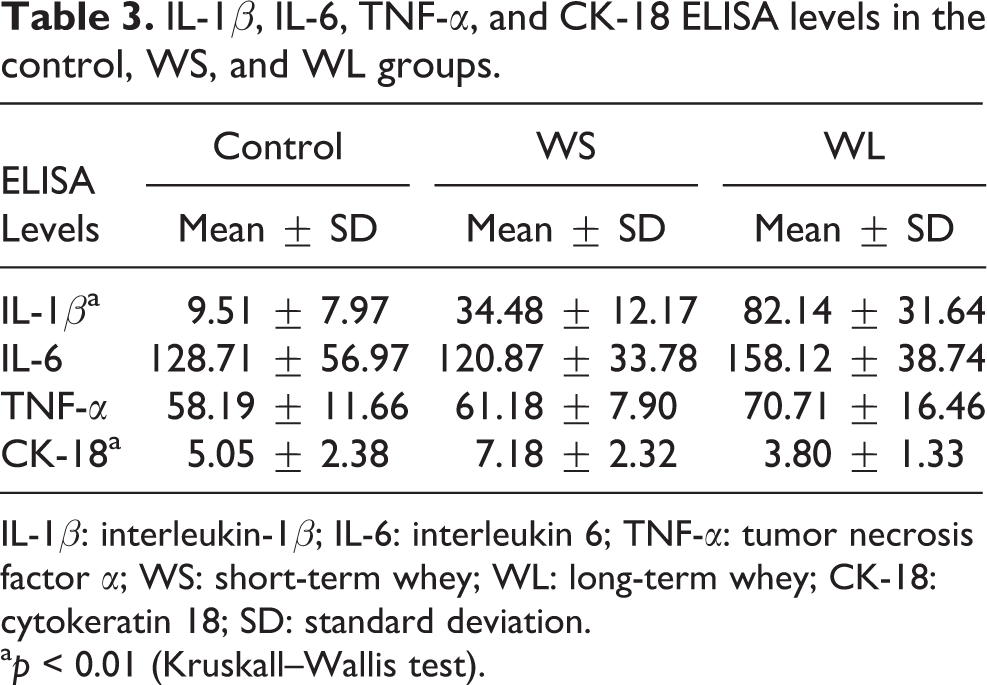
IL-1β: interleukin-1β; IL-6: interleukin 6; TNF-α: tumor necrosis factor α; WS: short-term whey; WL: long-term whey; CK-18: cytokeratin 18; SD: standard deviation.
a p < 0.01 (Kruskall–Wallis test).
The WS group (7.18 ± 2.32 ng/mg protein) exhibited significantly higher mean CK-18-M30 levels than both the control (5.05 ± 2.38 ng/mg protein) and WL groups (3.80 ± 1.33 ng/mg protein; p < 0.01). The WL group had lower CK-18-M30 levels than the control group (p < 0.01; Table 3).
AST and ALT results
There was a significant difference in serum AST levels among the groups (p < 0.01). The only significant differences in ALT levels were between the control and WL groups (p < 0.01). The WL group had the highest AST and ALT values (Table 4).
Liver AST and ALT levels in the control, WS, and WL groups.
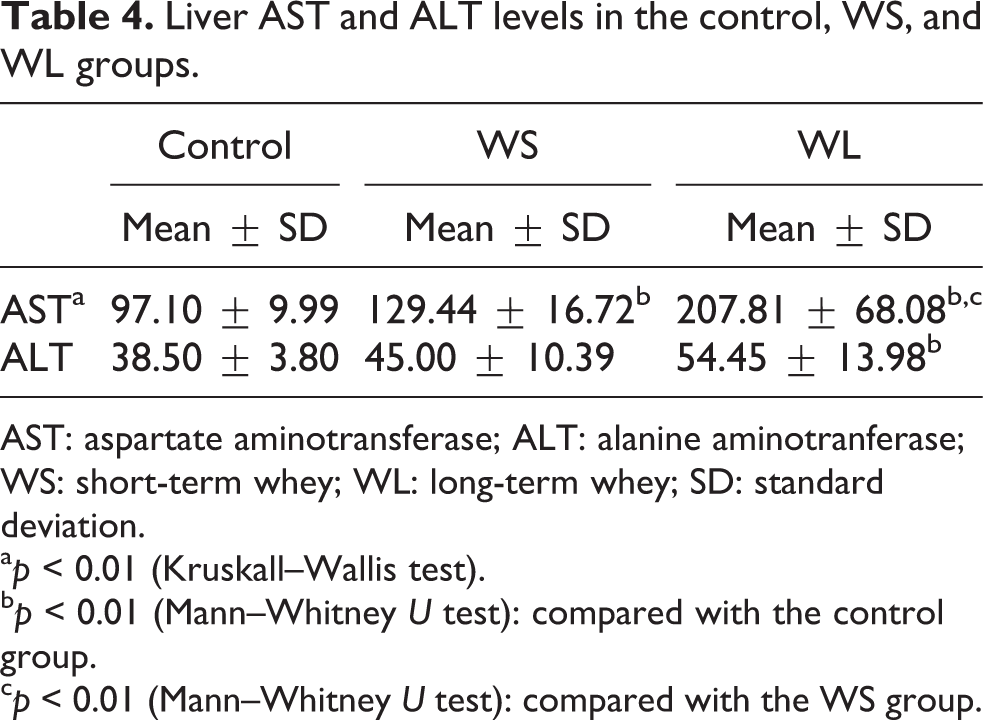
AST: aspartate aminotransferase; ALT: alanine aminotranferase; WS: short-term whey; WL: long-term whey; SD: standard deviation.
a p < 0.01 (Kruskall–Wallis test).
b p < 0.01 (Mann–Whitney U test): compared with the control group.
c p < 0.01 (Mann–Whitney U test): compared with the WS group.
Hematoxylin and eosin results
In the control group, a normal structure was observed in the hepatocytes around the central vein and portal areas (Figure 1(a1) and (a2)). In the WS group, vacuolization was present in some hepatocytes around the central vein (Figure 1(b1)), and greater inflammatory cell infiltration was observed in the portal area (Figure 1(b2)).

Pyknotic cells were observed in the central vein and inflammatory cells in the portal area in the WL group. Control (a), WS (b), and WL (c) group central vein (1) and portal area (2) hematoxylin–eosin staining in liver (×400, bar = 50 μm). CV: central vein; PA: portal area; ➧: cells containing vacuoles; †: pyknotic cells; : bile duct; ⇒: inflammatory cells; WL: long-term whey; WS: short-term whey.
In the WL group, pyknosis in the hepatocytes around the central vein and condensation in the hepatocyte nuclei were observed. Away from the central vein, hepatocytes with a normal structure were observed (Figure 1(c1)). Additionally, intense inflammatory cell infiltration in the portal area was remarkable (Figure 1(c2)).
IL-Iβ, IL-6, and TNF-α immunohistochemistry results
Table 5 shows IL-Iβ, IL-6, TNF-α, and CK-18 immunohistochemistry H-score values of the groups.
IL-1β, IL-6, TNF-α, and CK-18 immunohistochemistry H-score levels in the control, WS, and WL groups.

IL-1β: interleukin 1; IL-6: interleukin 6; TNF-α: tumor necrosis factor α; CV: central vein; PA: portal area; CK-18: cytokeratin 18; SD: standard deviation.
a p < 0.01 (Kruskall–Wallis test).
A weak IL-Iβ reaction was seen around the central vein and portal area in the control liver (Figure 2(a1) and (a2)). In the WS group, staining in hepatocytes in these areas increased (Figure 2(b1) and (b2)), while in the WL group, those hepatocytes close to the central vein exhibited a very strong IL-1β reaction. In contrast, IL-1β immune reaction was poor in the cells further away from the central vein (Figure 2(c1)). Similarly, IL-1β reaction was strong in the hepatocytes surrounding the portal area (Figure 2(c2)).
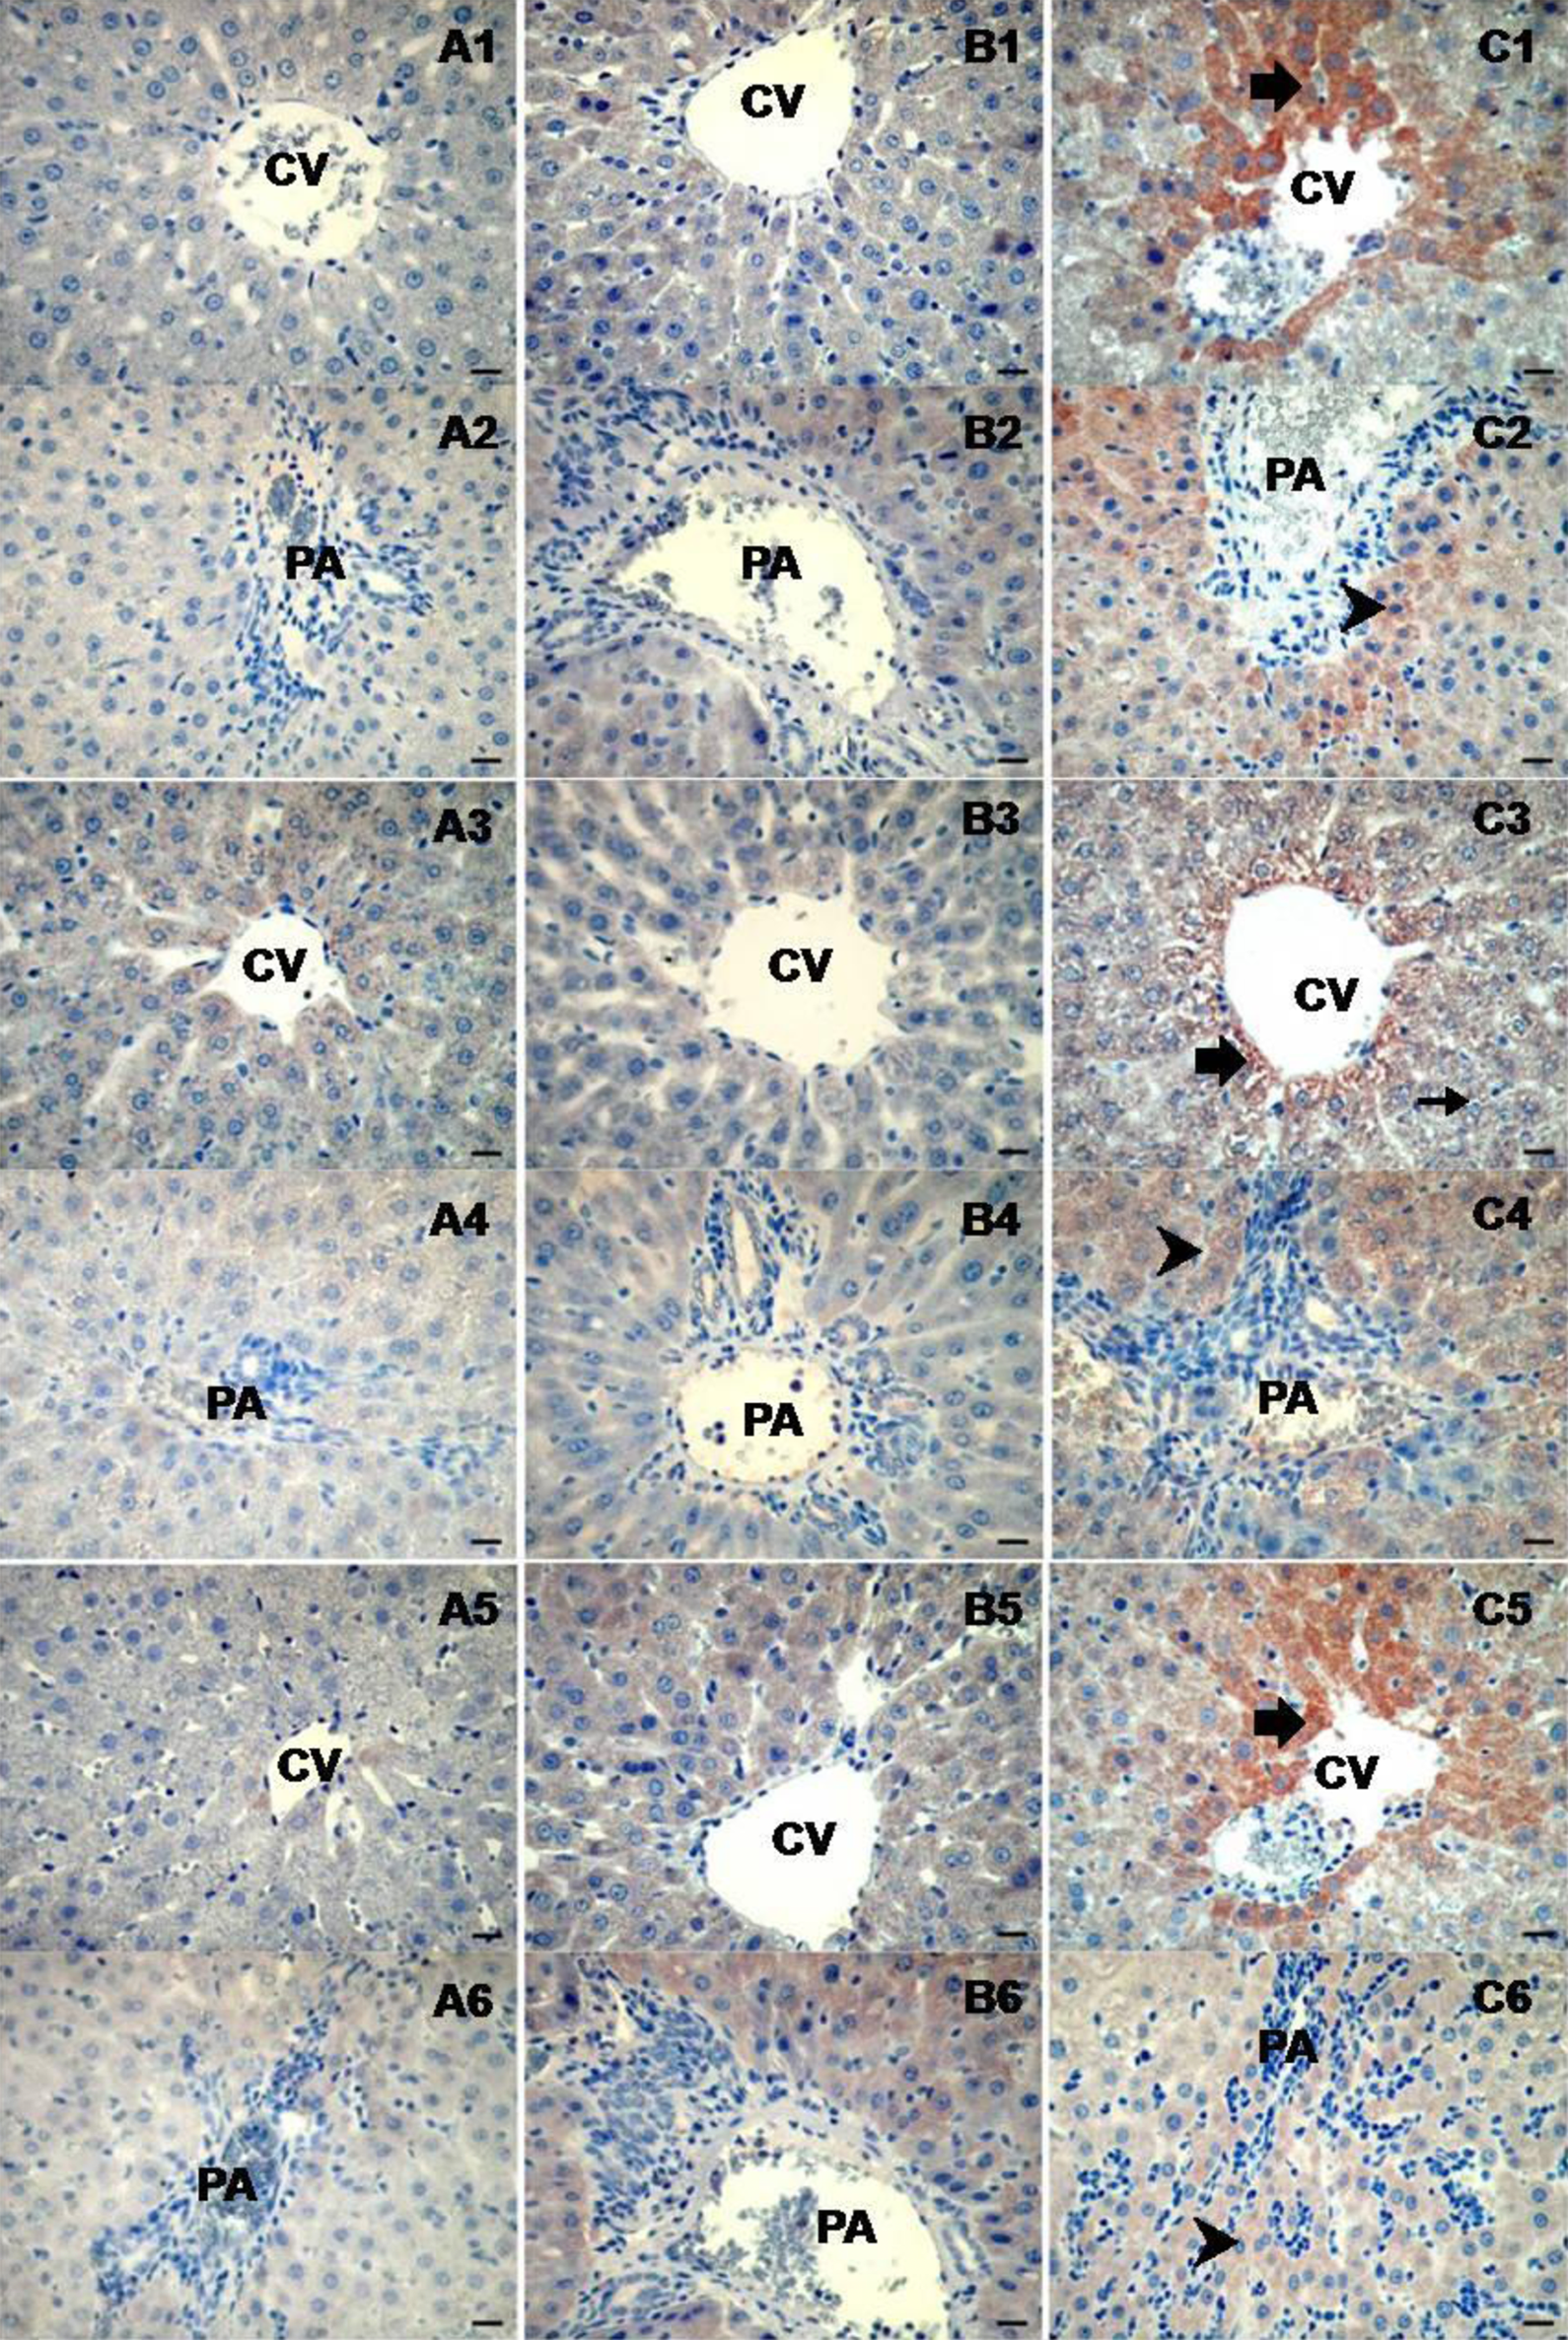
Strong immunostaining was observed in WL group hepatocytes compared with the control group, together with moderate staining of WS group hepatoctes with IL-1β, IL-6, and TNF-α. Control (a), WS (b), and WL (c) group IL-1β (1,2), IL-6 (3,4), and TNF-α (5,6) immunoreactivities (×400, bar = 50 μm). CV: central vein, PA: portal area, ➧: hepatocytes showing positive reaction around the central vein, †: hepatocytes showing positive reaction around the portal area; IL-1β: interleukin 1β; IL-6: interleukin 6; TNF-α: tumor necrosis factor α; WL: long-term whey; WS: short-term whey.
The IL-6 reaction around the central vein was expressed mildly to weakly in the control group, while IL-6 expression in the WS group was weak (Figure 2(a3) and (b3)). IL-6 immune reaction around the portal area was slightly expressed in the control and WS groups (Figure 2(a4) and (b4)). However, in the WL group, moderate-to-strong IL-6 expression was observed in hepatocytes around both the central vein and the portal area (Figure 2(c3) and (c4)).
Similarly, TNF-α immunoreactivity varying from mild to moderate was observed around the central vein in the control and WS groups (Figure 2(a5) and (b5)). In contrast, expression around the portal area was higher in the WS group (Figure 2(b6)). In the WL group, TNF-α reaction (as with IL-1β) was strong in hepatocytes around the central vein (Figure 2(c5)). TNF-α negative hepatocytes were present further away from the central vein. Around the portal area, moderate levels of TNF-α expression were seen in hepatocytes among inflammatory cells (Figure 2(c6)).
CK-18 and TUNEL results
In the control group, CK-18 was moderately expressed along the hepatocyte cellular membrane, especially around the central vein of hepatic lobules (Figure 3(a1)). Furthermore, moderate expression was also observed in the epithelia of the bile duct in the portal area (Figure 3(a2)). In the WS group, very strong CK-18 immunoreactions were observed along the cellular membrane of some hepatocytes around the central vein (Figure 3(b1)). Intense CK-18 expression was seen in the epithelia of the bile duct and in some hepatocytes in the portal area (Figure 3(b2)). In the WL group, CK-18 reaction of moderate intensity was determined around the central vein of hepatic lobules and in some hepatocytes in the portal area (Figure 3(c1)). CK-18 expression in the epithelia of the bile duct in the portal area varied from moderate to strong (Figure 3(c2)).

There was a markedly high localization pattern in the central vein for CK-18-M30 and TUNEL in the WS group compared to the other groups. Control (a), WS (b), and WL (c) group CK-18-M30 (1,2) and TUNEL (3) reactivity in liver (×400, bar = 50 μm). CV: central vein, PA: portal area, ➧: hepatocytes showing positive reaction around the central vein, †: hepatocytes showing positive reaction around the portal area, : bile duct epithelial cells showing positive reaction, ’: TUNEL-positive cells; CK-18: cytokeratin 18; TUNEL: terminal transferase-mediated deoxyuridine triphosphate nick-end labeling.

TUNEL values increased significantly in the WS group compared to the control and WL groups. Data are expressed as mean ± SD; p < 0.01. TUNEL: terminal transferase-mediated deoxyuridine triphosphate nick-end labeling; WS: short-term whey; WL: long-term whey.
A small number of TUNEL-positive cells were observed in the control group, whereas the number of such cells was much greater in the WS group (Figure 3(a3) and (b3)). In the WL group, the number of TUNEL-positive cells was less than that in the WS group and slightly higher than that in the control group (Figures 3(c3) and 4).
Discussion
Since oral whey supplements enhance sports performance, their use in professional and amateur sports has recently become very widespread. 16 However, the benefits of whey supplements emerge when sports activities are performed in routine repetitions or during high energy output. 17 The availability of such supplements, from nutrition stores and supermarkets, to uninformed and inexperienced young people who want to increase their muscle mass is problematic because the side effects of such supplements have not been completely clarified. Greater glycogen has been shown to be deposited in the livers of rats performing exercise, 4 because depleted liver stocks during prolonged and exhausting exercises cause fatigue. 17 Therefore, hepatic glycogen stocks should be kept full at all times. Whey protein has been shown to regulate the activities of a variety of hepatic glycolytic and gluconeogenic enzymes. 4 In addition, whey protein contains high concentrations of branched-chain amino acids. These support a decrease in glycogen consumption during acute exercise. 18 However, there is no previous research into the effects of whey protein on the liver when the supplement is taken without exercising or daily over a long period. We therefore think that loading up on whey protein, which helps regulate glycolytic and gluconeogenic enzymes and aminotransferase activities, before glycogen stocks are depleted may have adverse effects on the liver.
This study investigated the effects of whey protein on the liver, when the supplement is taken on a short- or long-term basis without exercising, in terms of inflammation and apoptosis. Few studies have investigated the potential of whey protein to cause liver injury. In a case report by Whitt et al., cholestatic liver injury was identified after a sportsman used whey protein and creatine supplements. 19 In addition, hepatic pathological findings revealed increased stellate cells and vacuolization in hepatocyte cytoplasms and intense inflammatory cell infiltration in the portal area. All these findings are reported to be associated with drug-induced centrilobular hepatocellular and canalicular cholestasis. 19 In addition, Tarnopolsky et al. showed that routine doses of creatine monohydrate supplement taken as supportive nutrition, such as whey protein, result in lymphatic hepatitis and hepatic lesions. 20 In our findings, which are very similar to those of Whitt et al., we detected vacuolization mainly in hepatocytes around the central veins in both the WS and WL groups. We also observed intense infiltration by inflammatory cells in the portal area of the liver in the WL group.
The secondary indication of liver injury is an inflammatory process. Cytokines play a significant role in the pathophysiology of liver diseases. 21 In this study, we investigated cytokine levels in order to measure the degree of whey protein-related inflammatory reaction in the liver. Among the cytokines, IL-1β, TNF-α, and IL-6 are the primary mediators of the inflammatory response in the liver. 22 Kobayashi et al. reported highly elevated IL-1, IL-6, and TNF-α levels in the serum of patients with biliary atresia. 23 These chemical mediators affect hepatic metabolism, stimulate hepatic regeneration, lead to scar formation, and most importantly, cause monocyte accumulation and continuation of pro-inflammation.
IL-1β is an important cytokine in the inflammation and development process. TNF-α and IL-1β are the most potent pathologic cytokines, causing cell degeneration, apoptosis, and necrosis that lead to multiorgan dysfunction. 24 As proximal cytokines, TNF-α and IL-1β stimulate production of the distal cytokine IL-6. Chen et al. emphasized that TNF-α or IL-1β are essential initiators of septic response in the liver and that IL-6, a secondary-phase cytokine, is the mediator of dysfunction in late sepsis and death. 24,25 In our WL group, the strong expression of IL-1β in hepatocytes around the central vein of hepatolobules and dramatically elevated biochemical levels compared with the control and WS groups provide the strongest evidence that IL-1β increases inflammation in the liver.
IL-6 is a type of inflammatory cytokine whose sources are T lymphocytes, monocytes, endothelial cells, fibroblasts and tumor cells. Strassmann et al. showed that IL-6 increases markedly to stimulate liver-originated acute-phase reactants. 26 In addition, in response to liver injury, IL-6 stimulates hepatocyte division to provide protection against injury and promote liver regeneration. In our study, IL-6 levels were higher in the WL group than in the other groups but were lower in the WS group than in the control group. This decrease may be related to a phase of the short-term inflammatory process. IL-6 also plays many other important roles in liver regeneration, inducing hepatic production of hepatocyte growth factor, 27 which acts as a mitogen of hepatocytes, and protecting hepatocytes from apoptosis. 28 IL-6 levels in the WS group in our study were low, and the high level of apoptotic cells death shows that IL-6 is unable to prevent apoptosis in short-term whey application. In addition, low levels of inflammatory markers such as TNF-α and IL-1β in the WS group support the idea that inflammation is not severe in short-term whey application and that apoptotic cells death is of primary significance.
TNF-α is mainly released from active macrophages, Kupffer cells, antigen-stimulated T cells, active NK and mast cells, and, in smaller amounts, from other cells. TNF-α activates leukocytes (primarily neutrophils and less frequently eosinophils and mononuclear phagocytes) to kill microorganisms. 29 In our study, there was a significant correlation in the WL group between TNF-α and IL-6 levels and the immunohistochemical results. The highest TNF-α levels were determined in the WL group. IL-1β was particularly stronger in that group. IL-6 and TNF-α were expressed around the centralis, the most frequently damaged area in the liver. Long-term whey use appears to increase inflammation in hepatocytes, particularly around the central vein.
CK-18 is a structural protein of the intermediate filament group, mostly found in epithelial and parenchymal cells. 30 It is known to play an important role in tumorigenesis and apoptosis in epithelial cancer. 31 Caspases 3, 6, 7, and 9 lead to cleaving of the CK-18 molecule by inducing caspase-dependent apoptosis. 32 In the later phase of apoptosis, some fragments of CK-18-Asp396 are released into plasma after the integrity of the plasma membrane has broken down. This neo-epitope is known as the M30 monoclonal antibody. 33 Furthermore, whereas serum M30-antigen levels measure apoptotic activity, TUNEL is considered a method of determination. 34 Dysregulation in hepatocyte apoptosis plays an important role in chronic hepatic diseases. 10 Increased CK-18 identified as M30 antigen has been shown in many chronic liver diseases, such as nonalcoholic fatty liver diseases and chronic viral hepatitis, through involvement in hepatocyte apoptosis. 35 CK-18-M30 levels in our study were highest in the WS group. Immunohistochemically, these were expressed more around the central vein compared to those in the other groups. Similarly, our TUNEL scores were also parallel to our CK-18 results. TUNEL-positive cells were more abundant in the hepatic lobules in the WS group, suggesting that the short-term application of whey protein causes greater apoptosis in the liver compared to long-term application. Our TNF-α results also showed that the increased apoptosis in the livers of the WS group was related to the TNF-α pathway.
The WS group in our study had higher IL-1β levels than the control group, but biochemical TNF-α and IL-6 levels were unexpectedly lower than those in the control group. In contrast, TNF-α, IL-1β, and IL-6 levels were higher in the WL group than in both the control and WS groups. In particular, IL-1β levels increased dramatically. In terms of apoptosis, we surprisingly found elevated CK-18-M30 and TUNEL-positive cells in the hepatic lobules of the WS group.
We determined an inverse relationship between CK-18-M30 and inflammatory activity. Whereas CK-18 and TUNEL values were lower in the WL group, in which inflammation increased, inflammation levels were lower but apoptosis scores higher in the WS group. The short-term application of whey protein, as a cause of increased apoptosis in hepatocytes, appears to result in anti-inflammatory activity revealed by the suppression of pro-inflammatory cytokine production. Long-term and daily whey use may considerably increase pro-inflammatory cytokine expression, thereby leading to liver damage. Based on the data for the intermediate filament protein CK-18-M30, which was significantly increased in the WS group and significantly decreased in the WL group, we concluded that liver tissue damage occurred due to apoptotic cell death itself, a result of caspase activation in the WS group. However, serum levels of CK-18-M30, a serum apoptotic marker, were decreased because the damage in the WL group was long term and therefore necrotic.
AST and ALT are the most sensitive tests for the diagnosis of liver diseases. In addition to our ELISA and immunohistochemical data, this study revealed a significant increase in the activity of serum AST and ALT in the WL group, indicating considerable hepatocellular injury. The extent of hepatic damage is assessed by the increased serum level of cytoplasmic enzymes (AST and ALT). 36 Short-term application of whey protein leads to an increase in apoptosis in the liver in the first stage, while long-term administration increases inflammation. Prolonged inflammation may also lead to necrosis-like cell death apart from apoptosis in tissues. Examination of experimental group AST and ALT values shows that values in which AST > ALT, a marker of hepatic injury, apply in both the WS and WL groups.
To the best of our knowledge, this is the first study to show the activation of an inflammatory and apoptotic response in the liver as a result of long- and short-term whey application in unexercised rats. Further studies are now needed to evaluate other inflammatory and apoptotic pathways, and particularly liver function tests such as γ-glutamyl transferase, alkaline phosphatase, urea, albumin and serum glucose, insulin, glucagon, and glycogen analysis.
Footnotes
Conflict of interest
The authors declared no conflicts of interest.
Funding
This study was supported by a grant from the Celal Bayar University Research Fund, Manisa, Turkey. [Project no: 2010-032].