
Abstract
A grape pomace extract enhanced antioxidant mechanisms in muscle and endothelial cells both in the absence and in the presence of oxidative stress-induced agent tert-butyl hydroperoxide (tBHP). In particular, muscle (C2C12) and endothelial (EA.hy926) cells were treated with the extract at noncytotoxic concentrations for 24 h, and the oxidative stress markers, total reactive oxygen species (ROS), glutathione (GSH), thiobarbituric reactive substances (TBARS), and protein carbonyl levels were assessed. The results showed that the grape extract treatment reduced significantly ROS, TBARS, and protein carbonyl levels and increased GSH in C2C12 cells, while it increased GSH and decreased protein carbonyl levels in EA.hy926 cells. In the presence of tBHP, the grape extract treatment in C2C12 cells reduced significantly ROS, TBARS, and protein carbonyls and increased GSH compared with tBHP alone treatment, while, in EA.hy926 cells, the extract decreased significantly TBARS and protein carbonyls but increased GSH. The antioxidant potency of the extract was different between muscle and endothelial cells suggesting that the antioxidant activity depends on cell type. Moreover, the antioxidant activity of the grape extract, in both cell lines, exerted, at least in part, through increase in GSH levels. The present work is the first to report the effects of grape extract shown for skeletal muscle cells.
Introduction
It is well known that every living organism is exposed to oxygen (O2) free radicals under various conditions. Free radicals are produced under physiological conditions and participate in different functions of the cell as regulation of signaling pathways, gene expression, normal apoptosis, and physiological adaptations during exercise. 1–4 In addition, free radicals can be produced under abnormal conditions such as poor diet, smoking, exposure to ionizing and ultraviolet radiation. 5,6 The overproduction of free radicals can cause oxidative damage to macromolecules, the immune system, and muscles and can induce fatigue. 7–10 However, every living organism has antioxidant mechanisms to address the overproduction of free radicals. 11 The antioxidant protective mechanisms act in order to keep a balance between free radical production and scavenging. A disturbance of this equilibrium results in the appearance of oxidative stress, a pathophysiological condition potentially leading to several diseases. 12
Oxidative stress occurs frequently in muscle tissue exposed to reactive oxygen species (ROS) production. For example, during intense exercise there is a high rate of O2 consumption in skeletal muscles that can cause incomplete O2 reduction and electron leakage from the electron transfer chain and lead to the generation of ROS causing oxidative stress and resulting in muscle fatigue and cell damage and apoptosis. 13,14
Moreover, the damage of the vascular endothelium by oxidative stress may lead to various diseases. 15 As shown by Kokura et al. and Hazel and Müller, 16,17 a redox imbalance in endothelial cells results in surface expression of different endothelial cell adhesion molecules, suggesting that oxidant stress induces acute and chronic phases of leukocyte adhesion to the endothelium.
Due to the adverse consequences of oxidative stress on human health, it has been suggested by us and others that antioxidant supplementation may relieve the problem. 18,19 Thus, plant foods rich in antioxidants have been shown to have beneficial effects on human health. 20 Over the last several years, grape extracts and wine have been the center of attention due to their strong antioxidant properties. Our research group has shown that grape extracts exhibited high antioxidant activity and prevented ROS-induced DNA damage. 21–23 The antioxidant effects of grape extracts are attributed mainly to their rich polyphenolic content. 22,24
The aim of the present study was to investigate the effects of a grape pomace extract rich in polyphenols on the redox status of muscle and endothelial cells both in the absence and in the presence of an oxidative stress agent. The investigation of the antioxidant effects of the grape extract at the cellular level would help understanding the molecular mechanisms through which this activity is exerted. Because such extracts are used as food supplements, understanding the effects of the extract on these systems is important. Soil and climatic conditions affect the phenolic composition of the grapes due to its influence on biochemical synthesis of these compounds, and consequently, the investigation of the biological properties of local varieties also is important. 25
Materials and methods
Chemicals, reagents, and culture medium
Dulbecco’s modified Eagle medium (DMEM), fetal bovine serum (FBS), phosphate-buffered saline (PBS), and trypsin were purchased from Gibco (UK). Tert-butyl hydroperoxide (tBHP), 2,7-dichlorofluorescein diacetate (DCF-DA), mercury orange, trichloroacetic acid (TCA), Tris(hydromethyl)aminomethane (Tris), sodium sulfate (Na2SO4), 2-thiobarbituric acid (TBA), and Bradford’s reagent were purchased from Sigma–Aldrich (St Louis, Missouri, USA). Cell proliferation kit II (XTT) was purchased from Roche Diagnostics (Mannheim, Germany).
Extract preparation
The grape pomace extract was prepared from the Greek Vitis vinifera variety of Batiki Tyrnavou (red grapes grown in central Greece). The extract isolation was performed as described by Veskoukis et al. previously. 26 In brief, the raw material was dried in a shady, well-ventilated place and extracted with ethanol (96%) at 50°C for 4 h. After filtration, the solvent was evaporated under reduced pressure, and the residue (grape pomace extract) was kept at −20°C until further use.
Cell culture conditions
C2C12 muscle cells were gifted from Prof. Koutsilieris (National and Kapodistrian University of Athens, Greece) and EA.hy926 cells from Prof. Koukoulis (University of Thessaly, Greece). All cells were cultured in normal DMEM (Gibco, UK), containing 10% (v/v) FBS, 2 mM
Cell viability assay
Cell viability was assessed using the XTT assay kit (Roche). Briefly, cell lines were subcultured into a 96-well plate with 1 × 10⁴ and 5 × 10³ cells per well for C2C12 and EA.hy926 cell line, respectively, in DMEM medium. After 24 h incubation, the cells were treated with different concentrations of the grape extract in serum-free DMEM medium for 24 h. Then, 50 μL of XTT test solution, which was prepared by mixing 50 μL of XTT labeling reagent with 1 μL of electron coupling reagent, was added to each well. After 4 h of incubation, absorbance was measured at 450 nm and also at 690 nm as a reference wavelength in a Bio-Tek ELx800 microplate reader (Winooski, Vermont, USA). DMEM serum-free medium was used as a negative control. Also, absorbance of the grape extract concentration alone in DMEM serum-free medium and XTT test solution was tested at 450 nm. The absorbance values of the grape extracts alone were subtracted from those derived from cell treatment with the grape extracts. Data were calculated as percentage of inhibition by the following formula:

where ODcontrol and ODsample indicated the optical density of the negative control and the tested compounds, respectively. All experiments were carried out in triplicate and on at least two separate occasions.
Treatment of C2C12 and EA.hy926 cells
C2C12 and EA.hy926 cells were seeded in culture flasks and incubated for 24 h. Then, the medium was removed and replaced with serum-free medium containing the grape extract at noncytotoxic concentrations (2.5–10 μg/mL for C2C12 and 0.068–0.250 μg/mL for EA.hy926 cells), followed by incubation for 24 h.
For studying the protective effect of the grape extract against tBHP-induced oxidative stress, the grape extract was removed after 24 h cell treatment with grape extract and replaced with medium containing tBHP (0.3 mM) followed by 30-min incubation.
For assessing the oxidative stress markers glutathione (GSH), ROS, TBA reactive substances (TBARS), and protein carbonyl levels in cells either in grape extract alone or in cotreatment with tBHP, the cells were trypsinized, collected, and centrifuged twice at 300g for 10 min at 5°C. After each centrifugation, the supernatant fluid was discarded and the cellular pellet was resuspended in PBS. After the second centrifugation, the supernatant fluid was used for measuring the oxidative stress markers.
Flow cytometric analysis of GSH and ROS levels
The intracellular GSH and ROS levels were assessed using mercury orange and DCF-DA, respectively. In particular, the fluorescent mercury orange binds directly to GSH, while DCF-DA within cells is deacetylated by esterases and further converted to fluorescent DCF by oxidative action of ROS. A 400-μM stock solution of mercury orange was made up in acetone and stored at 4°C, while a fresh 400 μM stock solution of DCF-DA was prepared in methanol. To assess the GSH and ROS levels, the cells were resuspended in PBS at 1 × 10⁶ cells/mL and incubated in the presence of mercury orange (40 μM) or DCF-DA (10 μM) in the dark at 37°C for 30 min. Then, the cells were washed, resuspended in PBS, and submitted to flow cytometric analysis using a FACScan flow cytometer (Becton Dickinson, Franklin Lakes, New Jersey, USA) with excitation and emission wavelengths at 488 and 530 nm for ROS and at 488 and 580 nm for GSH, respectively. Also, forward angle and right angle light scattering showing the cell size and cell internal complexity, respectively, were measured. Cells were analyzed at a flow rate of 1000 events/s. Analyses were performed on 10,000 cells per sample, and fluorescence intensities were measured on a logarithmic scale of four decades of log of fluorescence. Data were analyzed using BD Cell Quest software (Becton Dickinson). Each experiment was repeated at least three times.
Assessment of TBARS levels by spectrophotometry
For TBARS determination, a slightly modified assay of Keles et al. 27 was used. Cellular suspension (400 μL) or 400 μL of PBS for the blank were mixed with 500 μL of 35% TCA and 500 μL of Tris-hydrochloride (Tris-HCl; 200 mM, pH 7.4) and incubated for 10 min at room temperature. Afterward, 1 mL of 2 M Na2SO4 and 55 mM TBA solution were added, and the samples were incubated at 95°C for 45 min. The samples were cooled on ice for 5 min and after adding 1 mL of 70% TCA, the samples were mixed on a vortex. Then, the samples were centrifuged at 15,000g for 3 min, and the absorbance of the supernatant fraction was read at 530 nm. The assay requires >30 μg absolute amount of protein in the test sample. Total plasma protein was evaluated using Bradford assay. Calculation of TBARS concentration was based on the molar extinction coefficient of malondialdehyde. Each experiment was repeated at least three times.
Assessment of protein carbonyl levels by spectrophotometry
Protein carbonyl determination was based on the method of Patsoukis et al. 28 In this assay, cells were trypsinized, washed with PBS, and then lysed by sonication. Then, 200 μL of 20% TCA were added to 200 μL of cell lysate, and this mixture was incubated in an ice bath for 15 min and centrifuged at 15,000g for 5 min at 4°C. The supernatant fraction was discarded. Also, 500 μL of 10 mM 2,4-dinitrophenylhydrazine (DNPH; in 2.5 N HCl) for the sample or 500 μL of 2.5 N HCl for the blank were added to the pellet. The samples were incubated in the dark at room temperature for 1 h, with intermittent mixing every 15 min and were centrifuged at 15,000g for 5 min at 4°C. The supernatant fraction was discarded, and 1 mL of 10% TCA was added to the pellet which was mixed and centrifuged at 15,000g for 5 min at 4°C. The supernatant fraction was discarded and 1 mL of ethanol–ethyl acetate (1:1 v/v) was added, vortexed, and centrifuged at 15,000g for 5 min at 4°C. This washing step was repeated twice. The supernatant fraction was discarded, and 1 mL of 5 M urea (pH 2.3) was added, vortexed, and incubated at 37°C for 15 min. The samples were centrifuged at 15,000g for 3 min at 4°C, and the absorbance was read at 375 nm. Calculation of protein carbonyl concentration was based on the molar extinction coefficient of DNPH. The assay requires >30 μg absolute amount of protein in the test sample. Total plasma protein was evaluated using Bradford assay. Each experiment was repeated at least three times.
Statistical analysis
Data were analyzed by one-way analysis of variance followed by Dunnett’s test for multiple pairwise comparisons. The level of statistical significance was set at p < 0.05. For all statistical analyses, Statistical Package for Social Sciences, version 13.0 (SPSS Inc., Chicago, Illinois, USA) was used. Data are presented as mean ± SEM.
Results
Polyphenolic composition of the grape pomace extract
The polyphenolic composition of the extract identified by liquid chromatography–high-resolution mass spectrometry (LC-HRMS) method in positive and negative mode has been reported previously, and it is also presented herein (Table 1) for reader’s convenience. 26 Thus, the extract is composed of the flavan-3-ols, catechin, and epicatechin, traced at R t = 3.83 min and R t = 5.93 min respectively, and detected in positive and negative mode based on their pseudomolecular ions [M+H]+ at mass to charge ratio (m/z) 291.0863 and [M−H]− at m/z 289.0707, respectively. 26 Moreover, the flavan-3-ol epicatechin-3-gallate was identified at R t = 9.25 min based on its pseudomolecular ion [M−H]− at m/z 441.0816. 26 In addition, the anthocyanidins cyanidin, malvidin, delphinidin, and petunidin were detected at 9.25, 11.74, 13.55, and 15.99 min based on their corresponding pseudomolecular ions [M−H]− at m/z 609.1467, [M+H]+ at m/z 331.0812, [M−H]− at m/z 301.0359, and [M−H]− at m/z 315.0516, respectively. 26 Furthermore, the anthocyanins, myrtillin, kuromanin, oenin, and peonidin-3-O-glucoside were detected at 9.53, 10.63, 6.72, and 5.76 min based on their corresponding pseudomolecular ions [M−H]− at m/z 463.0888, [M−H]− at m/z 447.0939, [M−H]− at m/z 491.1201, and [M+H]+ at m/z 463.1235, respectively. 26 The flavonols, quercetin at R t = 9.56 min and kaempferol at R t = 15.79 min were also detected based on their peudomolecular ions [M−H]− at m/z 301.0357 and [M−H]− at m/z 285.0407, respectively. 26 Apart from the above flavonoids, two phenolic acids, gallic acid (R t = 0.78 min) and caftaric acid (R t = 26.18 min), were also identified based on their pseudomolecular ions [M−H]− at m/z 169.0147 and [M−H]− at m/z 311.0398, respectively. 26 Finally, the total polyphenolic content of the extract was evaluated and found to be 648 mg of gallic acid/g of extract. 26
Polyphenolic composition identified by an LC-HRMS method and TPC of the grape extract.
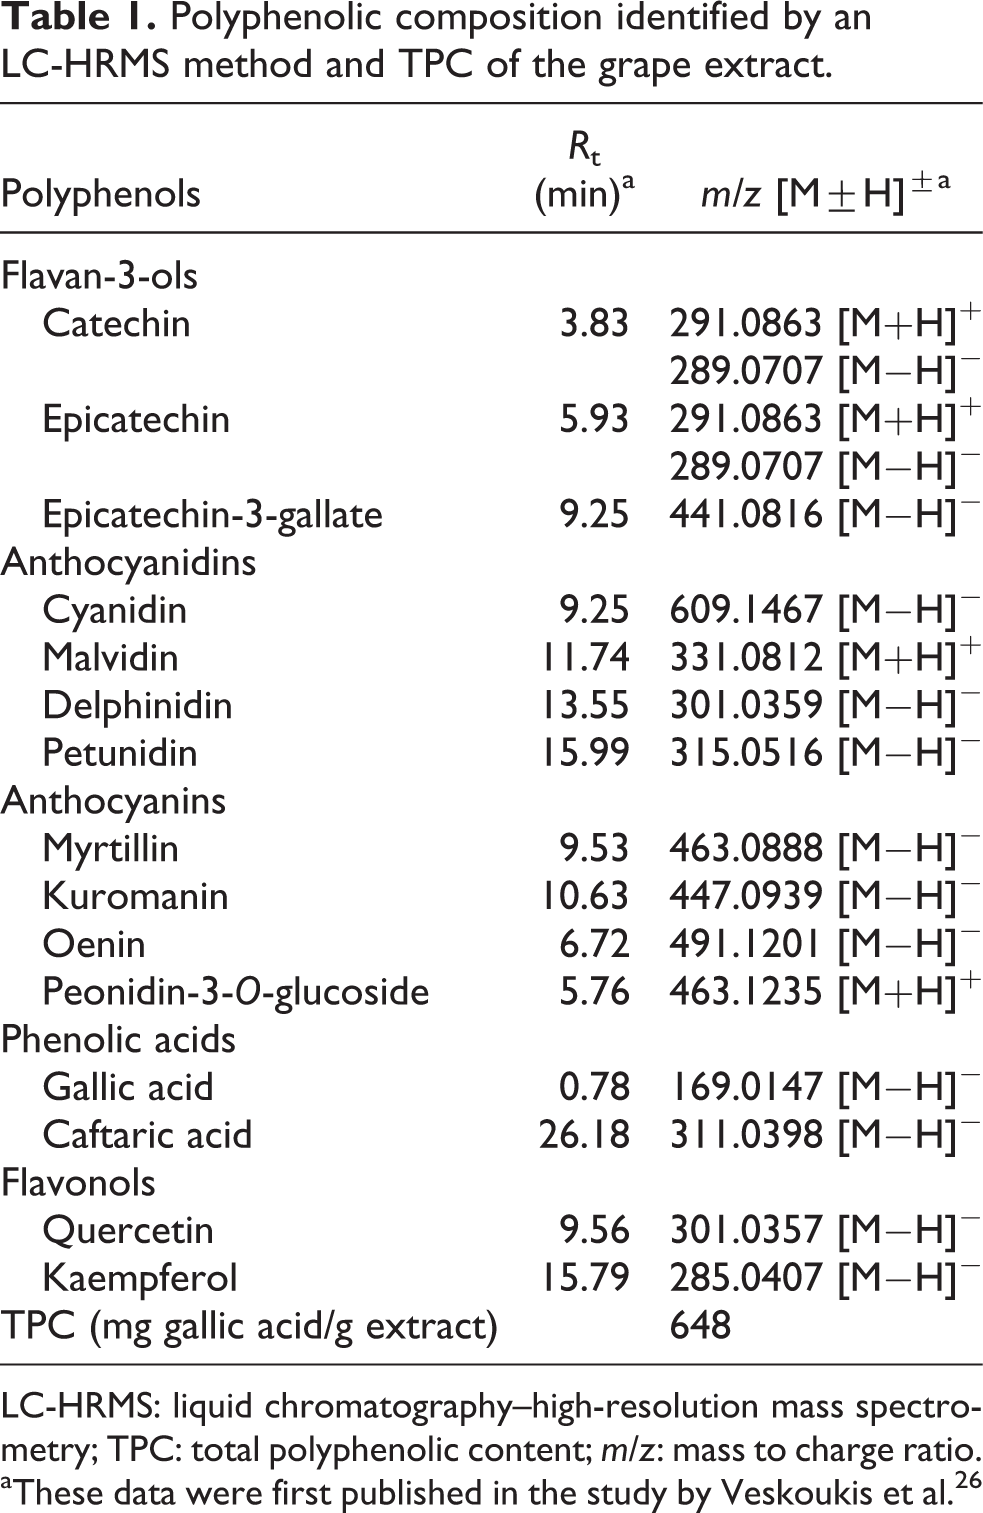
LC-HRMS: liquid chromatography–high-resolution mass spectrometry; TPC: total polyphenolic content; m/z: mass to charge ratio.
aThese data were first published in the study by Veskoukis et al. 26
Effects of grape extract on viability of C2C12 and EA.hy 926 cells
The XTT assay was used to assess the effects of grape extract on the viability of C2C12 and EA.hy926 cells. The results showed that the extract at concentrations >10 μg/mL significantly reduces viability of C2C12 cells (Figure 1(a)). Thus, the extract concentrations selected for the study were 2.5, 5, and 10 μg/mL, which were not cytotoxic. In EA.hy926 cells, the extract exhibited cytotoxicity at lower concentrations compared with C2C12 cells (Figure 1(b)). Specifically, cytotoxic activity occurred at concentrations >0.675 μg/mL (Figure 1(b)). Therefore, for the EA.hy926 cells, the extract concentrations were 0.068, 0.125, and 0.250 μg/mL.

Cell viability after treatment with the grape extract of (a) C2C12 cells and (b) EA.hy926 cells. The results represent the mean ± SEM of three independent experiments carried out in triplicate. *p < 0.05: significantly different from the control value.
Effects of grape extract treatment on oxidative stress markers in C2C12 cells
Oxidative stress was assessed by flow cytometry using DCF-DA and mercury orange for ROS and GSH, respectively, and spectrophotometrically for TBARS and protein carbonyls. Histograms demonstrating the cell counts versus fluorescence of DCF-DA or mercury orange are shown in Figure 2(a) and (b), respectively. The mean fluorescence intensity values were evaluated using the BD Cell Quest software and are expressed as percentage of the control (untreated cells) (Figure 2(c)). Treatment of C2C12 cells with the grape extract alone at concentrations of 5 and 10 μg/mL reduced ROS levels statistically significantly by 28.80 ± 10.8% and 47.60 ± 8.5%, respectively, compared with the control cell cultures (Figure 2(c)). Moreover, the flow cytometry analysis showed that the extract treatment increased GSH levels by 151 ± 28.3%, 119 ± 27.2%, and 168 ± 33.7% at 2.5, 5, and 10 μg/mL, respectively (Figure 2(c)).

Effects of the grape extract treatment for 24 h on the oxidative stress markers in C2C12 cells. (a) The histogram of cell counts versus fluorescence of 10,000 cells analyzed using flow cytometer for the detection of GSH. FL2 represents the detection of fluorescence using 488 and 580 nm as the excitation and emission wavelengths, respectively. (b) The histograms show the cell counts versus fluorescence of 10,000 cells analyzed using flow cytometer for the detection of ROS. FL1 represents the detection of fluorescence using 488 and 530 nm as the excitation and emission wavelengths, respectively. For ROS and GSH measurement, C2C12 cells were incubated with 10 μM DCF-DA and 40 μM mercury orange, respectively, for 30 min at 37°C. The cells were then washed, suspended in PBS, and analyzed using flow cytometry, as described in materials and methods section. (c) Effects on ROS, GSH, TBARS, and protein carbonyl levels are shown. TBARS and protein carbonyl levels were assessed by spectrophotometer. All values are presented as the mean ± SEM of three independent experiments. *p < 0.05: statistically significant compared with the control. GSH: glutathione; ROS: reactive oxygen species; DCF-DA: 2,7-dichlorofluorescein diacetate; PBS: phosphate-buffered saline; TBARS: thiobarbituric reactive substances.
Like ROS levels, grape extract treatment reduced significantly TBARS levels by 29.30 ± 1.6%, 37.60 ± 1.7%, and 54.07 ± 2.2% at 2.5, 5, and 10 μg/mL, respectively (Figure 2(c)). Furthermore, the grape extract treatment exhibited a significant reduction in protein carbonyl levels by 20.00 ± 5%, 24.60 ± 4.3%, and 21.80 ± 3.9% at 2.5, 5, and 10 μg/mL, respectively (Figure 2(c)).
Effects of grape extract treatment on oxidative stress markers in EA.hy926 cells
The histograms demonstrating the cell counts versus fluorescence of DCF-DA or mercury orange in EA.hy926 cells after grape extract treatment are shown in Figure 3(a) and (b), respectively. The results from the flow cytometry analysis showed that grape extract treatment increased significantly GSH levels by about 15.00 ± 2% at both 0.068 and 0.125 μg/mL concentrations (Figure 3(c)). Moreover, the grape extract demonstrated a significant decrease in protein carbonyl levels by 16.80 ± 4.2%, 11.70 ± 1.3%, and 16.00 ± 4.5% at concentrations of 0.068, 0.125, and 0.250 μg/mL (Figure 3(c)). However, the ROS and TBARS levels were not affected by the extract treatment at any concentration (Figure 3(c)).

Effects of grape extract treatment for 24 h on the oxidative stress markers in EA.hy926 cells. (a) The histogram of cell counts versus fluorescence of 10,000 cells analyzed using a flow cytometer for the detection of GSH. FL2 represents the detection of fluorescence using 488 and 580 nm as the excitation and emission wavelengths, respectively. (b) The histograms show the cell counts versus fluorescence of 10,000 cells analyzed using a flow cytometer for the detection of ROS. FL1 represents the detection of fluorescence using 488 and 530 nm as the excitation and emission wavelengths, respectively. For ROS and GSH measurement, EA.hy926 cells were incubated with 10 μM DCF-DA and 40 μM mercury orange, respectively, for 30 min at 37°C. The cells were then washed, suspended in PBS, and analyzed by flow cytometry, as described in materials and methods section. (c) Effects on ROS, GSH, TBARS, and protein carbonyl levels are shown. TBARS and protein levels were assessed by spectrophotometer. All values are presented as the mean ± SEM of three independent experiments. *p < 0.05: statistically significant compared with the control. GSH: glutathione; ROS: reactive oxygen species; DCF-DA: 2,7-dichlorofluorescein diacetate; PBS: phosphate-buffered saline; TBARS: thiobarbituric reactive substances.
Protective effects of grape extract on tBHP-induced oxidative stress in C2C12 cells
The histograms from flow cytometry demonstrating the cell counts versus fluorescence of DCF-DA or mercury orange used for the staining of ROS and GSH, respectively, in C2C12 cells after cotreatment with grape extract and tBHP are shown in Figure 4(a) and (b), respectively. Regarding the ROS levels, tBHP treatment had no effect compared with the untreated cells. This may be due to neutralization of free radicals by the antioxidant mechanisms of the cell (e.g. GSH) and/or to reaction with other molecules. Thus, although tBHP produces free radicals, their “free form” was not observed. For example, we observed a decrease in GSH and an increase in TBARS (Figure 4(c)) after tBHP treatment, indicating that free radicals reacted with GSH and lipids. However, the results showed that treatment of C2C12 cells with the grape extract at concentrations of 5 and 10 μg/mL, before tBHP administration, reduced significantly ROS levels by 38.80 ± 5% and 47.60 ± 3%, respectively, compared with tBHP alone treatment (Figure 4(c)). Moreover, flow cytometry analysis showed that the grape extract treatment increased GSH levels significantly by 22.00 ± 6.2%, 54.00 ± 8.1%, and 17.00 ± 8.3% at 2.5, 5, and 10 μg/mL, respectively, compared with tBHP treatment (Figure 4(c)).

Effects of grape extract alone or with tBHP treatment on the oxidative stress markers in C2C12 cells. Cells were studied under three conditions: under normal conditions (control), under treatment with tBHP (0.3 mM) for 30 min, and under the combination of grape extract (2.5–10 μg/mL) for 24 h and tBHP (0.3 mM) for 30 min. (a) The histogram of cell counts versus fluorescence of 10,000 cells analyzed using a flow cytometer for the detection of GSH. FL2 represents the detection of fluorescence using 488 and 580 nm as the excitation and emission wavelengths, respectively. (b) The histograms show the cell counts versus fluorescence of 10,000 cells analyzed using a flow cytometer for the detection of ROS. FL1 represents the detection of fluorescence using 488 and 530 nm as the excitation and emission wavelengths, respectively. For ROS and GSH measurement, C2C12 cells were incubated with 10 μM DCF-DA and 40 μM mercury orange respectively for 30 min at 37°C. The cells were then washed, suspended in PBS, and analyzed by flow cytometry, as described in materials and methods section. (c) Effects on ROS, GSH, TBARS, and protein carbonyl levels are shown. TBARS and protein levels were assessed by spectrophotometer. All values are presented as the mean ± SEM of three independent experiments. *p < 0.05: statistically significant compared with the control. tBHP: tert-butyl hydroperoxide; GSH: glutathione; ROS: reactive oxygen species; DCF-DA: 2,7-dichlorofluorescein diacetate; PBS: phosphate-buffered saline; TBARS: thiobarbituric reactive substances.
With regard the effects on lipid peroxidation, grape extracts inhibited significantly tBHP-induced increase in TBARS levels by 51.00 ± 12.3%, 52.40 ± 10.4%, and 36.70 ± 16.7% at 2.5, 5, and 10 μg/mL, respectively (Figure 4(c)). Finally, the grape extract decreased tBHP-induced increases in protein carbonyls by 32.00 ± 8.1%, 31.20 ± 4.6%, and 24.90 ± 8.4% at 2.5, 5, and 10 μg/mL, respectively (Figure 4(c)).
Effects of grape extract on tBHP-induced oxidative stress in EA.hy926 cells
The histograms showing the cell counts versus fluorescence of DCF-DA or mercury orange in C2C12 cells after cotreatment with grape extract and tBHP are shown in Figure 5(a) and (b), respectively. In contrast to C2C12 cells, the grape extract did not change ROS levels in EA.hy926 cells compared with the tBHP treatment (Figure 5(c)).

Effects of grape extract along or with tBHP treatment on the oxidative stress markers in EA.hy926 cells. Cells were studied under three conditions: under normal conditions (control), under treatment with tBHP (0.3 mM) for 30 min, and under the combination of grape extract (0.068–0.250 μg/mL) for 24 h and tBHP (0.3 mM) for 30 min. (a) The histogram of cell counts versus fluorescence of 10,000 cells analyzed using a flow cytometer for the detection of GSH. FL2 represents the detection of fluorescence using 488 and 580 nm as the excitation and emission wavelengths, respectively. (b) The histograms show the cell counts versus fluorescence of 10,000 cells analyzed by the flow cytometer for the detection of ROS. FL1 represents the detection of fluorescence using 488 and 530 nm as the excitation and emission wavelengths, respectively. For ROS and GSH measurement, EA.hy926 cells were incubated with 10 μM DCF-DA and 40 μM mercury orange respectively for 30 min at 37°C. The cells were then washed, suspended in PBS, and analyzed by flow cytometry, as described in materials and methods section. (c) Effects on ROS, GSH, TBARS, and protein carbonyl levels are shown. TBARS and protein levels were assessed by spectrophotometer. All values are presented as the mean ± SEM of three independent experiments. *p < 0.05: statistically significant compared with the control. tBHP: tert-butyl hydroperoxide; GSH: glutathione; ROS: reactive oxygen species; DCF-DA: 2,7-dichlorofluorescein diacetate; PBS: phosphate-buffered saline; TBARS: thiobarbituric reactive substances.
However, grape extracts inhibited significantly tBHP-induced decrease in GSH levels by 14.3 ± 4.6, 10.1 ± 5.2, and 15.4 ± 3.4% at 0.068, 0.125, and 0.250 μg/mL (Figure 5(c)). Moreover, the grape extract significantly inhibited tBHP-induced increase in TBARS levels by 23.3 ± 3.1, 20.1 ± 1.6, and 17.7 ± 3.4% at 0.068, 0.125, and 0.250 μg/mL (Figure 5(c)). Like TBARS levels, the grape extract significantly inhibited tBHP-induced increase in protein carbonyl levels by 41.50 ± 8.3%, 26.2 ± 4.6%, and 28.30 ± 7.9% at 0.068, 0.125, and 0.250 μg/mL, respectively (Figure 5(c)).
Discussion
In the present study, we investigated the possible enhancement of the antioxidant mechanisms of a grape pomace extract rich in polyphenols in the absence or presence of an oxidative stress-induced agent on muscle and endothelial cells. The grape pomace extracts was isolated from the Greek V. vinifera variety of Batiki Tyrnavou. In a previous study, we have identified the polyphenolic composition of the extract and have shown in vitro that it possesses strong antioxidant activity. 26
Our results showed that grape extract treatment without the presence of an oxidant stimulant in muscle cells enhanced their antioxidant status. Specifically, there was a dose-dependent decrease in total ROS levels within muscle cells. This finding was supported by the reduction in TBARS levels, a marker of lipid peroxidation. There was also a reduction in protein oxidation as indicated by the reduced protein carbonyl levels. Moreover, the grape extract induced an increase in GSH levels, one of the most important endogenous antioxidant molecules. 29 Therefore, the increase in GSH levels seems to be one of the molecular mechanisms accounting for the antioxidant activity enhancement by the grape extract in muscle cells.
Importantly, our results showed that the enhancement of the muscle cells’ antioxidant status by the grape extract was efficient to protect from the adverse effects of the oxidative stress-induced agent tBHP. Thus, when tBHP was added to muscle C2C12 cells after grape extract treatment, there were significantly lowered ROS, TBARS, and protein carbonyl levels compared with tBHP alone treatment. In vivo studies have also shown that grape extract administration reduces oxidative stress in skeletal muscles. For example, grape extract administration decreased lipid peroxidation in skeletal muscle of rats. 30 Another in vivo study has also shown that grape seed extract administration increased the antioxidant enzyme activity in skeletal muscles of diabetic rats. 31 Moreover, the present results showed that GSH levels were significant higher in muscle cells treated with grape extract before tBHP administration, compared to cells treated with tBHP alone. Interestingly, the GSH levels in muscle cells treated with grape extract before tBHP administration were even significantly higher than those in untreated cells. This finding emphasizes the crucial role the increased GSH levels may play in the observed antioxidant activity of the grape extract in muscle cells. Although several studies have shown that grape extracts protect from oxidative stress by increasing GSH in cardiac muscle and other tissues, this is the first report in skeletal muscle. 32,33
In addition, we investigated the possible antioxidant effects of the grape extract both in the presence and in the absence of an oxidant agent (tBHP) on endothelial EA.hy926 cells. In endothelial EA.hy926 cells, grape extract treatment without an oxidative stress stimulant enhanced the antioxidant mechanisms. Although this was similar to what observed in muscle cells, there were differences. Thus, like in muscle cells, the grape extract reduced significantly protein carbonyl level compared with untreated cells, indicating a reduction in protein oxidation. Again that protective effect seems to be attributed to the significant grape extract-induced increase in GSH levels compared with the untreated cells. However, in EA.hy926 cells, unlike in muscle cells, the grape extract did not reduce significantly ROS and TBARS levels. This lower potency in endothelial cells may be due to the lower grape extract concentrations used in EA.hy926 cells compared with C2C12 cells.
Furthermore, in endothelial EA.hy926 cells, the grape extract treatment protected from tBHP-induced oxidative stress as occurred in muscle cells. In particular, EA.hy926 cell treated with grape extract significantly inhibited tBHP-induced increase in TBARS and protein carbonyl levels. Also, in EA.hy926 cells similar to muscle cells, the grape extract-induced increase in GSH levels may account, at least in part, for the reduction in tBHP-induced oxidative stress. However, the GSH increase induced by the grape extract in EA.hy926 cells was lower than that in C2C12 cells. This difference may be explained by the lower grape extract concentrations used in EA.hy926 cells compared to those in C2C12 cells. Moreover, the grape extract may enhance the antioxidant status through other mechanisms, apart from GSH increase, that may differ between the two cell lines. Interestingly, a clinical study has shown that grape seed extract increased GSH plasma levels in type 2 diabetic subjects at high cardiovascular risk. 34 Thus, the results may suggest the use of grape pomace extracts to prevent oxidative stress-induced damage to endothelial cells and consequently to cardiovascular system. Interestingly, studies have shown that grape extract administration exhibited protection from myocardial ischemia–reperfusion injury, alleviation of cardiovascular function, and protection against fibrillation and ventricular tachycardia. 15 Moreover, in other studies, grape seed extract inhibited tumor necrosis factor-α-induced DNA oxidation in human umbilical vein endothelial cells (HUVECs), while grape skin and seed extracts inhibited glucose-induced increase in ROS in endothelial progenitor cells. 35,36 Feng et al. 37 have also reported that, in HUVECs, grape skin extract inhibited hydrogen peroxide (H2O2)-induced increase in ROS via activating the PI3-kinase/AKT pathway.
The antioxidant activity of grape extract is attributed to a large extent to its high polyphenolic content. Thus, the polyphenolic composition of the grape extract was assessed and different classes of polyphenols as flavan-3-ols, flavonols, anthocyanidins, anthocyanins, and phenolic acids were identified. All these polyphenols identified in the grape extracts exhibit antioxidant activity. 38,39 In particular, the flavanols, catechin, and epicatechin have been found to be among flavonoids with the most powerful free radical scavenging activity. Their free radical scavenging activity is attributed mainly to their chemical structure, especially to the structure of both benzene rings, A-ring and B-ring. 40 The antioxidant activity of flavanols is further increased by the presence of the trihydroxyl structure in the D ring in epigallocatechin-3-gallate (EGCG). 41 Quercetin has an identical number of hydroxyl groups in the same positions as catechin but also contains the 2,3-double bond in the C ring and the 4-oxo function. This structure advantage confers an enhancement of the antioxidant activity compared with the saturated heterocyclic ring of catechin. Anthocyanins, especially cyanidin and delphinidin, have also been reported for their strong free radical scavenging activity in many in vitro studies. 42 It has also been reported that anthocyanidins, such as cyanidin with the central unsaturated anthocyanidin C ring, allowing conjugation, have approximately the same antioxidant activity as quercetin. 43 The major antioxidant activity of the anthocyanins can be ascribed again to the reducing power of the o-dihydroxy structure in the B ring as in cyanidin and quercetin. 43 Finally, the free radical scavenging activity of the polyphenolic acid gallic acid is attributed mainly to its three available hydroxyl groups. 43 Apart from the direct free radical scavenging activity, polyphenols exert their antioxidant effects through modulation of molecular mechanisms in cells. For example, the flavanol EGCG has been shown to reduce the cytotoxicity evoked by H2O2 and increased the levels of the enzymes related to the oxidative stress, resulting in an enhanced cellular GSH content in HepG2 cells. 44 Moreover, quercetin protected human keratinocyte HaCaT cells from ultraviolet-induced oxidative stress through increased expression of antioxidant genes mediated by the transcription nuclear factor Nrf2. 45 Furthermore, the anthocyanidins, cyaniding and delphinidin, have been shown to prevent ROS formation in human aortic vascular smooth muscle cells through inhibition of mitogen-activated protein kinase (p38 MAPK) and c-Jun N-terminal kinase pathways. 46 Finally, gallic acid has been reported to protect rat pheochromacytoma PC12 cells from kainic acid-induced oxidative stress by reducing COX-2 and p38 MAPK levels. 47
In conclusion, the present results indicate that the tested grape pomace extract can enhance the antioxidant mechanisms of muscle and endothelial cells both in the presence and in the absence of an oxidative stress-induced agent. These findings suggest that the grape pomace extract may be used as a food supplement to reduce the adverse effects caused by oxidative stress-induced conditions in these cells. It is also worthwhile to mention that in both cell lines the antioxidant activity of the grape extract was observed at low concentrations (0.068–2.5 μg/mL for EA.hy926 and 2.5–10 μg/mL for C2C12 cells), while, in many studies, higher concentrations are used that are not physiologically meaningful or present toxicity.
Footnotes
Conflict of interest
The authors declared no conflicts of interest.
Funding
This work was cofinanced by the MSc program “Biotechnology-Nutrition and Environment” in the Department of Biochemistry and Biotechnology at University of Thessaly, Greece.