
Abstract
Palladium nanoparticles (Pd-NPs) and nickel oxide nanoparticles (NiO-NPs) were synthesized and loaded on activated carbon (AC). This novel material successfully used for the removal of methylene blue (MB) dye from aqueous medium. Full characterization of both material using X-ray diffraction, transmission electron microscopy, scanning electron microscopy and Brunauer–Emmet–Teller analyses for Pd-NP show their high surface area (>1340 m2/g) and low pore size (<20 Å) and average particle size lower than 45 Å and for NiO-NP show their high surface area (>1316.1554 m2/g) and low pore size (<20 Å) and average particle size lower than 46 Å in addition to high reactive atom and presence of various functional groups. These unique properties make them possible for efficient removal of MB. In batch experimental set-up, optimum conditions for maximum removal of MB by both adsorbents were attained following searching effect of variables such as central composite design. The Langmuir isotherm was found to be highly recommended for fitting the experimental equilibrium data. The kinetic of adsorption of MB on both adsorbents strongly can be fitted by a combination of pseudo-second order and intraparticle diffusion pathway. The experimental result achieved in this article shows the superiority of Pd-NP-AC for MB removal than NiO-NP-AC, so the maximum adsorption capacities of Pd-NP-AC and NiO-NP-AC were 555.5 mg/g and 588.2 mg/g, respectively.
Keywords
Introduction
Dyes and pigments present in various ecosystem associated with pollutants toxicity and hazards and enter into the environment through dyestuff manufacturing, colouring, printing and textile finishing. The complicated structures of dyes make them to be stable against photodegradation, biodegradation and oxidizing agents. 1 Various waste water treatment approaches classified as physical, chemical and biological processes. Amongst these approaches, adsorption (physical pathway) was widely used for cleaning and remediation of compounds. 2 Agricultural waste materials as inexpensive and readily available natural resources have low adsorption capacity and their regenerations are difficult. 3,4 There is a great interest and emphasis to restrict the production and emission of carbon to global warning that this idea enhances the utilization of nanoparticle (especially loaded on activated carbon (AC)) as renewable natural resource. Various waste water treatment techniques 5 –10 based on physical and chemical methods are expensive, generate large amount of sludge or not applicable for large volumes of effluent without clogging. 9 Natural and locally available materials or waste product (industrial or agricultural) are other highly efficient inexpensive adsorbents. The focus of the research is to evaluate the adsorption capacity of nanoparticle-loaded AC in the adsorption of methylene blue (MB). MB is the most commonly used material for dying cotton, wood and silk and has strong tendency for the adsorption onto solids, hence this property may be emerged from its high hydrophilicity. Adsorption is a highly recommended waste water treatment technique due to its unique properties such as low cost, flexibility and simplicity of design and simple operation and insensitivity to toxic pollutants. In our current research, various nanoparticles based on central atoms such as cadmium, silver, zinc, nickel, gold, platinum, or palladium was used efficiently as noble metal or compound for dye removal. Some of these adsorbents posses limitations and drawbacks such as toxicity, 10 –13 high cost and low reusability, 14 –16 and these drawbacks can be overcome by the syntheses of two novel adsorbents (nickel oxide nanoparticle (NiO-NP) and palladium nanoparticle (Pd-NP)) for dye removal as non-toxic and low-cost materials. NiO with magnetic property quite different from its bulk counterpart has remarkable properties such as hydrogen storage and catalyst properties. The azo dyes with the presence of one or several azo (–N=N–) groups in substituted aromatic rings and their high resistance to biodegradation are very toxic to living organisms. The MB leads to generation of cancer following inhalation, ingestion and/or exposed to eye, skin, respiratory and gastrointestinal systems. These difficulties and hazardous problems make it necessary to design low-cost, non-toxic, green and high-capacity materials capable of removing high-quantity MB before waste water discharge into water resource. 17,18 In this research, two new adsorbents including NiO-NP and/or Pd-NP loaded on AC have been synthesized and applied for the removal of MB from waste water. Influence of variables such as pH, amount of adsorbent and contact time on removal process investigated and optimized. The criterion for selection of these nanoparticles is their low cost, less toxicity, high selectivity (emerged from the presence of huge amount of highly reactive metallic centre), cost-effectiveness (low-cost material such as NiO or Pd atom) and good removal performance in short time (removal percentage is >95%, i.e. <12 min).
Experimental
Materials and instruments
A stock solution of MB (Figure 1) of 100 mg/L was prepared by dissolving 50 mg of dye in 500 mL of double distilled water and working solutions prepared by subsequently monitoring the MB content using calibration curve obtained at similar condition to working experiments, especially pH value. The pH was adjusted by the addition of hydrochloric acid (HCl) and/or potassium hydroxide (KOH) solution. The adjustment of pH was carried out using pH/ion meter (model 692; Metrohm, Herisau, Switzerland) and the quantification of MB was carried out using UV-visible spectrophotometer (model V-570; Jasco, Tokyo, Japan). Chemicals such as KOH, potassium chloride (KCl), HCl, MB and AC (analytical grade, 80–100 mesh) are supplied by Merck (Darmstadt, Germany). X-ray diffraction (XRD) pattern was recorded using an automated (Philips, Netherland) X'Pert X-ray diffractometer (Philips, Netherlands) with copper (Cu) Kα radiation (40 kV and 30 mA) for 2θ values over 20–80°. The shape and surface morphologies of the NiO-NP and Pd-NP were investigated using field emission scanning electron microscope (FESEM; model S4160; Hitachi, Tokyo, Japan) under an acceleration voltage of 15 kV. A Brunauer–Emmet–Teller (BET) surface analyzer (model NOVA 2000; Quantachrome, Boynton Beach, Florida, USA) was used to measure nitrogen adsorption–desorption isotherm at 77 K to obtain information about surface area, total pore volume and micropore area. Before each study, the samples were degassed via helium purging at 553 K for 3 h. Thermoluminescence analysis of NiO-NP was carried out using thermoluminescence analyser (model 4500; Harshaw, Japan). Transmission electron microscopy (TEM) samples were prepared by dropping diluted solutions of nanoparticles onto 400-mesh carbon-coated Cu grids with the excessive solvents immediately evaporated. A TEM (model H-800, Hitachi) at an operating voltage of 200 kV determined the morphology and electron diffraction pattern of the nanoparticles.
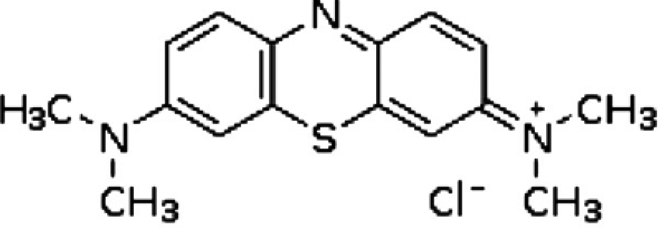
The structure of MB. MB: methylene blue.
Measurements of dye uptake
The influence of pH on MB removal over pH range of 2–8 using 50 mL of 20 mg/L of its solution was investigated over 30 min at 300 r/min. Isotherm studies were conducted at room temperatures at an MB concentration in the range of 5–40 mg/L and the amount of adsorbed dye, q
e (mg/g), was calculated according to the following equation:

where C 0 and C e are the initial and equilibrium dye concentrations (mg/L) of solution, respectively. V is the solution volume (L) and W is the mass of the adsorbent (g). Pd-NP-loaded AC synthesized according to previous literature. 17,19,20
NiO-NP synthesis
The nickel nitrate solution (0.1 mol/L aqueous) was magnetically stirred at 70°C. Subsequently, the ammonium hydroxide was added dropwise until the formation of a precipitate. The impurity was rinsed by ethanol and deionized water. The precipitate in a vacuum oven was heated and calcinated at 500°C for 2 h that leads to the formation of NiO-NPs.
Results and discussion
Characterization of Pd-NP-loaded AC
The Pd2+ ions were reduced and stabilized by starch, and the property of this nanoparticle depends on the concentration of all reagents and the order of their addition, pH and time of mixing. In all stages, the formation of Pd nanoparticles was followed by UV-vis to study its surface plasmon resonance. Various experimental conditions were used to prepare the Pd nanoparticles and it was found that most of the nanoparticles were formed by mixing 400 μL of 0.4 M PdCl42− with 0.2 w/w of starch after 4 h. Addition of starch as reducing agent to Na2PdCl4 led to diminish the intensity of strong ligand to metal charge-transfer bands correspond to salt at 245 nm and 290 nm. The origin of these two peaks corresponds to product of PdCl3 (H2O) hydrolysis. 21 The colour change from pale yellow (prior to reduction) to dark brown (after reduction) strongly supports and confirms its formation. 22 The reduction of Pd2+ ions with 1:1 solution of 0.5 mm ascorbic acid and 0.2 w/w of starch aqueous solution at 80°C leads to the formation of Pd nanoparticles that are stable in solution for several months. These results confirm that the ascorbic acid and starch are reducing and antioxidant agents. The FESEM investigation of deposited AC and bare AC shows that the homogeneous and relatively smooth surfaces of AC highly disperse in surface without any aggregation (uniform in size between 15 and 50 nm). FESEM image shows that the size was between 20 and 70 nm. The particle size measured directly from this FESEM image agrees with that determined by the TEM image. A typical TEM image of the Pd-NP is displayed in Figure 2. According to the general reference protocol of BET measurement, the specific surface area (SSA) and pore size distribution were studied by nitrogen (N2) at 77 K. 23 SSA is the accessible area of adsorbent surface per unit mass of material. The interference by the surrounding phase is especially problematic for the BET N2 adsorption/desorption isotherm method because the entire surface is modified by vacuum treatment before N2 adsorption. Table 1 and Figures 3 to 7 show that the narrow microporosity of adsorbent with surface area of 1340.0740 m2/g, total pore volume of 0.237423 cm3/g and average pore diameter less than 20.0718 Å.

TEM images of the Pd nanoparticles deposited on AC. TEM: Transmission electron microscopy; Pd: palladium; AC: activated carbon.

Isotherm linear plot of Pd-NP-AC and NiO-NP-AC. Pd-NP-AC: palladium nanoparticle loaded on activated carbon; NiO-NP-AC: nickel oxide nanoparticle loaded on activated carbon.
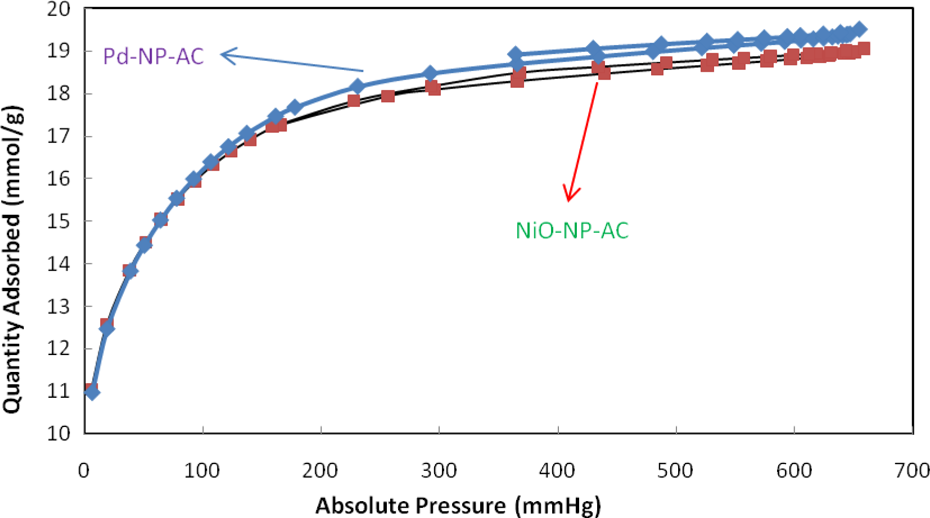
Isotherm linear absolute plot of Pd-NP-AC and NiO-NP-AC. Pd-NP-AC: palladium nanoparticle loaded on activated carbon; NiO-NP-AC: nickel oxide nanoparticle loaded on activated carbon.

Isotherm pressure composition of Pd-NP-AC and NiO-NP-AC. Pd-NP-AC: palladium nanoparticle loaded on activated carbon; NiO-NP-AC: nickel oxide nanoparticle loaded on activated carbon.

BJH method for describing cumulative adsorption pore volume (larger) using Halsey:Faas correction of Pd-NP-AC and NiO-NP-AC. BJH: Barrett–Joyner–Halenda; Pd-NP-AC: palladium nanoparticle loaded on activated carbon; NiO-NP-AC: nickel oxide nanoparticle loaded on activated carbon.
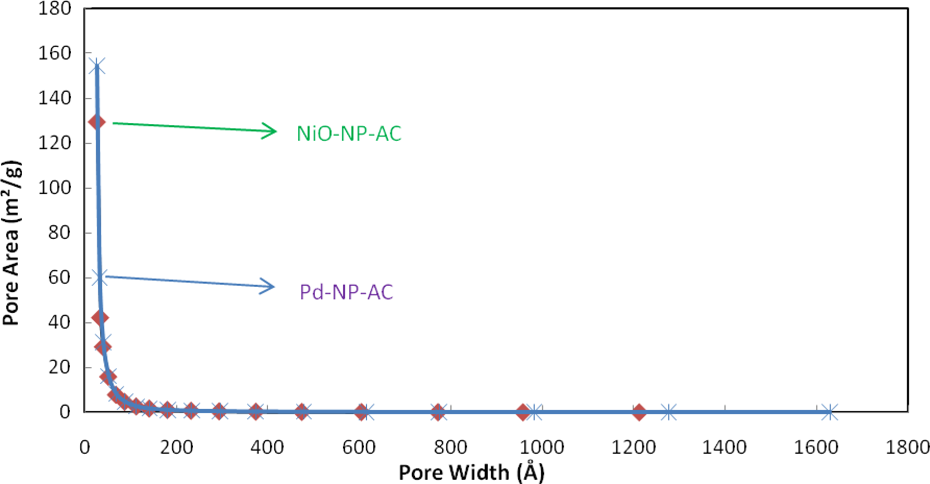
BJH method for describing cumulative adsorption pore area (larger) using Halsey:Faas correction of Pd-NP-AC and NiO-NP-AC. BJH: Barrett–Joyner–Halenda; Pd-NP-AC: palladium nanoparticle loaded on activated carbon; NiO-NP-AC: nickel oxide nanoparticle loaded on activated carbon.
BET analysis of Pd and NiO-NPs loaded on AC.

BET: Brunauer–Emmet–Teller; Pd: palladium; NiO-NP: nickel oxide nanoparticle; AC: activated carbon; BJH: Barrett–Joyner–Halenda.
Characterization of NiO-NP loaded on AC
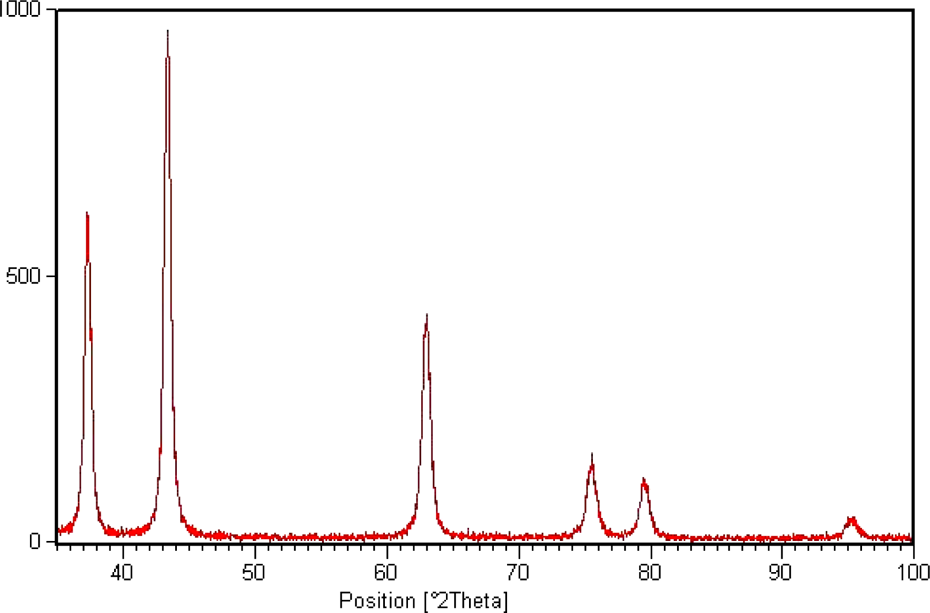
In this research, Cu capitation approach was used for the preparation of Ni and NiO-NP. Hydrazine act as a reducing agent and surfactant as stabilizing (coping) agent hinder from aggregation and agglomeration. As it can be seen, In this reaction, pH has a strong influence on the formation of nanoparticles and its subsequent properties. The parameters including solvent, reaction time and pH, concentration of reagent and order of their mixing, temperature and concentration and type of surfactant significantly affect the properties of nanoparticle. The NiO-NP were filtered and washed with deionized water and ethanol. It has to be mentioned that rinsing with water lead to impregnation of impurities that appeared and proofed in the XRD pattern. The XRD pattern shows the cubic face centre (FCC) with five distinguished peaks correspond to the following planes (111), (200), (220), (311) and (222), which has a good agreement with the reference value of nickel. The sharp and smooth XRD pattern has its high purity and crystallinity, whilst the scanning electron microscopy (SEM) analysis shows the spherical- and narrow-sized distribution of nanoparticles. Temperature and reaction time have deeply influenced the reaction rate and its upper range limited by the boiling point of solvent. Amongst various temperatures (room temperature, 80 and 95°C), it was found that increasing the temperature till 95°C led to an increase in the rate of reaction and nucleation and subsequent crystal growth due to increase in their kinetic energy. Changing the reaction time at this optimum temperature until 24 h shows that maximum amount of low crystalline size was achieved after 8 h. It is well known that processes including nucleation and crystal growth strongly compete during precipitation reaction. At initial and low time, the first process and laterally the crystal growth is the predominant mechanism. It was found that by increasing the time, the size of the nanoparticles partially increased and subsequently did not change. At higher time, following the agglomeration and adhesion of particles led to the crystal growth. One of the most important parameters that greatly influence the size and properties of nanoparticle is the order and concentration of all reagents. It was found that by increasing the initial concentration of the reagent the nanoparticle size change from nono-scale to the microcrystal. At lower concentration of hydrazine, the rate of reduction (number of reduced ion) is low, whilst their higher concentrations lead to a generation of high amount of initial unclear and lower size of nanoparticle. According to the super saturation ratio, at a very high concentration due to the predominance of nucleation a lower size was obtained. Dropwise addition and vigorous stirring of reagent in high volume results in achieving a lower size nanoparticle. On the other hand, a higher concentration for reagent probably due to the increased kinetic energy of particle and subsequent coagulation lead to an increase in their particle size. It was found that in the absence of surfactant as the stabilizing agent, the higher size was achieved. Addition of surfactant concentration above critical micelle concentration (CMC) leads to the formation of internal cores wherein the nanoparticles are trapped. Above this value, the surfactant concentration does not have a significant influence on the size and properties of NiO-NPs. At a concentration lower than CMC due to the lack of a sufficient trapping media, the size of NiO-NP decreased. The schematic diagram of Ni reduction confirms the significant role of pH on the rate and nature of chemical reaction. It was found that lower rate of chemical reaction in acidic media strongly enhanced by increasing pH value. On the other hand, raising the pH value via the acceleration of precipitation reaction leads to the generation of a high amount of non-powder compound. The XRD pattern of NiO shows the presence of six peaks assigned to the following planes (111), (200), (220), (311), (222) and (400), which has good agreement with reference NiO with number 00-047-1049. The sharp high intensity without any extra peaks indicates the high purity of the compound. The SEM investigation shows spherical shape with narrow pore size distribution in nanoscale. The investigation of the thermoluminescence of NiO-NP shows an intense peak with maximum at around 463 K (Figure 8). Our survey through literature did not show report on such investigation that may be attributed to low sensitivity (or oven non-sensitive) of such crystal to γ-irradiation. It was found that the produced NiO-NP also has low sensitivity to this type of radiation. In subsequent experiments, the photoluminescence (PL) of NiO-NP was recorded by PL instrument showing its presence at a maximum of around 328, 341 and 357 nm. This PL spectrum composed of two excitation and emission bands at 392 and 549 nm, respectively. Comparison of PL peak of nanoparticles with bulk material shows the higher intensity, whilst the blue shift strongly confirms the decrease in size emerged from quantum size effect (Figure 9). In this research, simple, low-cost and green chemistry approach was designed for the synthesis of nanoparticles. This nanoscale material in comparison with bulk value due to their high-surface area and higher surface reactive atom is applicable to various fields. In this research, the nanoparticles were synthesized in room temperature through a mild correlation and the ability to produce a high amount of nanoparticles with controllable size facilitated by the presence of surfactant. The FESEM images of the NiO-NPs deposited on AC are shown in Figure 10. From both the figures, it may be seen that the images are spherical in shape and particle sizes are in the nanorange. NiO-NPs were synthesized at different conditions both in the presence and in the absence of surfactant. Three different surfactants were used as cationic cetyl trimethyl ammonium bromide (CTAB), anionic sodium dodecyl sulfate and non-ionic Triton X-100. All the experimental conditions are shown in Table 2. The XRD pattern of powdered precipitated fractions of the NiO-NPs shows its FCC structure (Figure 11). XRD analysis of NiO-NP prepared in different conditions showed appearance of five peaks in the plane of (111), (200), (220), (311) and (222). These values were also in good agreement with the literature data of crystalline NiO. 19,24 –26 SEM analysis of NiO-NPs shows spherical, small size of NiO-NP with a homogenous size distribution. The measurement of magnetic properties and the hysteresis curve of the samples was carried out using vibrating sample magnetometer at room temperature and the results are shown in Figure 10. The figure shows that the NiO-NPs are ferromagnetic in nature. The degree of saturation magnetization and coercive field of the nanoparticle are 6.4 emu/g and 220 Oe, respectively. The magnetization of the pure bulk Ni is approximately 55 emu/g, and this difference is related to the existence of polymer or oxide layers on the nanoparticle’s surface. The materials with the above magnetic properties are very suitable for the application in magnetic coating and ferrofluids. However, these ferromagnetic nanoparticles exhibit non-zero magnetization, which increases with a reduction in their size. 19,24 –26 The magnetic properties of nanostructures are highly dependent on the particle size. This emphasizes that atoms exist on the surface and non-zero spins play an important role in determining the magnetic properties. Magnetic properties of NiO-NP in the presence and absence of CTAB are presented in Figure 12 and Table 2. Therefore, the two new safe, green and non-toxic adsorbents with high adsorption capacities seem to be suitable materials for MB removal. The particle surface becomes much smoother than that of the original particle following dye adsorption. Determination of SSA by N2 at 77 K adsorption isotherms assumed to measure the surface area in microspores within pore sizes of a material. 19 SSA is the accessible area of adsorbent surface per unit mass of material. The interference by the surrounding phase is especially problematic for BET N2 adsorption/desorption isotherm method because the entire surface is modified by vacuum treatment before N2 adsorption. Table 1 and Figures 3 to 7 show that adsorbent possessed appreciable narrow microporosity. Figures 3 and 4 show the reversible sorption and subsequent desorption of N2 as an inert gas that only can diffuse to the interior pore of adsorbents. It is so small that can bind all vacant sites of adsorbent until saturation. The surface area of NiO-NP was found to be 1316.2 m2/g. Total pore volume is 0.2 cm3/g and average pore diameter is <20.0002 Å. Total surface properties of adsorbent are presented in Table 1 and Figures 3 to 7. In preliminary experiments, it was found that whilst bare AC is efficient for the removal of about 85% of MB in 35 min, the removal percentage increased more than 95% within 25 min after the addition of nanoparticles.

Thermoluminescence spectrum of NiO-NP. NiO-NP: nickel oxide nanoparticle.

Luminescence spectra of NiO-NPs. NiO-NP: nickel oxide nanoparticle.
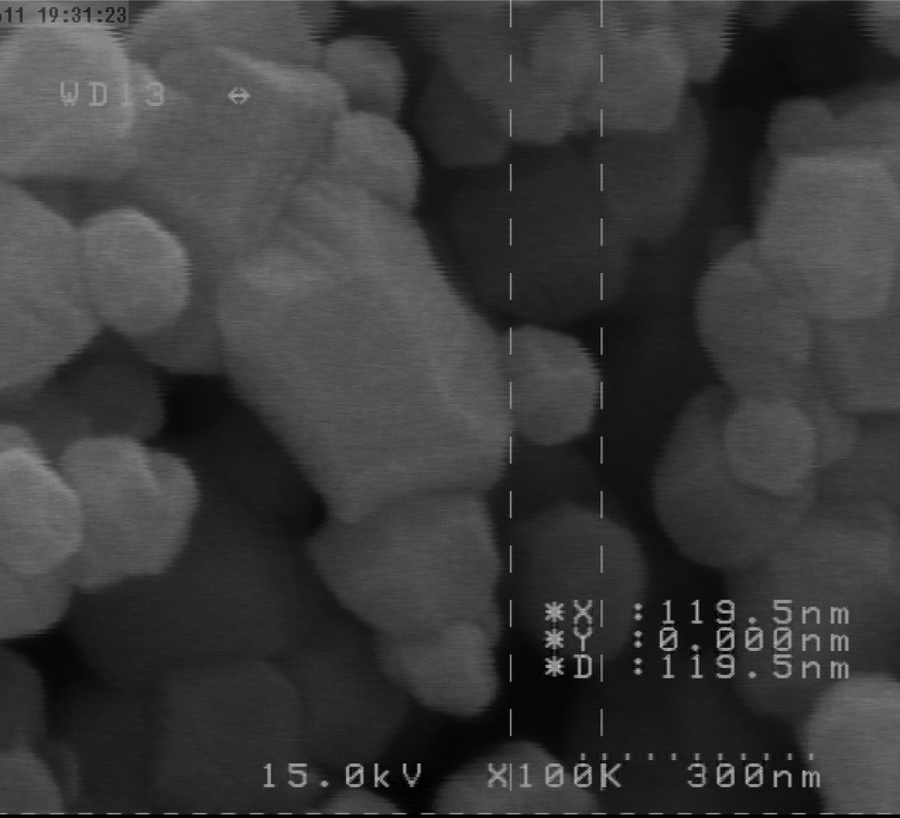
SEM images of NiO-NP. SEM: scanning electron microscopy; NiO-NP: nickel oxide nanoparticle.
XRD pattern of the citrate-stabilized NiO-NPs. XRD: x-ray diffraction; NiO-NP: nickel oxide nanoparticle.

Magnetic properties of NiO-NP stabilized with CTAB. NiO-NP: nickel oxide nanoparticle; CTAB: cetyl trimethyl ammonium bromide.
Different conditions of NiO-NP preparation.

NiO-NP: nickel oxide nanoparticle; CTAB: cetyl trimethyl ammonium bromide; SDS: sodium dodecyl sulfate.
Effect of pH
The effect of pH strongly influences the charge, local resonance and binding property of dyes. On the other hand, the functional group of AC was strongly affected by the acidity of the solution. pH in the range of 2–8 on MB adsorption onto both adsorbents shows that maximum removal percentage was achieved at pH of 6 for NiO-NP-AC and 5 for Pd-NP-AC (Figure 13). It seems that at this pH, the negative charge of adsorbents increases the electrostatic interaction and the rate of diffusion strongly enhanced by rising non-localized π electron that accelerate binding through π–π and hydrogen bonding. It is expected that metallic centre via soft–soft interaction accelerates the adsorption process. A high concentration of hydrogen ion at low pH leads to protonation of AC functional group. Therefore, electrostatic repulsive force hinders from more adsorption of MB (cationic dye) onto positive charge adsorbents. 27 In the aqueous solution, the MB first dissolved and its sulfonate groups (D-SO3Na) dissociated and converted to approximate neutral charge (around pH of 6.0). 28 At low pH, due to protonation of MB and adsorbents their interactions significantly decreased.

(a) Effect of initial pH adsorption of MB (15 mg/L) onto Pd-NP-AC (0.015 g) at 25°C and (b) effect of initial pH adsorption of MB (15 mg/L) onto NiO-NP-AC (0.015 g) at 25°C. MB: methylene blue; Pd-NP-AC: palladium nanoparticle loaded on activated carbon; NiO-NP-AC: nickel oxide nanoparticle loaded on activated carbon.
Effect of contact time and initial concentration of MB
Adsorption time is the most critical parameter in removal process and permits to achieve a fast and low cost waste water treatment. The required time greatly depends on variables such as initial dye concentration, amount of adsorbent and the rate and type of mixing mechanism. 19 The effect of time on the MB adsorption onto NiO-NP-AC and Pd-NP-AC at various initial MB value onto various amount of adsorbent (0.005–0.015 g) was studied as a function of contact time and typical result is shown in Figure 14(a) and (b). It was seen that for all initial concentration, the required time to reach equilibrium by raising the amount of adsorbent reduced. On the other hand, at fixed amount of adsorbent by raising the initial MB concentration, the equilibrium time and the actual amount of adsorbed dye increased and counter currently the adsorption capacity reduced (Figure 15(a) and (b)). It was found that 25 min of stirring at 300 r/min is sufficient for complete adsorption of MB on both adsorbents. At higher value of adsorbent and lower MB concentration, a high initial rapid adsorption was observed that attributed to the availability of the high surface area (high concentration gradient) as that accelerate migration and diffusion of MB on both adsorbents. At lower adsorbents, mass and higher initial concentration due to saturation of surface of adsorbents and increase in repulsive force hinder from higher adsorption and reduce the removal percentage. 15 Further experiments were conducted at 25 min of stirring time. By increasing the stirring time from 0.5 to 30 min, a great increase in Q m to 588.2 mg/g was observed. Amongst both adsorbents, at fixed time a higher value of Q m for Pd-NP-AC toward NiO-NP-AC is attributed to the higher tendency of the soft central palladium atom toward various functional groups of dye.

(a) Effect of contact time on adsorption of MB (20 mg/L) onto Pd-NP-AC (0.005–0.015 g) at 25°C and (b) effect of contact time on adsorption of MB (20 mg/L) onto NiO-NP-AC (0.005–0.015 g) at 25°C. MB: methylene blue; Pd-NP-AC: palladium nanoparticle loaded on activated carbon; NiO-NP-AC: nickel oxide nanoparticle loaded on activated carbon.
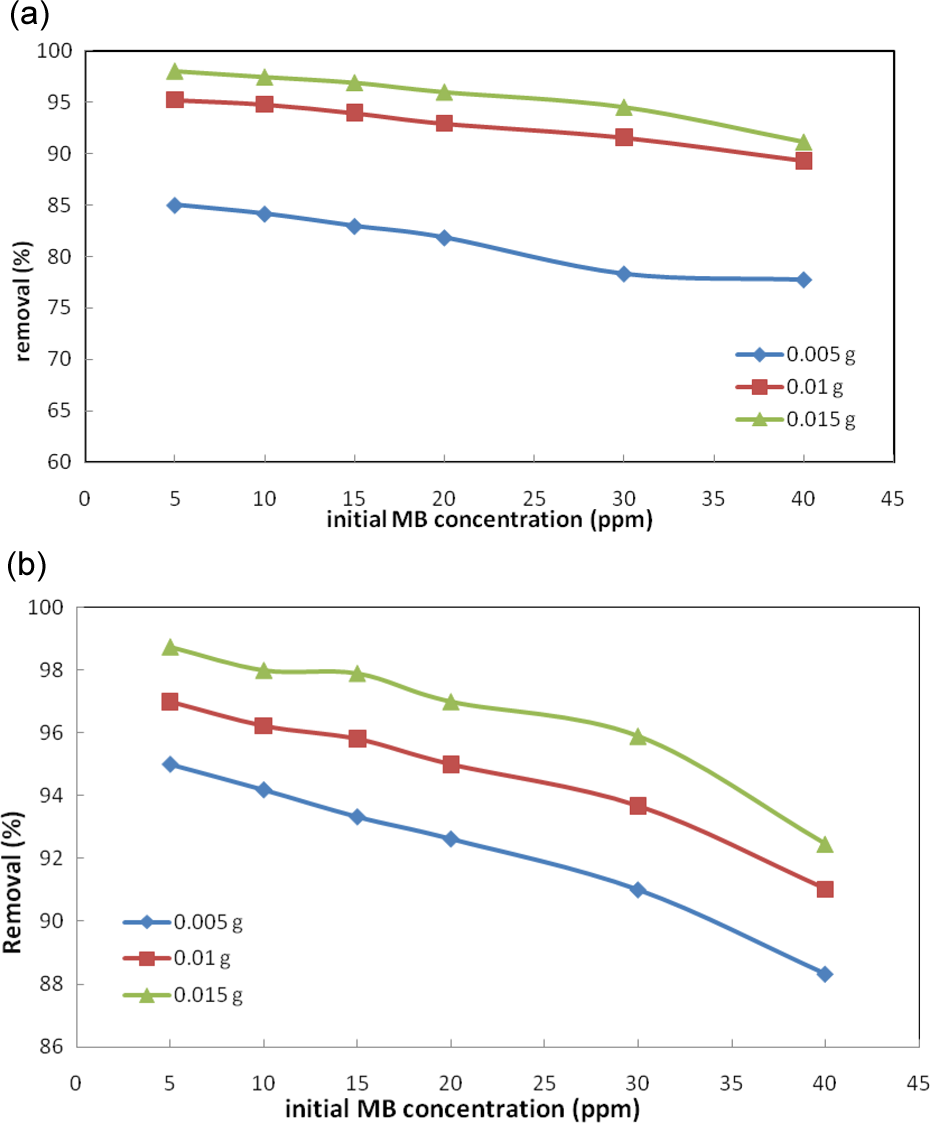
Effect of initial concentration on MB removal at room temperature. (a) Pd-NP-AC and (b) NiO-NP-AC. MB: methylene blue; Pd-NP-AC: palladium nanoparticle loaded on activated carbon; NiO-NP-AC: nickel oxide nanoparticle loaded on activated carbon.
Effect of adsorbent mass
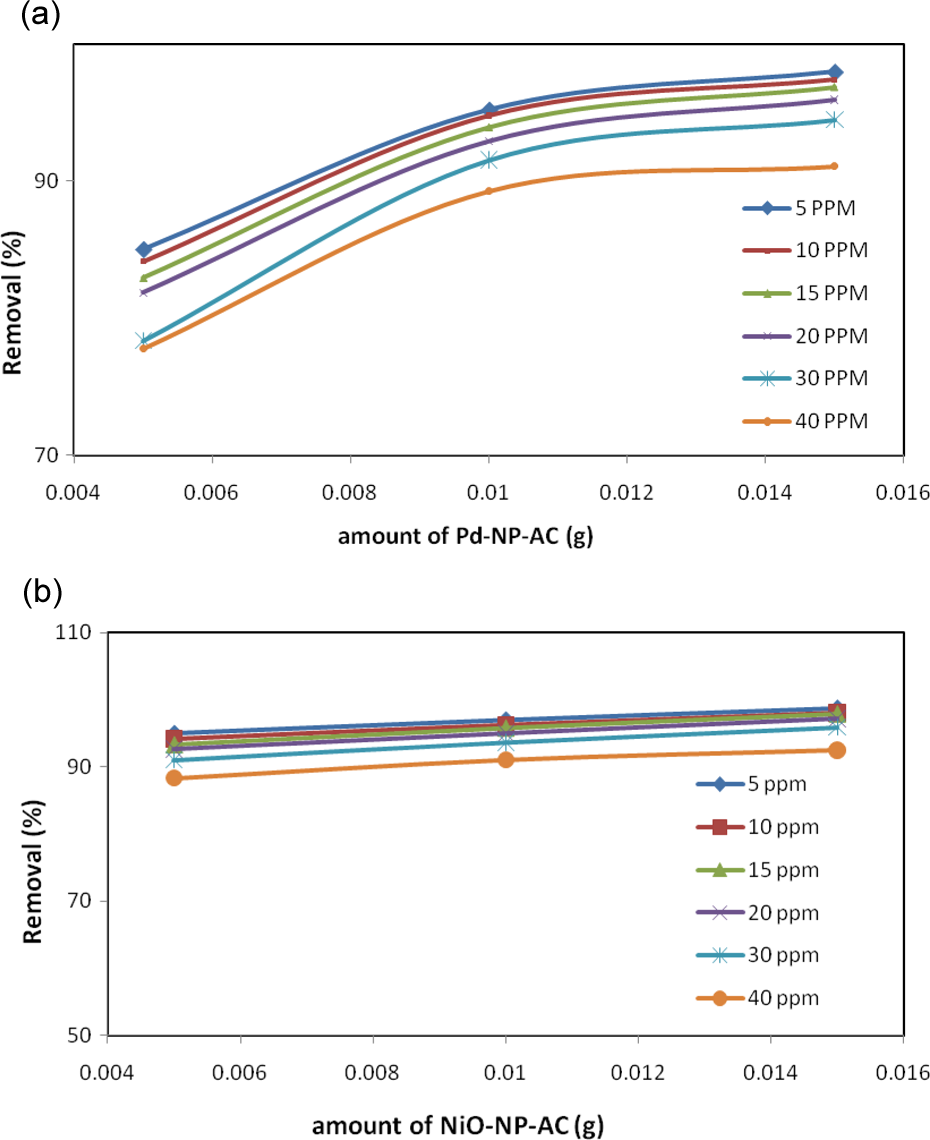
The investigation of removal percentage versus initial dye concentration of MB and adsorbent mass shows that for both adsorbents a similar pattern was followed. It was seen that by increasing the initial dye concentration at each adsorbent mass, the removal percentage and actual amount of adsorbed dye have opposite correlation, which leads to a decrease in removal percentage and an increase in the actual amount of adsorbent probably at higher dye concentration even at higher adsorbent mass due to the repulsive force between initially adsorbed layer and later molecule and saturation of adsorbent surface, the removal percentage decreased (Figure 16(a) and (b)). From electrostatic point of view, monolayer adsorption mechanism is used. 20
(a) Effect of amount of Pd-NP-AC on adsorption of MB (5–40 mg/L) at 25°C and (b) effect of NiO-NP-AC on adsorption of MB (5–40 mg/L) at 25°C. Pd-NP-AC: palladium nanoparticle loaded on activated carbon; MB: methylene blue; NiO-NP-AC: nickel oxide nanoparticle loaded on activated carbon.
Adsorption equilibrium
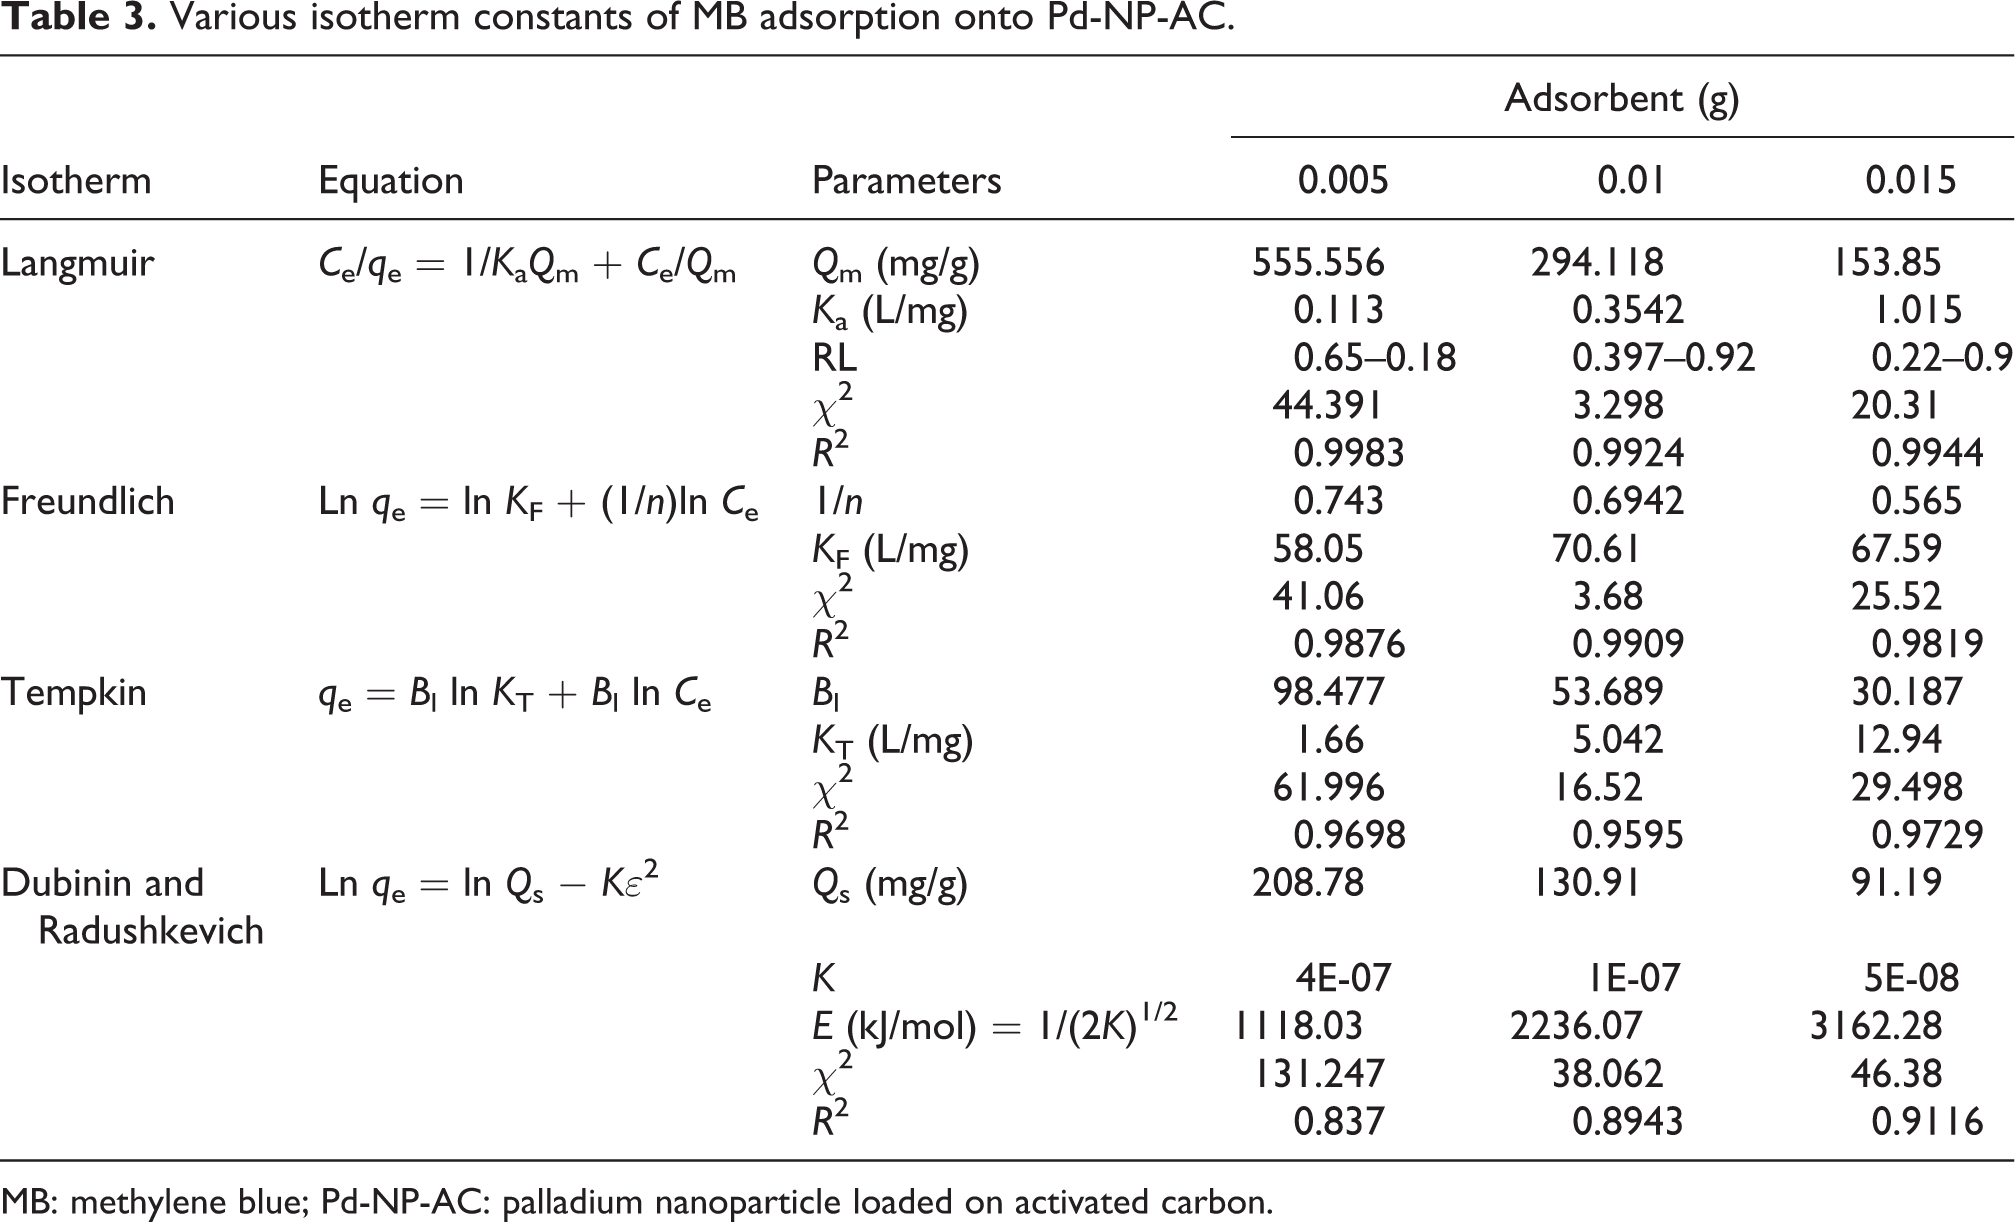
Adsorption isotherm studies are preliminary steps used to design efficient adsorption systems that empirically are applicable to explain the equilibrium relationship between MB concentrations (adsorbent and removal in solution). The equilibrium adsorption of MB (q e vs. C e) onto both adsorbents was investigated at some different adsorbent masses to achieve conditions for real applicability of both adsorbents in waste water treatment. The experimental equilibrium data of MB adsorption were fitted to conventional isotherm models such as Langmuir, Freundlich, Tempkin and Dubinin–Radushkevich isotherms with known assumption presented in Table 3 for Pd-NP-AC and Table 4 for NiO-NP-AC. It was found that for both adsorbents, the adsorption capacity reduced. These results show high efficiency of lower adsorbent mass for dye removal. The Langmuir isotherm 29 was found to be linear over the entire concentration range studies with a good linear correlation coefficient (R 2 = 0.999), which is higher than the other two isotherm values. The monolayer saturation capacity of this new adsorbent, Q m, was found to be 555.5 mg/g for Pd-NP-AC and 588.2 mg/g for NiO-NP-AC (from 0.005 g to 0.015 g). The k a of Langmuir model strongly increased by increasing the amount of adsorbent from 0.005 to 0.015 g. This may be attributed to the increase in tendency of MB molecules for diffusion to the adsorbent.
Various isotherm constants of MB adsorption onto Pd-NP-AC.
MB: methylene blue; Pd-NP-AC: palladium nanoparticle loaded on activated carbon.
Various isotherm constants of MB adsorption onto NiO-NP-AC.

MB: methylene blue; NiO-NP-AC: nickel oxide nanoparticle loaded on activated carbon.
Freundlich isotherm
The Freundlich isotherm (non-linear model) contributed to the explanation of exponential adsorption of target compound on heterogeneous surfaces. Tables 3 and 4 show the linear equation of this model. 30 In the equation, q e is the amount of MB adsorbed (mg/g), C e is the equilibrium MB concentration in solution (mg/L) and K F and n (rate constants) indicate the extent of adsorption and the degree of non-linearity of adsorption. A higher value of K F indicates a higher capacity for adsorption than a lower value. The Freundlich constants calculated from the linear equations are summarized in Tables 3 and 4. The values of 1/n in the range of 0–1 show favourable adsorption on all adsorbents. The 1/n value decrease by increasing the amount of adsorbent from 0.005 g to 0.015 g, which may be attributed to the thermodynamically favourable nature of MB adsorption on both adsorbents. The K F value also change the range from 58.05 to 71.61 L/mg by increasing the adsorbent mass from 0.005 g to 0.015 g, which support and confirm higher capacity of adsorbents toward MB.
The Dubinin–Radushkevich isotherm
The Dubinin–Radushkevich (D-R) model was also applied to estimate the porosity, free energy and the characteristics of adsorbents.
31,32
The D-R isotherm does not assume a homogeneous surface or constant adsorption potential. The D-R model has commonly been applied in the following equation (2) and its linear form can be shown in equation (3):

where B is a constant related to the adsorption energy, Q
s is the theoretical saturation capacity and ε is the Polanyi potential that can be calculated from equation (4).
The slope of the plot of ln q
e versus ε
2
gives B (mol2/(kJ2)) and the intercept yields the adsorption capacity, Q
s (mg/g). The mean free energy of adsorption (E) is calculated according to following relation:
33

The calculated value of D-R constant model shows that the saturation adsorption capacity was in the range of 208.8–91.2 mg/g for Pd-NP-AC and 253.5–96.2 mg/g for NiO-NP-AC and also has good agreement with respective Langmuir value (Tables 3 and 4). The values of E were between 1118 and 3162 kJ/mol for Pd-NP-AC and 2236 and 3535 kJ/mol for NiO-NP-AC corresponding to physicosorption process that plays a significant role in the adsorption of MB. The positive correlation between E and mass of adsorbent shows higher tendency of dye molecule for adsorption onto adsorbents’ surface.
Tempkin isotherm
Tempkin isotherm contains a factor that explicitly account for adsorbing species–adsorbent interactions
16,34
and is given in linear form as follows:
Equation (6) can be linearized as:
where RT/b = B. A is the equilibrium binding constant corresponding to the maximum binding energy (L/mg), b is the Tempkin isotherm constant (J/mol) and B (dimensionless) is related to the heat of adsorption. The adsorption data were analyzed according to equation (7) and Tempkin constants A and B are listed in Tables 3 and 4. The correlation coefficient is higher than the Freundlich value but lower than the Langmuir value (Tables 3 and 4). The suitability of Langmuir data for interpretation of experimental suggests that MB adsorption is limited to monolayer coverage and the surface is relatively homogenous in terms of functional groups with significant interaction with MB molecules. 35 –37
Kinetic study
The kinetic investigation shows useful information about the mechanism of adsorption according to initial rapid binding of dye molecules to the adsorbent surface and final relatively slow intraparticle or pore diffusion. The adsorption kinetic data were described by various kinetic models 38 –41 and presented in Tables 5 to 7 for Pd-NP-AC and Tables 8 to 10 for NiO-NP-AC. Well-known Lagergren pseudo-first-order model is presented in Tables 5 to 7 and 8 to 10. In this model, q e and qt are the adsorption capacities at equilibrium and time t (mg/g), respectively, K 1 is the rate constant of pseudo-first-order adsorption (L/min). The slope and intercept of plot belong to this model usually applied for evaluation and determination of K 1 and q e. Comparing the experimental q e value, it may be concluded that this kinetic model is not well fitted. In this model, it is expected that the adsorption rate is proportional to the first power of concentration and is not applicable to the pore diffusion that is a predominant step. Due to the unusability of this model for the entire adsorption process, the kinetic data must be analyzed using second-order kinetic model based on well-known relationship expressed in Tables 5 to 7 and 8 to 10. In this model, K 2 (g/mg min) is the second-order rate constant of adsorption. It was seen that the plots of t/qt versus t are linear and its intercept and slope are determined. Values of K 2 and equilibrium adsorption capacity (q e) were calculated from the intercept and slope of the plots of t/qt versus t, respectively. The values of R 2 (more than 0.999) and closeness of q e to the experimental data show the applicability of this model for analysis of kinetic data (Tables 5 to 7 and 8 to 10). Transportation of the dyes from the solution phase into the pores of the adsorbent may also be considered as the rate controlling stage in batch experiments under rapid stirring conditions. Due to the difference in the rate of adsorption and diffusion of dye molecule onto adsorbents’ surface probably more than one kinetic model is applicable and required to interpret the experimental data. The deviation of straight lines from the origin may be emerged from difference between the rate of mass transfer in the initial and final stages of adsorption and shows that in addition to intraparticle diffusion of another kinetic model (because second-order kinetic model) involves the adsorption process. It was found that two separate linear regions obtained may be attributed to the bulk diffusion and the intraparticle diffusion. The value of interparticle constants such as k i and C can be obtained from the slope and intercept of respective lines by plotting qt versus t 0.5. Minimum value of C shows less importance for boundary layer in the adsorption procedure (Tables 5 to 7 and 8 to 10). The equilibrium data were also fitted with the Elovich model. From the correlation coefficient value, it might be concluded that this model was not fitted well .
Kinetic parameters of MB adsorption onto Pd-NP-AC. Conditions: 0.005 g adsorbent over 5–40 mg/L at optimal conditions of other variables.
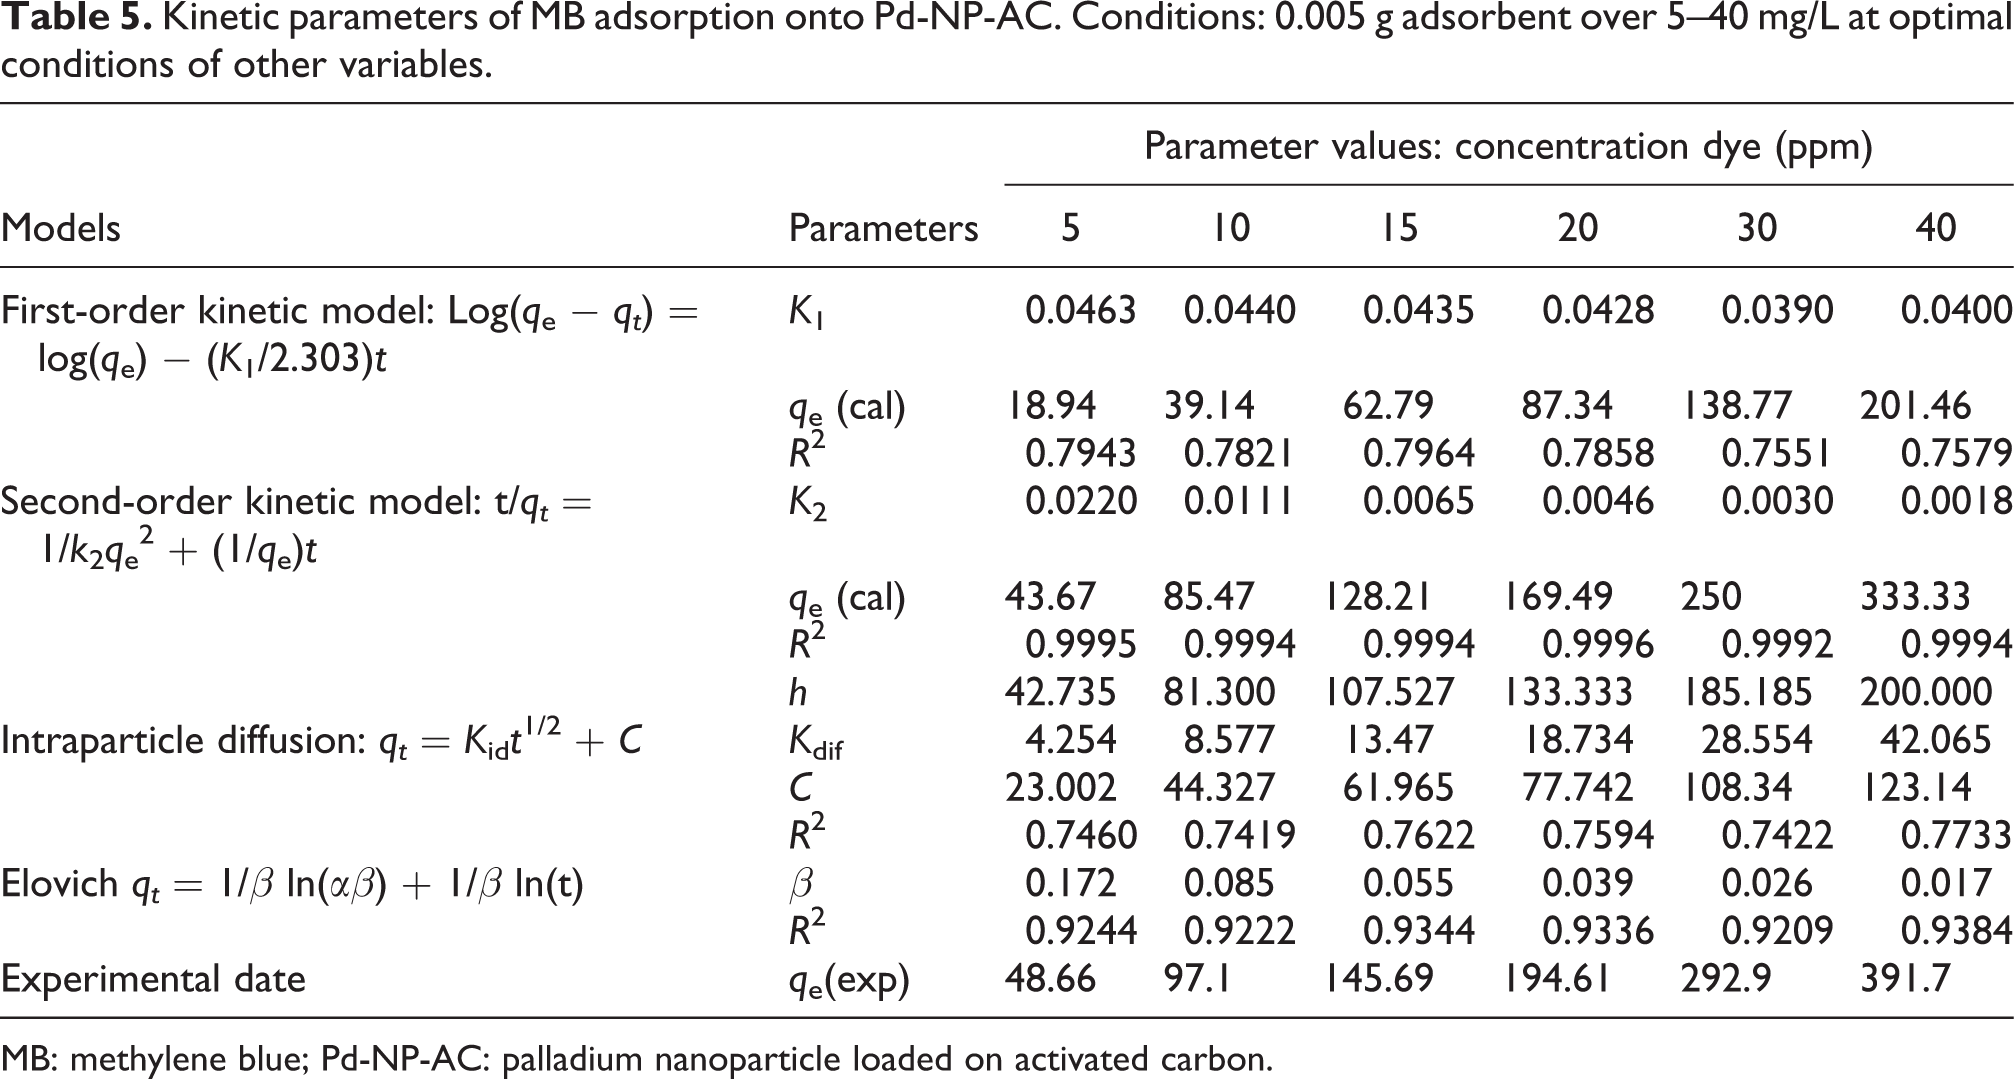
MB: methylene blue; Pd-NP-AC: palladium nanoparticle loaded on activated carbon.
Kinetic parameters of MB adsorption onto Pd-NP-AC. Conditions: 0.01 g adsorbent over 5–40 mg/L at optimal conditions of other variables.

MB: methylene blue; Pd-NP-AC: palladium nanoparticle loaded on activated carbon.
Kinetic parameters of MB adsorption onto Pd-NP-AC. Conditions: 0.015 g adsorbent over 5–40 mg/L at optimal conditions of other variables.

MB: methylene blue; Pd-NP-AC: palladium nanoparticle loaded on activated carbon.
Kinetic parameters of MB adsorption onto NiO-NP-AC. Conditions: 0.005 g adsorbent over 5–40 mg/L at optimal conditions of other variables.

MB: methylene blue; NiO-NP-AC: nickel oxide nanoparticle loaded on activated carbon.
Kinetic parameters of MB adsorption onto NiO-NP-AC. Conditions: 0.01 g adsorbent over 5–40 mg/L at optimal conditions of other variables.

MB: methylene blue; NiO-NP-AC: nickel oxide nanoparticle loaded on activated carbon.
Kinetic parameters of MB adsorption onto NiO-NP-AC. Conditions: 0.015 g adsorbent over 5–40 mg/L at optimal conditions of other variables.

MB: methylene blue; NiO-NP-AC: nickel oxide nanoparticle loaded on activated carbon.
Comparison of adsorbents for MB
Many MB removal processes using various adsorbents were reported in the literature 42 –47 and their performance for MB removal was compared in terms of low-cost adsorbents, adsorption capacity, initial concentration and contact time. It can be seen that MB removal by both NiO-NP-AC and Pd-NP-AC (Table 3, 4) is superior to previously reported literature (Table 11) in terms of higher adsorption capacity (588.2 mg/g for NiO-NP-AC and 555.6 mg/g for Pd-NP-AC), shorter required time (20 min) and using initial concentration (15 mg L−1).
Comparisons for the removal of dyes by different adsorbents.

AC: activated carbon; CAC: collagen–alginate composite; NiO-NP-AC: nickel oxide nanoparticle loaded on activated carbon; Pd-NP-AC: palladium nanoparticle loaded on activated carbon.
Conclusion
Pd-NP and NiO-NP are synthesized and characterized. The prepared nanoparticles were then loaded with AC and used for dye removal from aqueous medium. Both adsorbents were characterized with SEM, TEM, BET and XRD analyses. Effects of various operating parameters including pH, initial concentration of absorbent and adsorbate on the extent of dye adsorption were investigated and the results were analyzed. It was seen that Pd-NP-AC and NiO-NP-AC were effective adsorbents for the removal of MB from aqueous solution. The high MB removal using both adsorbents showed their applicability to remove the dye in short equilibrium time (less than 20 min). Adsorption kinetics was found to follow a second-order rate expression and equilibrium adsorption data for both adsorbents that were represented by the Langmuir isotherms. Higher inhibition field of NiO-NP (120–205 Oe) in comparison with respective value for bulk nickel may be attributed to a decrease in the size of produced nickel and formation of nanoparticle. The Pd-NP-AC was efficient for quantitative removal of MB (98% within 20 min). It was found that the dye removal efficiency of Pd-NP-AC was superior to that of NiO-NP-AC. The maximum adsorption capacity of Pd-NP-AC and NiO-NP-AC was found as 555.5 mg/g and 588.2 mg/g, respectively. This efficiency was much higher than so many adsorbents reported in recent literatures.
Footnotes
Funding
This research received no specific grant from any funding agency in the public, commercial, or not-for-profit sectors.