
Abstract
The present investigation deals with the antimetastatic role of luteolin (LUT) by inhibiting matrix metalloproteinase (MMP)-9 and -2 in azoxymethane (AOM)-induced colon carcinogenesis in Balb/C mice. Animals received AOM at a dosage of 15 mg/kg body weight intraperitoneally once a week for 3 weeks. AOM-induced mice was treated with LUT (1.2 mg of LUT/kg body weight/day orally). After the experimental period, the tumor markers such as γ-glutamyl transferase (GGT), 5′ nucleotidase (5′ND), cathepsin-D (Cat-D), and carcinoembroyonic antigen (CEA) were elevated upon induction with AOM. Subsequent treatment with LUT results in the reduction of the tumor markers was recorded. The expressions of MMP-9 and MMP-2 were analyzed by reverse transcription–polymerase chain reaction (RT-PCR) and immunofluorescence methods. The expressions of MMP-9 and MMP-2 were increased during AOM induction and upon treatment with LUT reduced the expressions. RT-PCR analysis of tissue inhibitor of matrix metalloproteinase (TIMP)-2 was limited during AOM-induced colorectal cancer (CRC). Supplementation of LUT increased the expression of TIMP-2. To conclude, LUT acts as an antimetastatic agent by suppressing MMP-9 and MMP-2 productions and upregulating TIMP-2 expression, thereby suggesting that LUT can be a chemotherapeutic agent against CRC.
Introduction
Flavonoids are ubiquitously occurring and widely consumed secondary metabolites of plants and have profound pharmacological properties. 1,2 They are reported to have antiviral, 3 antiparasitic 4 , and anticancer 5 activities. Luteolin (LUT; 3′,4′,5,7-tetrahydroxy flavone), an important member of the flavonoid family, is present in various fruits and vegetables and has contributed to the antioxidant activity of artichoke leaf extract on reactive oxygen species in human leucocytes. 6 LUT decreases the incidence of aberrant crypt foci, scavenges free radicals, 7 reduces the levels of glycoproteins, 8 reduces the tumor burden, and controls cell proliferation by regulating the Wnt/β-catenin pathway in vivo and in vitro 9,10 in azoxymethane (AOM)-induced colon carcinogenesis.
Cancers cells have the ability to grow and divide without regulation and they can be local or metastasize. A complex process is involved in the development of metastases: Invasion, intravasation of primary tumor cells, circulation extravasation, and seeding and proliferation at distant sites. 11,12 Angiogenesis, the formation of neovessels from the preexisting microvasculature, is vital and highly regulated during a variety of normal physiological conditions such as ovulation, embryonic development, and wound healing. 13 The role of angiogenic process is to bring vital nutrients and oxygen to all the cells of the body. Deregulation of the angiogenic process is associated with the pathogenesis of a number of diseases such as rheumatoid arthritis, diabetic retinopathy, and tumor growth and metastasis. 14 A cell is activated by a lack of oxygen released angiogenic molecules that attract inflammatory and endothelial cells and promote their proliferation. Tumor has acquired an angiogenic phenotype, many molecules that facilitate the angiogenic factors, 15 integrins, which mediate cell–matrix interactions, 16 and extracellular proteinase and matrix metalloproteinase (MMP) classes, which perform the matrix remodeling required for spout formation and vessel growth. 17 –19 The MMPs are a family of Zn2+ binding, Ca2+-dependent endopetidases that play crucial role in the degradation of extracellular matrix (ECM). 20 Currently, the MMP family consists of 20 members characterized in humans, rodents, and amphibians, 21 and they are synthesized as latent enzymes that can be stored in inflammatory cell granules. Latent MMPs are proteolytically activated in multiple steps resulting in the release of propeptide domains. 22 Increased expressions of MMP-9 and MMP-2 have been found in many cancers, suggesting that both MMPs involved in invasive properties. 23 –25 Zeng et al. 26 reported that increased MMP-9 expression is associated with advanced stage and distant metastasis in colorectal cancer (CRC). Thus, MMP-9 and MMP-2 have been targeted in the development of drugs against tumor invasion and metastasis.
Naturally derived compounds showed strong inhibitory activity against colon cancer. 27 –31 Hence in the present study, we investigated the antimetastatic properties of LUT through the modulation of MMP-9 and MMP-2 using AOM-induced colon cancer in mice.
Materials and methods
Chemicals
AOM, acrylamide, N,N′-bisacrylamide, and diaminobenzidine were purchased from Sigma Chemical Co. (St. Louis, Missouri, USA). LUT was purchased from Gentix Biotech Asia Pvt. Ltd (New Delhi, India). All other chemicals used were of analytical grade.
Animals
Male Balb/C mice weighing approximately 25–30 g were obtained from the Laboratory Animal Maintenance Unit, Tamilnadu Animal Science and Veterinary University (Madavaram, Tamilnadu, India). They were maintained at an ambient temperature of 25 ± 2°C and 12/12-h of light–dark cycle and were given a standard rat chow (Hindustan Lever Ltd, Bangalore, Karnataka, India) and water ad libitum. The experiments were conducted according to the ethical norms approved by Ministry of Social Justices and Empowerment, Government of India, and Institutional Animal Ethics Committee Guidelines (IAEC No. 01/021/08).
Experimental procedure
The animals were divided into four groups (n = 6 per group). Group 1 served as control and received intraperitoneal injections (ip) of physiological saline. After AOM administration, group 2 mice were administered with AOM (15 mg/kg body weight) ip once in a week for 3 weeks. Group 3 (AOM + LUT) were treated with a single dose of 1.2 mg/kg body weight of LUT 7 orally until the end of the experiment as mentioned in group 2. Group 4 received the same dose of LUT as mentioned in group 3.
The experiment was terminated at the end of 17th week and all the animals were killed by cervical dislocation after an overnight fast. The tumorous colon tissue was excised out, the tissues were weighed and homogenized in Tris-HCl buffer pH 7.4 and centrifuged at 3000 r/min for 10 min. The supernatant obtained was used for various assays. A portion of the colon tissue was fixed in 10% neutral-buffered formalin solution for histological studies.
Assay of tumor markers
5′-Nucleotidase was assayed by the method of Fine et al. 32 Enzyme activity is expressed as nanomoles of inorganic phosphorus liberated per minute per milligram protein in tissue. The phosphorus liberated in the supernatant was estimated by the method of Fiske and Subbarow. 33 γ-Glutamyl transpeptidase in the colon tissues was assayed according to the method described by Rosalki and Ran. 34 The enzyme activity in tissue expressed as micromoles of p-nitroanilide formed per minute per milligram protein. Cathepsin-D in the tissues was assayed according to the method described by Sapolsky et al. 35 The enzyme activity in tissue was expressed as nanomoles of tyrosine liberated per minute per milligram of protein.
Enzyme-linked immunosorbent assay of carcinoembroyonic antigen (CEA)
The serum sample from control and experimental groups were incubated with precoated CEA antibody. Quantification of CEA was adopted by the method prescribed by Biocare Diagnostics Ltd (Xiangzhou, Zhuhai, China). The value of CEA was expressed as nanogram per millilitre.
Immunofluorescence analysis
Paraffin-embedded colonic tissue sections of 4 µm were deparrafinized in xylene and then rehydrated in graded ethanol solutions. The slides were then blocked with 5% BSA in Tris-buffered saline (TBS) for 90 min. The sections were then immunostained with mouse monoclonal immunoglobulin G (IgG) to mouse MMP-9 or rabbit polyclonal IgG to mouse MMP-2 (Santa Cruz Biotech, Santa Cruz, California, USA), diluted 1:500 with 5% BSA in TBS, and incubated overnight at 4°C. After washing the sections thrice with TBS, the slides were then incubated with their corresponding secondary antibodies, fluorescein isothio cyanate (FITC labeled) (Bangalore Genei, Bangalore, Karnataka, India) or phycoerythrin (PE) (Invitrogen, Carlsbad, California, USA), diluted 1:50 with TBS, and incubated in dark for 120 min at room temperature. Sections were then washed with TBS and incubated with the nucleus-specific counterstain propidium iodide to stain the cell nuclei. Slides were cover-slipped and were visualized under a fluorescent microscope (Nikon TE 300, Tokyo, Japan). For quantification of MMP-9 and MMP-2, cell populations were examined (each field measuring 0.245 mm2) and the mean score per colon was calculated as described by the method of Ashokkumar and Sudhandiran. 9 PE- and FITC-positive cells were enumerated from six locations of colon tissue section per mice, with six mice per group and analyzed for statistical significance.
RT-PCR analysis
The total cellular ribonucleic acid was isolated from the colonic tissues using TRizol (Bangalore Genei, Bangalore, Karnataka, India) and first strand complementary DNA (cDNA) was synthesized using cDNA synthesis kit for RT-PCR (Bangalore Genei, Bangalore, Karnataka, India), performed according to the manufacturer’s instruction. The cDNA as amplified by PCR with 30 cycles at 94°C for 90 s, 54°C for 30 s, and 72°C for 30 s. Primers were designed using primer 3 software available online at http://fokker.wi.mit.edu/primer3/input.htm (Developer: Stewan Rozen, Whitehead Institute for Biomedical Research, Cambridge, MA 02142, USA), and nucleic acid sequence was accessed from http://www.ncbi.nlm.nih.gov/entrez. PCR amplification was performed using designed primes (Table 1) to amplify the PCR, and β-actin was used as a control. The PCR product was electrophoresed on agarose gel containing 0.2 µg/µL ethidium bromide and visualized under UV transilluminator.
Primer details.

MMP: matrix metalloproteinase; TIMP: tissue inhibitor of matrix metalloproteinase.
Statistical analysis
All the data were statistically evaluated with Statistical Package for the Social Sciences (SPSS)/10.0 software (SPSS, Chicago, Illinois, USA). Hypothesis testing methods included one-way analysis of variance followed by least significant difference test, p < 0.05 was considered to indicate statistical significance. All the results were expressed as mean ± SD.
Results
LUT suppresses the tumor markers
Figure 1(a) shows the levels of γ-glutamyl transferase (GGT) and 5′ nucleotidase (5′ND) in control and experimental group of animals. Induction with AOM showed a marked raise in the activities of GGT and 5′ND. GGT activity serves as a specific marker for the prognosis of carcinogenic events. GGT is a marker of neoplastic progression and occurs in a number of human neoplasms and their metastasis. 36 An increased level of GGT was observed in cancer cells. 37 Treatment with LUT decreased the activities of GGT and 5′ND in the experimental animals.

Luteolin suppresses the tumor markers. Each value is expressed as mean ± SD for six mice in each group. Statistical significance: p < 0.05, aas compared with group 1, bas compared with group 2. Units: Cat-D: nanomoles of tyrosine liberated per minute per milligram of protein; CEA: nanogram per millilitre of CEA, nanomoles of inorganic phosphorus liberated per minute per milligram protein in tissue. ns: nonsignificant; Cat-D: cathepsin-D; CEA: carcinoembroyonic antigen.
Figure 1(b) represents the levels of Cat-D and CEA in control group and experimental group. Administration of AOM to the animals showed elevated levels of both Cat-D and CEA. It is an indication of increased tumor burden in colon cancer–bearing animals. Detection and quantification of circulating cancer cells in whole blood samples could serve as a unique and easy diagnostic tool to determine prognosis and therapeutic effectiveness of cancer therapy. CEA is of special interest because it plays an active role in colon cancer progression and is used as a target molecule in a variety of clinical trials. Therefore, monitoring of the level of CEA expressing CRC cells is an attractive approach to determine therapeutic effectiveness. 38,39 In supplementation with LUT, we observed a significant fall in the levels of both Cat-D and CEA, which correlates with the reduced tumor burden. 9
LUT modulates the mast cell (MC) density
MC population in control and experimental animals is depicted in Figure 2. To elucidate the role of angiogenesis in carcinogenesis and progression of colon cancer, we investigated MC density on a paraffin-embedded pathological tissue. Toluidine blue histochemical method was employed for MC identification. 40 Giant MCs and significant increased populations were noticed in AOM-induced animals (group 2) when compared to control animals (group 1). LUT treated with AOM-induced animals (group 3) showed a significant decrease in giant and total MC population when compared to AOM-induced animals.

LUT modulates the mast cell density. (a) Control group, (b) AOM-induced group, (c) AOM-induced + LUT-treated group, and (d) mast cell density in control and experimental groups. Values are expressed as mean ± SD control versus LUT are statistically nonsignificant (ns); acontrol versus AOM and bAOM versus AOM + LUT are statistically significant at p < 0.05. AOM: azoxymethane; LUT: luteolin.
LUT decreased the expressions of MMP-9
Figure 3(a) shows the immunofluorescence expression of MMP-9 (FITC conjugated), counter stained with 4',6-diamidino-2-phenylindole (DAPI). The expression was comparatively higher in AOM-induced animals, whereas treatment with LUT caused a significant attenuation of MMP-9 expression. The expression of MMP-9 in LUT alone group well resembled the control. Quantification of the results was represented in Figure 3(b). Figure 3(c) represents the RT-PCR expression of MMP-9 in control and experimental group of animals. AOM-induced (lane 2) mice showed upregulation in MMP-9 (band at 242 bp). Administration of LUT (lane 3) leads to a downregulation of MMP-9 expression. Actin was used as internal control and quantified by ImageJ software (NIH, Bethesda, Maryland, USA) (Figure 3(d)).

LUT decreased the expressions of MMP-9. (a) Paraffinized colon tissue sections were immunostained with the anti-MMP-9 antibody and FITC-conjugated secondary antibody (green) (magnification ×20). Tissue sections were also counterstained with DAPI (blue) for nuclear staining. AOM-induced group showing increased green fluorescence around the epithelial region. AOM- + LUT-treated group shows diminished green fluorescence and LUT-treated group closely resembles as control. (b) Quantification of MMP-9: The result was quantified per 0.245 mm2 of MMP-9-positively stained cells. (c) The MMP-2 was visualized at 242 bp and β-actin was at 842 bp. AOM-induced (lane 2) group showed increased intensity of the bands. Meanwhile, LUT-treated group (lane 3) showed decreased intensity of bands compared with lane 2. (d) The ImageJ quantification of MMP-9 was normalized with β-actin. Hypothesis testing method included one-way ANOVA followed by LSD test. Values are expressed as mean ± SD. Comparisons: aControl versus AOM, bAOM versus AOM + LUT, p < 0.05. ns: nonsignificant; DAPI: 4′,6-diamidino-2-phenylindole; AOM: azoxymethane; LUT: luteolin; RT-PCR: reverse transcription–polymerase chain reaction; ANOVA: analysis of variance; LSD: least significant difference.
LUT decreased the expressions of MMP-2
Figure 4 represents the immunofluorescence expression of MMP-2 (PE conjugated), counter stained with DAPI. The expression was comparatively higher in AOM-induced animals, whereas treatment with LUT caused a significant attenuation in the MMP-2 expression. Control cells did exhibit a small number of positive expressions of MMP-2. Quantification of the results was represented in Figure 4(b). Figure 4(c) shows the RT-PCR expression of MMP-2 in control and experimental group of animals. Induction with AOM (lane 2) showed upregulation in MMP-2 (band at 203 bp). Subsequent administration of LUT (lane 3) leads to a downregulation of MMP-2 expression. Actin was used as internal control and quantified by ImageJ software (Figure 4(d)).

Luteolin decreased the expressions of MMP-2. (a) Colon tissue sections were immunostained with the primary anti-MMP-2 antibody and PE-conjugated secondary antibody (red). A tissue sections were also counterstained with DAPI (blue) for nuclear staining. AOM-induced group showing increased green fluorescence around the epithelial region, and AOM- + LUT-treated group shows diminished red fluorescence. LUT-alone-treated group closely resembles as control. (b) Quantification of MMP-2: The result was quantified per 0.245 mm2 of MMP-2-positively expressed cell. (c) RT-PCR of MMP-2 in control and experimental group of mice. MMP-2 expression was visualized at 203 bp and β-actin was at 842 bp. AOM-induced group (lane 2) showed increased intensity of the bands. Meanwhile, LUT-treated group (lane 3) showed decreased intensity of bands compared to lane 2. (d) The ImageJ quantification of MMP-2 was normalized with β-actin. Hypothesis testing method included one-way ANOVA followed by LSD test. Values are expressed as mean ± SD. Comparisons: aControl versus AOM, bAOM versus AOM + LUT, p < 0.05. ns: nonsignificant; MMP: matrix metalloproteinase; DAPI: 4′,6-diamidino-2-phenylindole; PE: phycoerythrin; AOM: azoxymethane; LUT: luteolin; RT-PCR: reverse transcription–polymerase chain reaction; ANOVA: analysis of variance; LSD: least significant difference.
LUT upregulates the expression of tissue inhibitor of matrix metalloproteinase (TIMP)-2
Figure 5(a) shows the RT-PCR expression of TIMP-2 in control and experimental animals. Lane 2 in Figure 4(a) shows downregulation of TIMP-2 (band at 250 bp). In lane 3, LUT treatment group shows upregulation of TIMP-2 when compared with AOM-induced (lane 2) group. Figure 5(b) shows the ImageJ software quantification of respective lanes was normalized with actin.
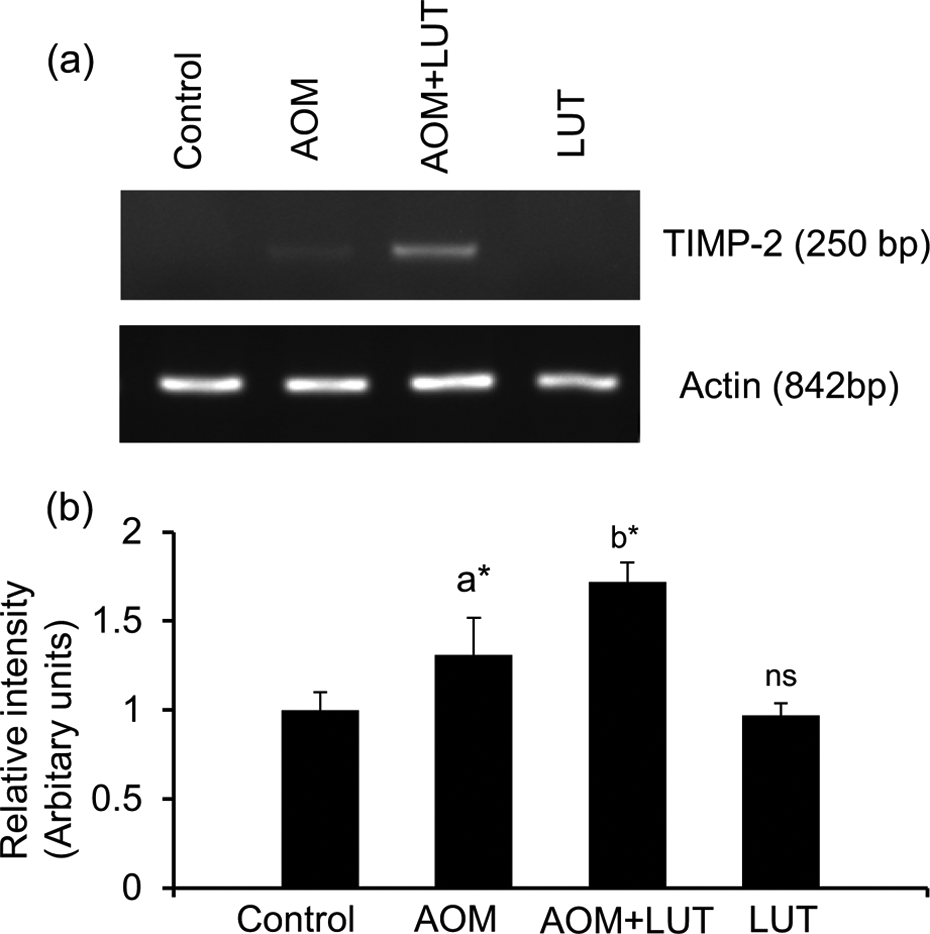
Luteolin upregulates the expression of TIMP-2. (a) RT-PCR of TIMP-2 in control and experimental groups of mice. The TIMP-2 was visualized at 250 bp and β-actin was at 842 bp. The increased intensity of band was observed in lane 3 (AOM − LUT) when compared to lane 2 (AOM-induced group). (b) The ImageJ quantification of TIMP-2 was normalized with β-actin. Hypothesis testing method included one-way ANOVA followed by LSD test. Values are expressed as mean ± SD. Comparisons: aControl versus AOM, bAOM versus AOM + LUT, p < 0.05. ns: nonsignificant; TIMP: tissue inhibitor of matrix metalloproteinase; AOM: azoxymethane; LUT: luteolin; ANOVA: analysis of variance; LSD: least significant difference; RT-PCR: reverse transcription–polymerase chain reaction.
Discussion
In the present study, we showed that LUT reduces the activities of tumor markers such as 5′ND, CEA, GGT, and cathepsin-D in AOM-induced colon cancer. LUT also showed antimetastatic role by downregulating MMP-9 and MMP-2 by upregulating TIMP-2.
Mast cells (MCs) have been implicated in promoting angiogenesis in some malignant tumors, especially in the aero digestive tract. The densities of MCs appeared to increase with disease progression. MCs may upregulate tumor angiogenesis in oral squamous cell carcinoma, perhaps via MC tryptase. 41 Earlier report on the increase of MC count in oral cancer correlates well with our study; where there was a significant increase in the MC population in oral cancer-induced animals. Polyphenol such as green tea has ability to inactivate MC in cancer-induced animals, 42 thereby significantly reducing MC density by blocking the release of histamine. 43 LUT inhibited MC activation in multiple sclerosis. 44 Kimata et al. 45,46 reported that LUT inhibited arachidonate metabolites and cytokine release as well as histamine release. The action of LUT is mediated through inhibiting protein kinase C and Ca2+ signalings in human cultured MCs. This phenomenon confirms that LUT potentially inhibits MC activation.
The MMP inhibitors offer a new approach to the treatment of cancer. A potential limitation of narrow spectrum MMP inhibitor’s clinical usefulness may be their complex interaction with a wide variety of substrates that have unknown effects in cancer. MMPs made an attractive target for small molecule inhibitors and a great deal of effort went into determining the structure and substrate specificities of these enzymes. 47 Naturally derived compounds are reliable to treat colon cancer. They are capable of altering multiple signaling pathways to reduce tumor burden. 48,49 Reports from the previous studies showed that compounds derived natural resources are strong MMP-9 and MMP-2 inhibitors. 50 –52
MMPs-degraded ECM is a process associated with cancer cell invasion, metastasis, and angiogenesis. 53 –55 In particular, MMP-2 and MMP-9 degrade components of the basement membrane and are responsible for the metastasis and invasion of malignant carcinoma. 54,56,57 In the present study, we proved that LUT suppresses the expressions of MMP-2 and MMP-9 in AOM-induced CRC. We also found that administration of LUT upregulates the mRNA expression of TIMP-2. The secreted MMP-2 activity was regulated by TIMP-2 and it serves as a specific inhibitor of MMP-2 but also inhibits pro-MMP-2, when it is in excess by blocking the membrane type 1-MMP activity. 55,58,59 In our present study, the activity of MMP-9 and MMP-2 was suppressed by the administration of LUT (Supplementary Figure S1), which correlates with enhanced TIMP-2 expression.
To conclude, LUT inhibits the metastatic tumor markers such as GGT, 5′ND, and CEA. It also markedly inhibits the MC density in the AOM-induced mice. MMPs are very crucial targets in cancer and inhibitors of MMPs are potential in controlling cancer. LUT inhibited the gene expressions and productions of both MMP-2 and MMP-9 while enhancing TIMP-2 gene expression. Thus, LUT may be a useful phytochemical against invasive CRC.
Footnotes
Conflict of interest
The authors declared no conflicts of interest.
Funding
This work was supported by a fund received from Council for Scientific and Industrial Research (CSIR), New Delhi, India.