
Abstract
Statins induce antiproliferative effects and apoptotic response in various cancer cell types. Moreover, they also sensitize tumor cell lines from different origins to many agents. We aimed to investigate possible effects of Mevastatin (Mev) alone and sequential treatment of 5′-aza-2-deoxycitidine (DAC) and Mev on HL-60 cell line using XTT (2,3-bis-(2-methoxy-4-nitro-5-sulfophenyl)-2H-tetrazolium-5-carboxanilide) assay, lactate dehydrogenase release assay, flourescence microscopy, DNA fragmentation analysis, determination of DNA synthesis rate, and active caspase-3 assay. Messenger RNA (mRNA) expression of apoptotic and antiapoptotic genes were also evaluated by semiquantitative reverse transcription-polymerase chain reaction (RT-PCR) for BAX, BCL2, and XIAP genes and quantitative Real-time PCR for CASP3, CASP8, and CASP9 genes. We showed that treatment with Mev alone and DAC followed by Mev resulted in apoptotic response in a time- and dose-dependent manner. We also found that pretreatment with DAC sensitized HL-60 cells to Mev and caused more apoptotic cell death than Mev-alone treatment via caspase-3 activation and DNA fragmentation. Moreover, sequential addition of Mev after DAC diminished DNA synthesis rate more effectively than Mev-alone treatment. Furthermore, DAC pretreatment significantly increased CASP3 and CASP9 mRNA expression even with lower doses of Mev. BAX, BCL2, and XIAP gene mRNA levels were also found to be changed in the presence of DAC and Mev. Determination of the exact molecular effects of statins and DAC would allow us to identify new molecular targets to develop more effective treatment regimens for cancer.
Keywords
Introduction
Statins are commonly used to treat patients with hypercholesterolemia. 1 They inhibit 3-hydroxy-3-methylglutaryl coenzyme A (HMG-CoA) reductase (HMGR) enzyme that catalyzes the rate-limiting step of the mevalonate pathway. In addition to cholesterol synthesis, they also affect production of many other compounds within mevalonic acid pathway, such as ubiquinone, dolichol, isopentenyladenine, farnesyl pyrophosphate, or geranylgeranyl pyrophosphate. 2 The last two compounds have roles prenylation of proteins (such as Ras, Rho, or nuclear lamins). Protein prenylation is one of the types of posttranslational protein modification, which ensures their correct localization and participation in signal transduction processes. 3 From these activities, it is not surprising that statins, beyond decreasing the lipid levels, may exhibit important cellular activities. 4
Statins exert pleiotropic effects and thus may be useful in the treatment of cancer. To date, there are several lines of preclinical and epidemiologic evidence to support the anticancer potential of statins. Several in vitro studies have demonstrated that statins induce antiproliferative and proapoptotic effects in various cancer cell types, including acute myelogenous leukemia (AML) and multiple myeloma. Statins also sensitize tumor cell lines from different origins to many chemotherapeutics such as doxorubicin, cisplatin, and 5-fluorouracil (5-FU), recently reviewed in more detail by Osmak. 5
DNA methylation has a crucial role for tumor suppressor gene inactivation and is frequently seen in hematological malignancies. 6 5′-Aza-2-deoxycitidine (DAC) can sensitize tumor cells to apoptosis or chemotherapeutics by providing reexpression of silenced proapoptotic genes. 7 Thus, CpG island methylation has a potential for therapeutic target. DNA methylation inhibitors, including DAC, have given promising results in hematological malignancies. 8 Combined or sequential treatment of DAC with other agents may lessen the cytotoxicity of the drugs. 9
The sequential administration of DAC with statins has not been tested. Thus, we devised this study to address the question of the effects of such sequential treatment in the human HL-60 AML cell line.
Methods
Cell culture
HL60 cells (HÜKÜK #96041201) were obtained from the Animal Cell Culture Collection in the Foot and Mouth Disease Institute, Turkey. Cells were cultured in RPMI-1640 medium supplemented with 10% fetal bovine serum, 200 mM
Cell viability XTT
Cell viability was assessed using XTT (2,3-bis-(2-methoxy-4-nitro-5-sulfophenyl)-2H-tetrazolium-5-carboxanilide) assay (Cell Proliferation Kit II (XTT), Roche, Germany). After seeding the cells into 96-well plates at a density of 1 × 10⁴ cell/well, they were incubated in 1 µM DAC-containing medium, refreshed daily for 48 h and then were subjected to Mev treatment (ranges between 1 and 40 µM) in new medium for additional 24, 48, and 72 h. For the DAC-alone group, treatment cells were incubated for 48 h in DAC-containing medium refreshed daily and then incubated for an additional 24, 48, and 72 h. For the Mev-alone group, the cells were incubated with different doses of Mev ranges from 1 to 40 µM for 24, 48, and 72 h. At the end of the treatment times, XTT-labeling mixture was added to each well and the absorbance of samples was measured with a microplate reader (ELx800, Bio-Tek, Instruments Inc., Winooski, VT, USA) at a wavelength of 490 nm. Control wells for absorbance readings contained cell-free medium and XTT labeling mixture. Five duplicate wells were used for each determination and all experiments were performed three times.
AO/EtBr staining
At the end of the incubation times, cells were stained with a mixture of acridine orange (AO) and ethidium bromide (EtBr) (Sigma-Aldrich) as described previously. 10 Then the cells were immediately analyzed under a fluorescence microscope (Olympus B202, Japan) at a 490-nm excitation wavelength.
Cytotoxicity assay
Cytotoxicity was determined by measuring released lactate dehydrogenase (LDH) into culture media using Cytotoxicity Detection Kit Plus (LDH; Roche Applied Science, Mannheim Germany). After treatment of cells for different times, 50 μl supernatant was removed from each well and transferred into 96-well flat bottom microtiter plate. Then 50 µl reaction mixture was prepared according to the manufacturer’s instructions and added to each well. To determine the percentage of cytotoxicity, the average absorbance values of the triplicates were calculated and the absorbance value obtained in the background control (media alone) was subtracted from each of these. The resulting values were substituted in the following equation

where “low control” indicates the LDH activity released from untreated normal cells. “High control” indicates the maximum amount of releasable LDH enzyme into culture medium obtained by lysing the cells with Triton X-100. The absorbance of the samples was measured at 490 nm using microplate reader.
DNA synthesis assay
The effects of the investigated agents on the kinetics of DNA synthesis were assessed using 5′-bromo-2′-deoxy-uridine (BrdU) labeling (Cell Proliferation ELISA, BrdU colorimetric, Roche Applied Science) according to the manufacturer’s instructions. HL-60 cells were seeded into 96-well microtiter plates (1 × 10⁴ cell/well) and incubated with different concentrations of the drugs for various time. BrdU was added to the cells at the end of treatment times and incubated for an additional 2 h. Absorption was measured at 450 nm in microplate reader.
DNA fragmentation with ELISA
To quantitate DNA fragmentation as a marker for apoptosis, The Cell Death Detection ELISA Plus kit (Roche Applied Science) was used according to the manufacturer’s instructions. The enrichment of mono- and oligonucleosomes released into cytoplasm (enrichment factor, EF) was calculated as absorbance of treated cells/absorbance of control cells. Calculated EFs were used as a parameter of apoptosis.
DNA fragmentation with agarose gel electrophoresis
After drugs treatments, cells were fixed in 70% ethanol and stored at −20°C. DNA was extracted using a phosphate–citric acid buffer for about 1 h at 37°C. After lysates were centrifugated at 1600 r/min for 5 min, NP-40 (Sigma-Aldrich) and RNase A (Sigma-Aldrich) were added to the supernatant and incubated for an additional 30 min at 37°C. The proteinase K (Sigma-Aldrich) solution was added and mixture was again incubated for 30 min at 37°C. Equal volumes of the samples were loaded on to 1% agarose gel and electrophoresed in parallel with 100 bp DNA molecular weight marker at 100 V for 90 min.
Determination of cleaved caspase-3 levels using sandwich ELISA method
Cleaved caspase-3 protein levels were detected using the PathScan® Cleaved Caspase-3 (Asp175) Sandwich Elisa Kit (Cell Signaling Technology Inc., Beverly, MA, USA). Briefly, 100 µg of cell lysate from HL-60 cells treated with or without agents were transferred to microplates coated with total caspase-3 antibody. Then, biotinylated cleaved caspase-3 antibody was added to the wells followed by horseradish peroxidase (HRP)-linked streptavidin and HRP substrate. The optical density was read at 450 nm using a microplate reader. Data from triplicate experiments were expressed as fold change relative to control (untreated) cells.
RNA isolation, cDNA synthesis, and RT-PCR
Total RNA was isolated using High Pure RNA Isolation Kit (Roche Diagnostics, Mannheim, Germany) according to manufacturer’s protocol. Total RNA of 1 μg from each sample was reverse transcribed with random hexamers using Transcriptor First Strand cDNA Synthesis Kit (Roche Diagnostics) according to the manufacturer’s instructions. Real-time polymerase chain reaction was carried out using a Light Cycler 1.5 system (Roche Diagnostics). LightCycler® TaqMan® Master reaction mix in combination with the human Universal Probe Library (UPL) probes was used to assess gene expression (Roche Diagnostics). Intron-spanning primers and specific probes were selected using the online UPL Assay Design Center (http://www.roche-applied-science.com/sis/rtpcr/upl/index.jsp). Primers and probes used in the quantitative RT-PCR for the detection of CASP3, CASP8, CASP9, and GAPDH messenger RNAs (mRNAs) were given in Supplement tables.
Semiquantitative RT-PCR
Primers and annealing temperatures, used for semiquantitative analysis of BAX, BCL2, XIAP, and GAPDH mRNAs, were given in Supplement table. PCR products were electrophoresed on 2% agarose gels, stained with EtBr, and visualized under ultraviolet (UV) illumination.
Methylation analysis of CASP3 and CASP8 genes
Genomic DNA from cells was isolated with High Pure PCR Template Preparation Kit (Roche Diagnostics) according to manifacturer’s protocol. Genomic DNA sample of 1 µg was subject to sodium bisulphite conversion using the EZ DNA Methylation-Gold™ kit (Zymo Research, USA) by following the manufacturer’s instructions. Methylation-specific PCR (MS-PCR) for the CASP3 and CASP8 genes was performed on bisulfite-modified DNA using previously described primer pairs. 11,12 Human genomic lymphocyte DNA treated with or without the CpG methyltransferase (M.SssI) enzyme (New England Biolabs, Frankfurt am Main, Germany), was used as a methylated and unmethylated control, respectively. PCR products were electrophoresed on 2% agarose gels, stained with EtBr, and visualized under UV illumination.
Statistical analysis
Dose- and time-dependent changes of CASP3, CASP8, and CASP9 mRNA expression levels were compared by relative expression software tool (REST 2009 v2.013). 13 Other parameters were analyzed by one-way analysis of variance test using SPSS 15.0 software. Data were expressed as the mean ± SD from a representative experiment. p values <0.05 were considered as significant.
Results
DAC sensitize HL-60 cells to Mev
HL-60 cells were treated with various concentrations of Mev to reveal the dose-dependent response of the cells. Moreover, in order to estimate the effect of exposure time on drug action, HL-60 cells were treated with Mev for variable times between 24 and 72 h. As shown in Figure 1(a), Mev caused a dose- and time-dependent decrease in cell viability as measured by XTT assay. Half maximal inhibitory concentration (IC50) values of Mev were found to be over 40 µM for 24 h, 40 µM for 48 h, and 10 µM for 72 h.

Cell viability ratios of HL60 cells treated with (a) Mev and (b) DAC + Mev at 24, 48, and 72 h. Mev: Mevastatin.
To achieve sensitization of the cells by demethylation, DAC were added to the medium at 1 µM concentration for 48 h, and due to chemical instability, DAC was added to culture medium every 24 h. Then, we gave Mev to the cells with various concentration and analyzed cell viability at different time points. Sequential addition of Mev after 1 µM DAC (DAC + Mev), markedly reduced the IC50 concentrations of Mev-alone treatment. IC50 values of DAC + Mev treatment were found to be approximately 9 µM for 24 h, 8 µM for 48 h, and 4 µM for 72 h (Figure 1(b)).
AO/EtBr staining showed that decrease in cell viability found in XTT assay resulted from apoptotic response of the cells (Figure 2(a) and (b)). At higher than 10 µM Mev concentrations, there were an increase in necrosis rate (data not shown). However, lower concentrations of Mev alone produced more apoptotic cell death than necrosis. Apoptotic effects of Mev-alone treatment were also found to be time-dependent. Sequential addition of DAC followed by Mev caused more apoptotic cell death than Mev alone (Figure 2(c)). In sequential treatment, there is an increased rate of necrosis at higher Mev concentrations similar to Mev-alone administration.

Representative images of viable (1), apoptotic (2), and necrotic (3) cells stained with AO/EtBr analyzed using a fluorescence microscope at ×400 magnification. (a) Control cells; (b) cells treated with 8 μM Mev. (c) Apoptotic ratios of cells treated with agents at 24, 48, and, 72 h. *p < 0.05. Mev: Mevastatin; AO: acridine orange; EtBr: ethidium bromide.
LDH release
Cytotoxic effect of Mev on HL-60 cells was evaluated using LDH release assay. Mev caused a dose and time dependent increase in cytotoxicity. The highest cytotoxicity rate was obtained at 8 µM Mev concentration for all three incubation times (Figure 3). At this Mev dose, cytotoxicity rates were as follows: 19.1% for 24 h, 30.0% for 48 h, and 44.4% for 72 h. As shown in Figure 3, DAC pretreatment before Mev also increased cytotoxic effect of Mev-alone treatment.

Cytotoxic effects of agents on HL60 cells determined by LDH release into culture medium at 24, 48, and 72 h. *p < 0.05. LDH: lactate dehydrogenase.
Effect of Mev alone and DAC + Mev treatment on DNA synthesis
Inhibition of DNA synthesis after treatment with agents was also analyzed to estimate the antineoplastic action of the drugs and following a fixed interval of drug exposure, BrdU was added to the cells to determine the rate of DNA synthesis. Mev-alone treatment inhibited DNA synthesis in a dose- and time-dependent manner. The 10-µM Mev treatment for 24 h, 48 h and 72 h incubation period significantly reduced DNA synthesis rate to 80.28%, 72.65%, and 57.65%, respectively. However, Mev given after DAC reduced DNA synthesis significantly more than Mev-alone treatment. For example, DAC + 10 µM Mev treatment for 24, 48, and 72 h overwhelmingly reduced DNA synthesis rate to 66.24%, 45.94%, and 36.63%, respectively. These results showed that sequential addition of Mev after DAC diminished DNA synthesis rate more effectively than Mev-alone treatment (Figure 4).

Effect of agents on DNA synthesis rate of HL60 cells analyzed by BrdU incorporation-ELISA. *p < 0.05. BrdU: 5′-bromo-2′-deoxy-uridine; ELISA: enzyme-linked immunosorbent assay.
DNA fragmentation
DNA fragmentation rate was found to be increased in a dose- and time-dependent manner after both Mev-alone and DAC + Mev treatment (Figure 5). The highest fragmentation rate for each doses of Mev was determined at 72 h incubation period (p < 0.05). This result correlated high apoptosis rates found at 72 h Mev treatment using AO/EtBr staining (Figure 2).

Mono- and oligonucleosomal DNA fragmentation seen in cells treated with agents at indicated doses. *p < 0.05.
However, Mev administered after DAC increased DNA fragmentation significantly more than Mev-alone treatment. DAC plus 4 µM Mev administration for 48 h caused sevenfold increased fragmentation as compared to the control cells (Figure 5). At this Mev concentration and incubation time, Mev-alone treatment resulted in about twofold increase in fragmentation. However, we did not show any increase in DNA fragmentation at 8 µM Mev given after DAC due to elevated necrosis rate shown by both LDH assay and AO/EtBr assay.
Our DNA fragmentation results obtained from enzyme-linked immunosorbent assay (ELISA) test was also confirmed using manually on agarose gels. On agarose gels, dose- and time-dependent increase in DNA fragmentation was observed for Mev alone and DAC given before Mev treatments (Supplement Figure 1).
Mev alone and Mev given after DAC induced CASP3 clevage
In order to evaluate apoptosis at molecular level, we performed ELISA to determine cleaved caspase-3 protein levels. Cleaved caspase-3 protein levels elevated after Mev alone and DAC + Mev treatment in a dose- and time-dependent manner. A 72-h incubation with Mev alone formed more cleaved caspase-3 protein as compared to 24 h and 48 h incubation (Figure 6). Statistically significant increase was obtained at 4 and 8 µM Mev concentrations for all time points (p < 0.05). However, Mev treatment at 2 µM caused significant increase in active caspase-3 amounts only after 48 and 72 h incubation (p < 0.05). Sequential addition of DAC with Mev also caused significant increase at all Mev doses and incubation periods (p < 0.05) (Figure 6).

Effetcs of the agents on active caspase-3 protein levels determined by ELISA assay. *p < 0.05. ELISA: enzyme-linked immunosorbent assay.
Effect of Mev and DAC + Mev treatment on CASP3, CASP8, and CASP9 mRNA expression
We performed quantitative RT-PCR analysis so as to know whether Mev alone and DAC + Mev treatments had any effects on CASP3, CASP8, and CASP9 transcript levels. We showed that statistically significant increase for CASP3 and CASP9 mRNA levels was found after 8 µM Mev treatment for 24 h, 48 h and 72 h. mRNA expression of these genes were also significantly elevated for 4 µM at 48 h and 72 h. No statistically significant changes were observed for CASP9 mRNA expression in all Mev concentration at analyzed three time points.
DAC pretreatment significantly increased CASP3 and CASP9 mRNA expressions even in lower doses of Mev. There were no significant changes for CASP3 and CASP9 mRNA expressions for 2 and 4 µM doses of Mev-alone treatment at 24 h. But, after DAC pretreatment, CASP3 and CASP9 mRNA expressions significantly increased at these Mev doses. As compared to Mev-alone treatment, similar increased expression patterns for CASP3 and CASP9 mRNAs were obtained for 48 and 72 h incubation period after DAC + Mev treatment. No significant changes were found for CASP8 mRNA expression (Figure 7).
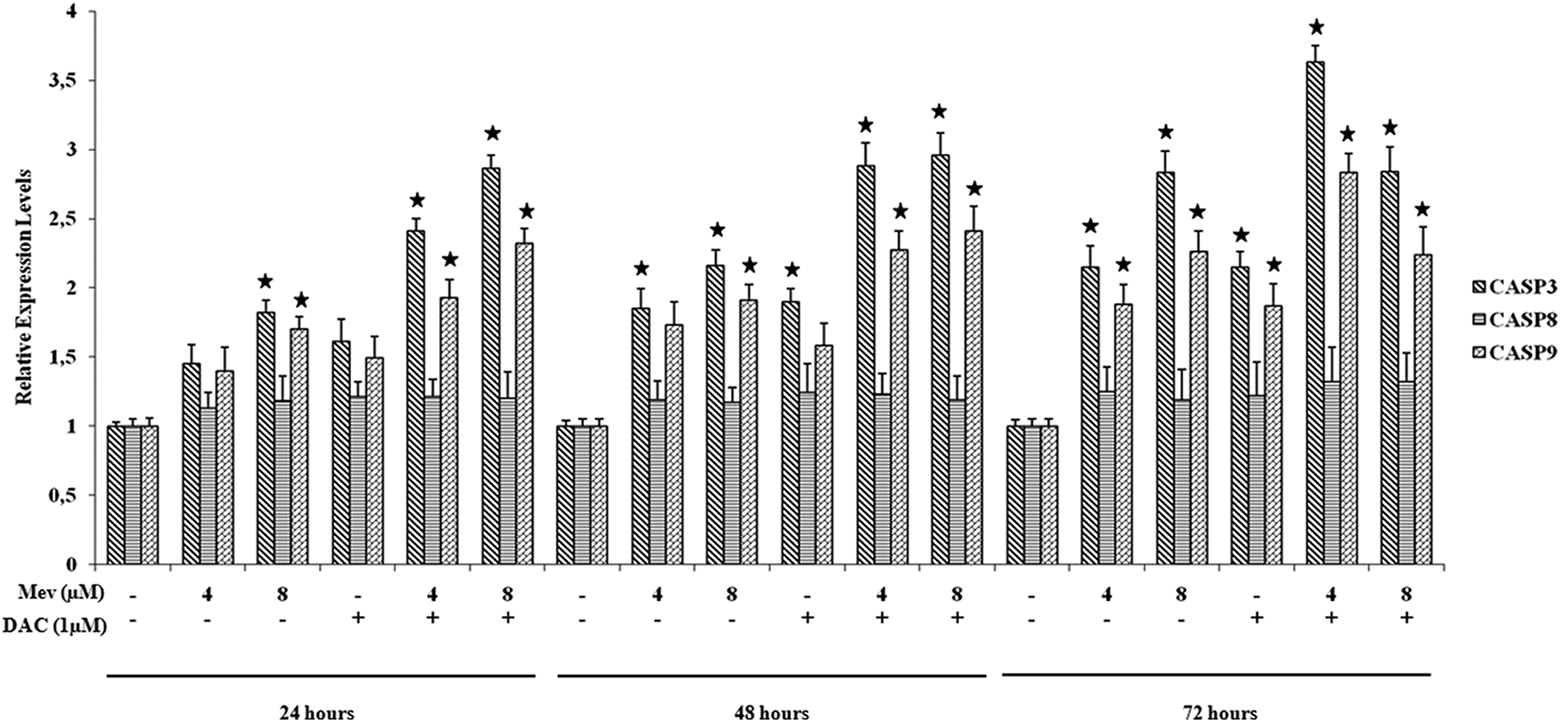
Quantitative real-time PCR results showing CASP3, CASP8, and CASP9 mRNA expression levels of the cells treated with agents at different time points. *p < 0.05. mRNA: messenger RNA; PCR: polymerase chain reaction.
BAX, BCL2, and XIAP mRNA expression
We also evaluated the effects of agents on the mRNA expression of apoptotic BAX and antiapoptotic BCL2 and XIAP genes using semiquantitative RT-PCR. There were an increase in BAX mRNA expression and decreased BCL2 and XIAP mRNA expression in parallel with elevated Mev concentrations in both Mev alone and DAC + Mev treatment. While at lower Mev doses, BCL2 and XIAP mRNA expressions were clearly detected, there were decreases in BCL2 and XIAP expressions after 10 µM Mev treatment for 24 h incubation. Moreover, at this same incubation time, BCL2 mRNA expression was lost even at DAC + 1 µM Mev treatment. XIAP and BAX expressions were also changed markedly as depicted from agarose gels in response to administration of agents (Supplement Figure 2).
CASP3 and CASP8 methylation status
RT-PCR analysis showed CASP3 mRNA elevation and no change for CASP8 mRNA expressions. This unchanged CASP8 mRNA expression may be resulted from epigenetic inactivation of this gene in HL-60 cells. To reveal this situation, we performed Methylation-specific PCR (MS-PCR) analysis for both CASP3 and CASP8 genes. However, we did not show any CpG methylation in both genes (data not shown).
Discussion
Mevalonate pathway is an important biochemical pathway involved in cell growth and proliferation. 14 It was shown that elevated activity of LDL metabolism and cholesterol synthesis in AML cells were caused by increased expression of HMGR mRNA and LDL receptors. 15,16 These observations were also verified by higher expression rates of genes having roles in cholesterol metabolism. 17 Moreover, cholesterol level in AML cells was shown to increase rapidly after exposure to chemotherapeutics, and this elevation causes resistance to chemotherapy. 18,19 For these reasons, elimination of such a resistance mechanism seen in AML cells may bring in some kind of notion for standard antileukemia therapy. Thus, statins can be an option to suppress increased cholesterol metabolism in AML cells and reduce resistance to chemotherapy.
Statins have been clinically evaluated for the treatment of leukemia and solid tumors. 5 Several studies showed apoptotic effects of different statins on AML cells. In one of these studies, Stirewalt et al. 20 investigated effects of Mev on 32 primary AML samples and 3 different AML cell lines (HL-60, NB4, and KG1a). They found that these cell lines had various sensitivities to Mev. In another study, apoptotic response of HL-60 cells to Mev were determined as time dependent, and higher number of cells death were observed after exposure to Mev at 72 h. 21 In agreement with these findings, we found that Mev decreased cell viability in a time- and dose-dependent manner.
DAC treatment of different cancer cell lines have resulted in sensitization of cells to some agents and classical chemotherapy drugs. 22,23 Our results were also in conformity with these reports. In our study, DAC pretreatment of HL-60 cells before Mev (DAC + Mev) decreased IC50 values of Mev-alone treatment that varied between 4 and 10 μM at analyzed time points as compared to Mev-alone treatment. Hence, we concluded that Mev given after DAC was more effective in cell death due to sensitization of cells by DAC pretreatment.
Chemotherapy regimens containing single agent have less potential to kill cancer cells. So, multiagent chemotherapy regimens are selected to treat cancer more effectively. 24 In this respect, different statins including Mev were found to increase the effects of agents in several cancer cell lines (reviewed by Osmak 5 ). Moreover, the coadministration of Pravastatin with 5-FU increased the median survival of patients with advanced hepatocellular carcinoma up to twofold compared with the 5-FU-alone treatment group. 25 So, it was suggested that statins can be more effective when they were combined with classical chemotherapeutics. 24 We also showed that the sequential treatment of Mev with DAC had elevated apoptotic effects on HL-60 cells, as compared to Mev- and DAC-alone administration.
Fluorescence staining of cells showed that HL-60 cells had a tendency to undergo necrosis in high Mev concentration but they showed apoptotic cell death in low Mev concentrations. These findings were also confirmed by LDH release into the medium. At low concentrations, the amount of LDH enzyme released into the medium was observed less than high concentrations. We also analyzed the effects of Mev and DAC on DNA synthesis using BrdU-ELISA method. We found in cells, treated with Mev and DAC + Mev, significant dose- and time-dependent decrease in DNA synthesis rate, which may suggest accumulation of HL-60 cells in G1 phase.
It was reported that HL-60 cells treated with Lovastatin exerted DNA fragmentation. 26 Using quantitative ELISA or qualitative gel electrophoresis, we found that both Mev and DAC induced DNA fragmentation in HL-60 cells. Moreover, we figured out that sequential administration of DAC and Mev caused more DNA fragmentation than Mev- and DAC-alone treatments.
Statins differentially exert their apoptotic effects according to cell types. For example, Marcelli et al. 27 showed that Lovastatin-treated prostate cancer cells (LNCaP) undergone apoptosis without CASP3 activation. On the other hand, Lovastatin-treated HL-60 cells suffered apoptotic cell death by the virtue of mitochondrial cytochrome c release and CASP3 activation. 26 In our study, Mev and DAC alone or sequentially treated HL-60 cells were found to have more active CASP3 enzymes than untreated control cells.
Statin-treated prostate cancer cells (LNCaP) showed marked increase in CASP7 mRNA expression but statin treatment did not change the expression of CASP1, CASP3, CASP6, and CASP9 mRNAs. 27 In HL-60 cells, we showed that CASP3 and CASP9 mRNA expression levels were increased in a statistically significant manner after treatment with Mev or DAC + Mev, but not CASP8 transcript levels. Although statins generally induce apoptosis in different cancer cells, apoptotic responses given by cells are different according to the cell origin. So, determination of apoptotic pathways after incubation with statins could help us to design new therapeutic approaches.
Overexpression of BCL2 in cancer cells causes resistance to chemotherapy, 28,29 whereas overexpression of BAX has been shown to sensitize cancer cells to chemotherapy agents. 30 One of the antiapoptotic proteins, known as XIAP, inhibits apoptosis by suppression of caspases including CASP3 and CASP9. 31 With respect to the leukemia, XIAP expression has been also associated with median survival rates in AML patients. 32 In our study, semiquantitative analysis of BAX, BCL2, and XIAP genes expression demonstrated that DAC + Mev treatment caused a decrease in antiapoptotic BCL2 and XIAP expression as compared to cells treated with agents alone whereas proapoptotic BAX expression level was also found to be increased. These results are also in agreement with studies investigating apoptotic responses in Lovastatin-treated AML and colon cancer cells. 33,34
Epigenetic therapy of leukemias gained interest because of high rate of the CpG islands methylation in patients with AML and ALL. 6 Thus, another aim of our study was reexpression of epigenetically silenced genes by DAC treatment, and as a result, sensitization of HL-60 cells to Mev. Clearly, we found that the number of apoptotic cells increased after DAC + Mev treatment. To uncover possible epigenetic effects of DAC, we were able to analyze methylation status of the CASP8 and CASP9 genes using MS-PCR. However, no significant changes in methylation pattern of the both genes were found. Thus, the increase in CASP9 mRNA expression was first attributed to cellular apoptotic response but not demethylating effects of DAC. Second, DAC sensitization of HL-60 cells to Mev can also result from demethylation of the other genes. Third, DAC can directly activate genes without the dependency of DNA methylation because it was shown that DAC can activate transcription of some genes by suppressing histone methylation. 35 Another reason, increased expression of CASP9 mRNA may be linked indirectly to the activation of another gene located on the upstream of the CASP9 gene. Finally, MS-PCR technique gives information about limited number of CpG islands located on the target genes. Thus, large number of CpG islands can be analyzed using other approaches to reveal methylation status of the genes.
In summary, our results showed that both DAC and Mev exerted in vitro antileukemic effect by suppression of growth and induction of apoptosis in HL-60 cells. Sequential administration of DAC and Mev showed synergistic effect and resulted in more apoptotic cell death than either agent alone. Determination of the exact molecular effects of statins and DAC would allow us to identify new molecular targets for the treatment of the leukemia and develop more effective therapeutic approaches.