
Abstract
The presence of benzene in motor gasoline has been a health concern for potential increased risk of acute myelogenous leukemia and perhaps other lymphatic/hematopoietic cancers for approximately 40 years. Because of the widespread and increasing use of gasoline by consumers and the high exposure potential of occupational cohorts, a thorough understanding of this issue is important. The current study utilizes an evidence-based approach to examine whether or not the available epidemiologic studies demonstrate a strong and consistent association between occupational exposure to gasoline and lymphatic/hematopoietic cancers. Among 67 epidemiologic studies initially identified, 54 were ranked according to specific criteria relating to the relevance and robustness of each study for answering the research question. The 30 highest-ranked studies were sorted into three tiers of evidence and were analyzed for strength, specificity, consistency, temporality, dose-response trends and coherence. Meta statistics were also calculated for each general and specific lymphatic/hematopoietic cancer category with adequate data. The evidence-based analysis did not confirm any strong and consistent association between occupational exposure to gasoline and lymphatic/hematopoietic cancers based on the epidemiologic studies available to date. These epidemiologic findings, combined with the evidence showing relatively low occupational benzene vapor exposures associated with gasoline formulations during the last three decades, suggest that current motor gasoline formulations are not associated with increased lymphatic/hematopoietic cancer risks related to benzene.
Introduction
The widespread use of motor gasoline over the past several decades has led to ubiquitous airborne exposures to gasoline vapor components in the workplace and in background air. 1 Benzene, a known cause of acute myelogenous leukemia (AML) in humans, has been a consistent component of gasoline vapors historically, although changes in refining processes and formulations in recent years have reduced gasoline’s benzene content. Benzene exposures continue to be the primary focus of public health protection measures for gasoline. 2 –5 Airborne concentrations of benzene, in recent years, can range from about 0.1–2.0 ppb in rural areas to 6.0–20 ppb in major US cities. 6
Although many studies have now confirmed the strong, specific, consistent and coherent association between high benzene exposure and AML in humans, there have been weak suggestions about associations between benzene exposure and other lymphatic/hematopoietic cancers in epidemiologic studies. 7 In particular, associations with non-Hodgkin lymphoma (NHL), multiple myeloma (MM) and forms of leukemia other than AML have been reported, but the shortcomings in the studies have been significant. 7,8 Recently, Kane and Newton 9 published a review and meta-analysis of occupational exposure to gasoline and the risk of NHL and reported no increased risk. The two most important differences between our study and Kane and Newton’s study are: (1) the inclusion of over 10 different lymphatic/hematopoietic cancers; and (2) the use of a systematic, evidence-based approach as described generally by Guzelian et al. 10 An evidence-based approach provides the ability to answer a well-framed analytical question that takes into account exposure and toxicology.
The purpose of this study is to evaluate the published epidemiologic findings concerning occupational exposures to gasoline and any possible associated risk of lymphatic/hematopoietic cancers using a systematic, evidence-based approach. This evidence-based approach involves framing an appropriate research question, identifying all potentially relevant literature, sorting and ranking the studies according to quality and relevance using objective criteria and analyzing the study findings in evidence tiers according to study rank. The final conclusions are drawn based on rigorous evaluation of the findings with respect to strength, specificity, consistency, temporality, dose-response trends and coherence. To our knowledge, this is the first time this approach has been applied to address the question of gasoline carcinogenicity.
Composition of motor gasoline and its vapors
Motor gasoline (CAS 86290-81-5) is a complex, volatile mixture of over 500 saturated and unsaturated hydrocarbons produced by the fractional distillation of crude oil that may vary in presence and proportion depending on the crude oil source and the refining process. Of these hydrocarbons, approximately 150 are regularly detectable. 11 Gasoline displays both temporal and geographic variability in its composition. Gasoline components also vary depending on additives that may be included to meet certain performance or regulatory specifications. Modern gasoline contains, on average, approximately 33% aromatic compounds, 57.5% paraffins (alkanes) and 9.3% olefins (unsaturated hydrocarbons) and often small amounts of alcohols, ethers, detergents, corrosion inhibitors, antioxidants and other oxygenates. 1,12 A thorough explanation of the production and composition of motor gasoline can be found in the Petroleum High Production Volume Testing Group’s submission to the USEPA concerning gasoline blending streams under the Petroleum High Production Volume (HPV) assessment program. 12
Between 1972 and 1991, the average benzene concentration in American gasoline ranged from 0.8% to 3.18%. Historical benzene concentrations in gasoline from the European community and other countries have often been greater than 2%. 1,13,14 For example, a 2002-study reported that the mean benzene content of gasoline distributed in Europe over the last three decades ranged from 1.0% to 4.0%, with values reported as high as 8.6%. 1 The United States Reformulated Gasoline (RFG) program affects approximately one third of all gasoline sold in the United States and stipulates that no batch of RFG can have a benzene concentration of greater than 1% by volume. 2 New USEPA regulations in effect since January 1, 2011 further reduce the allowable benzene concentration to 0.62% by volume on all gasoline (reformulated and conventional) nationwide. 15
Although liquid gasoline is predominantly comprised of volatile organic compounds, the relative proportions of hydrocarbon components in gasoline vapors (the airborne exposure component), not surprisingly, differ from those present in the liquid. Table 1 shows average gasoline vapor concentrations and variance reported for gasoline sold in the United States or Europe during the 1970s and 1980s. These measurements indicate that the vast majority of gasoline vapors by volume (>85% v/v) are comprised of alkane or alkene compounds with three to six carbons, while the aromatic content is relatively low (e.g. <3% v/v). With increasing use of oxygenates (e.g. ethanol and methyl tert-butyl ether or MTBE), the aromatic content of gasoline vapor becomes slightly diluted, and lowers the relative benzene concentrations in the liquid and vapor forms.
Gasoline vapor compositions (vol%) for United States and European gasoline in the 1970s and 1980s.a

MTBE: methyl tert-butyl ether.
a“–” represents Values not present (for MTBE in US gasoline samples) or not specifically quantified (for European gasolines). Values for nonaromatic, non-iso components represent the sum of other major components for the same carbon number.
bValues for 95 samples of Shell gasoline from the 1970s as reported by Halder et al. 16
cValues reported for 10 samples of European gasoline from 1984 to 1985 by CONCAWE. 17
Occupational exposure to gasoline vapors
The concentration of airborne gasoline vapors in the workplace depends largely on the frequency and duration of uncontrolled transfer events that result in gasoline vapor release into the worker’s breathing zone. 18 Because of the well-recognized volatility and flammability of gasoline vapors, the vast majority of workplace exposures (primarily at refineries) are inherently limited by engineering controls and procedures in place to limit explosion and fire risks. Much of the process for refining gasoline, for example, occurs in virtually closed systems within the refinery that incorporate vapor recovery and/or other controls (e.g. ventilation stacks and flares) that avoid vapor accumulation at explosive concentrations. Such control systems and procedures have been shown to limit most refinery worker benzene exposures to relatively low levels (e.g. <1 mg/m3), except for those involved in certain sampling, transfer/storage and maintenance procedures that may involve relatively brief but unavoidable exposures to gasoline vapors. 18 –22
Many studies have examined the various job types and tasks that involve higher exposures to gasoline vapors in the workplace. 16,17,23 –33 A summary of temporal trends in gasoline vapor and benzene exposures for selected job groups with higher full-shift measurements at European petroleum production and distribution facilities is provided in Table 2.—17,32,33 Each of the studied job types involves daily exposures to higher concentrations of gasoline vapors during loading or other transfer procedures, and two trends are readily apparent. First, for most of these job types, a decreasing temporal trend exists that generally reduced the mean occupational exposure to gasoline and/or benzene vapors after about 1985, in some instances by >5- to 10-fold without the use of vapor recovery systems. Second, separate measurements collected during the use of vapor recovery systems indicate reduced work shift exposures by about two- to fivefold. These data also suggest that since the 1980s, the average full-shift airborne benzene concentrations for these high-end gasoline exposure jobs have been below 2.2 mg/m3, in compliance with the current occupational exposure limit of 3 mg/m3. 34
Full-shift gasoline and benzene vapor exposure measurements (mg/m3) with and without vapor recovery for selected European petroleum production or distribution job groups and time intervals reported by CONCAWE.a

a“–” represent values not reported, or the authors identified quality control issues that likely biased these samples high.
bCONCAWE. 17
cCONCAWE. 32
dCONCAWE. 33
A summary of historical changes in gasoline tanker truck driver exposures in the United States as reported by Smith et al. 23 is illustrated in Table 3. These changes help to explain the continually decreasing exposures to gasoline/benzene vapor in many tasks performed by distribution workers. As gasoline usage for private vehicle use expanded between the 1950s and 1980s, changes in the equipment and procedures were instituted in order to reduce vapor exposures and increase delivery efficiency. Specifically, increases in tanker truck volume and in transfer pump capacity reduced fill times, while more frequent use of spill controls, submerged pipe loading and tank venting in later years actually led to reduced worker exposures, despite the higher gasoline volumes delivered. These findings, combined with environmental regulations on gasoline reformulation that led to lower benzene content in gasoline, provide an understanding of why gasoline/benzene vapor exposures to delivery personnel since the 1980s are likely much lower than those that occurred in the 1950s and earlier. 23
Historical changes effecting tanker driver exposures to gasoline in the United States as identified by Smith et al. 23

Adapted from Smith et al. 23
Methods
Evidence-based approach
Based on the authors’ past experience reviewing the literature concerning occupational exposures to petroleum products, the following research question was framed and considered to be answerable by rigorous evaluation of the available studies:
Does the available epidemiologic literature identify a strong, specific, consistent and coherent association between occupational exposure to gasoline and an increased risk of lymphatic and/or hematopoietic cancers in humans?
A thorough search of the published epidemiologic literature for studies on cancer mortality or incidence and occupational gasoline or oil refinery exposures led to initial inclusion of 67 separate epidemiologic reports. Of these, 13 studies were excluded because they were either not relevant to occupational gasoline exposures or refinery exposures, which were made irrelevant by follow-up studies, or were reviews that did not contribute new information (Appendix Table A1). 9,35 –37,39,40,42,44 –49 A total of 54 studies were thus identified for evidence-based ranking on quality and relevance to the research question and are included in Appendix Table A2.
Each of the 54 studies was ranked according to the following scheme:
Strength of study design: Cohort or nested case–control within a cohort study was ranked at two; other case–control studies were ranked at one.
Target cancer robustness: For total lymphatic/hematopoietic cancers or the largest relevant subset analyzed, studies with fewer than 10 cases were ranked at zero; 10–20 cases were ranked at one; 20–40 cases were ranked at two; 40–80 cases were ranked at 3; and more than 80 cases were ranked at four.
Gasoline exposure score: Studies examining petroleum workers not specifically including fuel distribution were ranked at one; one additional point was assigned for including a job exposure matrix that incorporated gasoline exposure measurements for a rank of two; a separate evaluation of job types that were explicitly identified as having elevated gasoline exposure was assigned the rank of three, a total rank of four was given for studies examining gasoline distribution workers specifically.
Dose–response score: Studies with no dose–response measures were assigned a rank of zero; analysis by duration of exposure only was ranked at one; analysis by a job exposure matrix was ranked at two.
Latency and confounding control score: Studies with no analysis of temporality (latency) between exposure and disease were ranked at zero; those with analysis of temporality were ranked at one; those with additional confounder analysis were ranked at two.
A summary of the individual ranks assigned for each of the 54 studies is provided in the Appendix Table A2. In some cases, the same study was ranked more than once because it contained data on separate cohorts (e.g. a refinery cohort and a distribution worker cohort). The highest total rank assigned to any study was 13 and the lowest was three. Studies with a total rank of 11–13 were assigned to Tier 1 (six studies; see Table 4); those with a total rank of 9–10 were assigned to Tier 2 (13 studies; see Table 5), and those with a total rank of 7 or 8 were assigned to Tier 3 (11 studies; see Table 6). Studies with a total rank of 3–6 (24 studies, mainly small cohort and case–control studies) were not considered further in the evidence-based analysis.
Summary of key findings on lymphohematopoietic cancers in Tier 1 studies.a
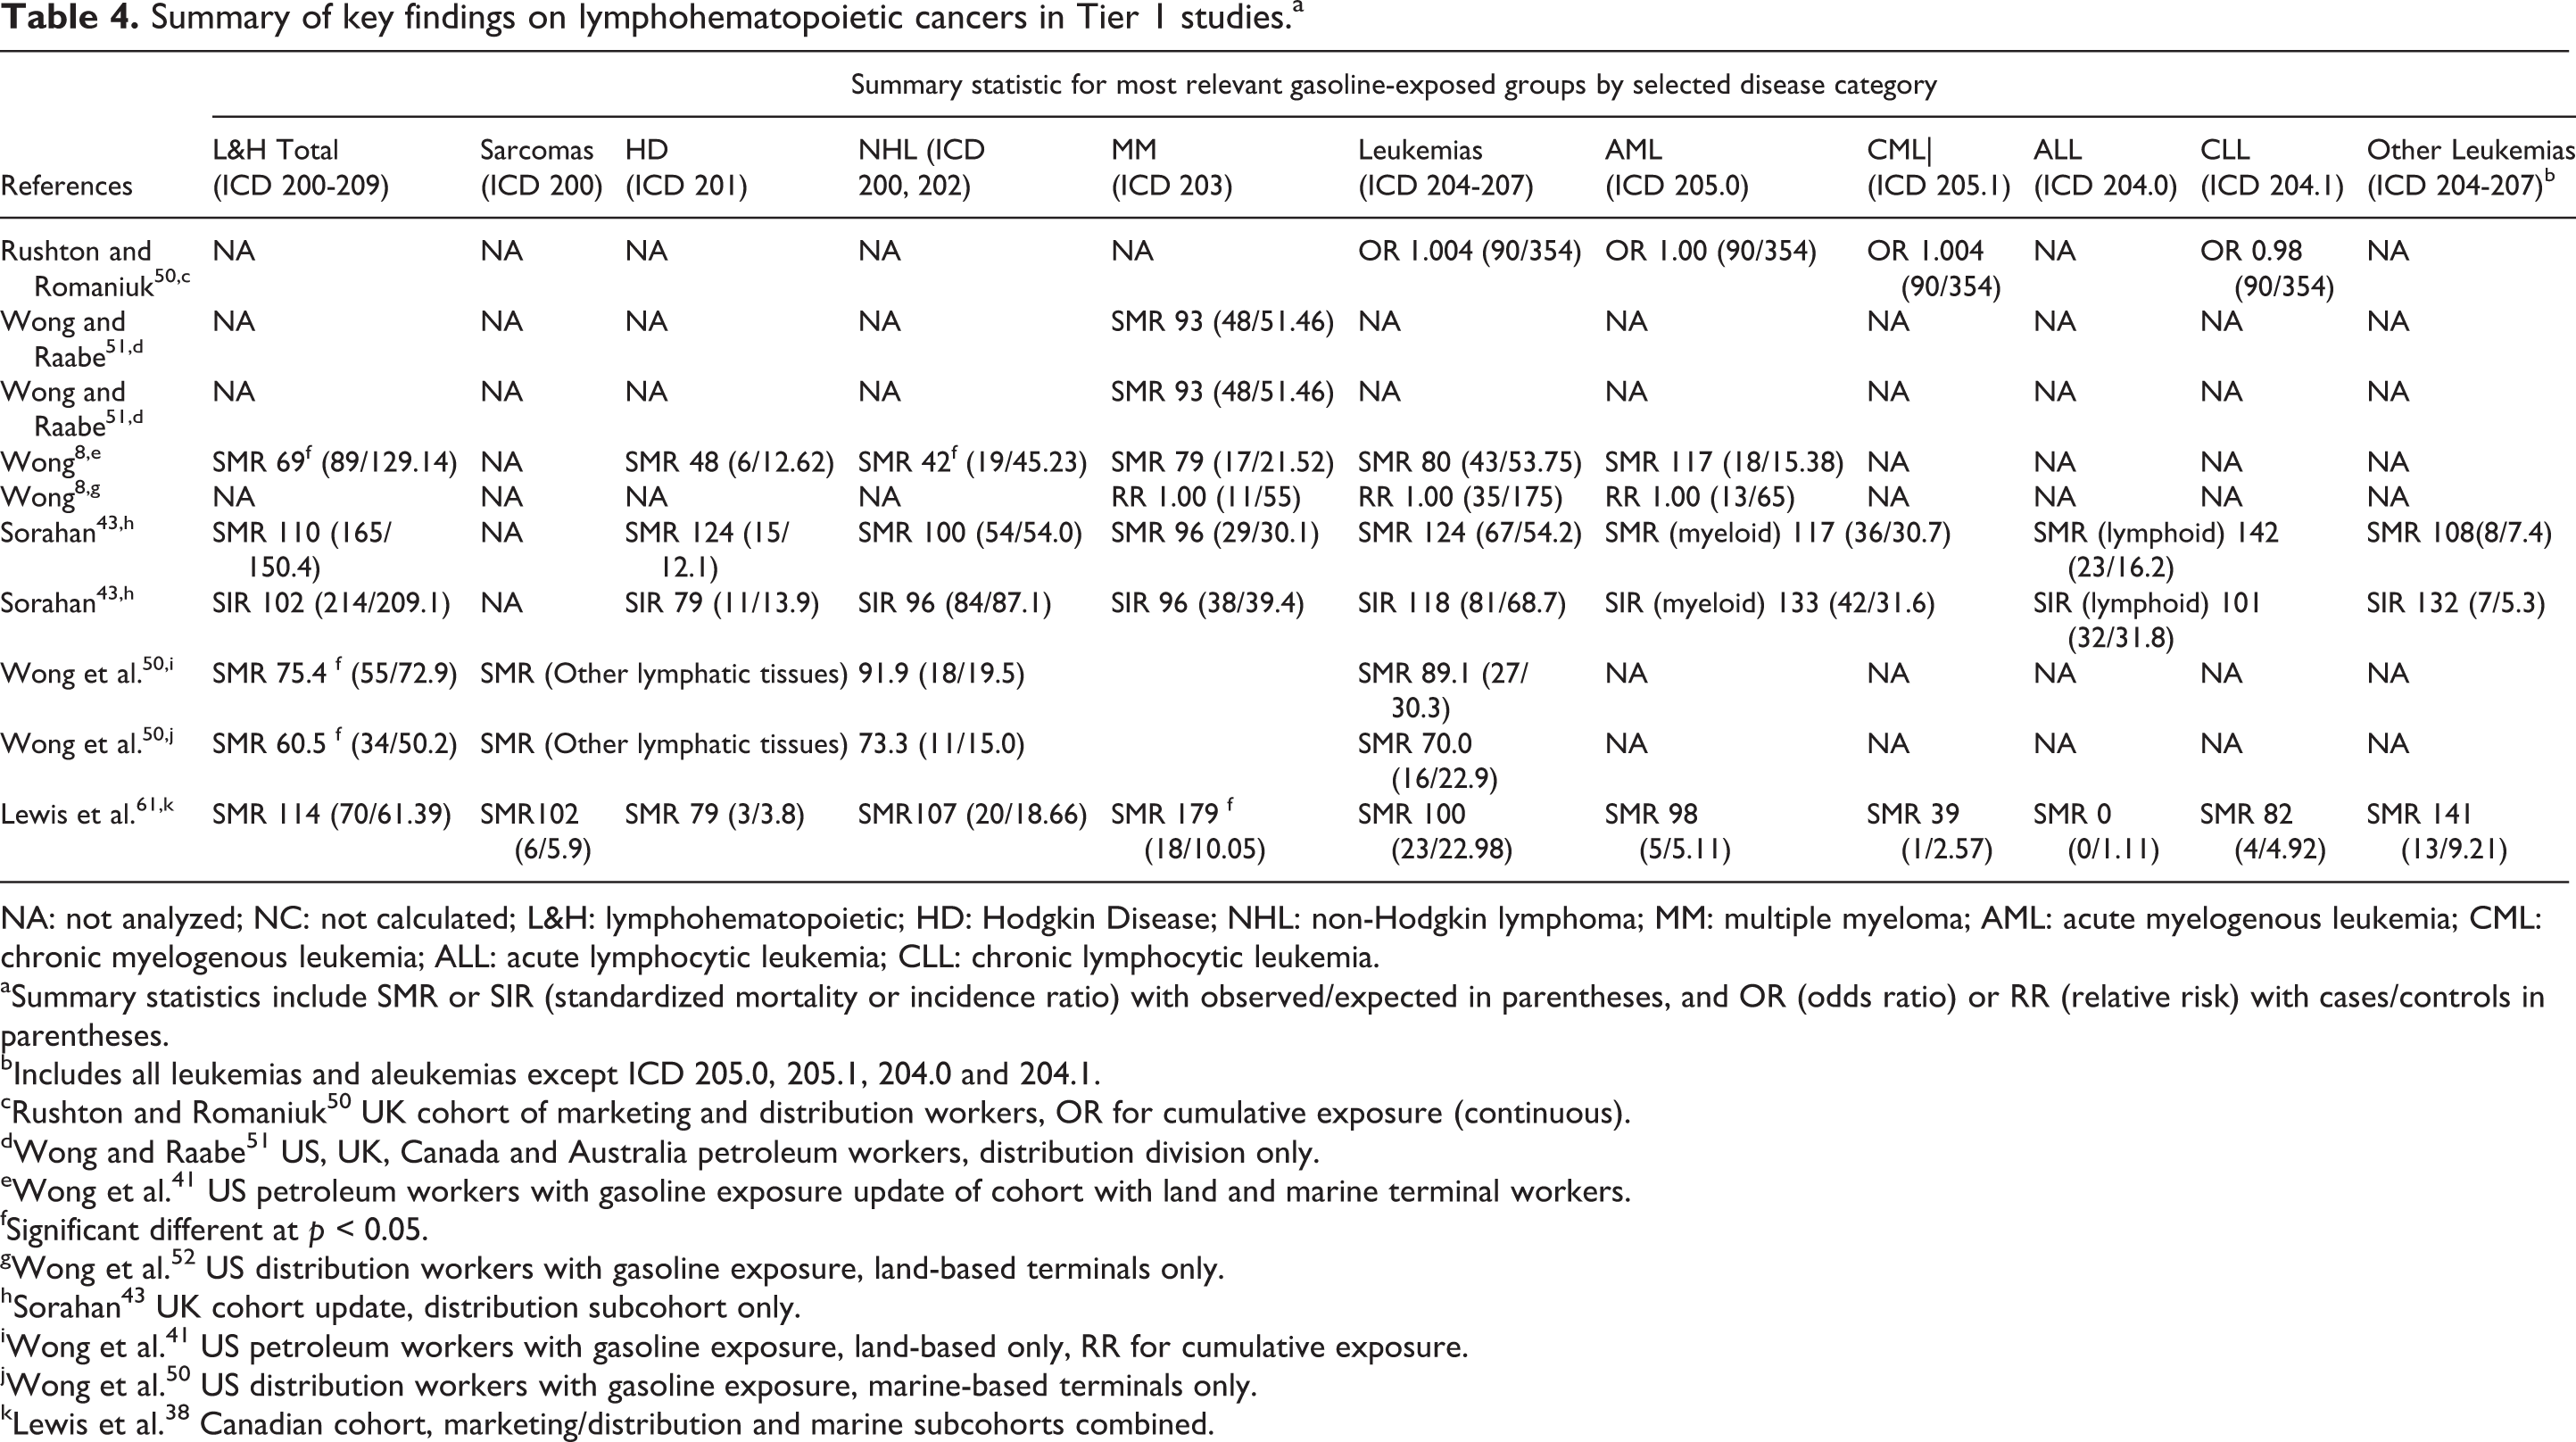
NA: not analyzed; NC: not calculated; L&H: lymphohematopoietic; HD: Hodgkin Disease; NHL: non-Hodgkin lymphoma; MM: multiple myeloma; AML: acute myelogenous leukemia; CML: chronic myelogenous leukemia; ALL: acute lymphocytic leukemia; CLL: chronic lymphocytic leukemia.
aSummary statistics include SMR or SIR (standardized mortality or incidence ratio) with observed/expected in parentheses, and OR (odds ratio) or RR (relative risk) with cases/controls in parentheses.
bIncludes all leukemias and aleukemias except ICD 205.0, 205.1, 204.0 and 204.1.
cRushton and Romaniuk 50 UK cohort of marketing and distribution workers, OR for cumulative exposure (continuous).
dWong and Raabe 51 US, UK, Canada and Australia petroleum workers, distribution division only.
eWong et al. 41 US petroleum workers with gasoline exposure update of cohort with land and marine terminal workers.
fSignificant different at p < 0.05.
gWong et al. 52 US distribution workers with gasoline exposure, land-based terminals only.
hSorahan 43 UK cohort update, distribution subcohort only.
iWong et al. 41 US petroleum workers with gasoline exposure, land-based only, RR for cumulative exposure.
jWong et al. 50 US distribution workers with gasoline exposure, marine-based terminals only.
kLewis et al. 38 Canadian cohort, marketing/distribution and marine subcohorts combined.
Summary of key findings on lymphohematopoietic cancers in Tier 2 studies.a

NA: not analyzed; NC: not calculated.; L&H: lymphohematopoietic; HD: Hodgkin Disease; NHL: non-Hodgkin lymphoma; MM: multiple myeloma; AML: acute myelogenous leukemia; CML: chronic myelogenous leukemia; ALL: acute lymphocytic leukemia; CLL: chronic lymphocytic leukemia.
aSummary statistics include SMR or SIR (standardized mortality or incidence ratio) with observed/expected in parentheses, and OR (odds ratio) or RR (relative risk) with cases/controls in parentheses.
bIncludes all leukemias and aleukemias except ICD 205.0, 205.1, 204.0 and 204.1.
cGun et al. 53 Australian petroleum industry cohort.
dSathiakumar et al. 54 US petroleum worker cohort, results for production-related, marketing division.
eSchnatter et al. 55 Canadian distribution worker cohort, OR for cumulative benzene exposure, model 2.
fRaabe et al. 56 US refinery worker cohort (Beaumont, TX), males only.
gSignificant different at p < 0.05.
hDivine et al. 57 Houston, TX refining, research & petrochemical workers.
iTsai et al. 58 US refinery and chemical worker cohort (Houston, TX), male employees.
jWong et al. 59 US refinery worker cohort (Beaumont, TX), male employees.
kHuebner et al. 60 US refinery/petrochemical worker cohort (Baton Rouge/Baytown).
lLewis et al. 61 US refinery/petrochemical worker cohort, active/terminated (Baton Rouge, Baytown, Bayway).
mLewis et al. 38 Canadian cohort, refinery subcohort only.
nGamble et al. 62 , US refinery/petrochemical plant retirees (Baton Rouge, Baytown, Bayway).
oWong and Raabe 51 US, UK, Canada and Australia petroleum workers, refinery subcohort only.
pSorahan 43 UK cohort update, refinery subcohort only.
Summary of key findings on lymphohematopoietic cancers in Tier 3 studies.a

NA: not analyzed; NC: not calculated; L&H: lymphohematopoietic; HD: Hodgkin Disease; NHL: non-Hodgkin lymphoma; MM: multiple myeloma; AML: acute myelogenous leukemia; CML: chronic myelogenous leukemia; ALL: acute lymphocytic leukemia; CLL: chronic lymphocytic leukemia.
aSummary statistics include SMR or SIR (standardized mortality or incidence ratio) with observed/expected in parentheses and OR (odds ratio) or RR (relative risk) with cases/controls in parentheses.
bAcute nonlymphocytic leukemia reported in lieu of AML.
cIncludes all leukemias and aleukemias except ICD 205.0, 205.1, 204.0 and 204.1.
dSatin et al. 63 cohort mortality study of US oil refinery workers in Port Arthur, Texas, males only.
eSignificant different at p < 0.05.
fSatin et al. 65 cohort mortality study of US petroleum refinery workers in California (Richmond and El Segundo), males only.
gHonda et al. 64 cohort mortality study in white males at a US petrochemical plant in Illinois, overall cohort.
hDryver et al. 66 population-based case–control of NHL in southern Sweden; OR for self-reported gasoline exposures.
iJarvholm et al. 67 cohort study of cancer incidence in Swedish petrochemical industry workers; distribution workers only.
jJarvholm et al. 67 cohort study of cancer incidence in Swedish petrochemical industry workers; refinery workers only.
kBlair et al. 68 population-based case–control study of NHL in selected US cities; OR for occupations involving gasoline and diesel exhausts.
lEriksson and Karlsson 69 population-based case–control of MM in Sweden; OR for petrol station/garage workers.
mSchumacher and Delzell 70 population-based case–control of NHL in North Carolina; OR for whites with industry exposure to fuels.
nHolly et al. 72 population-based case–control of NHL in homosexual men in a US city; OR for 10+ years self-reported gasoline exposure, all subjects.
oHuebner et al. 71 cohort study of H&L incidence in a US petrochemical plant in Baton Rouge, LA.
pLynge et al. 73 population-based cohort study of cancer incidence among service station workers in Scandinavian countries; males only.
The reported findings for lymphatic/hematopoietic cancers in each study were summarized by evidence tier (Tables 4–6) and a meta-statistic was derived for each general and specific disease category, by tier (Table 7). Mixed effects models were fit for the data in each tier for each cancer endpoint as described in DerSimonian and Laird. 96 When there were too few risk estimates to fit a mixed effects model (e.g. high number of iterations for the restricted maximum likelihood method), fixed effects models were fit using inverse variance weights. Statistical analyses were conducted using SAS software (Version 9.3, SAS Institute Inc., Cary, North Carolina, USA).
Meta statistics for hematopoietic and lymphatic cancers, by evidence tier.

aFixed effects model.
bMixed effects model.
Results
Tier 1 study findings that focus most specifically on more robust studies of gasoline distribution workers are summarized in Table 4. Tier 1 includes nine cohorts from six different studies. The most robust study in Tier 1 is the cancer mortality and incidence study of UK petroleum distribution workers; 43 it reported no significant changes in any of the lymphatic/hematopoietic cancers, and analysis of total leukemia and acute non-lymphocytic leukemia was not significantly elevated among more exposed job types, such as operators and drivers. Lewis et al. 38 identified a significant excess of MM deaths (Standardized Mortality Ratio (SMR), 179) among Canadian petroleum marketing and distribution workers (land and marine cohorts combined); the MM excess was concentrated among employees with 25–34 years of employment, but total lymphatic/hematopoietic cancers and other subtypes were not significantly different from expected. Wong and Raabe 51 found no excess MM in a large multinational cohort of petroleum workers in distribution jobs. Wong et al. 52 reported significantly lower than expected SMR values for total lymphatic/hematopoietic cancers among US gasoline distribution workers, and Wong et al. 41 reported significantly lower total lymphatic/hematopoietic cancers and NHL in US petroleum workers with gasoline exposure jobs. Case–control analyses of leukemia by Rushton and Romaniuk 50 (UK cohort) and leukemia and MM by Wong et al. 41 (US cohort) did not identify significant changes associated with gasoline exposure using multiple job exposure matrices.
Tier 2 study findings that include most of the larger oil refinery and petrochemical plant cohorts with plausible gasoline exposure are summarized in Table 5. Tier 2 includes 14 cohorts from 13 different studies. The most robust studies are the UK petroleum refinery worker cohort and studies of US refineries and petrochemical plants; no significant changes were found for lymphatic/hematopoietic cancer mortality or incidence, and analysis of leukemia by job type revealed no significant associations. Relatively few statistically significant findings were reported for the other cohort studies and no significant findings were reported in the case–control analyses. Divine et al. 57 identified a significant excess of ‘other leukemias’ (SMR 252) in the Houston, Texas refinery, although total leukemias and more prevalent lymphatic/hematopoietic disease subtypes such as AML, chronic myelogenous leukemia, acute lymphocytic leukemia (ALL) and chronic lymphocytic leukemia (CLL) were not significantly changed, nor were they related to higher exposure job types. Raabe et al. 56 reported a significant increase in lymphatic/hematopoietic cancers (SMR 133) in the Beaumont, Texas refinery, although no significant changes were reported for specific cancer subtypes. Lewis et al. 61 reported significant increases in lymphatic/hematopoietic cancers (SMR 122) and leukemias (SMR 150) in US refinery cohorts in Louisiana (Baton Rouge), Texas (Baytown) and New Jersey (Bayway), and related analyses identified increased leukemias (SMR 154) and excess CLL (SMR 183). 60 Gamble et al. 62 reported excess NHL and MM (SMR 137). 62 These authors reported that the significant excesses appeared to be largely attributable to mortality patterns at one refinery (Baton Rouge) and among individuals hired before 1950, when industrial hygiene practices and engineering controls to limit benzene exposures were less rigorous. 60 –62 Raabe et al. 56 reported similar temporal trends regarding the total lymphatic/hematopoietic cancer excess in the Beaumont, Texas refinery cohort.
Tier 3 study findings are presented in Table 6, and include refinery cohorts and population-based studies with plausible gasoline exposure. Tier three includes 12 cohorts from 11 different studies. Overall, there were relatively few statistically significant findings. Satin et al. 63 reported no significant excess of leukemias (SMR 105) in the Port Arthur refinery cohort, but found significantly increased ALL (SMR 260) and significantly decreased CLL (SMR 30). Satin et al. 59 reported significantly increased mortality from MM (SMR 159) in workers from two California refineries. The Swedish case–control study by Dryver et al. 66 reported significantly greater self-reported gasoline exposures among NHL cases, but three smaller case–control studies found no significant difference. 68,70,72
Table 7 provides meta-statistics for the general and specific lymphatic/hematopoietic cancer categories for Tiers 1, 2 and 3. The Tier 3 meta-relative risk estimate for ALL was elevated and statistically significant (RR: 192, 95% confidence interval (CI): 105–279). 62,54,55 This value was based on three studies and was estimated through a fixed effects model. The Tier 2 RR for ALL was not significantly elevated (RR: 131, 95% CI: 85.7–176). This value was based on eight cohorts in seven studies and was also estimated through a fixed effect model. 38,53,56 –59 None of the other meta-relative risks was statistically significant.
Discussion
The findings presented in Tables 4 to 7 suggest that there is no strong, specific, consistent and coherent association between occupational gasoline exposure and lymphatic/hematopoietic cancers, based on the most robust and rigorous epidemiological studies that have been published. Although the ranking was inherently subjective in nature, it allowed us to stratify the studies in a transparent manner. To our knowledge, ours is the first study to utilize an evidence-based approach to assist in drawing conclusions about potential relationships between gasoline and human lymphatic/hematopoietic cancer risks.
The highest-ranked studies of Tier 1 (Table 4) were the most telling, in that lymphohematopoietic cancers were not significantly elevated among the more robust petroleum distribution worker studies. Only one study identified a statistically significant increased risk of MM (SMR 179, 18 observed/10 expected) that was based on relatively small numbers. 38 This increase was not found in other Tier 1 studies and the meta-statistic for MM was not elevated (RR: 82.4, 95% CI: 66.0–98.8). Similarly, there was no strong or consistent increase in total lymphatic/hematopoietic cancers or any specific subtype (Table 7). All of the meta-relative risk estimates were below 130 for Tier 1 studies, and none of the estimates were statistically significant for any of the three evidence tiers, other than ALL in Tier 3. The ALL estimate was based on 16 people across three cohorts. Based on this small sampling of workers and the lower magnitude and specificity of gasoline exposures in Tier 3, the isolated significant increase in ALL risk appears inconsistent and is not supported by the stronger weight of evidence in Tiers 1 and 2.
Many studies of larger populations of oil refinery and petrochemical plant workers have been published to date, but the frequency and duration of gasoline vapor exposures is expected to be much less than for distribution workers. Among these studies identified in Tier 2 (Table 5) and Tier 3 (Table 6), there again are few statistically significant increases in lymphatic/hematopoietic cancers and/or specific subtypes. Reported increases in leukemias among US refinery populations in Tier 2 appear to be isolated to certain regions (e.g. Baton Rouge, Louisiana, and Beaumont, Texas), and occurred mainly among those hired before 1950, before more rigorous benzene exposure controls commenced. For example, in Baton Rouge, statistically significant elevations are seen in the pre-1950 hire group for all leukemia (SMR 1.95) and CLL subtypes (SMR 2.81) 53 and an SMR of 154 was observed in Beumont, Texas in employees with 40+ years since the date of first employment. 59,60 . Overall, there is no consistent, statistically significant increase in lymphatic/hematopoietic cancers and/or specific subtypes in Tiers 2 and 3, and the meta-statistics (Table 7) calculated for each tier further support the absence of a biologically meaningful cancer risk based on epidemiologic studies expected to be most relevant for assessing gasoline-related cancer risks.
Benzene is the only commonly detectable component of gasoline vapors that is demonstrated to cause cancer in humans above certain cumulative doses. The vast majority of gasoline vapor components are alkane and alkene hydrocarbons, none of which have any known carcinogenic hazard to humans. Nevertheless, the prevalent uses of gasoline in occupational settings and the recognition of benzene carcinogenicity have raised sufficient public health concerns to spur dozens of epidemiologic studies to determine whether or not elevated leukemia rates observed in workers with high benzene exposures are seen among those exposed to gasoline. While some oil refinery studies identified significant increases in leukemias, the prominent occurrence among workers hired before 1950 suggests that improved industrial hygiene and engineering controls implemented in subsequent decades may have reduced or eliminated any increased risk. Furthermore, as noted by Wong et al. 8 , exposures to benzene among distribution workers were relatively low (3–4 ppm) even in the 1950s, as compared to classic benzene exposed cohorts such as the Pliofilm cohort. Since gasoline formulations over the past three decades have been modified to contain lower concentrations of benzene, the potential risk of benzene-related cancer associated with gasoline-exposed populations should be decreasing. It should be noted that studies included in Tier 1 of this analysis included gasoline exposed cohorts that encompassed a period of time greater than five decades (1947–2003) and no apparent time-related differences in disease occurrence were evident in our meta-analysis or in the individual studies. Indeed, OSHA recently reported that most of the occupations that have the highest potential for exposure to gasoline since the 1980s have full-shift airborne benzene concentrations for workers that are below the current US occupational exposure limits of 3 mg/m3. 34
Each of the individual studies and meta–analysis techniques have limitations. The evidence-based ranking approach is expected to assist in sorting the most relevant studies as the basis for drawing valid conclusions regarding the research question. In many of the studies, however, the population subset with regular and/or appreciably elevated exposures to gasoline vapors is likely to be small. Additionally, many of the cohorts included in Tier 2 and 3 studies may have had little gasoline exposure, leading to potential dilution of results. However, it is expected that the specificity and robustness of Tier 1 studies may attenuate such dilution. The meta-analysis approach, too, may be limited, in that it combines SMRs from various populations. An analysis of heterogeneity across the studies assists in characterizing how well a group of studies can be considered repeated measures. Although heterogeneity estimates were not calculated, a recent review and meta-analysis of gasoline and NHL risk looked at most of the same studies evaluated in the current study and did not identify significant heterogeneity issues. 9 Nonetheless, mixed effects models were utilized in this meta-analysis to account for heterogeneity. In addition, some of the studies included in the current analysis may have been somewhat redundant (e.g. such as when authors reported combined-cohort findings for selected cancers, as in the 1997 MM analysis by Wong and Raabe. 51 ). Furthermore, as discussed above, gasoline is a complex mixture that has changed through time and has differences worldwide. Although the specific types of gasoline that individuals included in this analysis were exposed to varied inter- and intracohort, we believe that the meta-analysis approach utilized in this article is the best way to approach questions involving mixtures of chemicals. Despite these limitations, the transparent evidence-based approach allows readers to draw their own conclusions based on the reported findings of individual studies, with or without the aid of the meta-analysis.
Past reviews and meta-analyses concerning gasoline carcinogenicity in humans have not identified any strong or consistent associations with hematolymphopoietic cancers. Kane and Newton 9 performed a rigorous meta-analysis on occupational gasoline exposure and NHL that included many of the studies reported in the current study. They identified a meta risk estimate of 1.02, comparable to our meta-statistic of 101 (95% CI: 90. 4-112) for Tier 2, the most robust evidence tier that is dominated by large refinery worker studies. 9 The comprehensive review of gasoline carcinogenicity performed by Dement et al. 97 summarized and reviewed several cohort and case control studies, some of which were included in our analysis. The authors focused primarily on hematopoietic cancers and kidney cancer. They determined that cohort studies did not demonstrate statistically significant associations between gasoline exposure and leukemia. A more recent review by Jamall and Willhite 35 focused on benzene exposures arising from gasoline. The authors evaluated gasoline exposures using benzene as a surrogate for deriving risk-based clean-up levels for gasoline impacted soil and groundwater. They reviewed several epidemiological and toxicological studies, and concluded that cancer potency factors and theoretical cancer risks should not be used to dictate clean-up levels for gasoline. They also concluded that gasoline should be treated as a complex mixture, whether in response to clean-up levels or to questions regarding carcinogenicity. Finally, IARC, USEPA and ACGIH either do not consider gasoline to be a carcinogen or state that there is insufficient evidence to determine its carcinogenicity. 3,5,15,98,99
In conclusion, an evidence-based approach was utilized to evaluate whether or not convincing epidemiologic evidence exists for a strong, specific, consistent and coherent association between occupational gasoline exposure and lymphatic/hematopoietic cancers. While isolated associations have been observed, the most relevant and robust studies available to date do not demonstrate any such association between gasoline exposure and the general and specific cancer types evaluated. If benzene is the sole carcinogenic component of gasoline vapors, the available studies suggest that lower benzene vapor exposures from gasoline formulated during the past three decades may ultimately demonstrate that current occupational exposures are virtually safe with respect to lymphoid and hematopoietic cancer risks. Additional studies focusing on gasoline-exposed worker populations should be completed to further assess this possibility.
Footnotes
Authors’ Note
After the current analysis was in press, Schnatter et al. (2012) published additional relevant data on AML among gasoline-exposed workers in the Journal of National Cancer Institute (104:1724-1737). They reported no increase in AML risk for occupationally exposed gasoline workers in a cohort that would have been classified under Tier 2 in our analysis. Adding these findings would further strengthen our finding of no strong or consistent association between gasoline exposure and increased AML risk.
All of the authors are employed by ChemRisk, a consulting firm that provides scientific advice to the government, corporations, law firms, and various scientific/professional organizations. ChemRisk has been engaged by entities involved in the petroleum industry. This paper was prepared and written exclusively by the authors without review or comment by employees or counsel for those entities. It is likely that this work will be relied upon in industrial hygiene research, risk assessment research, and litigation. Some of the authors may be called upon to serve as expert witnesses.
All of the authors are employed by ChemRisk, a consulting firm that provides scientific advice to the government, corporations, law firms, and various scientific/professional organizations. ChemRisk has been engaged by entities involved in the petroleum industry. This paper was prepared and written exclusively by the authors without review or comment by employees or counsel for those entities. It is likely that this work will be relied upon in industrial hygiene research, risk assessment research, and litigation. Some of the authors may be called upon to serve as expert witnesses.
Appendix
Ranking of relevant studies
| Study authors/characteristics | Ranks assigned based on study design and population characteristics | Total rank | ||||
|---|---|---|---|---|---|---|
| Strength of design | Robustness for L&H cancers | Specificity to gasoline | Dose-response rigor | Confounding control rigor | ||
| Rushton and Romaniuk 50 . Nested Case–Control, UK petroleum distribution workers; n = 91 leukemia deaths. | 2 | 4 | 4 | 2 | 1 | 13 |
| Wong and Raabe 51 . Cohort, US, UK, Canadian, Australian petroleum worker meta-analysis for MM deaths, n = 158 exp L&H cancer deaths overall, n = 51 exp distribution workers only. | 2 | 4 | 4 | 2 | 1 | 13 |
| Wong et al. 41 . Cohort, US petroleum workers exposed to gasoline; n = 129 exp L&H cancer deaths | 2 | 4 | 4 | 2 | 1 | 13 |
| Wong et al. 41 . Nested Case–control, US petroleum workers exposed to gasoline. N = 59 L&H cancer deaths. | 2 | 3 | 4 | 2 | 1 | 12 |
| Sorahan 43 . Cohort, UK petroleum distribution workers, n =150 exp L&H deaths; n = 209 exp L&H incidence | 2 | 4 | 4 | 1 | 1 | 12 |
| Wong et al. 52 . US petroleum distribution workers, n = 73 exp L&H deaths | 2 | 3 | 4 | 2 | 1 | 12 |
| Lewis et al. 38 . Cohort, US petroleum distribution (land and marine); n = 61 exp L&H deaths | 2 | 3 | 4 | 1 | 1 | 11 |
| Gun et al. 53 Cohort, Australian petroleum workers; n = 100 incident and 49 deaths from L&H. | 2 | 4 | 2 | 1 | 1 | 10 |
| Sathiakumar et al. 54 Nested Case–control, US petroleum workers; n = 69 leukemia cases. | 2 | 3 | 2 | 2 | 1 | 10 |
| Schnatter et al. 55 Nested Case–control, Canadian petroleum distribution workers; n = 14 leukemia deaths. | 2 | 1 | 4 | 1 | 1 | 9 |
| Raabe et al. 56 . Cohort, US refinery workers (Beaumont, TX); n = 49 exp L&H deaths. | 2 | 3 | 2 | 1 | 1 | 9 |
| Divine et al. 57 . Cohort, US refinery & petrochemical workers (Texas); n > 100 exp L&H deaths. | 2 | 4 | 1 | 1 | 1 | 9 |
| Tsai et al. 58 Cohort, US refinery and chemical workers (Deer Park, TX); n = 96 exp L&H deaths. | 2 | 4 | 1 | 1 | 1 | 9 |
| Wong et al. 59 Cohort, US refinery workers (Beaumont, TX); n = 69 exp L&H deaths. | 2 | 4 | 1 | 1 | 1 | 9 |
| Huebner et al. 60 . Cohort, US refinery and petrochemical workers (Baton Rouge, Baytown); n = 105 exp L&H deaths. | 2 | 4 | 1 | 1 | 1 | 9 |
| Lewis et al. 61 . Cohort, US refinery/petrochemical workers (Baton Rouge, Bayway, Baytown; active/terminated); n = 95 exp L&H deaths. | 2 | 4 | 1 | 1 | 1 | 9 |
| Gamble et al. 62 Cohort, US refinery/petrochemical retirees (Baton Rouge, Baytown, Bayway; retirees); n = 113 exp L&H deaths. | 2 | 4 | 1 | 1 | 1 | 9 |
| Satin et al. 63 Cohort, US refinery workers (Port Arthur, TX); n = 135 exp L&H deaths. | 2 | 4 | 1 | 0 | 1 | 8 |
| Honda et al. 64 . Cohort, US Petroleum manufacturing plant in Illinois; n = 91 exp L&H deaths. | 2 | 4 | 1 | 0 | 1 | 8 |
| Satin et al. 65 Cohort, US refinery workers (Richmond & El Segundo, CA); n = 126 exp L&H deaths. | 2 | 4 | 1 | 0 | 1 | 8 |
| Dryver et al. 66 Case–control, regional hospital cases in Sweden; n = 859 NHL cases. | 1 | 4 | 1 | 1 | 1 | 8 |
| Jarvholm et al. 67 Cohort, Swedish petroleum workers; n = 14 incident L&H cases. | 2 | 1 | 2 | 1 | 1 | 7 |
| Blair et al. 68 Case–control, US male hospital cases; n = 622 NHL cases and 1245 controls. | 1 | 4 | 1 | 1 | 0 | 7 |
| Eriksson and Karlsson 69 . Case–control, selected counties in Sweden; n = 275 MM cases. | 1 | 4 | 1 | 1 | 0 | 7 |
| Schumacher and Delzell 70 . Case–control, US textile workers; n = 501 NHL deaths and 569 controls. | 1 | 4 | 1 | 1 | 0 | 7 |
| Huebner et al. 71 Cohort, US petrochemical workers (Baton Rouge); n = 47 exp L&H incidents. | 2 | 3 | 1 | 0 | 1 | 7 |
| Holly et al. 72 Case–control, US homosexual males; n = 312 NHL cases and 420 controls. | 1 | 4 | 1 | 1 | 0 | 7 |
| Lynge et al. 73 Cohort, Nordic population-based cohort of service station workers, n = 119 exp L&H incidents | 2 | 4 | 1 | 0 | 0 | 7 |
| Collingwood et al. 74 Cohort, US refinery workers (Paulsboro, NJ); n = 36 exp L&H deaths. | 2 | 2 | 1 | 0 | 1 | 6 |
| Tsai et al. 75 Cohort, US refinery/petrochemical workers (Baton Rouge, LA); n =18 exp L&H deaths. | 2 | 1 | 1 | 1 | 1 | 6 |
| Wong et al. 76 . Cohort, US refinery (Torrance, CA); n = 19 exp L&H deaths. | 2 | 1 | 1 | 1 | 1 | 6 |
| Tsai et al. (2004). Cohort, US refinery and petrochemical workers (Norco and Geismar, LA); n = 25 incident L&H cases. | 2 | 2 | 1 | 0 | 1 | 6 |
| Linet et al. 77 Case–control, US MM cases; n = 100 white cases. | 1 | 4 | 1 | 0 | 0 | 6 |
| Lindquist et al. 78 Case–control, regional hospital cases in Sweden; n = 125 acute leukemia cases. | 1 | 4 | 1 | 0 | 0 | 6 |
| Morris et al. 79 , Case–control, US multi-region cases; n = 698 MM cases. | 1 | 4 | 1 | 0 | 0 | 6 |
| Cuzick and De Stavola 80 Case–control, UK regional hospital cases; n = 399 MM cases | 1 | 4 | 1 | 0 | 0 | 6 |
| Flodin et al. 81 Case–control, regional hospital cases in Sweden; n = 131 MM cases. | 1 | 4 | 1 | 0 | 0 | 6 |
| Persson and Fredrikson 82 Case–control, Swedish cancer registry; n = 199 NHL cases and 479 referents. | 1 | 4 | 1 | 0 | 0 | 6 |
| Franceschi et al. 83 Case–control, Italian hospital cases; n = 208 NHL cases and 401 controls | 1 | 4 | 1 | 0 | 0 | 6 |
| Nadon et al. 84 . Case–control, Montreal hospital cases; n = 206 NHL cases and 2599 controls. | 1 | 4 | 1 | 0 | 0 | 6 |
| Karunanayake et al. 85 Case–control, Canadian male cases; n = 513 NHL cases and 1506 controls. | 1 | 4 | 1 | 0 | 0 | 6 |
| t'Mannetje et al. 86 Case control, New Zealand cancer registry cases; n = 291 NHL cases and 471 controls. | 1 | 4 | 1 | 0 | 0 | 6 |
| Orsi et al. 87 Case–control, French hospital cases; n = 824 lymphoid cancer cases and 752 controls. | 1 | 4 | 1 | 0 | 0 | 6 |
| Bernard et al. 88 Case–control, UK hospital cases; n = 285 lymphoid cancer cases and 285 controls. | 1 | 4 | 1 | 0 | 0 | 6 |
| Hardell et al. 89 Case–control, Swedish hospital cases; n = 105 NHL cases and 335 controls. | 1 | 4 | 1 | 0 | 0 | 6 |
| Zheng et al. 90 Case–control, US male hospital cases; n = 555 NHL/CLL cases and 2380 controls. | 1 | 4 | 1 | 0 | 0 | 6 |
| Brandt et al. 91 Case–Control, hospital consults in Sweden; n = 50 ANLL cases. | 1 | 3 | 1 | 0 | 0 | 5 |
| Pukkala 92 Cohort, Finnish oil refinery workers; n = 24 exp L&H incident cases. | 2 | 2 | 1 | 0 | 0 | 5 |
| Consonni et al. (2002). Cohort, Italian refinery workers; n = 8.4 exp L&H deaths. | 2 | 0 | 1 | 1 | 1 | 5 |
| Lagorio et al. 93 Cohort, Italian service station workers, n = 7.3 exp L&H | 2 | 0 | 1 | 1 | 0 | 4 |
| McCraw et al. 94 Cohort, US refiner workers (Wood River, IL); n = 10 exp L&H deaths. | 2 | 1 | 1 | 0 | 0 | 4 |
| Jakobsson et al. 95 Cohort, Swedish population-based cohort of service station workers, n = 2.8 exp L&H | 2 | 0 | 1 | 0 | 0 | 3 |

L&H: lymphohematopoietic; MM: multiple myeloma.
Funding
This research received no specific grant from any funding agency in the public, commercial, or not-for-profit sectors.