
Abstract
Among the artemisinin-based combination therapy (ACT) regimens, artemisinin derivative, artemether in combination with lumefantrine (artemether–lumefantrine, AL) has achieved excellent results in the fight against malarial scourge. In this study, we evaluated the toxic potential of these drugs at the therapeutic doses in female Wistar rats. Animals were randomly divided into four groups: those administered 1% Tween 80 (control), those administered artemether (4 mg/kg body weight), those administered lumefantrine (24 mg/kg body weight), and those coadministered artemether (4 mg/kg body weight) and lumefantrine (24 mg/kg body weight). The drugs were orally administered twice daily for 3 days by gastric intubation after which selected plasma biochemical indices, and erythrocytes antioxidant defence and lipid peroxidation markers were evaluated. Coadministration of artemether and lumefantrine raised liver and renal function markers and increased atherogenic index. While reduced glutathione, glucose-6-phosphate dehydrogenase (G6PD) and catalase activities were reduced, glutathione peroxidase and glutathione-s-transferase activities increased in all the treated groups compared to the control group. The drugs caused significant (p < 0.05) elevation of malondialdehyde (MDA) levels compared to the control group. These results imply that coadministration of artemether and lumefantrine may increase the risks of atherosclerosis as well as liver and renal function impairments in the users. In addition, the drugs may also promote oxidative stress in the erythrocytes.
Keywords
Introduction
The scourge of malaria continues to be devastating in tropical countries, despite the availability of many classes of antimalarial drugs. 1,2 The limitation to the success of malaria treatment is the evolution of resistance of the parasites to most of the available antimalarials in Africa. As a consequence of this, the World Health Organization (WHO) recommended that antimalarial therapies should be deployed as combination therapies (CTs) instead of the usual monotherapies. 3 CTs containing artemisinin derivatives are currently the most common, and to date, no cases of clinical resistance to these drugs have been reported. Combinations with unmatched pharmacokinetics (i.e., a short–half-life artemisinin and a long–half-life partner drug) are the most preferred option. Coartem (the Novartis brand name of artemether–lumefantrine combination) was one of the first CTs to be deployed. 3,4
Artemether is a fat-soluble derivative of the antimalarial drug artemisinin, 5 active against the three major human schistosome parasites. 6 It is readily absorbed within 2 h of oral ingestion. Dihydroartemisinin is the major metabolite of artemether, and it also exhibits antischistosomal activity. 7 Artemether and other artemisinins have advantage over other antimalarials due to their rapid effect on all asexual erythrocytic stages of the malarial parasite and on the sexual gametocytes. In spite of this advantage, artemisinins have shown toxic potentials. For example, animal studies reported neurotoxicity effects of artemether, although these findings have not been confirmed in humans. 8
Lumefantrine possesses distinct blood schizontocidal activities against a wide range of plasmodia. It was synthesised in China in the 1970s 9 and is effective against all Plasmodium species that are pathogenic to humans. 10 Lumefantrine is highly lipophilic, and absorption commences approximately 2 h after administration. Peak plasma levels are found after 6–8 h of administration. The activity of lumefantrine is slower than that of artemisinins and the recrudescence rate is low when the substance is administered as recommended. 11
Oxidative stress affects erythrocytes to a large extent. 12,13 Erythrocyte sensitivity to oxidative damage is primarily due to the presence of polyunsaturated fatty acids (PUFAs) in their membranes as well as high concentrations of cellular oxygen and haemoglobin (Hb). 14,15 As a result of this therefore, the erythrocytes utilise efficient antioxidant mechanism, in the form of antioxidant enzymes such as glucose-6-phosphate dehydrogenase (G6PD), superoxide dismutase (SOD), catalase (CAT) and glutathione-S-transferase (GST), and nonenzymatic antioxidant molecules such as glutathione and vitamins C and E to scavenge reactive oxygen species, thereby maintaining membrane integrity. So far, only few studies have shown interest in the effects of coadministration of artemether and lumefantrine on the erythrocyte antioxidant status and plasma biochemical indices in a female mammalian model and hence, the reason for this study.
Materials and method
Tested drugs and reagents
Pure powdered artemether (99.5%) and lumefantrine (98.5%) were obtained in the courtesy of Emzor Pharmaceutical Industries, Lagos State, Nigeria. The chemical name of artemether is (1R,4 S,5R,8 S,9R,10 S,12R,13R)-10-methoxy-1,5,9-trimethyl-11,14,15,16-tetraoxatetracyclo- [10.3.1.0^{4,13}.0^{8,13}] hexadecane, with the molecular formula of C16H26O5, and molecular weight of 298.38. Lumefantrine is a 2-dibutylamino-1-[2,7-dichloro-9-(4-chlorobenzylidene)-9H-fluoren-4-yl]-ethanol, with a molecular weight of 528.9 and molecular formula of C30H32Cl3NO. All the other reagents used for this study were of analytical grade.
Animals and animal care
Animal studies were carried out in accordance with the Declaration of Helsinki and European Community guidelines for the ethical handling of laboratory animals through the approval of institutional animal care and use committee. Female Wistar rats weighing between 230 and 250 g were obtained from the Animal House Facility of the College of Science and Technology, Covenant University, Ota, Ogun State, Nigeria, where this research was conducted in September 2010. The animals were housed for 1 week prior to experiment under controlled conditions with 12- h light/dark cycle, temperature 22°C
Experimental design
Twenty (20) female Wistar rats were randomly divided into four study groups of five animals each: those administered 1% Tween 80 (control), those administered artemether (4 mg/kg body weight), those administered lumefantrine (24 mg/kg body weight), and those coadministered artemether (4 mg/kg body weight) and lumefantrine (24 mg/kg body weight). These doses were equivalent to the therapeutic doses of artemether–lumefantrine (20–120 mg/5 kg). The drugs were orally administered twice daily by gastric intubation as follows: the first dose was administered in the morning, while the second dose was administered 8 h later. On days 2 and 3, the doses were administered in the morning and evening. Following the last day of treatment, animals were fasted overnight and sacrificed.
Collection of blood samples and preparation of erythrocytes
Blood samples were collected by cardiac puncture into heparinised bottles under mild anaesthesia using diethyl ether and centrifuged at 3000 rpm for 10 min within 1 h of blood collection to obtain plasma and erythrocytes. The plasma was used to determine the selected clinical chemistry indices. The erythrocytes were washed three times with ice-cold phosphate-buffered saline (PBS: 145 mM NaCl, 1.9 mM NaH2PO4 and 8.1 mM Na2HPO4) and centrifuged. The erythrocyte pellets obtained were thereafter resuspended in PBS (0.1 M, pH 7.4) at 1:9 dilutions and used for the evaluation of oxidative stress markers.
Assay of plasma biochemical profile
Commercial test kits were obtained from Roche Diagnostics, GmbH, Mannhein, Germany, and used for the following plasma biochemical indices using Uniscope 23D spectrophotometer, England: alanine aminotransferase (ALT) and aspartate aminotransferase (AST) were estimated according to Reitman and Frankel’s method 16 ; alkaline phosphatase (ALP) was estimated using the phenolphthalein monophosphate method 17 ; total bilirubin was estimated using Doumas et al. method 18 ; total protein was determined using Biuret method 19 ; glucose level was obtained using the enzymatic GOD-PAP method 20 ; urea was analysed using the Bethelot Searcy’s method 21 ; creatinine was determined by the method described by Larsen, 22 albumin was estimated by bromo cresol green (BCG) method 23 ; total cholesterol was measured using the method of Braun 24 ; triacylglycerol analysed using Stein and Myers method 25 ; high-density lipoprotein (HDL)-cholesterol was estimated using the method of Hiller 26 ; low-density lipoprotein (LDL)-cholesterol was measured using the method of Fridewald et al. 27 All the plasma electrolytes were determined using Syncron EL-ISE electrolyte analyser (Beckman) by the method of Kinsley and Scharffert. 28
Erythrocytes antioxidant enzyme activities and glutathione level
Glutathione peroxidase (GPX)
GPX activity was assayed following the method described by Wever et al. 29 The reaction mixture consisted of 3.0 mL of pyrogallol in 0.1 M phosphate buffer (pH 7.0) and 0.5 mL of 1% (vol/vol) hydrogen peroxide (H2O2). To this was added 0.1 mL of sample, and the change in absorbance was measured at 430 nm at 30-s interval for 2 min. The GPX activity was calculated using the molar extinction coefficient of oxidised pyrogallol (4.5 M−1 cm−1).
Glucosse-6-phosphate dehydrogenase (G6PD)
G6PD activity was assayed based on the spectrophotometric measurement of nicotinamide adenine dinucleotide (NADPH) formation rate, which is proportional to the G6PD activity. 30
SOD
SOD activity was estimated using the method of McCord and Fridovich 31 based on the auto-oxidation of pyrogallol. To 50 µl of the sample, 75 mM of Tris-HCl buffer (pH 8.2), 30 mM of ethylenediaminetetraacetic acid (EDTA) and 2 mM of pyrogallol was added. An increase in absorbance was recorded at 420 nm for 3 min by spectrophotometer. One unit of enzyme activity is 50% inhibition of the rate of auto-oxidation of pyrogallol as determined by change in absorbance/min at 420 nm.
Catalase
The method of Aebi 32 was used to measure the catalase activity. The reaction was started by the addition of 0.3 ml of 30 mM H2O2 to 0.65 ml of 50 mM potassium phosphate buffer and 50 μl of the sample. The H2O2 decomposition was monitored at 240 nm, 37°C for 3 min. The catalase activity was expressed as micromoles of H2O2 consumed per minute per milligram of sample protein using the molar absorption coefficient of 36 M−1cm−1.
Reduced glutathione (GSH)
GSH was determined according to the method of Ellman. 33 In brief, in a centrifuge tube, 0.5 ml of sample was added to 0.5 ml of 5% trichloroacetic acid and centrifuged at 10,000 g for 5 min. In addition, 200 µl of the supernatant was added to 1,750 µl of 0.1 M potassium phosphate buffer (pH 8) and 50 µl of 5,5 dithiobis-2-nitrobenzoic acid (DTNB) reagent in a tube and mixed thoroughly. The produced yellow colour was measured at 412 nm in a spectrophotometer.
Assay of erythrocytes lipid peroxidation
MDA in the erythrocytes was determined according to the method of Buege and Aust. 34 Briefly, 0.4 ml sample was mixed with 1.6 ml of TRIS-KCl buffer, followed by addition of 0.5 ml of 30% TCA, and 0.5 ml of 0.75% TBA. The mixture was incubated at 100°C for 15 min, and cooled immediately. The mixture was centrifuged and the absorbance of the supernatant measured spectrophotometrically at 532 nm. The lipid peroxidation was calculated using the molar extinction coefficient of malondialdehyde (MDA) (1.56 × 10⁵ M−1cm−1).
Statistical analysis
All the values were expressed as the mean + SD of five animals per group. Data were analyzed using one-way analysis of variance (ANOVA) followed by the post hoc Duncan multiple range test for the analysis of biochemical data using SPSS (13.0). Values were considered statistically significant at p < 0.05.
Results
The result of the effect of artemether and lumefantrine on renal function biomarkers is presented in Table 1. Drug administration in all the groups resulted in significant (p < 0.05) elevations in the levels of sodium and chloride ions as well as creatinine, with the effect most pronounced in the lumefantrine group. Potassium and bicarbonate ions were significantly (p < 0.05) elevated in the lumefantrine group, while the urea level was only significantly (p < 0.05) elevated in the artemether group.
Effects of coadministration of artemether and lumefantrine on renal function biomarkers in female Wistar rats.a

a Values are expressed as mean ± SD of 5 determinations. Na: sodium; K: potassium; HCO3: bicarbonate;Cl: chlorine.
b Significantly different from control at p < 0.05.
c Significantly different from artemether group at p < 0.05.
In Table 2, the effects of coadministration of artemether and lumefantrine on glucose level and liver function biomarkers are depicted. Albumin and ALT were raised (p < 0.05) in all the groups. AST increased in all the treated groups compared with the control but that of the artemether group was not significant. Glucose level significantly decreased at the artemether and the artemether–lumefantrine groups but increased significantly at the lumefantrine group (p < 0.05). Protein levels were elevated in all the treated groups compared to the control group; however, the effect on the artemether–lumefantrine group was not significant.
Effects of coadministration of artemether and lumefantrine on glucose and liver function biomarkers in female Wistar rats.a
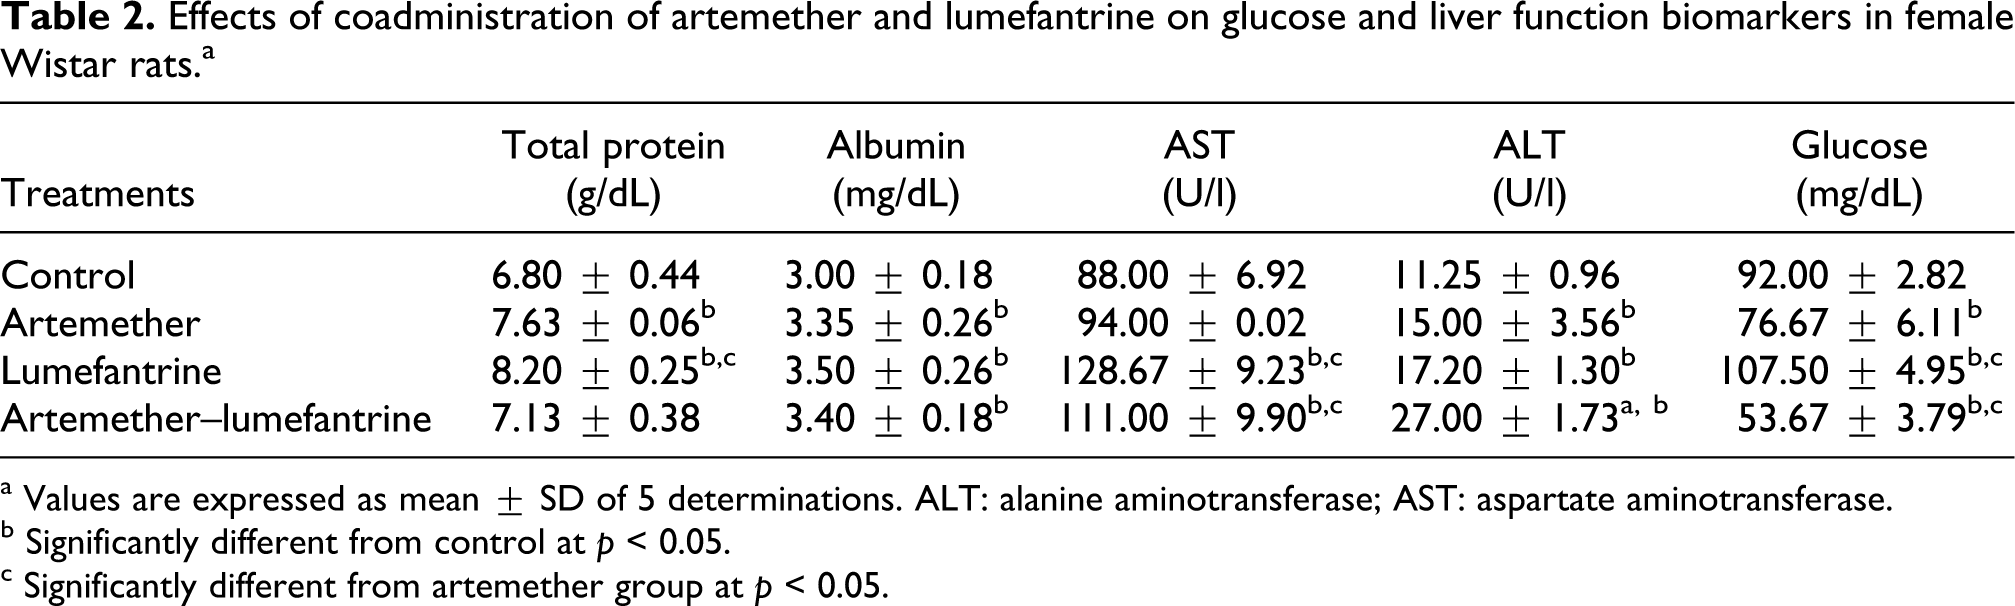
a Values are expressed as mean ± SD of 5 determinations. ALT: alanine aminotransferase; AST: aspartate aminotransferase.
b Significantly different from control at p < 0.05.
c Significantly different from artemether group at p < 0.05.
The results of the effects of coadministration of artemether and lumefantrine on lipid profile levels of female Wistar rat are shown in Table 3. It was observed that the drugs resulted in significant (p < 0.05) elevation of triacylglycerol, and very-low-density lipoprotein (VLDL) levels. LDL increased in all the groups but only the lumefantrine group was significant. HDL level was significantly reduced in the artemether–lumefantrine group and total cholesterol was significantly elevated only in the lumefantrine group. The changes in the lipid profile levels were most pronounced in the lumefantrine group compared to the other groups.
Effects of coadministration of artemether and lumefantrine on lipid profile levels in female Wistar rats.a

a Values are expressed as mean ± SD of 5 determinations. HDL: high-density lipoprotein; LDL: low-density lipoprotein; VLDL: very-low-density lipoprotein.
b Significantly different from control at p < 0.05.
c Significantly different from artemether group at p < 0.05.
In Table 4, the results of the effects of the coadministration of artemether and lumefantrine on atherogenic index in female Wistar rats are depicted. While artemether had no effect on atherogenic index compared to control, lumefantrine significantly (p < 0.05) raised the total cholesterol/HDL-cholesterol and LDL-cholesterol/HDL-cholesterol ratios compared to control. The artemether and lumefantrine coadministration however, significantly raised (p < 0.05) total cholesterol/HDL-cholesterol and insignificantly increased LDL-cholesterol/HDL-cholesterol ratios compared to the control.
Effect of coadministration of artemether and lumefantrine on atherogenic index in female Wistar rats.a
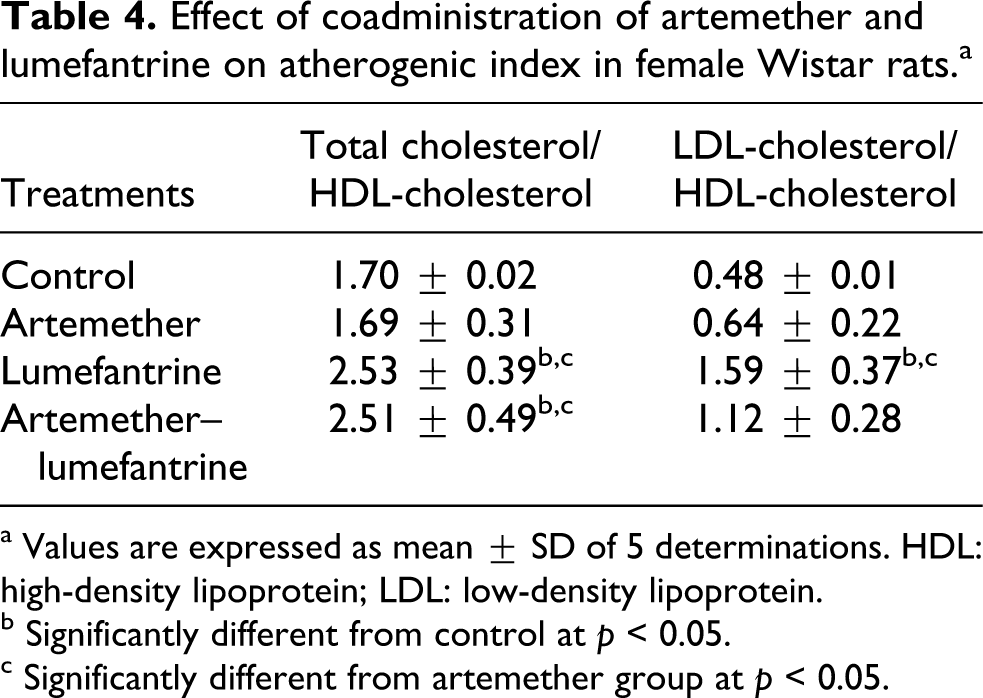
a Values are expressed as mean ± SD of 5 determinations. HDL: high-density lipoprotein; LDL: low-density lipoprotein.
b
c Significantly different from artemether group at p < 0.05.
The results of the effects of coadministration of artemether and lumefantrine on the antioxidant indices are shown in Figures 1 to 6. Glucose-6-phosphate dehydrogenase activity reduced in all the treated groups but significant (p < 0.05) reduction was observed in the artemether group (Figure 1). Lumefantrine resulted in significant (p < 0.05) reduction in the level of reduced glutathione compared to the control. Artemether and artemether–lumefantrine groups also caused reduction but the reductions were not significant compared to the control group (Figure 2). The levels of glutathione peroxidase and glutathione-s-transferase activities were significantly (p < 0.05) elevated in all the treated groups compared to the control groups as shown in Figures 3 and 4, respectively. In Figure 5, artemether and lumefantrine groups significantly reduced (p < 0.05) the catalase activity compared to the control group. Coadministration of artemether and lumefantrine also caused reduction in catalase activity but the reduction was not significant compared to the control group. Superoxide dismutase activity was elevated (p < 0.05) in the artemether and the artemether–lumefantrine groups compared to the control group. Because lumefantrine reduced SOD activity, the elevation observed in the artemether–lumefantrine group was not as pronounced as that of the artemether group (Figure 6).

Effect of coadministration of artemether and lumefantrine on erythrocytes G6PD activity in female Wistar rats. Values are expressed as mean ± SD of 5 determinations. aSignificantly different from control at p < 0.05;

Effect of coadministration of artemether and lumefantrine on erythrocytes reduced GSH levels in female Wistar rats. Values are expressed as mean ± SD of 5 determinations. aSignificantly different from control at p < 0.05; bSignificantly different from Artemether group at p < 0.05. GSH: glutathione.

Effect of coadministration of artemether and lumefantrine on erythrocytes GPX activity in female Wistar rats. Values are expressed as mean ± SD of 5 determinations. aSignificantly different from control at p < 0.05; bSignificantly different from artemether group at p < 0.05. GPX: glutathione peroxidase.

Effect of coadministration of artemether and lumefantrine on erythrocytes GST activity in female Wistar rats. Values are expressed as mean ± SD of 5 determinations. aSignificantly different from control at p < 0.05; bSignificantly different from artemether group at p < 0.05. GST: glutathione-s-transferase.

Effect of coadministration of artemether and lumefantrine on erythrocytes catalase activity in female Wistar rats. Values are expressed as mean ± SD of 5 determinations. aSignificantly different from control at p < 0.05; bSignificantly different from artemether group at p < 0.05.

Effect of coadministration of artemether and lumefantrine on erythrocytes SOD activity in female Wistar rats. Values are expressed as Mean ± SD of 5 determinations. aSignificantly different from control at p < 0.05; bSignificantly different from Artemether group at p < 0.05. SOD: superoxide dismutase.
The effect of coadministration of artemether and lumefantrine on the lipid peroxidation product (MDA) is shown in Figure 7. All the drugs resulted in lipid peroxidation of the erythrocytes as indicated by the significant (p < 0.05) elevation of MDA levels compared to the control group.

Effect of coadministration of artemether and lumefantrine on erythrocytes lipid peroxidation product (MDA) in female Wistar rats. Values are expressed as mean ± SD of 5 determinations. aSignificantly different from control at p < 0.05; bsignificantly different from artemether group at p < 0.05. MDA: malondialdehyde.
Discussion
In this study, we evaluated the effect of therapeutic doses of coadministration of artemether and lumefantrine on the plasma biochemical indices, and erythrocytes antioxidant defence status in female Wistar rats for 3 days. Plasma biochemical indices used in this study serve as the essential diagnostic markers of toxicity resulting from drug administration. In addition, erythrocyte antioxidant and lipid peroxidation indices were also evaluated following drug administration.
Our results showed that coadministration of artemether and lumefantrine altered the renal and liver function markers, lipid profile levels and atherogenic index. Creatinine is a sensitive biochemical index for assessing renal functions. 35 The observed increase in the levels of creatinine in all the treated groups therefore, implies renal function impairment. 36 It is a well known fact that ALT, AST, and albumin are usually considered as liver function markers. Their levels are generally elevated in acute or mild hepatocellular injury. 37 The fact that these liver function markers were elevated in all the treated groups implies that the drugs could predispose users to some degrees of liver damage. The elevated aminotransferases observed in this study is in agreement with Adaramoye et al. 38 where acute administration of artemether and artemether–lumefantrine were carried out in male rats. In addition, other antimalarials, such as chloroquine, 39 amodiaquine, 40,41 and quinine, 42 have been reported to induce hepatic damage due to elevated levels of the aminotransferases.
Furthermore, the drugs may also predispose users to atherosclerosis. Lipids are primarily associated with coronary heart disease (CHD). Elevated LDL-cholesterol is a risk factor in atherosclerotic diseases. Several studies have revealed that, when LDL-cholesterol concentration is high, the incidence and prevalence of CHD are also high. 43 The atherosclerotic risk factor observed in artemether–lumefantrine group may be due to the lumefantrine component. This is because the effect was most pronounced in this group. In addition, LDL-cholesterol/HDL-cholesterol and total cholesterol/HDL-cholesterol ratios are used for the calculation of atherogenic index. 44 The higher the values of these ratios in an individual, the more the person is at risk of atherosclerosis. The increase in atherogenic index caused by the coadministration of artemether and lumefantrine therefore still suggests that it may predispose patients to cardiovascular diseases. This finding supports the earlier report of Adebayo et al. 44 who indicated that coadministration of artesunate and amodiaquine may increase the risk of CHD. In addition, artemether administered as a monotherapy may not predispose users to CHD because the atherogenic index was normal in comparison with the control group. This finding is in contrast to another ACT, artesunate–amodiaquine, reported by Adebayo et al. 44 where artesunate as a monotherapy increased the atherogenic index.
The increased lipid peroxidation observed when artemether and lumefantrine were used as monotherapies and after coadministration suggests increased oxidative stress in the erythrocytes. This was responsible for the depletion of G6PD, GSH and catalase observed in the study. Glucose-6-phosphate dehydrogenase is an enzyme in the pentose phosphate pathway (PPP) responsible for the protection of erythrocytes from oxidative damage by producing reduced NADPH and GSH. Since erythrocytes lack nucleus, mitochondria and other organelles, PPP is the only biochemical pathway responsible for generating reducing capacity. 45,46 This explains the reason for the depletion of reduced glutathione levels in all the treated groups. Glutathione metabolism involves oxidation to disulfide and subsequent recycling to the reduced form by the co-enzyme NADPH mediated by glutathione reductase. The reduced glutathione is important in the detoxification of free radicals. Indeed, GSH is involved in the cellular transformations by binding with the products of lipid peroxidation and other toxic endogenous substances. In normal erythrocytes, NADPH is regenerated by G6PD during oxidative stress. The impairment of this step prevents reduced glutathione recycling, thereby exposing the erythrocytes to oxidative damage. Because there are no alternative pathways to G6PD-dependent NADPH production in erythrocytes, the erythrocyte is deprived of the opportunity to replace enzyme that has been lost. Since low levels of G6PD has been linked with the accumulation of hydrogen peroxides, 47 it is expected that catalase level will be reduced as observed in this study. Catalase (hydrogen peroxide oxidoreductase, EC 1.11.1.6) is a soluble protein found in the erythrocytes and it protects haemoglobin from peroxidation. Catalase is also important in eliminating the potentially dangerous H2O2formation in erythrocytes. 48 Reduction in catalase activity, therefore, further confirms the oxidative stress reported in this study.
In an attempt by the antioxidant capacity of the erythrocytes to combat the oxidative stress induced by these drugs or their metabolites, GPX and GST were upregulated by adaptive response. It is possible that during prolonged prophylaxis, the oxidative stress will eventually result in the depletion of GPX and GST as well. The observed upregulation of SOD when artemether was used as a monotherapy and in combination with lumefantrine further implies an attempt by the erythrocyte antioxidant capacity to counter the induced stress by these drugs and or their metabolites on the erythrocytes. Our result is in consonance with the study by Adaramoye et al. 8 where artemether as a montherapy and in combination with lumefantrine (Coartem) carried out under acute treatment conditions and resulted in the elevation of lipid peroxidation product and eventually induced oxidative stress in the liver and kidney.
Overall, our results suggest that coadministration of artemether and lumefantrine administered as monotherapies or in combination generates metabolites that may alter the expression and activities of the antioxidant enzymes of the erythrocytes in the process of their biotransformation, thereby resulting in erythrocytes oxidative stress. The drugs also altered plasma biochemical indices in female Wistar rats. Further studies may be required to determine whether the oxidative stress induced on the erythrocytes, as well as the liver and renal function impairments observed can be reversed after withdrawal of the drugs. But the present challenge remains that in malarial endemic regions, these drugs are usually on prolonged usage. We advise, therefore, that the drugs should be taken with caution by users with high risk of G6PD deficiency, renal and hepatocellular dysfunctions, and atherosclerotic conditions. In addition, over-the-counter dispensing of the drugs without prescription should be discouraged.
Footnotes
Acknowledgements
The authors are grateful to Emzo Pharmaceuticals, Lagos State Nigeria, for providing the pure samples of artemether and lumefantrine drugs used in this study.
Conflict of interest
The authors declared no conflicts of interest.
Funding
This research received no specific grant from any funding agency in the public, commercial, or not-for-profit sectors.