
Abstract
A new, rapid, and simple method for the determination of cadmium in water samples was developed using ionic liquid-based dispersive liquid–liquid microextraction (IL-DLLME) coupled to flame atomic absorption spectrometry (FAAS). In the proposed approach, 2-(5-boromo-2-pyridylazo)-5-(diethyamino) phenol was used as a chelating agent and 1-hexyl-3-methylimidazolium bis(trifluoro methylsulfonyl)imide and acetone were selected as extraction and dispersive solvents, respectively. Sample pH, concentration of chelating agent, amount of ionic liquid (extraction solvent), disperser solvent volume, extraction time, salt effect, and centrifugation speed were selected as interested variables in IL-DLLME process. The significant variables affecting the extraction efficiency were determined using a Placket–Burman design. Thereafter, the significant variables were optimized using a Box–Behnken design and the quadratic model between the dependent and the independent variables was built. The optimum experimental conditions obtained from this statistical evaluation included: pH: 6.7; concentration of chelating agent: 1.1 × 10− 3 mol L−1; and ionic liquid: 50.0 mg. Under the optimum conditions, the preconcentration factor obtained was 100. Calibration graph was linear in the range of 0.2–60 µg L−1 with correlation coefficient of 0.9992. The limit of detection was 0.06 µg L− 1, which is lower than other reported approaches applied to the determination of cadmium using FAAS. The relative SD (n = 8) was 2.4%. The proposed method was successfully applied to the determination of trace amounts of cadmium in the real water samples with satisfactory results.
Keywords
Introduction
In the recent years, pollution of the environment by toxic metals has received considerable attention. Cadmium is now known as an extremely toxic element and accumulates in humans mainly in the kidneys for a relatively long time, that is, approximately 20–30 years. Prolonged intake, even of very small amounts, leads to severe dysfunction of the kidneys. At high doses, it is also known to produce health effects on the respiratory system and has been associated with a bone disease. The possible role of cadmium in the development of pancreatic cancer has also been reported.1,2 The determination of cadmium in various matrixes has been performed by different techniques such as flame atomic absorption spectrometry (FAAS), 3 atomic fluorescence spectrometry, 4 and inductively coupled plasma mass spectrometry. 5 However, due to the extremely low concentration and the complexity of the environmental samples, an efficient separation and preconcentration step is usually required prior to determination.
Liquid–liquid extraction and solid-phase extraction are among oldest of the preconcentration and separation techniques of metal ions, but are limited due to the time consuming and need of a large amount of organic solvents, which are dangerous for the human health and the environment. In the past decade, development of efficient, economical and miniaturized sample preparation method has become the trend in analytical chemistry. As a result, the techniques such as solid-phase microextraction (SPME) 6 and liquid-phase microextraction (LPME) 7 have been developed. SPME is a solvent-free process that includes simultaneous extraction and preconcentration of analytes. However, SPME has serious disadvantages such as being expensive, its fiber is fragile, has limited lifetime, also has long-time sorbent conditioning, and suffers from sample carry-over. The LPME technique is able to overcome most of the problems that are encountered in SPME. From the introduction of the first article on LPME in 1996, up to now, different approaches of LPME including single-drop microextraction (SDME), 8 hollow fiber LPME, 9 solidified floating organic-drop microextraction, 10 and dispersive liquid–liquid microextraction (DLLME) 11 have been developed.
DLLME, one of the most recently developed LPME techniques, is based on a ternary component solvent system. In this method, an appropriate mixture of an extraction solvent and a disperser solvent with high miscibility in both aqueous phase and extractant is rapidly injected into the sample (aqueous phase) using a microsyringe. As a result, a cloudy solution is formed. The analyte in the sample is extracted into the fine droplets of the extraction solvent. After centrifuging the cloudy solution, the sedimented phase at the bottom of a conical tube is removed manually by a syringe and is analyzed by chromatography or spectrometry methods. This technique has the advantages of simplicity, rapidity, low sample volume, low cost, high recovery, and a high enrichment factor. DLLME has been applied for the determination of trace metals 12 and organic contaminants in liquid samples, including organochlorine pesticides, 13 phthalate esters, 14 organophosphorus pesticides, 15 chlorobenzenes, 16 aromatic amines 17 in water samples, and sulfonylurea herbicides in soil. 18 Even though DLLME has those benefits that were mentioned, it still has some drawbacks such as using toxic solvents (like chlorinated hydrocarbons) as extraction solvents. Room temperature ionic liquids (ILs) are sustainable green solvents in the sample preparation because of their unique physicochemical properties such as negligible vapor pressure, good thermal stability, tunable viscosity and miscibility with water and organic solvents, and nonflammability which depend on the nature and size of their cationic and anionic constituents. 19 ILs are used in synthesis, separation, and electrochemistry. Several methods have been developed using ILs as extraction solvents, such as IL-based headspace LPME, 20 IL-based SDME, 21 cold-induced aggregation microextraction, 22 and temperature-controlled IL-dispersive LPME. 23 Use of ILs in these methods led to low consumption of volatile organic solvents and increasing enrichment factors. IL-based DLLME (IL-DLLME) has been used for preconcentration and determination of trace metals, 24 heterocyclic insecticides, 25 polycyclic aromatic hydrocarbons, 26 aromatic amines, 27 and pesticides in fruits. 28
To optimize the parameters that affect the performance of the DLLME technique, the traditional one-factor-at-a-time (univariate) approach has consistently been used. In this method, every single parameter is varied while all other parameters are kept fixed at a specific set of conditions. Univariate approach requires greater amounts of reagent and time. In addition, possible interactions among variables are ignored, so the true optimum conditions will not be achieved. Chemometric methods such as response surface methodology (RSM) based on experimental designs have resolved these problems. Among the experimental design methodologies, Plackett–Burman employs a design that allows testing the largest number of effective factors with the least number of observations. Also Box–Behnken design (BBD), as a response surface, is useful in modeling and optimizing the effective parameters on DLLME technique.
In the present work, DLLME was carried out using IL as extraction solvent instead of highly toxic, chlorinated solvents for preconcentration and extraction of cadmium from water samples. FAAS was selected as an analytical tool to determine the extracted cadmium due to its low cost, operational facility, and high sample throughput. The experimental variables including sample pH, concentration of chelating agent, amount of extraction solvent, disperser solvent volume, extraction time, salt effect, and centrifugation speed were studied using a Plackett–Burman design for screening and a BBD for optimizing of the significant factors.
Experimental
Apparatus
The experiments were performed using a PG-Instrument atomic absorption spectrometer (PG-990) equipped with a deuterium lamp as a background correction system and cadmium hollow-cathode lamp as the radiation source at a wavelength of 228 nm. All measurements were carried out in an air/acetylene flame. The instrumental parameters were adjusted according to the manufacturer’s recommendations. The pH values were measured with a PHS-3BW (BELL Company, Italy) pH meter supplied with a glass combined electrode. An EBA 20 Centrifuge (Hettich, Germany) was used for phase separation.
Reagents and solutions
All reagents were of analytical grade and all solutions were prepared with double-distilled water. 1-Hexyl-3-methylimidazolium bis(trifluoro methylsulfonyl)imide ([Hmim][Tf2N]), was purchased from IoLiTec Company (Heilbronn, Germany). The chelating agent, 2-(5-boromo-2-pyridylazo)-5-(diethyamino) phenol (5-Br-PADAP) was prepared from ACROS Organics Company (Antwerpen, Belgium). The other materials and salts used were obtained from Merck (Darmstadt, Germany). A stock solution of cadmium at a concentration of 1000 mg L−1 was prepared by dissolving appropriate amount of Cd(NO3)2·4 H2O in double-distilled water. The working standard solutions were obtained by appropriate stepwise dilution of the stock standard solutions. The chelating agent was prepared by dissolving an appropriate amount of 5-Br-PADAP in ethanol.
All glass vessels used for the trace analysis were kept in 10% nitric acid solution for at least 24 h and subsequently washed with distilled water.
Procedure
The 10.0-mL of sample solution containing Cd2+ (20.0 µg L−1) and 5-Br-PADAP (1.1 × 10⁻² mol L−1) was added to a 12-mL conical-bottomed glass test tube. The pH of solution was adjusted to pH 6.7 via addition of dilute HCl and NaOH to acetate solution. Then, binary solution containing 325 µL of acetone as a disperser solvent and 50 mg of [Hmim][Tf2N] as an extraction solvent was rapidly injected into the sample solution using a 500-µL syringe (gastight, Hamilton, USA), forming a cloudy solution (water/acetone/IL). The cadmium–5-Br-PADAP complex was extracted into the fine droplets of IL. The mixture was then centrifuged for 5 min in 5000 r min−1. Following this process, the fine droplets of IL were joined together and settled at the bottom of the conical test tube. After the removal of whole aqueous solution, the sedimented phase (IL-phase) was dissolved in 100 µL of ethanol and injected to the flame atomic absorption spectrometer and the cadmium content was determined.
Experimental designs strategy
Experimental designs strategy was applied in two stages: (i) screening the significant factors affecting the extraction recovery using Plackett–Burman design and (ii) optimizing the significant factors using a Box–Behnken RSM. The results were analyzed using MINITAB 15 for windows.
Results and discussion
In order to reach optimum experimental conditions for quantitative extraction of cadmium ions via IL-DLLME, the influence of different parameters affecting the extraction efficiency such as pH, amounts of IL and disperser solvent, concentration of chelating agent, centrifugation speed, extraction time, and concentration of salt were investigated.
Selection of extraction solvent (IL)
ILs are composed of unsymmetrically substituted nitrogen containing cations (e.g. imidazole, pyrrolidine, pyridine, etc.) with inorganic anions (e.g. Cl−, BF4 −, PF6 −, (CF3SO2)2N−, etc.). 29 The ILs used in DLLME must meet some requirements such as immiscibility in water, good extraction ability for the analyte, and higher density than water (so that fine particles of IL can settle in saline solutions). In addition, IL must be liquid in experimental conditions. Short alkyl chain imidazolium-based ILs containing Cl−, BF4 − and CF3SO3 − are water-miscible and ILs containing PF6 − and (CF3SO2)2N− are water-immiscible. According to the above criteria, [Hmim][Tf2N] was selected as extraction solvent.
Selection of disperser solvents
The miscibility of disperser solvent in extraction solvent and aqueous phase (sample solution) is the main point for selection of disperser solvent. Therefore, acetone, acetonitrile, methanol, and ethanol were selected as disperser solvent, and the effect of these solvents on the performance of DLLME was investigated. The extraction recoveries were 90.8, 91.5, 98.1, and 100.4 for ethanol, acetonitrile, acetone, and methanol, respectively. Results show that recoveries with acetone and methanol are almost equal, while that of ethanol and acetonitrile are more. Thus, acetone was used as disperser solvent because of its low toxicity.
Screening of significant factors using Plackett–Burman design
An experimental Placket–Burman design was used for the screening of the main variables affecting the extraction recovery. This design is useful because, with few experiments, it is possible to detect the most important factors that affect the process significantly. 30 A Placket–Burman design is a specific type of screening design that assumes that the interactions can be completely ignored, and therefore, the main effects are calculated with a reduced number of experiments. 31 In Placket–Burman design, the number of experiments is a multiple of four (4, 8, 12, etc.) and exceeds the number of factors by one. In he present study, a 27−4 Placket–Burman design was applied to evaluate the main effects of the seven factors (sample pH, concentration of chelating agent, amount of extraction solvent, disperser solvent volume, salt effect, extraction time, and centrifugation speed). For each factor, two levels were considered, which were chosen according to preliminary experiments (Table 1). In total, eight trials were performed in duplicate and the mean of response were listed. To determine main effects, analysis of variance (ANOVA) was used. Regression coefficients and their significances for the response of Placket–Burman design were illustrated in Table 2.
The experimental variables and levels of the Plackett–Burman design

Regression coefficients and their significances for the response of Placket–Burman design

The effect of the studied factors in the screening experiment was shown in Figure 1 in the form of a Pareto chart. The vertical line on the plot judges the effects that are statistically significant. The bars, extending beyond the line, correspond to the effects that are statistically significant at the 95% confidence level. 31
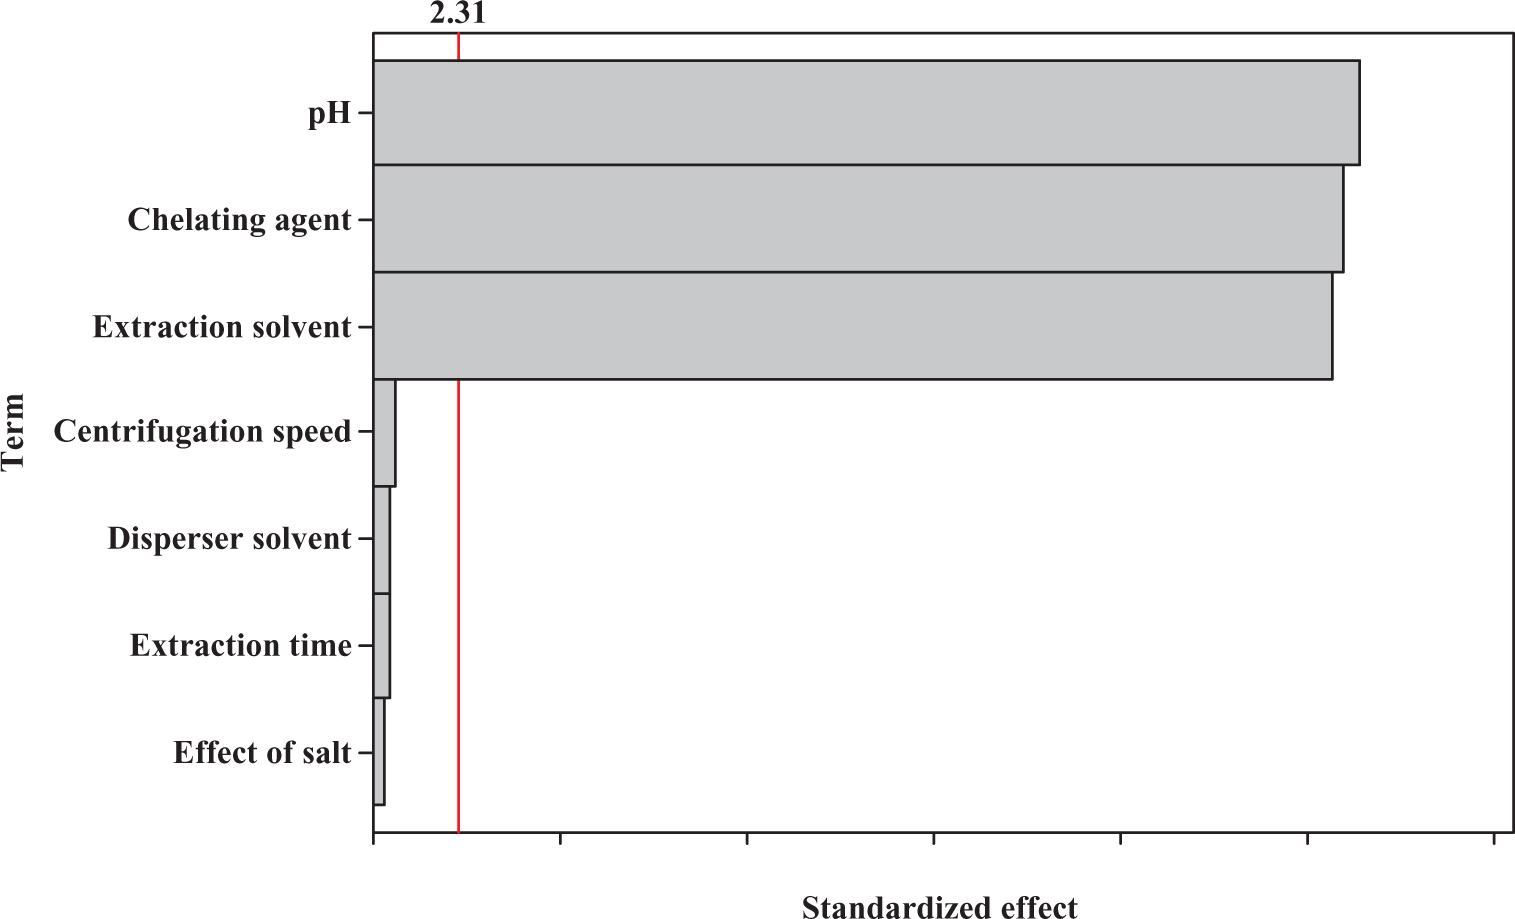
Standardized main effects Pareto chart for the Plackett–Burman design. The vertical line in the chart defines the 95% confidence interval.
According to Figure 1, pH, concentration of chelating agent, and amount of extraction solvent were the most significant variables on the extraction efficiency, while centrifugation speed, extraction time, concentration of salt, and disperser solvent volume had no significant impact on the response and thus were eliminated from further studies (i.e. BBD).
It should be mentioned that the results above portrays that DLLME technique is a time-independent method, which is due to infinitely large surface area between extraction solvent and aqueous phase. Therefore, this method is very fast, and this is the most important advantage of DLLME technique.
According to the obtained results, the factors to be considered in the next optimization step were pH, concentration of chelating agent, and amount of extraction solvent. The nonsignificant factors should be fixed as follows: absence of salt, centrifugation speed (5000 r min−1), and disperser solvent volume (acetone) of 325 µL.
Experimental design
In the next step, a BBD was applied in order to determine the optimal conditions for the three screened significant factors (sample pH, concentration of the chelating agent, and amount of the extraction solvent). The main effects, interaction effects, and quadratic effects were optimized and evaluated in this design. This design is a class of rotatable or nearly second-order designs based on three levels incomplete factorial designs.
32
One of the main advantages of BBD matrix is that it does not contain combinations for which all factors are simultaneously at their highest or lowest levels. So this design is useful to avoid experiments performed under extreme conditions. The number of experiments (N) required for the development of BBD is obtained using equation (1)
where k is the number of factors and C 0 is the number of center points.33–35
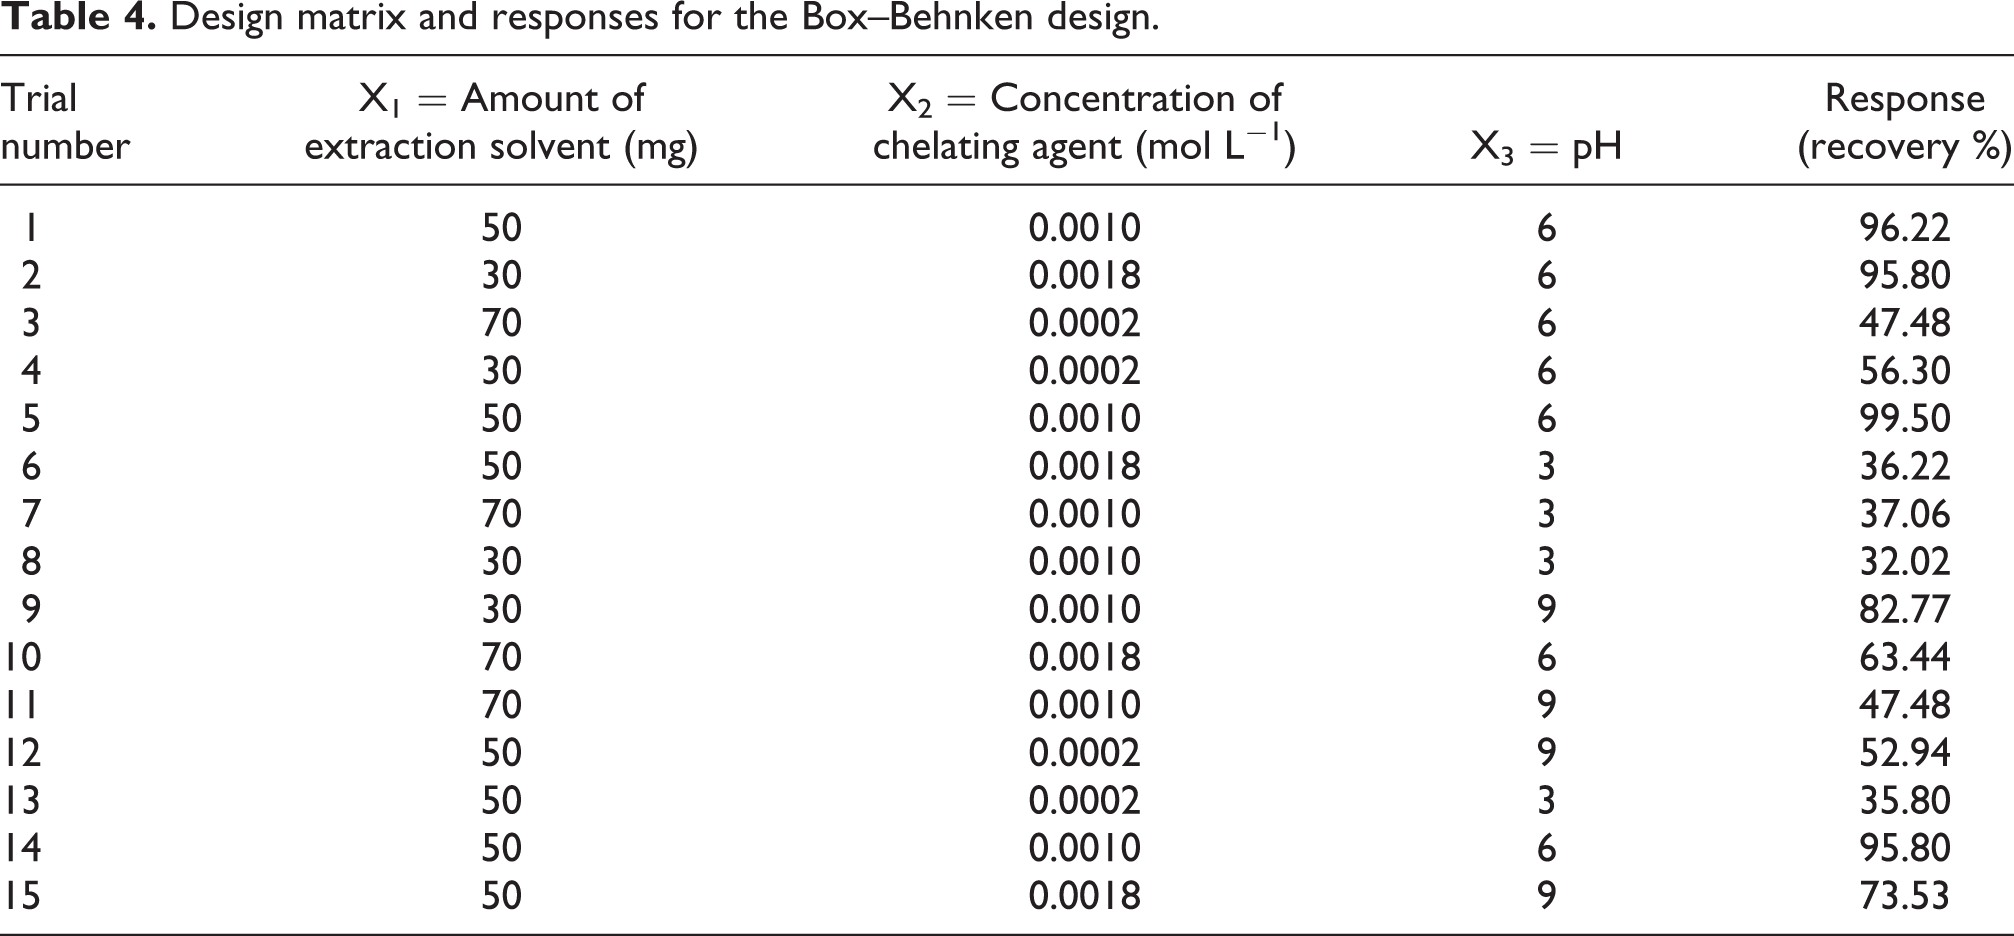
Thus, 15 experiments were required in this design including three center points, and they were performed randomly. The selected levels of factors and the design matrix with the responses were shown in Tables 3 and 4, respectively.
Factors and levels used in the Box–Behnken design

Design matrix and responses for the Box–Behnken design
For statistical calculations, the relationship between the coded values and real values is expressed as follows
where Xi is a coded value of variable, Ai is the real value of variable, A 0 is the real value of Ai at the center point, and ▵Ai is the step change of variable.
ANOVA was used in order to evaluate the method and the significance of the effects (the results were shown in Table 5). The ‘model F value’ of 27.05 implies that the model is significant. There is only a 0.1% chance that this large model F value could occur due to noise, which also confirmed the high significance of model. Also the results showed that p value for lack-of-fit (0.069) was not significant (p > 0.05). Also the coefficient of determination (R 2 , adjusted R 2 ) was used to express the quality of fit of polynomial model equation. R 2 is a measure of the amount of variations around the mean explained by the model and is equal to 0.9800. The adjusted R 2 is equal 0.9439, and it is an adjustment for the number of terms in the model. The large adjusted R 2 values indicate a good relationship between the experimental data and the fitted model.
Analysis of variance for suggested second-order model

DF: degrees of freedoms; Seq SS: sequential sums of squares; Adj SS: adjusted sums of squares; Adj MS: adjusted mean squares.
In the next step of the design, a response surface model was developed by considering only the significant factors and interactions in the BBD design. This model is portrayed in equation (3) consisting of three main effects, three curvature effects, and one two-factor interaction effect. The parameters of the equation were obtained by multiple regression analysis of the experimental data, where R is the predicted response in real value and X
1, X
2, and X
3 are the coded values of amount of the extraction solvent, concentration of the chelating agent, and sample pH, respectively.
Response surface modeling and selection of optimum conditions
The final step was to find the conditions of the variables (amount of the extraction solvent, concentration of the chelating agent, and sample pH) that maximize the response. The three-dimensional response surface plots using equation (3), when one of the variables is fixed at the central point and the other two are allowed to vary, are shown in Figure 2(a) to (c). The curvatures of the plots indicate the interaction between the factors. The existence of interaction means that the factors may affect the response interactively and not independently. So their combined effect is greater or less than that of expected for the straight addition of the effects.
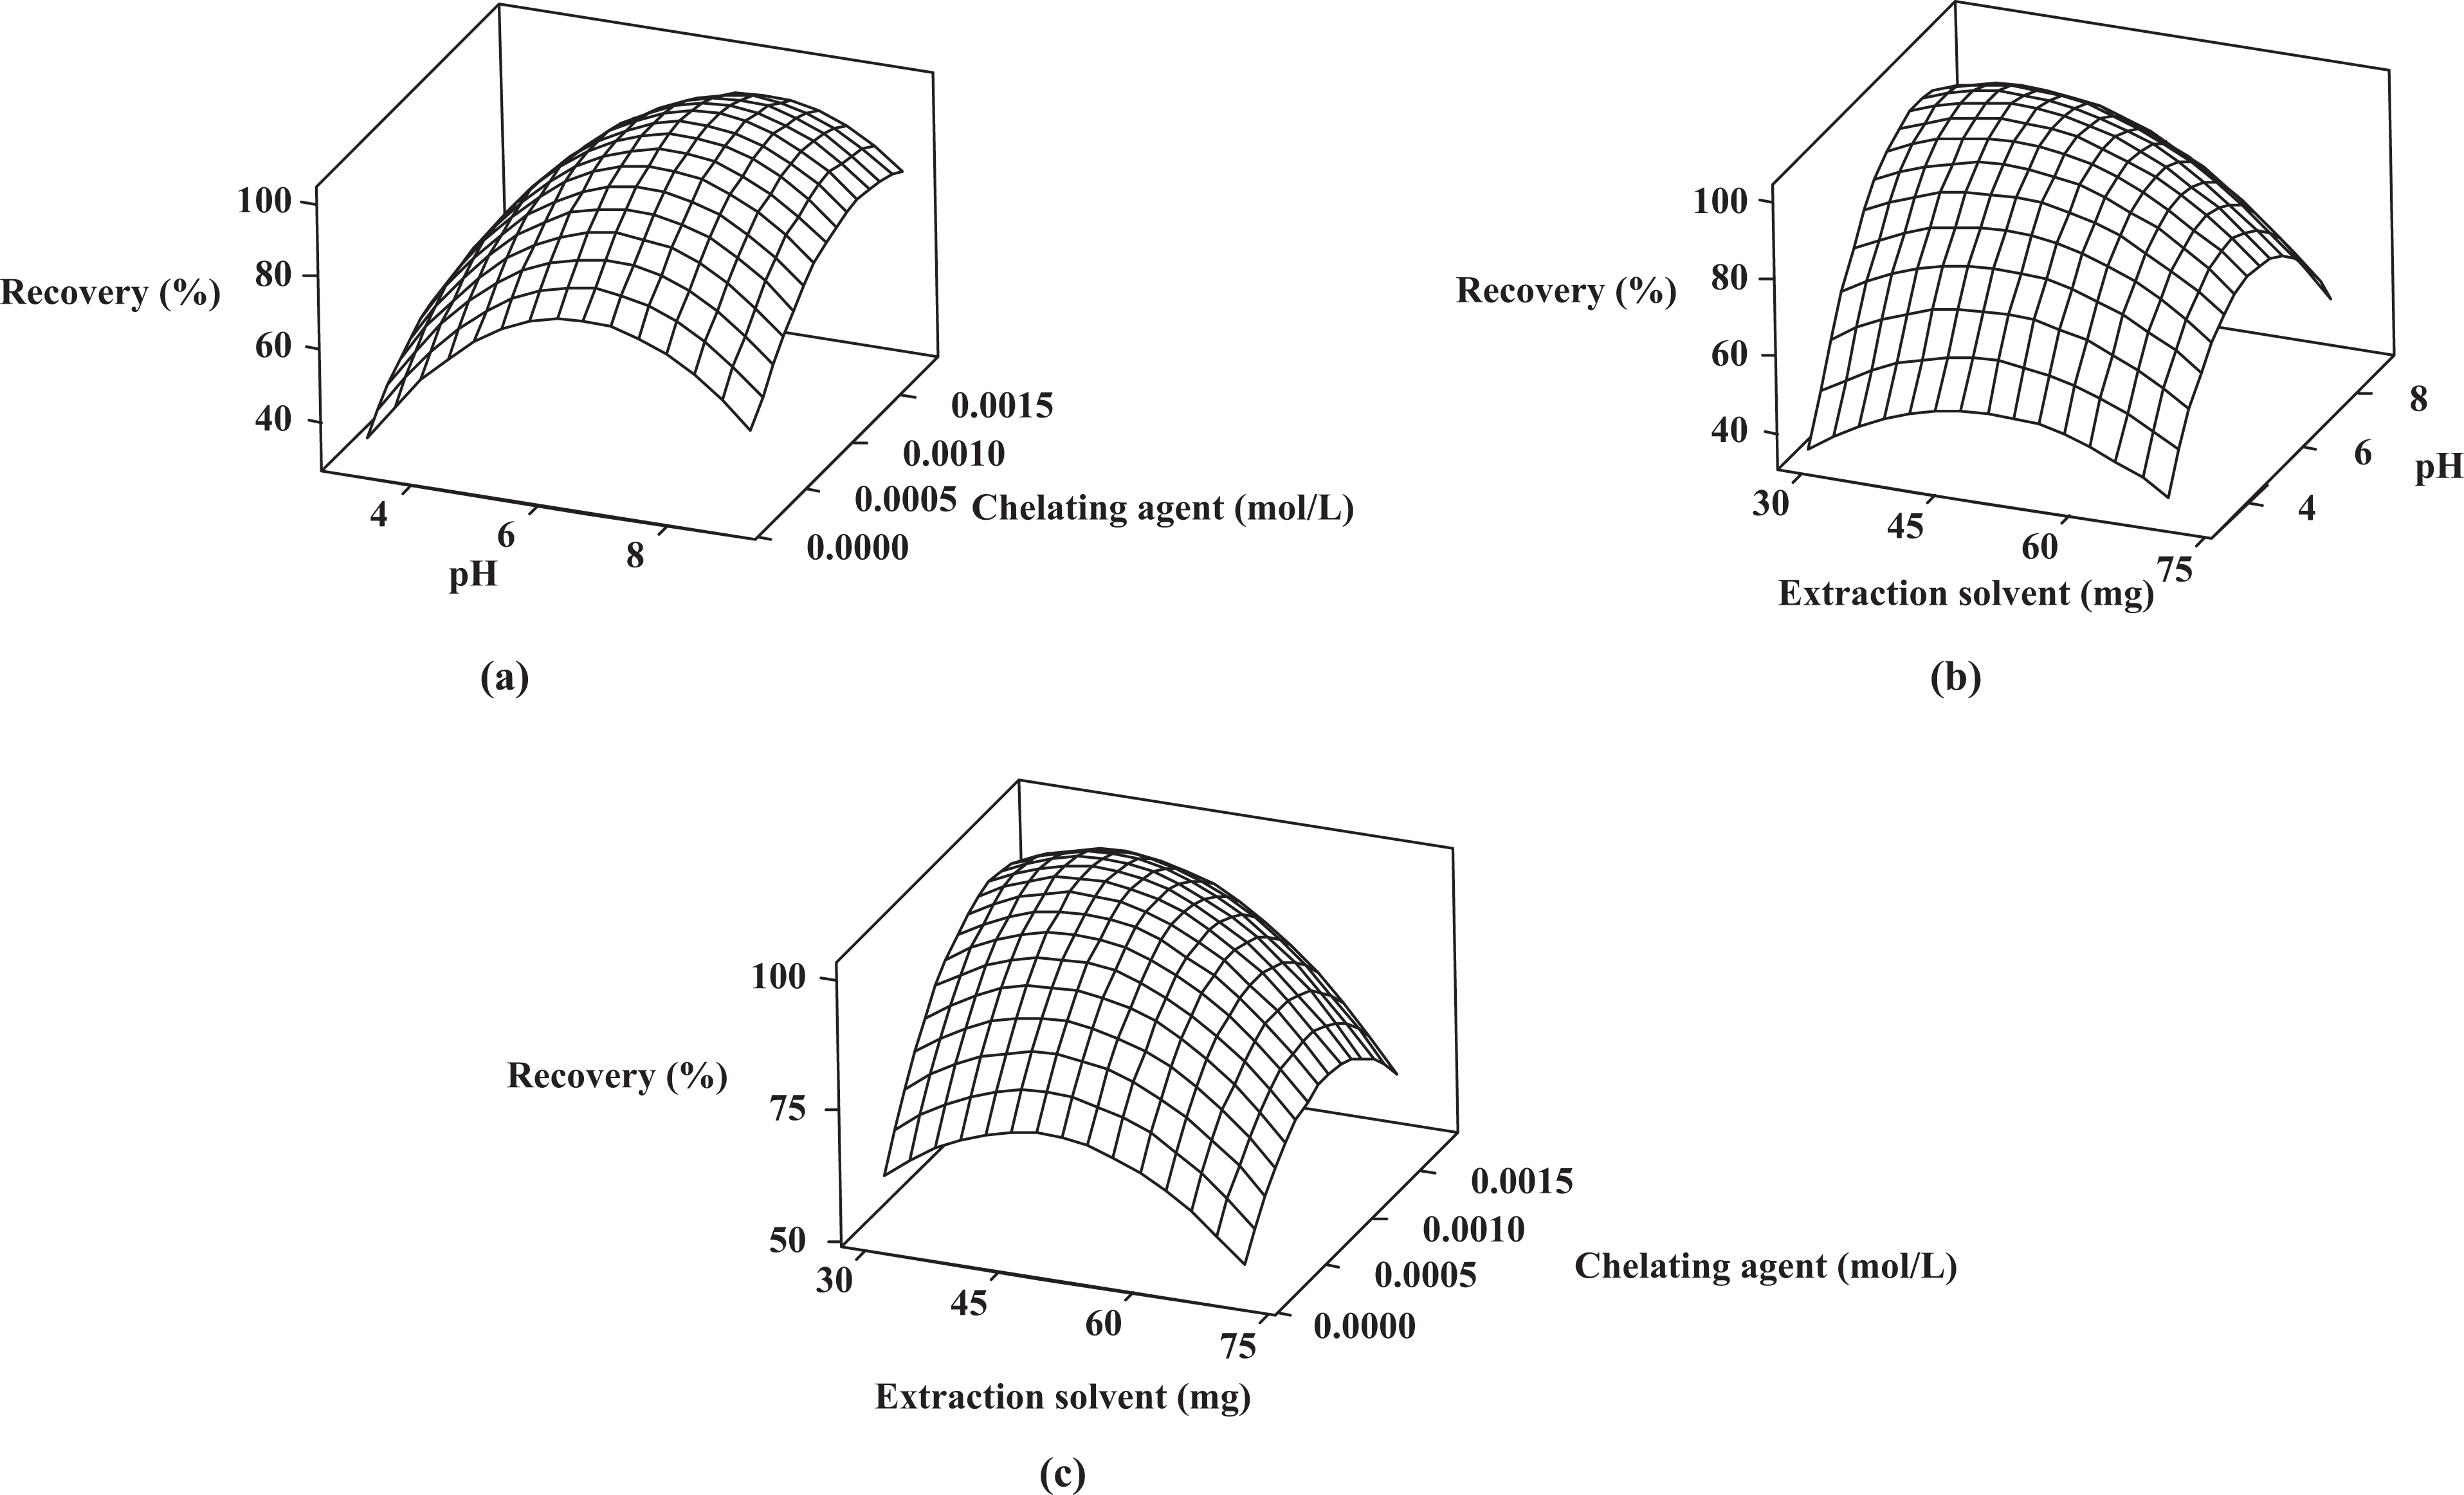
Response surface plots when optimizing the following pair of factors, while the other parameter was kept constant at a central point (zero level): (a) concentration of chelating agent–sample pH (extraction solvent, 50.0 mg); (b) sample pH–amount of extraction solvent (chelating agent 0.0010, mol L− 1 ); (c) concentration of chelating agent–amount of extraction solvent (sample pH, 6).
Figure 2(a) shows the response surface obtained by plotting concentration of chelating agent against pH with the amount of extraction solvent fixed at 50 mg; Figure 2(b) shows the response surface obtained as a function of pH and amount of extraction solvent while keeping the concentration of chelating agent at 0.0010 mol L−1; and finally, Figure 2(c) shows the response surface obtained for concentration of chelating agent and amount of extraction solvent while pH was constant at 6.
Based on the analysis and response surface plots, extraction recovery was increased with increasing the amount of IL, pH, and the concentration of chelating agent. However, at higher amount of IL, higher concentration of chelating agent, and higher pH, extraction recovery was decreased.
A decrease in efficiency at high extraction solvent volumes probably can be attributed to the decrease in the ratio between the dispersive and the extractant solvent that also has been reported by other researchers.36,37 The decreased ratio lowers the number of droplets available for extraction thereby lowering the extraction efficiency.
pH of the aqueous solution is an important factor in the DLLME of cadmium using chelating agent 5-Br-PADAP, because this parameter directly influence the formation of cadmium–ligand complex and the subsequent extraction.
The concentration of chelating agent has a direct effect on the formation of cadmium–ligand complex and its extraction, and therefore, increasing the extraction recovery by increasing the concentration of ligand is well expected. It seems that the reduction in extraction recovery in high concentration of ligand is due to the extraction of ligand itself, which can easily saturate the small volume of the extraction solvent. Also, due to the solubility limitations of the ligand, we had to take a large volume of ligand to achieve its large concentration. Therefore, a larger volume of ethanol (which was used to solve the ligand) was introduced to the system, thereby the solubility of IL increased and extraction recovery decreased.
Finally, according to the results obtained from optimization study, the optimal experimental conditions were: the concentration of chelating agent: 0.0011 mol L−1; pH 6.7; and amount of extraction solvent (IL): 50 mg.
Interferences
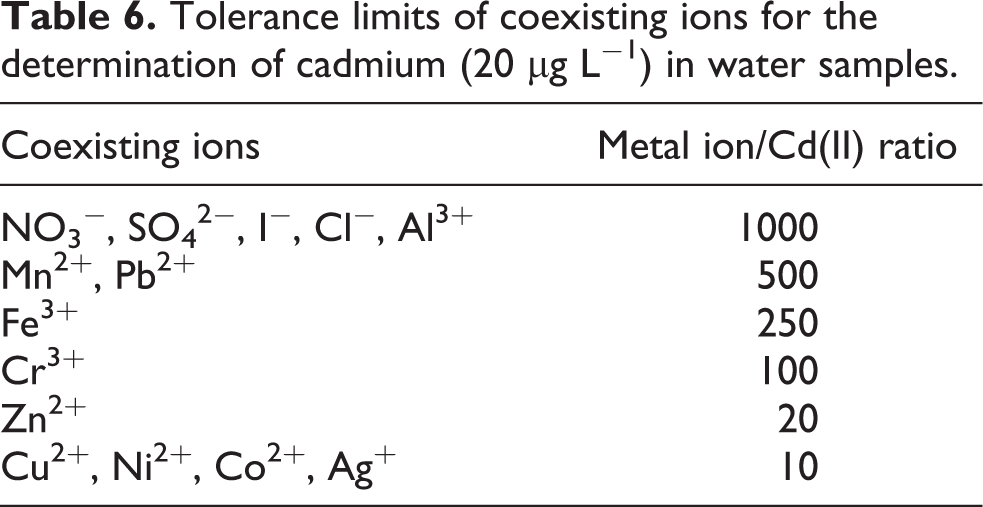
Considering the high selectivity provided by FAAS, the only interference may be attributed to the separation step. Therefore, the interference is due to the competition of other metal ions for the chelating agent and their subsequent coextraction with cadmium. To perform this study, the common coexisting ions in natural water samples in different interference-to-analyte ratios were added to a 10.0-mL solution containing 20.0-µg L−1 of Cd2+ and were subjected to the recommended procedure. Table 6 represents the tolerance limits of the examined metal ions. The tolerance limits of the coexisting ions, defined as the largest amount that caused an error in the absorbance value of no longer than ±5%. As Table 6 portrays, there is no interference from the coexisting ions in the natural water samples for the determination of cadmium.
Tolerance limits of coexisting ions for the determination of cadmium (20 μg L−1) in water samples
Method validation
Analytical figures of merit
The dynamic linear range (DLR), the correlation coefficient (r 2 ), the limit of detection (LOD), the relative SD (RSD), the preconcentration factor (PF), the enhancement factor (EF), and the consumptive index (CI) were determined under the optimal condition and the results were summarized in Table 7.
Analytical characteristics of the proposed method for the determination of Cd (II)

The calibration graph was linear in the range of 0.2–60 μg L−1 of cadmium with a good correlation coefficient (0.9992). The LOD was calculated based on the following equation: LOD = 3S
b/m, where S
b is the SD of the blank signal and m is the slope of calibration graph, which was 0.06 μg L−1. The RSD for eight replicate measurements of cadmium solution at 20 μg L−1 was 2.4%, indicating a good precision of the method. The PF, defined as the ratio between the volume of the initial sample and the final volume obtained after the extraction step, was 100 for 10 mL of the sample solution. The EF was obtained from the slope ratio of calibration curve after and before application of the DLLME technique. Thus, the EF obtained with a sample volume of 10 mL was 35. Additionally, the CI can be defined for practical purposes as follows
where V s is the required volume of sample (in milliliter) to achieve one unit of EF. The CI obtained for the proposed method was 0.29 mL.
Application to real samples
The proposed IL-DLLME method was applied to the determination of cadmium in several water samples (tap, river, and well waters). The results showed that all samples were free from Cd(II). Thus, they were spiked with Cd(II) standards (at 10 and 50 μg L−1 levels) to assess the matrix effects. The relative recoveries of cadmium from water samples are given in Table 8. The percentage recovery (R%) was calculated using the equation:
Determination of Cd(II) in river, well, and tap water
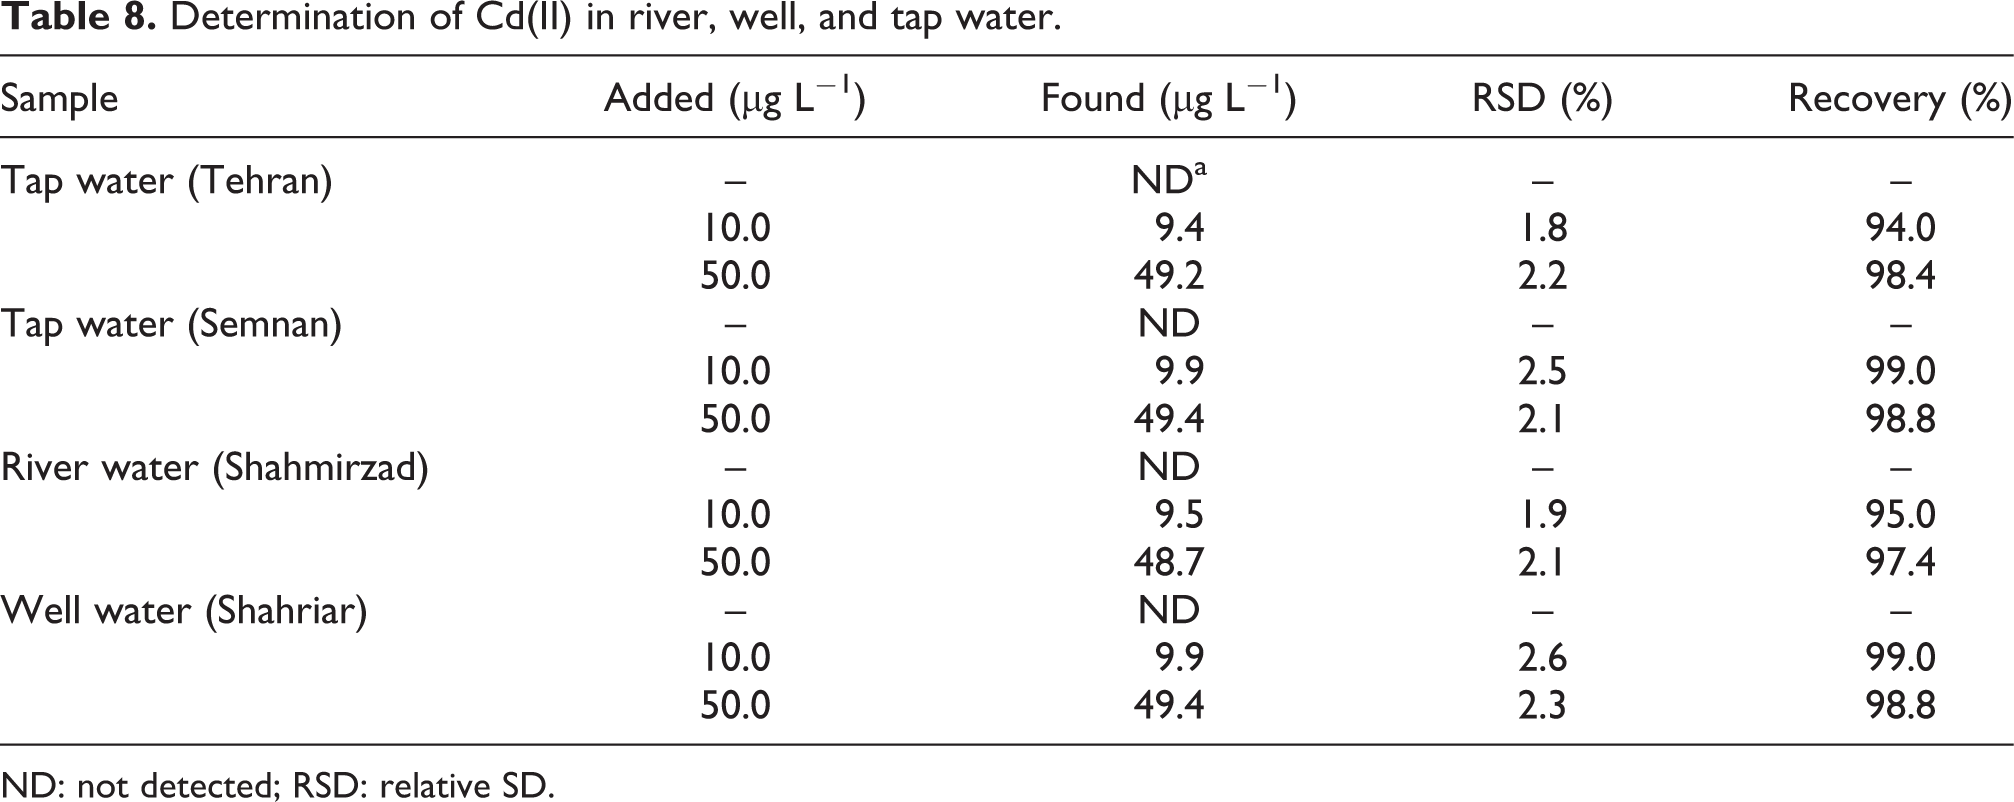
ND: not detected; RSD: relative SD.
Comparison with the other methods
A comparison of the proposed method with other reported preconcentration methods combined with FAAS for Cd(II) is given in Table 9. As it can be seen, the presented method has the best LOD among the others. Also, the present work possesses wider DLR and lower RSD than most reported methods. Meanwhile, the achieved high enrichment factor (100) is comparable with those in reported methods. The higher enrichment factor reported in some references was obtained using a large volume of the sample solution. In comparison with others, IL-DLLME has short extraction time and the extraction will be performed immediately after the addition of mixture of disperser and IL. These characteristics can be of key interest for routine laboratories in trace metal ion analysis.
Comparison of analytical features of the proposed method with other preconcentration methods for Cd(II)

LOD: limit of detection; RSD: relative SD; FAAS: flame atomic absorption spectrometry; IL-DLLME: ionic liquid-based dispersive liquid–liquid microextraction; SPE: solid-phase extraction; IIP: ion imprinted polymer; FL: flow injection; PF: preconcentration factor; EF: enhancement factor; ISFME: In situ solvent formation microextraction; WFE: wetting-film extraction; HFRLM: hollow fiber renewal liquid membrane; USAEME: ultrasound-assisted emulsification-microextraction.
aThe preconcentration factor is defined as the ratio between the volume of the initial sample and the final volume obtained after the extraction step.
bThe enhancement factor is defined as the slope ratio of the calibration graph for Cd(II) with and without preconcentration.
Conclusion
This study describes an IL-DLLME method combined with FAAS for the determination of trace amounts of cadmium(II) in environmental water samples. In this work, an IL was used as the extraction solvent in DLLME that reduces the exposure danger to toxic organic solvents used in the conventional extraction procedures. Moreover, chemometric procedure was used first as a Plackett–Burman screening design to study the main variables that affect the technique and second as a Box–Behnken response surface to find a model for optimizing the response. The proposed method is simple, efficient, rapid, inexpensive, and friendly to the environment due to the use of green organic solvent (as an extraction solvent). It also has a low detection limit, good calibration range, and high PF with a reduced amount of sample in comparison with the other reported methods (Table 9). The performance of this procedure for quantification of trace levels of cadmium in water samples is satisfactory.
Footnotes
Acknowledgment
The authors thank the Semnan University Research Council for their support to this work.