
Abstract
Tuberculosis (TB) is highly endemic in India. The first-line anti-TB therapy (ATT) involving isoniazid (INH), rifampicin and pyrazinamide causes hepatotoxicity in approximately 11.5% of Indian patients. Studies have shown that ATT-induced hepatotoxicity is primarily due to oxidative stress caused by the drugs and metabolites. Herbal drugs with antioxidative properties have been tested in animal studies and clinical trials for the management of hepatotoxicity. The objective of this study was to investigate the role of curcumin (CUR), silymarin (SILY) and N-acetylcysteine (N-ACET) on hepatotoxicity by ATT drugs using an in vitro model of human hepatocellular carcinoma cell line (HepG2). HepG2 cells were treated with ATT drugs alone or along with CUR, SILY or N-ACET for a 48-h duration. The cells were monitored for viability, morphology, respiring mitochondria and cell cycle. Our results suggest that the presence of hepatoprotective drugs during treatment of HepG2 cells with ATT drugs lowers the hepatotoxic effect of the latter. This is observed in terms of (a) increased cell viability, (b) healthy-looking cell morphology as revealed by phase contrast microscopy, (c) active respiring cells as observed with confocal microscopy upon staining with a mitochondrial membrane-specific dye, MitoTracker® Red, and reduction in the sub-G1 peak in cell cycle analysis by flow cytometry. Our results suggest that these hepatoprotective drugs need to be further explored as potential adjuvant therapy along with ATT drugs.
Keywords
Introduction
Tuberculosis (TB) is a leading cause of death among infectious diseases and is a significant socioeconomic burden in India. 1 Currently, a combination therapy, consisting of isoniazid (INH), rifampicin (RIF) and pyrazinamide (PYZ), is commonly used as the first-line treatment against TB. Adverse drug reactions have become a major health concern with the long-term anti-TB drug treatment especially when used in combination. 2 It is well known that drug-induced hepatotoxicity is a potential adverse effect of anti-TB therapy (ATT). 3 It has been reported that there is a higher risk of approximately 11.5% hepatotoxicity in Indian patients as compared to upto 4.3% in their western counterparts. 4,5 This often results in discontinuation of the most effective first-line therapy. Noncompliance not only leads to morbidity and mortality but also results in the emergence of drug-resistant strains.
It has been well established in animal models that INH- and RIF-induced damage is due to oxidative stress, 6 lipid peroxidation 7 reduced glutathione levels 8 and activation of CYP2E1. 9 Many literature reports demonstrate hepatoprotective effects of certain herbal formulations in experimental animal models. 10,11 These herbs and other chemical agents are believed to act by stabilizing membrane, antioxidative effects and inhibition of CYP2E1. 12 To exemplify, curcumin (CUR) has been reported to be highly effective in preventing carbon tetrachloride-induced acute liver damage, where the former lowers the oxidative stress, thereby preventing liver injury. 13 The protective effect of N-acetylcysteine (N-ACET) on RIF-induced hepatotoxicity has been thought to be due to the prevention of lipid peroxidation as well as reduction in superoxide dismutase. 14
The rationale of choosing CUR, silymarin (SILY) and N-ACET as hepatoprotectant models in the current study was the immense therapeutic potential of all above herbal drugs originating from various animal studies. Also these herbal drugs have been used as a dietary supplement for hepatoprotectant in Ayurveda (Indian traditional medicine). CUR is the main curcuminoid or natural phenol of the popular Indian spice turmeric, a member of the ginger family (Zingiberaceae). SILY or milk thistle (commercial name) is an extract from the seeds of Silybum marianum. N-ACET a nutritional supplement is a derivative of cysteine and is used primarily as a mucolytic agent. To our understanding this is the first comprehensive study which has addressed the reversal of hepatotoxicity not only in INH or RIF but also in PYZ and possible drug–drug interactions between INH + PYZ and INH + RIF. Further, to substantiate our stand a recent study by Tostmann et al. 3 indicated PYZ to be hepatotoxic. CUR, SILY and N-ACET have been shown to be safe and no significant adverse reactions are reported in the international adverse reaction database. 15,16
In order to elucidate the hepatoprotective effect of CUR, SILY or N-ACET on individual as well as interactions of INH, RIF and PYZ drugs a human liver model of human hepatocellular carcinoma cell line (HepG2) was evaluated. The current study was designed to establish the reversal of cell damage in HepG2 cells by investigating the cell viability, morphology and mitochondrial membrane permeability of HepG2 cells treated with different combinations of ATT drugs and hepatoprotective drugs namely CUR, SILY or N-ACET.
Materials and methods
Chemicals
INH, RIF and PYZ were kindly donated by Lupin Ltd (India). Dimethyl sulfoxide (DMSO) was obtained from Merck (Darmstadt, Germany). CUR, SILY, N-ACET and MTT (3-(4, 5-dimethylthiazolyl-2-yl) 2, 5-diphenyl tetrazoliumbromide) were obtained from Sigma Aldrich (St. Louis, Missouri, USA). MitoTracker® Red was procured from Molecular Probes (Eugene, Oregon, USA). All other chemicals used were obtained from Sigma Aldrich and were of analytical grade.
HepG2 cell culture
HepG2 cells, passage less than 20, were obtained from National Centre for Cell Science (NCCS) (Pune, India). HepG2 cells were maintained in the logarithmic phase of growth in Dulbecco’s modified Eagle’s medium (Himedia, India) supplemented with 2 mM glutamine (Himedia), 10% fetal bovine serum (PanBiotech, Aidenbach, Germany), 40 U/mL streptomycin (Himedia) and 50 U/mL penicillin (Himedia). The cells were subcultured once they reached 80–90% confluence. For growth and drug treatment experiments, the HepG2 cells were incubated in a CO2 incubator maintained at 37°C and 5% (v/v) CO2, unless mentioned otherwise. For all drug treatment studies, the cells were first grown overnight for adherence, then pretreated with low concentrations, typically 5 mM, of ATT drugs for 24 h followed by treatment with relatively higher concentrations, typically 100–200 mM, of ATT drugs for 24 h, unless mentioned otherwise. The hepatoprotective agents were added during the last 24-h treatment phase at concentrations of 10 µM, unless mentioned otherwise. Cell viability was assessed by trypan blue dye exclusion method using a hemocytometer (Neubaur, Long Island, New York, USA). The cells were harvested with ethylene diamine tetra acetic acid (0.25% ethylenediaminetetraacetic acid/trypsin) (Himedia), washed and used for subsequent cytotoxicity assays.
Cytotoxicity assay (MTT)
MTT assay was performed to study the cytotoxic effect of ATT drugs, hepatoprotective agents or a combination thereof. HepG2 cells were seeded at a density of 0.5 × 10⁴ cells/well in 96-well microtitre culture plates (Nunc Nalgene, Roskilde, Denmark) with 200 µL culture medium in each well and allowed to grow overnight for adherence. Subsequently, the cells were pretreated and treated with different combinations of ATT drugs for 24 h each, and the treatment was with or without hepatoprotective agents. Cytotoxicity was assessed by determining cell viability using MTT assay according to a published protocol. 17 MTT is reduced to an insoluble purple colored formazan derivative in living cells. Addition of DMSO dissolves the insoluble formazan into a colored solution. The absorbance of this colored solution is then quantified spectrophotometrically at 590 nm with an enzyme-linked immunosorbent assay reader, i MARK, Biorad (Hercules, California, USA).
Cell cycle analysis by flow cytometry
Cell cycle analysis was performed per the published protocol. 18 Briefly, HepG2 cells were seeded in 6-well culture plates (2 mL culture volume) at a density of 1 × 10⁶ cells/well and allowed to grow overnight. The cells were pretreated and treated with different concentrations of ATT combination drugs alone or with hepatoprotective agents. Cells were then digested with trypsin, washed with phosphate-buffered saline (PBS; Himedia), fixed with ice-cold 70% ethanol overnight, washed with PBS and treated with 20 µL of 50 mg/mL RNase for 30 min at 37°C. Cells were subsequently incubated with 800 µL of 50 µg/mL propidium iodide (PI) staining solution for 1 h in dark before analysis by flow cytometry, at an excitation wavelength of 488 nm. 19 Cell cycle analysis was performed by FACS Aria (BD Biosciences, San Diego, California, USA) at an excitation wavelength of 488 nm and emission wavelength of 617 nm. After acquisition of 10,000 events, side (orthogonal) scatter signal value was plotted against forward (low angle) scatter signal value. The data were gated to select PI stained whole cells while excluding debris and doublets. The results were analyzed with the FACS Diva software supplied by the manufacturer of FACS Aria.
Phase contrast microscopy
Treated HepG2 cell as described in the section on “Cell cycle analysis by Flow cytometry” were imaged, prior to treatment with trypsin, using phase contrast inverted microscope and a ×10 objective (Olympus IX71, Olympus Corp., Tokyo, Japan).
Confocal microscopy
Mitochondrial membrane permeability transition was assessed by staining with MitoTracker® Red and observing with a confocal microscope as described previously.
20
Briefly, HepG2 cells were seeded in 12-well plates containing poly-
Statistical analysis
All experimentally determined values are reported as mean ± SD from three independent experiments, each performed in triplicate. Comparisons between multiple groups were performed with one-way analysis of variance, or results from two different treatments were tested for statistical significance with the unpaired Student’s t test. p values less than 0.05 were considered statistically significant.
Results
Cell growth inhibition
ATT drugs are known to cause hepatotoxicity in approximately, 11.5% of Indian patients. 4 Our previous study has shown that treatment of HepG2 cells with INH or PYZ, at a concentration of 100 mM each leads to loss of cell viability. Further, a 24-h pretreatment with low and nontoxic concentration of 5 mM each of INH and PYZ followed by treatment with higher concentration of varied combinations of INH and PYZ leads to much higher loss of cell viability. 21 These and other results show that HepG2 cells can be used as an in vitro model for hepatotoxicity 22 and to ascertain the hepatoprotective effects of herbal drugs. Further, the in vitro experiment of pretreatment followed by treatment with drugs has been designed to mimic the long-term effect of in vivo ATT treatment. 23
The first objective was to demonstrate that the herbal drugs are not toxic to the cells at concentrations to be used in this study. To that end, we studied the viability of HepG2 cells in the presence of CUR, SILY or N-ACET at concentrations in the range of 2–50 µM. We find that these drugs are nontoxic at concentrations up to 10 µM (data not shown). The next objective was to investigate whether the presence of these herbal drugs reduces the extent of loss of cell viability caused by ATT treatment. Cells were pretreated with INH or PYZ at a concentration of 5 mM for 24 h followed by treatment with individual or combination ATT drugs at higher concentrations for another 24 h with the treatment being with or without CUR, SILY or N-ACET at a concentration of 10 µM. The presence of CUR, SILY and N-ACET reduced the extent of loss of cell viability for all the ATT treatment combinations (Table 1). However, the presence of SILY and N-ACET showed a significant reversal of cytotoxicity at p < 0.05 when treated with INH alone at a concentration of 200 mM or a combination of INH and PYZ at concentrations of 100 mM each.
Effect of CUR, SILY and N-ACET on reversal of cell growth inhibition using MTT assay a

ATT: Anti Tubercular therapy; INH: isoniazid; PYZ: pyrazinamide; CUR: curcumin; SILY: silymarin; N-ACET: N-acetylcysteine; MTT: 3-(4, 5-dimethylthiazolyl-2-yl) 2, 5-diphenyl tetrazoliumbromide.
aHepG2 cells pretreated with INH (5 mM) or PYZ (5 mM) for 24 h and then subsequently treated with either individual or combination of ATT drugs at concentrations of INH (100 or 200 mM), RIF (50 µM) and PYZ (100, 200 mM) for another 24 h alone or with CUR, SILY or N-ACET (10 µM), respectively. Statistical analysis was done using unpaired Student’s t test. Values are presented as means ± SD for three independent experiments.
bStatistically significant difference among groups is indicated as p < 0.05 when compared with control.
cStatistically significant difference among groups is indicated as p < 0.05 when compared with 5 mM INH and 200 mM INH.
dStatistically significant difference among groups is indicated as p < 0.05 when compared with 5 mM INH and 100 mM INH + PYZ each.
Note: ATT (INH, PYZ, RIF).
Alteration in morphology of HepG2 cells
Phase contrast inverted microscopy of the treated HepG2 cells was performed to understand the gross changes that are induced in the cells. Morphological examination of HepG2 cells treated with ATT drugs with or without CUR, SILY or N-ACET revealed striking changes. Only the representative results are shown here (Figure 1). Untreated HepG2 cells show a classical epithelial-like morphology (Figure 1(a)). Cells treated with CUR, SILY or N-ACET largely resemble control cells with few isolated oval cells (Figure 1(b) to (d)). On the other hand, HepG2 cells treated with ATT drugs depict a morphology which is indicative of drug-induced toxicity. Specifically, cells when subjected to pretreatment with INH or PYZ followed by treatment with higher concentrations of INH and/or PYZ displayed a typical cubic to round shape (Figure 1(e) and (i)). Some cells sloughed off the culture plate. Other cells showed swollen morphology with membrane blebbing suggestive of necrosis. However, upon treatment with CUR, SILY or N-ACET cells reverted to confluency with healthy appearing epithelial morphology (Figure 1(f) to (h) and (j) to (l)).

Phase contrast microscopy of HepG2 cells treated with ATT drugs and hepatoprotective drugs. Micrographs at ×100 magnification depicting morphological changes in HepG2 cells pretreated with INH at a concentration of 5 mM and subsequently treated with higher doses of INH (200 mM) or with INH and PYZ at a concentration of 100 mM each. These cells were treated with ATT drugs alone or with CUR, SILY or N-ACET at a concentration of 10 µM each. ATT: anti-tuberculosis therapy; INH: isoniazid; PYZ: pyrazinamide; CUR: curcumin; SILY: silymarin; N-ACET: N-acetylcysteine.
To further characterize probable mechanisms of ATT drug-induced cellular toxicity, we investigated the effects on mitochondrial membrane potential using a mitochondria-specific dye Mitotracker® Red. The dye localizes/accumulates in mitochondria and emits red fluorescence. The interaction of the dye with mitochondria depends upon the mitochondrial membrane potential. We find that untreated, CUR, SILY or N-ACET treated HepG2 cells show normal intense staining with mitochondrial dye which is indicative of live and healthy respiring cells (Figure 2(a) to (d)). On the other hand, pretreatment followed by treatment with ATT drugs exhibited marked change in the mitochondrial membrane permeability which was indicative of cell cytotoxicity (Figure 2(e) and (I)). However, in cells treated with ATT in the presence of CUR, SILY or N-ACET, normal staining with Mitotracker® Red was largely restored.

Confocal microscopy of HepG2 cells treated with anti-tuberculosis therapy (ATT) drugs and hepatoprotective drugs namely curcumin (CUR), silymarin (SILY) and N-acetylcysteine (N-ACET). Refer to Figure 1 for the treatment conditions. The cells were stained with a mitochondria-specific dye Mitotracker® Red and examined under laser scanning confocal microscope SV500 at a magnification of ×600.
Flow cytometric analysis
To explore whether the in vitro ATT treated HepG2 cells undergo cytotoxicity through the mechanism of apoptosis, cell cycle distribution was evaluated using flow cytometry analysis. This is based on cell's diminished stainability with the DNA-specific fluorochrome PI resulting from the hypodiploid population. Cell populations are expected to lie in the G0/G1, S, G2/M phases of cell cycle (Table 2). However, due to apoptosis the cells appear with degraded DNA as hypodiploid cells and are represented as Sub-G1 peak. While the control cells do not show any significant sub-G1 population, pretreatment with INH followed by treatment with higher concentrations of INH alone or INH and PYZ resulted in a significant sub-G1 peak of 4.40 and 9.90%, respectively. Further, PYZ pretreatment followed by treatment at higher concentration of PYZ also resulted in a 5.40% sub-G1 peak.
Effect of hepatoprotective drugs CUR, SILY and N-ACET on cell cycle progression in HepG2 cells a
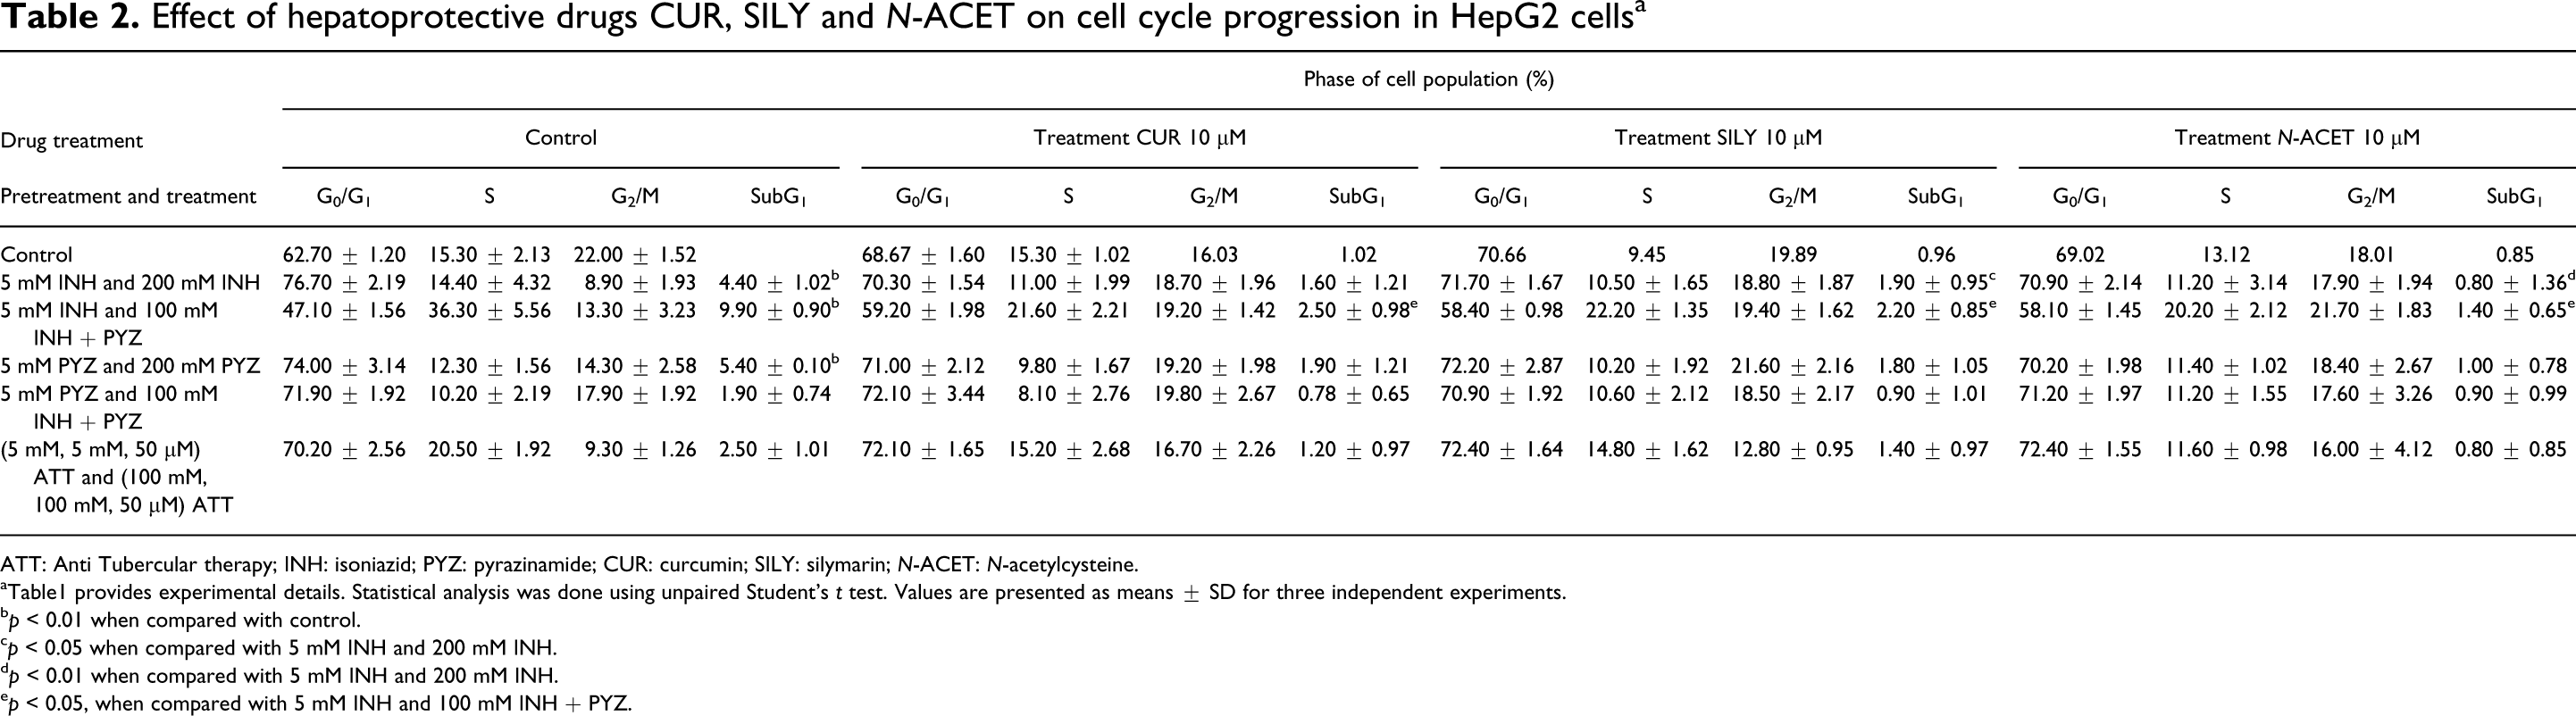
ATT: Anti Tubercular therapy; INH: isoniazid; PYZ: pyrazinamide; CUR: curcumin; SILY: silymarin; N-ACET: N-acetylcysteine.
aTable1 provides experimental details. Statistical analysis was done using unpaired Student’s t test. Values are presented as means ± SD for three independent experiments.
b p < 0.01 when compared with control.
c p < 0.05 when compared with 5 mM INH and 200 mM INH.
d p < 0.01 when compared with 5 mM INH and 200 mM INH.
e p < 0.05, when compared with 5 mM INH and 100 mM INH + PYZ.
Upon treating with CUR, SILY or N-ACET along with INH pretreatment followed by higher concentrations of INH and PYZ led to a significant decrease in sub-G1 population. Figure 3 shows representative flow graphs of cell cycle analysis experiments performed for the above treatment which clearly shows that there is no sub-G1 peak in the control cell, while it increased to 9.90% with INH pretreatment followed by INH and PYZ treatment at a concentration of 100 mM each. The sub-G1 population with CUR, SILY or N-ACET decreased to 2.50, 2.20 and 1.40%, respectively. This decrease in percentage of cells in sub-G1 peak is indicative of decrease in apoptotic cells.

Effect of hepatoprotective drugs CUR, SILY and N-ACET on cell cycle progression in HepG2 cells pretreated with INH at a concentration of 5 mM and subsequently treated with INH and PYZ at a concentration of 100 mM each. The pretreatment and treatment conditions were (a) Control, (b) INH (5 mM) and INH + PYZ (100 mM) each, (c) INH (5 mM) and INH + PYZ (100 mM) and CUR (10 mM), (d) INH (5 mM) and INH + PYZ (100 mM) each and SILY (10 µM), and (e) INH (5 mM) and INH + PYZ (100 mM) each and N-ACET (10 μM). The peaks P2, P3, P4 and P5 correspond to the G0/G1 phase, S phase, G2/M phase and Sub-G1 cells, respectively. INH: isoniazid; PYZ: pyrazinamide; CUR: curcumin; SILY: silymarin; N-ACET: N-acetylcysteine.
Discussion
Our previous results had suggested that pretreatment increases the toxic effect of ATT drugs toward HepG2 cells. 23 It was argued that this in vitro model mimics the effects of long-term in vivo treatment. 23 , 26 Therefore, the objectives of the current study were to understand the hepatoprotective effects of herbal drugs CUR, SILY and N-ACET on cytotoxicity during ATT treatment. We find significant reversal of cell damage in the presence of SILY and N-ACET. Further, our results suggest that this may be due to (a) reversal of damage to cellular membrane as observed with phase contrast microscopy, (b) suppression of mitochondrial damage as observed with confocal microscopy and (c) decrease in apoptosis as observed with flow cytometry. Phase contrast micrographs showed that HepG2 cells treated with anti-TB drugs undergo membrane disturbance with vacuolation accompanied with cytoplasmic rarefication. ATT treatment in the presence of CUR, SILY or N-ACET caused reversal of such morphology with fewer necrotic areas. Earlier it has been shown that SILY protects liver against ischemia/reperfusion injury probably by preventing the deterioration of mitochondrial function. 24 Results from our confocal microscopic studies using Mitotracker® Red revealed that these agents protect mitochondria against ATT-induced morphological changes.
The mechanism of hepatoprotection by the herbal drugs has been reported for few drug models. Recently, a report attributed ATT-induced hepatotoxicity to oxidative stress, 6 lipid peroxidation, choline deficiency leading to lowering of phospholipids protein synthesis and alteration in cell wall configuration and reduced glutathione levels. 8 It has been hypothesized in literature that the protective effects of CUR, 12 SILY 25 and N-ACET 14 are mainly attributable to the antioxidant and free radical scavenging properties of the hepatoprotective drugs. Further, it has been shown that SILY inhibits several isoforms of CYP P450 enzymes, 26 potentiates the antioxidant capacity of the liver, 27 acts as a scavenger of oxygen free radicals, 28 and inhibits the synthesis of proinflammatory cytokines. Thus, our results are in agreement with the hepatoprotection by herbal drugs as proposed in literature. We need to further dissect the plausible mechanisms of action of hepatoprotection by gene expression profiling of the various enzymes involved in phases I and II of drug metabolism, oxidation and so on.
Our study has conclusively shown, for the first time in an in vitro liver model the ability of CUR, SILY and N-ACET to preserve the normal physiological hepatic mechanisms, which can be disturbed by ATT treatment. The results are encouraging toward the prevention of hepatotoxicity and improving the prognosis during ATT treatment. These hepatoprotective agents may be useful in other cases involving drug-induced hepatic damage. Although, CUR, SILY and N-ACET have been used as alternative medicine for many years there is insufficient scientific data for them to be routinely prescribed by clinicians in patients with liver disease. They need to be further tested for their hepatoprotective role in various drug models. More randomized human clinical trials need to be conducted before prescribing these drugs as medicines in humans.
Footnotes
Acknowledgements
The authors acknowledge the use of Flow Cytometry Central Facility of Centre for Research in NanoTechnology and Sciences, Indian Institute of Technology Bombay, Mumbai, Maharashtra, India.
M.S. and P.S. contributed equally to this article.
Funding
This work was partially supported by Department of Science and Technology, Ministry of Science and Technology, Government of India (to P.P.W.).