
Abstract
The aim of our study was to evaluate the effects of cold stress on hepatic oxidative damage during binge drinking in rats. Male Wistar rats were divided into the following groups: group 1: control; group 2: ethanol-treated; group 3: stress-exposed; group 4: stress-exposed and ethanol-treated group. Oxidative and nitrosative stress parameters in the liver were determined spectrophotometrically, 12 h after treatment. Liver malondialdehyde concentration was significantly higher in group 4 when compared with groups 2 and 3. The highest increase in nitric oxide concentration was demonstrated in group 4 in comparison with groups 2 and 3. Superoxide dismutase (SOD) activity was significantly lower in group 4 when compared with groups 2 and 3. Ethanol administration induced a larger decrease in the activity of copper-/zinc-SOD in group 4 in comparison with group 2. Activity of manganese-SOD (Mn-SOD) was significantly higher in groups 3 and 4, when compared with control values, but the greatest increase in the activity of Mn-SOD was demonstrated in group 2. We also evaluated statistically significant decrease in the level of reduced gluthatione in the liver of group 4 in comparison with group 3. Based on our study, it can be concluded that cold-exposed stress and binge ethanol drinking have additive effects in imbalance between pro-oxidant and antioxidant defense system in liver.
Introduction
Acute and chronic alcoholism is a sociological and toxicological problem of great importance because of its free use in the whole population. It was proved that ethanol, the active substance of alcoholic beverages, is responsible for morphological and functional damages of different tissues and organs, including liver, heart, as well as central and peripheral nervous systems. 1,2 Mechanisms of alcohol-induced damages are different and not clear enough. Ethanol-induced liver injury is mediated by direct effects of its metabolic products (e.g. acetaldehyde), oxidative stress, an increase in endotoxin release from intestinal lumen, and also by different cytokines released from hepatocytes and activated leukocytes. 3,4 Oxidative stress in the liver is a consequence of increased production of free radicals and decreased capacity of antioxidant defense systems in hepatocytes. 3 –5 Superoxide anion is the promoter of oxidative stress in the liver. The most important source of this anion is cytochrome P450-dependent monooxygenase, an inducible enzyme that takes part in ethanol metabolism. 6,7 Other sources of reactive oxygen species (ROS) are Kupffer cells and neutrophils that infiltrated liver during alcoholic hepatitis. 8 It was also demonstrated that ethanol activates inducible nitric oxide synthase (NOS) in Kupffer cells. Together with superoxide anion, nitric oxide (NO) is responsible for the production of very reactive peroxynitrite that disturbs cell functions. 9 Ethanol also increases iron release from ferritin and stimulates the production of very potent free radicals in Fenton and Haber-Weiss reaction. 6,10 Whatever may be the sources of free radicals, ROS and reactive nitrogen species (RNS) induce mitochondrial permeability transition, mitochondrial DNA (mtDNA) damage, disturbances in lipid and carbohydrate metabolism with ultimate adenosine triphosphate depletion and cell death. 11
Stress represents the disturbance of dynamic balance in the organism by different factors. The body response, provoked by the different stressors, is a general adaptive syndrome, with the activation of hypothalamus–pituitary–adrenal gland axis, as the main characteristic. 12 Various experiments demonstrated stress-dependent correlation of the level of cortisol blood and oxidative damage in hepatocytes. 12,13 The exact mechanism of this correlation is not clear, but it is supposed that cortisol decreases the activity of glutathion reductase and impairs antioxidant capacity of the cells. 14,15 Cortisol also increases the activity of cytochrome P450-dependent monooxygenase and stimulates free radical production. 15,16
Stress is a very important trigger for acute and chronic consumption of alcohol. Common form of drinking in adolescence and adult population is binge drinking. The mechanism of oxidative liver injury, induced by simultaneous effect of ethanol and stress, is not clear enough. As it was demonstrated that the imbalance between pro-oxidant and antioxidant mechanisms contributes to the stress and ethanol-induced liver injuries, the aim of our study was to evaluate the effects of cold-induced stress on liver oxidative damage in rats during binge drinking.
Materials and methods
Animals
The experiment was performed on adult, 10 weeks old male Wistar rats weighing 200–220 g, raised at Military Medical Academy, Belgrade. Animals were kept under standard laboratory conditions (temperature 22 ± 2°C, relative humidity 50 ± 10%, 12/12 h light/dark cycle with lights turned on at 9.00 a.m.) and had free access to tap water and standard pelleted LM2 food (Veterinary Institute “Subotica,” Subotica, Serbia). The diet, which had metabolizable energy of the least 11.5 MJ/kg, was composed of a maximum of 7% cellulose and a minimum of 19% protein. On the day prior to killing, the mice were fasted overnight. All experimental procedures were in full compliance with Directive of the European Parliament and of the Council (2010/63/EU) and approved by The Ethical Committee of the University of Belgrade.
All animals (n = 28) were randomly divided into following groups: group 1: control group, treated with distilled water (group C; n = 7); group 2: ethanol-treated group (group E; n = 7); group 3: stress-exposed group (group S; n = 7); group 4: stress-exposed and ethanol-treated group (group SE; n = 7). Ethanol was administered in five doses of 2 g/kg every 12 h by oral route (orogastric tube). For oral administration, ethanol (Sigma Aldrich Chem. Co. St. Louis, Missouri, USA) was dissolved in distilled water in concentrations of 30% v/v. This dose was chosen since it has been proved in our pilot study to induce oxidative stress in liver (data not published). Stress was provoked by exposing to cold (at 4°C) for 15 min for 15 days. 13 Ethanol was administered to group SE in last 3 days of exposure to cold. Rats were killed by cervical dislocation 12 h after the last dose of ethanol. Blood samples were collected from the right side of the heart. For the same purpose, livers were excised and stored as described below.
Sample preparation
Liver samples for biochemical analysis were homogenized on ice, in 0.25 M cold-buffered sucrose medium (Serva, Feinbiochemica, Heidelberg, New York, USA), 10 M phosphate buffer (pH 7.0), and 1 mM ethylenediaminetetraacetic acid (EDTA; Sigma Aldrich Chem. Co.). The homogenates were centrifuged at 2000g for 15 min at 4°C. Crude sediments were dissolved in a sucrose medium and centrifuged. The supernatants were transferred into the tubes and centrifuged at 3200g for 30 min at 4°C. Obtained sediments were dissolved in deionized water. After 1 h of incubation, the samples were centrifuged at 3000g for 15 min at 4°C and supernatants were stored at −70°C. Proteins were determined by the Lowry method using bovine serum albumin as the standard. 17
Biochemical analysis
Liver damage was biochemically confirmed by the determination of the activity of serum alanin aminotransferase (ALT) and aspartate aminotransferase (AST). Activities of ALT and AST were measured spectrophotometrically using special kits containing 2-oxoglutarate (Sigma Aldrich Chem. Co.) at photometer BTS-330 according to the manufacturer’s instruction.
Corticosterone plasma concentration is determined by radioimmnunoassay method using tubes covered with polyclonal antibodies to corticosterone. This method is based on the competition of commercially prepared corticosterone marked with radioactive 125J, with corticosterone contained in plasma samples for the binding sites on antibodies in the solid phase. Samples are incubated for 2 h at 37°C with 125J corticosterone in the tubes. After incubation, the tubes were rinsed in distilled water and remaining radioactivity measured by gamma scintillated counter, calibrated for 125J.
Activity of total superoxide dismutase ((SOD) EC1.15.1.1.) in the liver was measured spectrophotometrically, as an inhibition of epinephrine auto-oxidation at 480 nm. After the addition of 10 mM epinephrine (Sigma Aldrich Chem. Co.), analysis was performed in the sodium carbonate buffer (50 mM, pH 10.2; Serva, Feinbiochemica) containing 0.1 mM EDTA (Sigma Aldrich Chem. Co.). Samples for manganese-SOD (Mn-SOD) were previously treated with 8 mM potassium cyanide (Sigma Aldrich Chem. Co.) and were then analyzed as described. 18 Activity of copper-/zinc-SOD (Cu-/Zn-SOD) was determined as a difference between the activities of total SOD and Mn-SOD.
Lipid peroxidation in the plasma and liver homogenates was measured as malondieldehyde (MDA) production and assayed in reaction with thiobarbituric acid as described by Girotti et al. 19 The results are expressed as micromoles per liter in plasma or micromoles per milligram of proteins in liver homogenates.
The concentration of nitrite and nitrate (NOx), markers of NO production, was determined using Griess reagent. Nitrite was reacted with sulfanilamide and N-(1-naphtyl)ethylendiamine to produce an azo dye, which can be measured spectrophotometrically at 492 nm. 20
Level of reduced glutathione (GSH) in the liver was determined using 5,5′-dithiobis-2-nitrobenzoic acid (DTNB, 36,9 mg in 10 mL methanol, Sigma Aldrich Chem. Co.). Liver sections were frozen in individual beakers containing ethanol and dry ice. Later, these tissues were completely defrosted, rinsed in water, and homogenized in 5% 5-sulfosalicylic acid as described above. The tissue homogenates were centrifuged in 1.5 mL plastic vials in a microfuge for 5 min. The supernatant solutions were stored at 4°C until assayed. GSH was oxidized by DTNB to give oxidized glutathione (GSSG) with stoichiometric formation of 5-thio-2-nitrobenzoic acid (TNB). GSSG was reduced to GSH by the action of the highly specific glutathione reductase (GSSG reductase) and nicotinamide adenine dinucleotide phosphate (NADPH). The rate of TNB formation was followed at 412 nm and is proportional to the sum of GSH and GSSG present. 21
Statistical analysis
Results are expressed as means ± SD. As the normal distribution of parameters was confirmed by Kolmogorov-Smirnov test, for testing the difference among groups, two-way analysis of variance with Tukey’s post hoc test was used. The difference was considered statistically significant if p < 0.05. Statistica 7.0 was used for the statistical analysis.
Results
Results of our study showed a significant increase in the level of plasma corticosterone in groups S and SE compared with group C, while its plasma level was not significantly different in E in comparison with group C (Table 1). Activities of ALT and AST were significantly higher in all treated groups compared with C (Table 1).
Activity of plasma ALT and AST and level of corticosterone in experimental groups a

ALT: alanine aminotransferase; AST: aspartate aminotransferase.
aResults are expressed as means ± SD, two-way analysis of variance with Tukey’s post hoc test were used.
b p < 0.01 versus control.
Our results showed that the level of liver MDA was significantly higher in group S (12.9 ± 1.6 μmol/mg protein; p < 0.01) in comparison with group C (8.5 ± 1.4 μmol/mg protein). Also, ethanol administration induced statistically significant increase in MDA concentration compared with group C (p < 0.01). Ethanol administration after stress exposure induced the highest increase in the level of liver MDA. Its level was significantly higher in group SE (15.6 ± 1.1 μmol/mg protein) compared with groups E (11.1 ± 2.9 μmol/mg protein; p < 0.01) and S (12.9 ± 1.6 μmol/mg protein; p < 0.01; Figure 1(a)).

The effects of ethanol and stress on the levels of malondialdehyde (MDA) in the liver (a) and the plasma (b). Ethanol was administered in five doses of 2 g/kg on every 12 h, while stress was provoked by exposure to 4°C for 15 min during 15 days. Statistical significance of the difference was evaluated using two-way analysis of variance with Tukey’s post hoc test (**p < 0.01 vs. control, # p < 0.01 vs. group S, † p < 0.01 vs. group E). S: stress-exposed group; E, ethanol-treated group.
We found similar changes in plasma MDA concentration in experimental animals. Significant increase was shown in groups S (5.87 ± 1.13 μmol/L; p < 0.01) and E (5.89 ± 0.98 μmol/L; p < 0.01) when compared with group C (3.29 ± 0.46 μmol/L), while the highest increase was shown in group SE (7.23 ± 1.34 μmol/L; Figure 1(b)).
We showed in our study an increase in NO concentration in all experimental groups compared with control values (0.32 ± 0.05 µmol/mg protein; p < 0.01). The greatest increase in NO concentration was demonstrated in group SE (1.29 ± 0.07 µmol/mg protein) when compared with groups S (0.59 ± 0.04 µmol/mg protein; p < 0.01) and E (1.02 ± 0.08 µmol/mg protein; Figure 2).

The effects of ethanol and stress on the level of nitrite and nitrate (NOx) in the liver. Statistical significance of the difference was evaluated using two-way analysis of variance with Tukey’s post hoc test (**p < 0.01 vs. control, # p < 0.01 vs. group S, † p < 0.01 vs. group E). For more details see Figure 1. S: stress-exposed group; E, ethanol-treated group.
Activity of liver SOD was significantly higher in group S (3751.73 ± 185.98 U/mg protein) when compared with group C (1958.24 ± 93.45 U/mg protein; p < 0.01). In contrast, in group E, we found decreased activity of SOD (1219.62 ± 101.23 U/mg protein) in comparison with group C (1958.24 ± 93.45 U/mg protein; p < 0.01). Activity of SOD was significantly lower in group SE (1106.57 ± 99.94 U/mg protein) when compared with groups E (1219.62 ± 101.23 U/mg protein; p < 0.05) and S (3751.73 ± 185.98 U/mg protein; p < 0.01; Figure 3(a)).
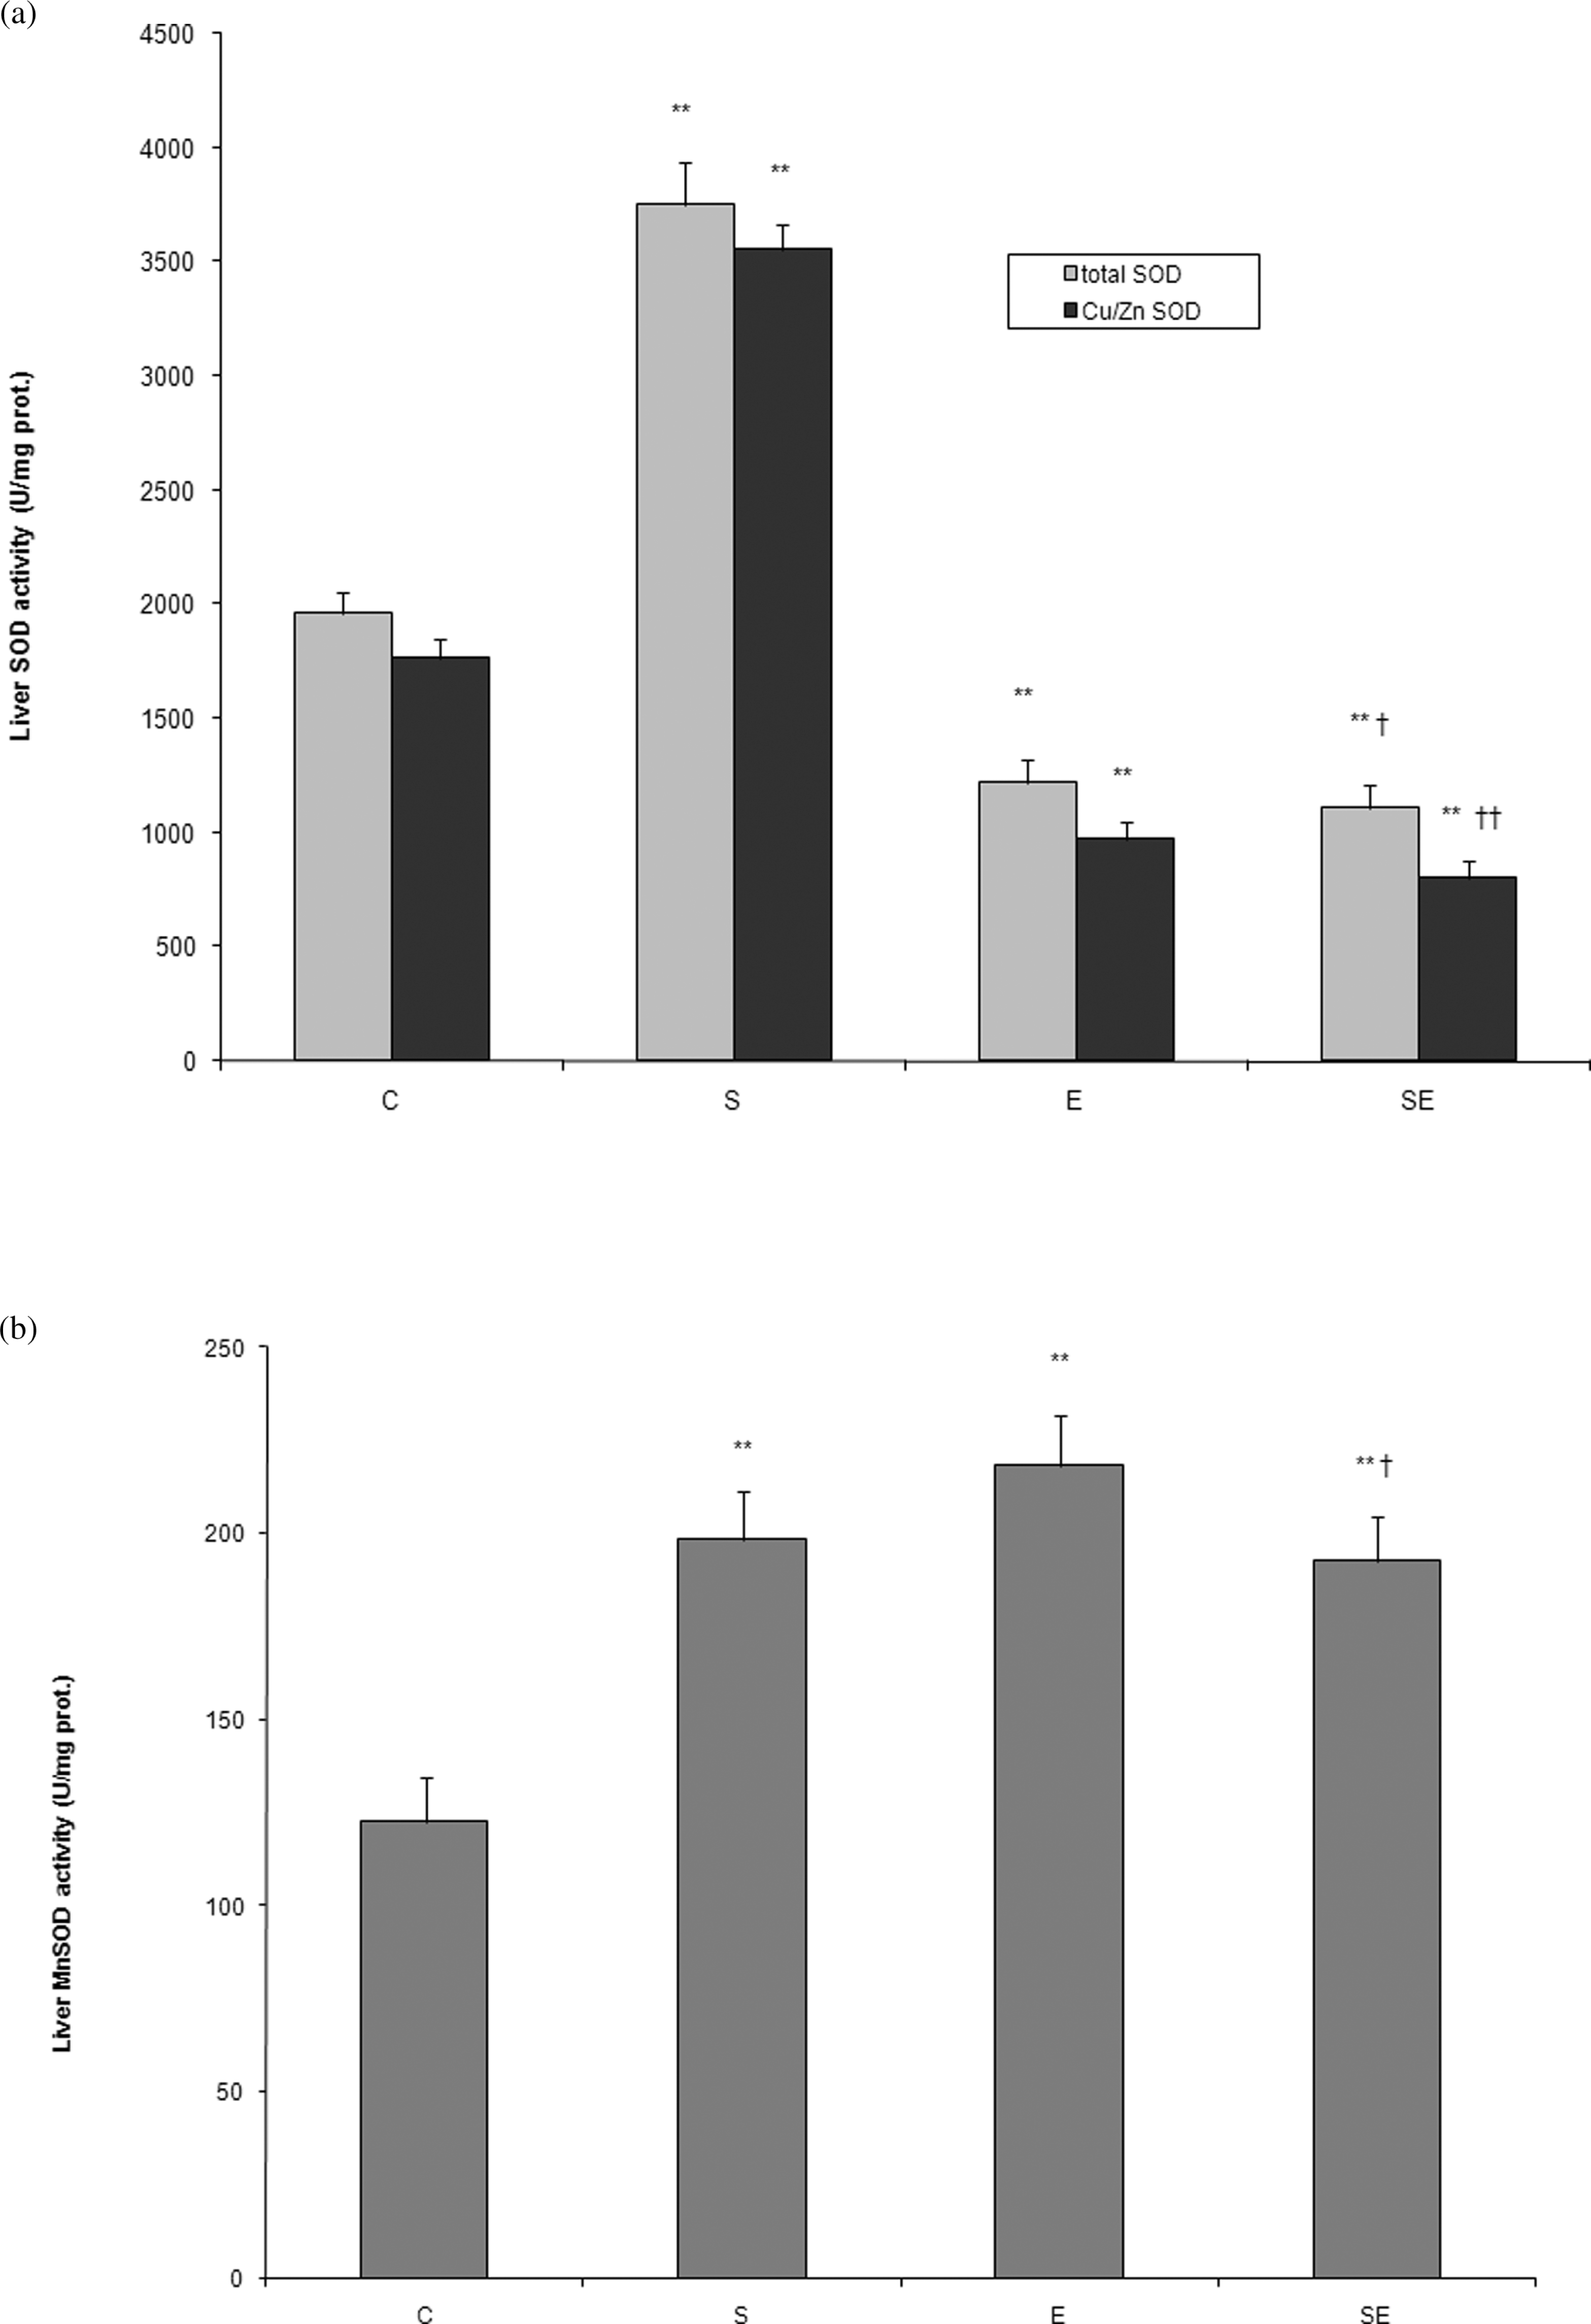
The effects of ethanol and stress on the activity of total liver superoxide dismutase (SOD), Cu-/Zn-SOD (a), and Mn-SOD (b). Statistical significance of the difference was evaluated using two-way analysis of variance with Tukey’s post hoc test (**p < 0.01 vs. control, † p < 0.05, †† p < 0.01 vs. group E). For more details see Figure 1. E, ethanol-treated group.
Our results also showed a significant increase in the activity of Cu-/Zn-SOD in group S (3556.72 ± 108.67 U/mg protein; p < 0.01) when compared with group C (1764.91 ± 85.39 U/mg protein). In contrast to the results in group SE, we found a significant decrease in Cu-/Zn-SOD activity in group E when compared with the control values (967.64 ± 79.83 U/mg protein and 1764.91 ± 85.39 U/mg protein; p < 0.01). Exposure to cold prior to ethanol administration induced more pronounced decrease in Cu-/Zn-SOD activity than ethanol alone (801.74 ± 71.87 U/mg protein and 967.64 ± 79.83 U/mg protein in SE and E groups, respectively; p < 0.01; Figure 3(a)).
In contrast to Cu-/Zn-SOD activity, we found a significant increase in Mn-SOD activity in all the experimental groups when compared with group C. Mn-SOD activity was significantly higher in groups S (198.42 ± 12.69 U/mg protein) and SE (192.74 ± 11.63 U/mg protein) in comparison with group C (122.65 ± 11.9 U/mg protein; p < 0.01), but the greatest increase in Mn-SOD activity was demonstrated in group E (218.06 ± 13.72 U/mg protein; Figure 3(b)). However, the activity of this enzyme was not significantly changed in group SE when compared with group E (p > 0.05).
We evaluated, in our study, a significant decrease in the level of liver GSH in groups S (0.69 ± 0.05 nmol/mg protein) and E (0.57 ± 0.06 nmol/mg protein) when compared with group C (1.07 ± 0.08 nmol/mg protein; p < 0.01). GSH value was significantly lower in group SE (0.49 ± 0.06 nmol/mg protein) when compared with group S (0.69 ± 0.05 nmol/mg protein). No significant difference was determined between groups SE and E (Figure 4).

The effects of ethanol and stress on reduced glutathione (GSH) level in the liver. Statistical significance of the difference was evaluated using two-way analysis of variance with Tukey’s post hoc test (**p < 0.01 vs. control, # p < 0.01 vs. group S). For more details see Figure 1. S: stress-exposed group; E, ethanol-treated group.
Discussion
The activities of serum AST and ALT were increased in all experimental groups when compared with the control. These results show that stress and ethanol induce hepatocyte damage. Based on the level of corticosterone, ethanol did not induce stress response in the organism (Table 1).
Our study also showed that ethanol and stress induced a significant increase in the level of liver and plasma MDA in comparison with control group, but the concentration of MDA in the liver was significantly higher in group SE when compared with groups E and S. MDA is the end product of lipid peroxidation, so its increased level points to the possible role of lipid peroxidation in ethanol- and stress-induced liver injury.
22
The importance of lipid peroxidation in alcoholic liver disease was demonstrated by protective role of different antioxidants, like vitamin E, C, and
Our results are similar to some other studies that showed correlation between stress and lipid peroxidation in hepatocytes. The greatest oxidative lipid damage was shown in the model of immobilization–cold stress. 13 However, various tissues show different sensitivities to cold-induced oxidative damage. This is evident as a lack of lipid peroxidation in brown adipose tissue after short- and long-term cold exposure. 25 The exact mechanism of this effect is not clear enough. However, one of the possible mechanisms of lipid peroxidation is that an increase in the activity of cytochrome P450-monooxygenase is induced by glucocorticoids. 26,27
Our study showed that liver concentration of NOx was significantly increased in groups E and S when compared with group C. Although, the importance of RNS in alcohol-induced liver injury was demonstrated in different studies, on genetically modified animals, its precise role in the pathogenesis of this injury is not completely understood. 28 –30 While low level of NO exerts protective effects on hepatocytes, high level of NO can be injurious, due to the reaction of NO with superoxide anion and peroxynitrite production. 31 Similar to acute alcoholic liver damage, the role of RNS in stress-induced tissue injury is also not clear enough. Our results showed that stress induced an increase in the level of liver NOx, thus suggesting that RNS may play an important role in stress-induced injury. Besides, levels of liver NOx are significantly higher in group SE when compared with groups S and E. This indicates that stress increases hepatocyte sensitivity to ethanol-induced nitrosative damage.
Our results show that activity of SOD is significantly lower in ethanol-treated group when compared with control. However, ethanol has different effects on two SOD izoenzymes. While ethanol induced a decrease in the activity of Cu-/Zn-SOD, the activity of Mn-SOD was significantly higher in groups treated with ethanol in comparison with control. This increase in the activity of Mn-SOD can be explained by adaptive response of hepatocytes to increase in ROS production induced by ethanol. Mitochondria are the most important organelles in ROS production, so it is not surprising that the adaptive response is dominant in mitochondria. An important function of Mn-SOD may be to limit the peroxynitrite formation.
Our results also showed that stress induced an increase in the activity of Mn-SOD and Cu-/Zn-SOD. These findings correspond to the results of other studies that demonstrated that liver is the organ with most prominent increase in the activity of SOD, after exposure to stress. 13,32 Activity of SOD was decreased to a larger extent in group SE than in groups S and E. However, this effect is not the same in both izoenymes. While we found a decrease in the activity of Cu-/Zn-SOD, the activity of Mn-SOD increases when stress and ethanol act simultaneously. Mn-SOD overexpression prevents, whereas partial Mn-SOD deficiency induces, mtDNA depletion and mitochondrial dysfunction after an acute alcohol binge in mice. The protective effects of Mn-SOD, tempol, NOS inhibitors, and uric acid suggest that peroxynitrite plays a major role in the mtDNA damage caused by an alcohol binge in mice. 33 Similar facts were also observed after the administration of various drugs that are metabolized by P450 monooxigenase. Activity of Cu-/Zn-SOD is significantly lower in group SE in comparison with groups S and E, indicating an additive effect of ethanol and stress in the reduction of cytoplasmic activity of SOD. In contrast, this additive effect was not observed in the activity of Mn-SOD. This indicates that a decrease in the activity of Cu-/Zn-SOD represents one of the mechanisms by which stress aggravates alcohol-induced oxidative liver damage.
Our study demonstrated that ethanol and stress induced a decrease in the level of GSH in comparison with control. Other research also found a decrease in the level of liver GSH after ethanol treatment.
3
The importance of decreased level of GSH in the pathogenesis of alcohol-induced liver injury was confirmed by the protective effects of glutathione precusor (N-acetyl cysteine and
Based on our study, it can be concluded that stress increases hepatocyte sensitivity to lipid peroxidation and nitrosative damage induced by ethanol. In addition, cold stress potentiates impairment of ethanol-induced antioxidant defense system in the liver. This impairment is due to a decrease in the activity of liver Cu-/Zn-SOD and the level of GSH. On the other hand, cold and ethanol induce an increase in the activity of liver Mn-SOD. The significance of this finding should be the objective of further investigations.
Footnotes
Acknowledgements
The authors are also thankful to colleagues from Institute for Medical Research of Military Medical Academy, Belgrade, for providing useful assistance for experimental procedures.
This work was supported by the Ministry for Science and Technological Development of Serbia, Grant no. 175015.