
Abstract
Citosol (thiamylal sodium) is one of generally used anesthetic–sedative agents for clinical patients, and it has not been reported to show induction of cytotoxic effects in cancer cells, especially in mice leukemia RAW 264.7 cells in vitro. In the present study, we investigated the cytotoxic effects of citosol on mice leukemic RAW 264.7 cells, including the effects on protein and gene expression levels which are determined by Western blotting and DNA microarray methods, respectively. Results indicated that citosol induced cell morphological changes, cytotoxic effect, and induction of apoptosis in RAW 264.7 cells. Western blotting analysis demonstrated that citosol promoted the levels of Fas, cytochrome c, caspase 9 and 3 active form and Bax levels, but it suppressed Bcl-xl protein level that may lead to apoptotic death in RAW 264.7 cells. Furthermore, DNA microarray assay indicated that citosol significantly promoted the expression of 5 genes (Gm4884, Gm10883, Lce1c, Lrg1, and LOC100045878) and significantly inhibited the expression of 24 genes (Gm10679, Zfp617, LOC621831, Gm5929, Snord116, Gm3994, LOC380994, Gm5592, LOC380994, LOC280487, Gm4638, Tex24, A530064D06Rik, BC094916, EG668725, Gm189, Hist2h3c2, Gm8020, Snord115, Gm3079, Olfr198, Tdh, Snord115, and Olfr1249). Based on these observations, citosol induced cell apoptosis and influenced gene expression in mice leukemia RAW 264.7 cells in vitro.
Introduction
Cancer is the major cause of death in human populations worldwide and leukemia is one of the lethal cancers. 1,2 In Taiwan, about 4 of 100,000 people die of leukemia each year. Based on the reports in 2009 from the Department of Health, R.O.C. (Taiwan), leukemia is the 11th most common malignancy in Taiwan. 3 Current therapies for leukemia include intensive chemotherapy and/or hematopoietic stem cell transplantation. 4,5 In addition, imatinib for chronic myelogenous leukemia and all-trans retinoid acid for acute promyelocytic leukemia, both of which have markedly improved the prognosis by inhibiting the activities of key molecules critical for leukemogenesis. 6,7 However, these treatments for leukemia are still unsatisfactory due to low cure rate and occurrence of numerous side effects.
Recently, numerous studies have demonstrated that some fusion proteins or key transcription factors play important roles in leukemogenesis. 8–10 A large number of studies have focused on trying new agents or novel targets for leukemic patients. 11,12 Citosol (thiamylal sodium) has been used as an intravenous hypnotic drug for anesthesia. 13–16 However, no information regarding the effects of citosol on the cytotoxic effects, apoptosis and gene expressions associated with apoptosis in mice leukemia cells is available. Therefore, in the present study, we investigated the effects of citosol on the mice leukemia RAW 264.7 cells in vitro by examining the cytotoxic effects by measuring the gene expressions and associated proteins involved in the process of apoptosis and cell viability.
Materials and methods
Materials, chemicals, and reagents
Thiamylal sodium (citosol) was purchased from Shinlin Sinseng Pharmaceutical Co. Ltd (Taoyuan, Taiwan). Stock solution of citosol was dissolved in phosphate-buffered saline (PBS), and an equal volume of PBS (1%) was added to the well as controls. RNaseA, propidium iodide (PI), and 4,6-diamidino-2-phenylindole (DAPI) were purchased from Sigma-Aldrich Corp. (St Louis, MO, USA). RPMI 1640 medium, fetal calf serum (FBS), penicillin and streptomycin antibiotic mixture were purchased from Invitrogen Life Technologies (Grand Island, NY, USA). These primary antibodies against Fas, cytochrome c, apoptosis-inducing factor (AIF), endonuclease G (Endo G), caspase 9 and 3, Bax and Bcl-2, and secondary antibodies were purchased from Santa Cruz Biotechnology, Inc. (Santa Cruz, CA, USA).
Cell culture
The RAW 264.7 mouse leukemia cell line was obtained from the Food Industry Research and Development Institute (Hsinchu, Taiwan). The RAW 264.7 cells were incubated in 5% CO2 and at 37°C in RPMI 1640 medium with 2 mM
Determination of morphology and percentage of viable cells
To examine the cell morphological changes, the cells from each treatment were examined and photographed under a phase-contrast microscope at ×200 magnification as described elsewhere. 18,19 The quantitative analysis of cell viability was performed by flow cytometric assay (Becton-Dickinson FACSCalibur, Franklin Lakes, NJ, USA) as previously described. 19,20 RAW 264.7 cells at a density of 2 × 10⁵ cells/ml were cultured in 12-well plates and treated with 0, 0.375, 0.75, 1.5, 3, and 6 μg/ml of citosol followed by incubation for 24 h. At the end of incubation, cells were harvested from each treatment and stained with PI (4 μg/ml). Percentage of viable cells was measured by flow cytometry.
DAPI nuclear staining for chromatin condensation in apoptosis
RAW 264.7 cells at a density of 2 × 10⁵ cells/well were seeded in 12-well plates, were exposed to 3 μg/ml of citosol and fixed in 4% paraformaldehyde solution (Sigma-Aldrich Corp.) for 15 min followed by staining with DAPI (300 nmol/L; DAPI, Invitrogen) for 30 min at 25°C. Then the nuclear morphology or apoptotic body were visualized, examined, and photographed by fluorescence microscopy. Apoptotic cells were recognized by the condensed, fragmented, degraded nuclei and apoptotic body. 21,22
Western blotting assay for examining the changes in apoptosis-associated protein levels
RAW 264.7 cells were placed into 6-well plates at a density of 5 × 10⁵ cells/ml in RPMI 1640 medium with 10% FBS for 24 h. Cells in each well were treated without and with 3 μg/ml of citosol for 48 and 72 h. Cells were collected and total protein from each treatment was extracted into a high-salt buffer (PRO-PREPTM protein extraction solution, iNtRON Biotechnology, Seongnam, Gyeonggi-Do, Korea) and centrifuged at 12,000 rpm for 10 min at 4°C. The quantitated total protein from each treatment was determined by Bradford assay (Bio-Rad protein assay kit; Bio-Ray Laboratories, Richmond, CA, USA). 23,24 Proteins from each treatment were resolved on an SDS-polyacrylamide gel via electrophoresis (SDS-PAGE) and transferred to nitrocellulose membranes (GE Healthcare, Piscataway, NJ, USA). The membranes were incubated with a blocking buffer of 5% nonfat dry milk in Tris-buffered saline (TBS) containing TBS-Tween-20 (TBS-T) for 1 h at room temperature and then incubated with the specific primary antibodies (anti-Fas, -cytochrome c, -AIF, -Endo G, -caspase 9 and -caspase 3, -Bax, and -Bcl-2). The membranes were washed, treated with appropriate horseradish peroxidase–conjugated secondary antibodies and visualized by a chemiluminescence detection kit (GE Healthcare, Princeton, NJ, USA). 18,24
cDNA microarray assay for gene expression of RAW 264.7 cells after exposure to citosol
RAW 264.7 cells (5 × 10⁵ cells/ml) were seeded in 6-well plates containing RPMI 1640 medium with 10% FBS for 24 h. Cells in each well were treated for 48 h with or without3 μg/ml of citosol. Then the cells from each treatment were harvested and the total RNA was extracted using Qiagen RNeasy Mini Kit (Qiagen, Inc, Valencia, CA, USA). 24,25 The isolated total RNA were used for cDNA synthesis and labeling, microarray hybridization, and followed by flour-labeled cDNA hybridized their complements on the chip (Affymetrix GeneChip Human Gene 1.0 ST array, Affymetrix, Santa Clara, CA, USA). Finally the resulting localized concentrations of fluorescent molecules were detected and quantitated (Asia BioInnovations Corporation). The resulting data were analyzed by Expression Console software (Affymetrix) with default RMA parameters. Genes regulated by citosol were determined with a twofold change. 26
Statistical analysis
Significance of mean values between citosol-treated group and control group was obtained using Student’s t test. Data were expressed as mean ± SD. The p value <0.05 was considered significant.
Results
Citosol induced cell morphological changes and decreased the percentage of RAW 264.7 viable cells
Morphological changes of RAW 264.7 cells after treatment with citosol were examined and investigated. The untreated cells (control) were maintained in original good shape. The incubation for 24 h at 3 μg/ml of citosol revealed condensation both in cytoplasm and nucleus and also apoptotic body appeared in the majority of cells (Figure 1). Citosol treatment led to cellular morphological changes and more cells floated on the well compared to the control. Results from flow cytometric assay are shown in Figure 2, and indicated that citosol decreased the percentage of viability and citosol at a concentration of 3–6 μg/ml led to a decrease of 55% and 81%, respectively. Also, the effective concentration for half-maximal response (EC50) values at 48 h exposure for citosol is 2.74 μg/ml using a PI exclusion method and flow cytometry. Hence, the dose of 3 μg/ml of citosol is close to EC50 and used for further examinations.
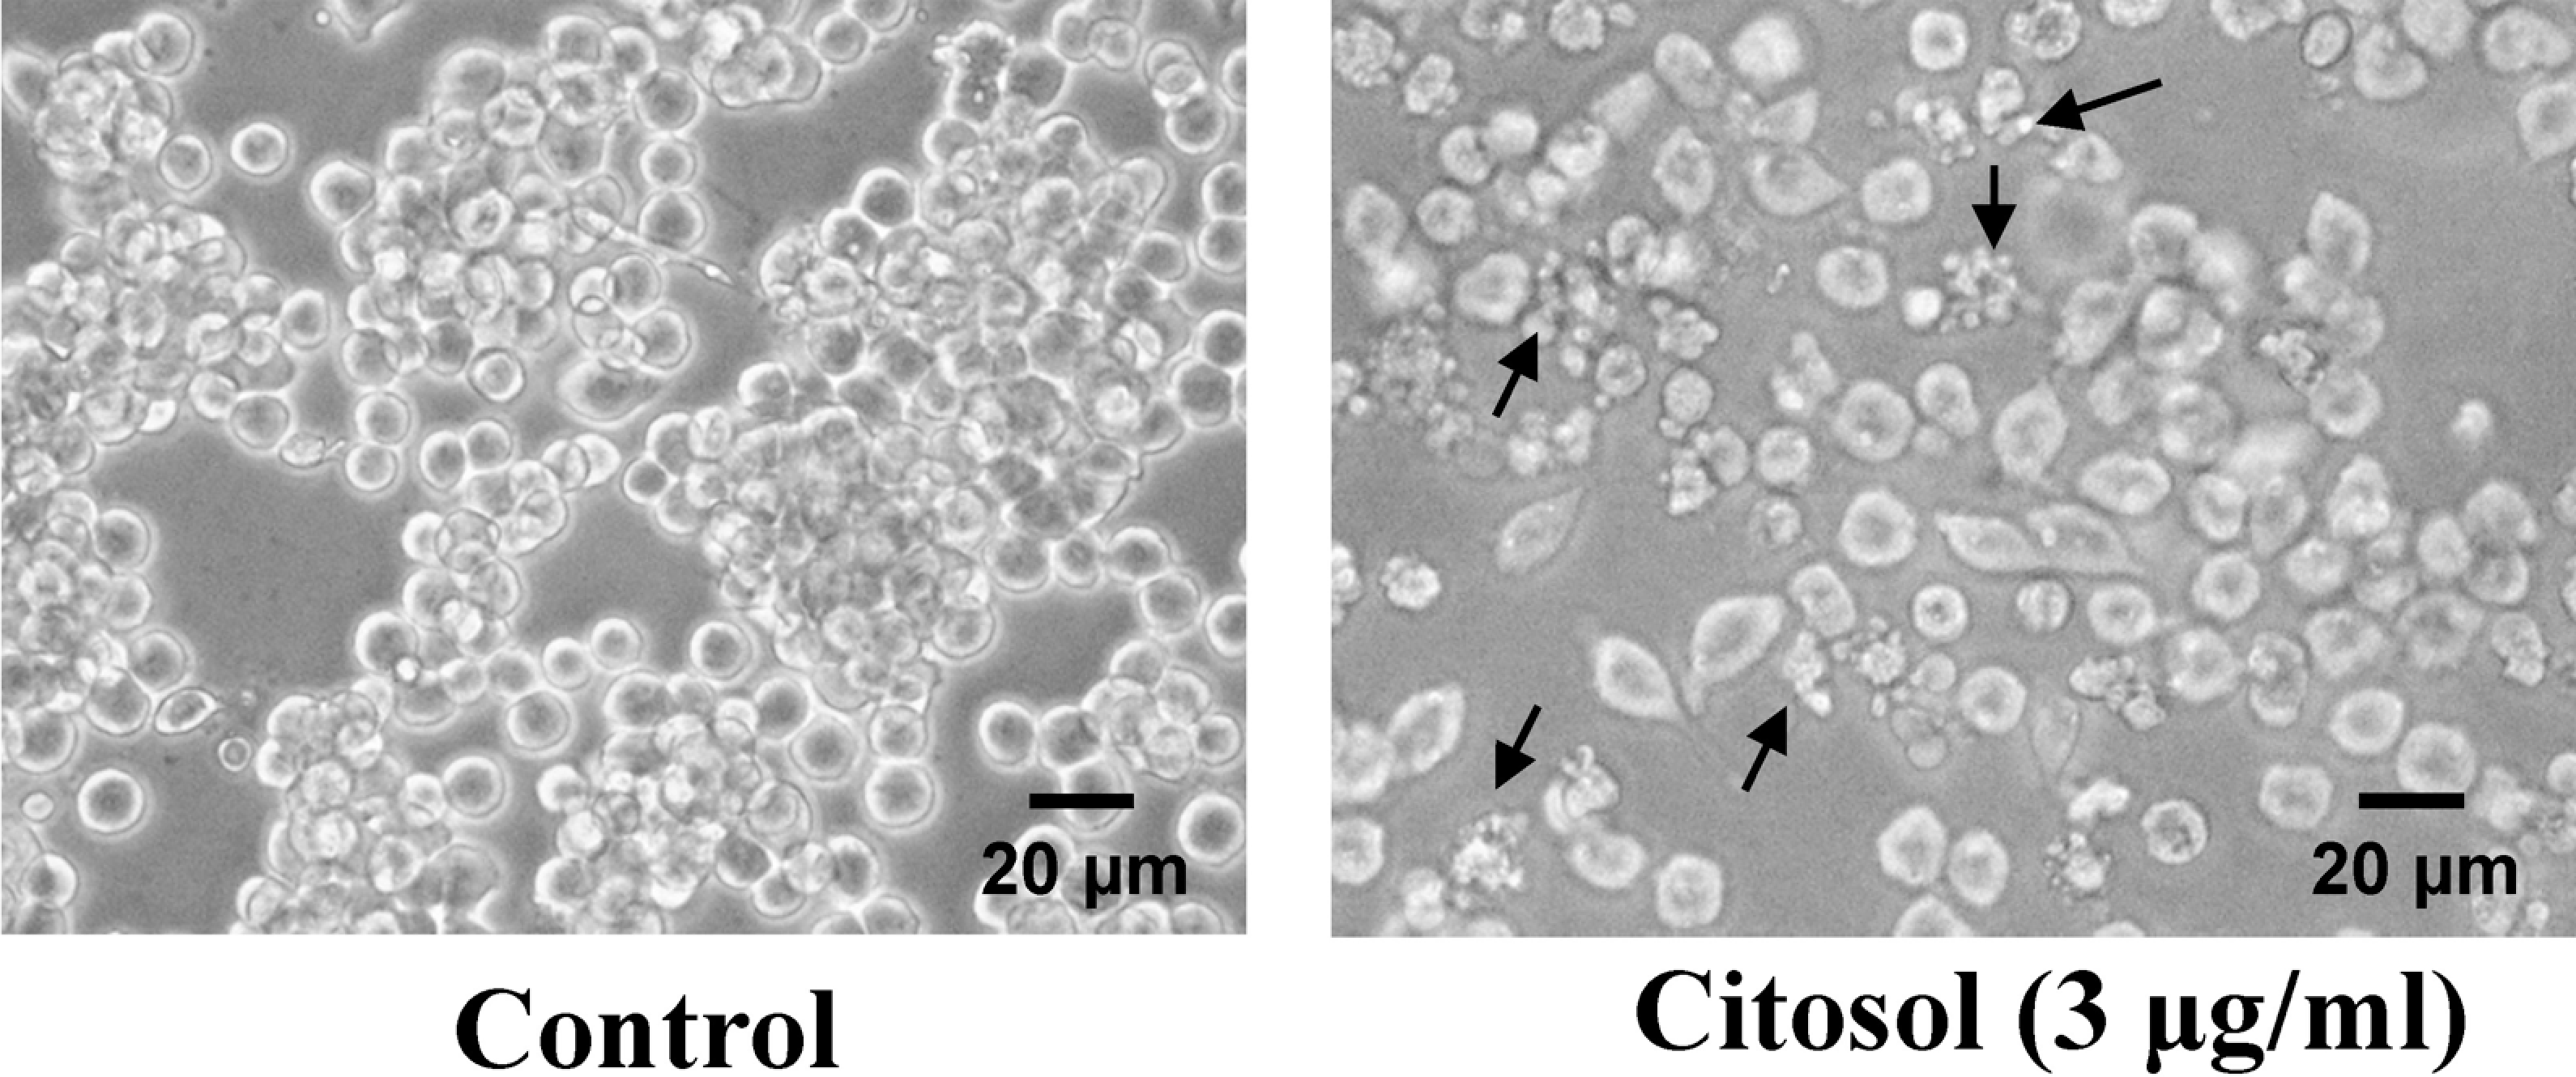
Citosol affected the cell morphology of RAW 264.7 cells. Cells cultured for 48 h with or without 3 μg/ml of citosol were examined for cell morphological changes and were photographed by a phase-contrast microscope as described in the section on Materials and methods. Scale bar, 20 μm.

Citosol decreased the percentage of viability on RAW 264.7 cells. Cells were incubated with various concentrations (0, 0.375, 0.75, 1.5, 3 and 6 μg/ml) of citosol for 48 h and examined for cell viability by a propidium iodide (PI) exclusion method. The total viable cells were counted by PI incorporation and flow cytometric analysis, as described in the section on Materials and methods. Each point is mean ± SD of three experiments. ***p < 0.001.
Citosol induced apoptotic bodies and DNA damage in RAW 264.7 cells
Citosol-induced cell morphological changes and the reduction in the total viable cells in RAW 264.7 cells were further investigated using fluorescence photomicrographs. RAW 264.7 cells were stained with DAPI after exposure to 3 μg/ml citosol for 48 h. The results are shown in Figure 3, which indicated that control cells were round with homogeneous nuclei, whereas citosol-treated cells showed apoptotic body (arrows; Figure 3).
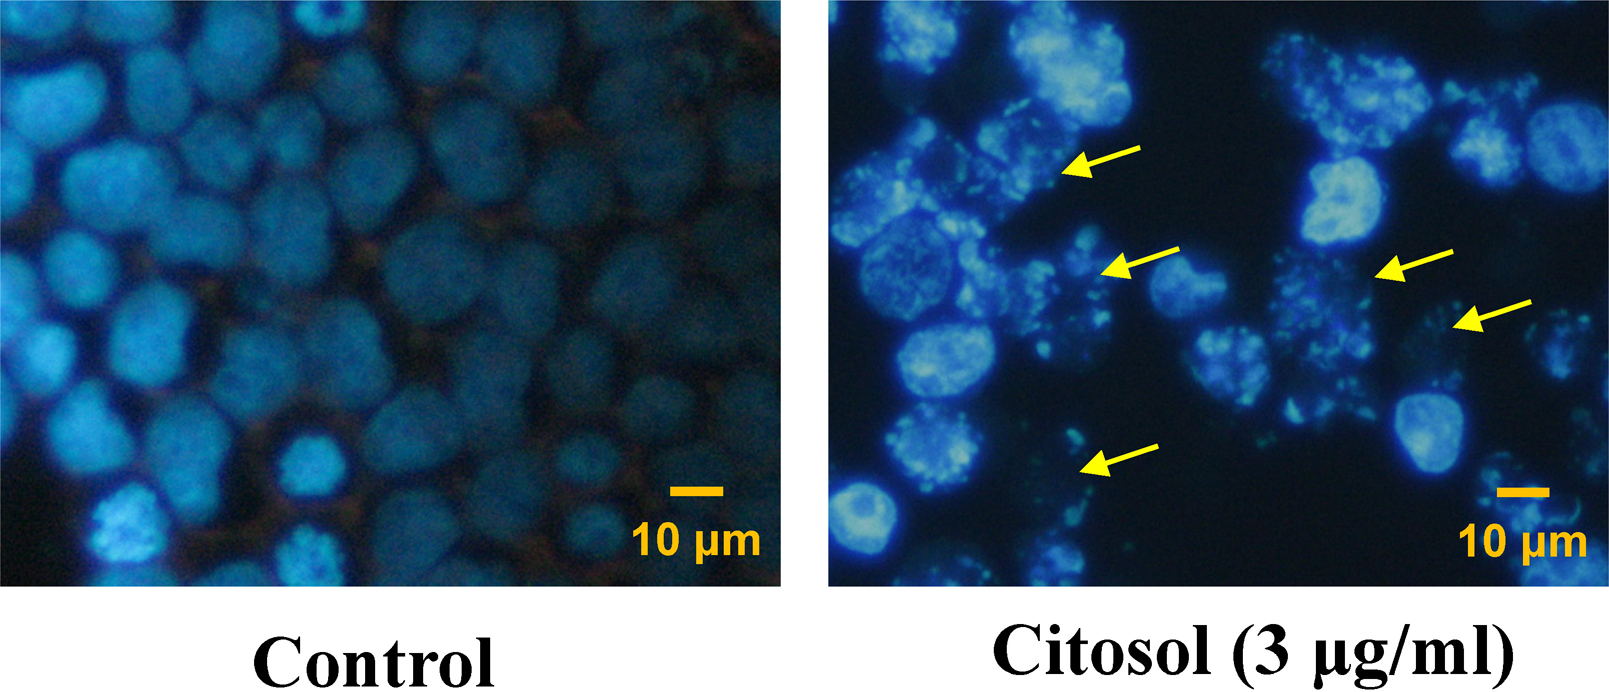
Citosol induced chromatin condensation and DNA fragmentation in RAW 264.7 cells. Cells were treated with 3 μg/ml concentration of citosol for 48 h, and chromatin condensation and DNA fragmentation (a characteristic of apoptosis) were examined by 4,6-diamidino-2-phenylindole (DAPI) staining then cells were photographed by fluorescence microscopy as described in the section on Materials and methods. Arrows indicated damaged cells with apoptotic cells. Scale bar, 10 μm.
Citosol changed the levels of proteins associated with apoptosis in RAW 264.7 cells
To examine whether citosol-induced apoptosis is related to the response of apoptosis-associated proteins, we investigated the effects of citosol on the levels of proteins associated with apoptosis in RAW 264.7 cells and the results were shown in Figure 4. The results indicated that citosol increased the protein levels of Fas/CD95, cytochrome c, AIF, Endo G, active form of caspase 9 and 3 and Bax, but it decreased the level of Bcl-xl in RAW 264.7 cells. Hence, we suggest that cytosol-triggered apoptotic death of RAW 264.7 cells is carried out through mitochondria- and caspase cascade-dependent signaling.

Citosol affected the levels of apoptosis-associated proteins of RAW 264.7 cells. Cells were treated with citosol at 3 μg/ml concentration for 48 and 72 h and then harvested for total protein determinations. The associated protein expressions (Fas, cytochrome c, AIF, Endo G, caspase 9 and 3, Bax, and Bcl-xl) were estimated by Western blotting as described in the section on Materials and methods. The protein level of β-actin was blotted as a protein-loading control.
cDNA microarray analysis for citosol-induced gene expression in RAW 264.7 cells
The microarray analysis showed that citosol increased 5 genes which were upregulated including Gm4884, Gm10883, Lce1c, Lrg1, and LOC100045878 and it inhibited 24 genes which were downregulated including Gm10679, Zfp617, LOC621831, Gm5929, Snord116, Gm3994, LOC380994, Gm5592, LOC380994, LOC280487, Gm4638, Tex24, A530064D06Rik, BC094916, EG668725, Gm189, Hist2h3c2, Gm8020, Snord115, Gm3079, Olfr198, Tdh, Snord115, and Olfr1249 in RAW 264.7 cells that were expressed at least by a twofold change when compared with the untreated control cells (Table 1). Moreover, the gene and mRNA descriptions, respectively, can be seen in Table 1. Overall, the results from cDNA microarray were classified based on the top scored by the number of pathways network from GeneGo analysis program which are shown in Figure 5. Thick cyan lines indicate the fragments of canonical pathways. These genes may also be involved in cell cycle arrest and apoptosis which are induced by citosol on RAW 264.7 cells.

The representative possible canonical pathways from RAW 264.7 cells after exposure to citosol. Cells were exposed to 3 μg/ml of citosol, were harvested and total RNA were extracted for cDNA microarray assay. Thick cyan lines indicate the fragments of canonical pathways. Upregulated genes are marked with red circles; downregulated with blue circles. The ‘checkerboard’ color indicates mixed expression for the gene between files or between multiple tags for the same gene (AKAP28: A-kinase anchor protein, 28 kD; CNGA1: cyclic nucleotide–gated channel alpha 1; CNGA2: cyclic nucleotide–gated channel alpha 2; CNGA3: cyclic nucleotide–gated channel alpha 3; CNGA4: cyclic nucleotide–gated channel alpha 4; KCNH2: potassium voltage–gated channel, subfamily H (eag-related), member 2; SDHL:
List of genes with at least twofold changes in mRNA levels in RAW 246.7 cells after exposure to citosol identified by cDNA microarray and scored b from GeneGo analysis

Discussion
Currently, citosol is one of the most common drugs for anesthesia in clinical use. 16,27 There is no information to show that citosol induced cytotoxic effects in mice cells. Moreover, there is no available information addressing whether citosol affects cellular processes related to cancer. However, there are no reports on the effects of citosol on apoptosis and associated gene expressions in mice leukemia cells. Herein, the present study is the first to show that citosol can induce cytotoxic effect including induction of apoptosis and the associated gene expression changes in mice leukemia cells.
In this study, our results demonstrated that citosol induced cell morphological changes, decreased the percentage of total viable cells, induced apoptotic bodies as well as changed the apoptosis-associate protein levels, and gene expressions in mice leukemia RAW 264.7 cells in vitro. The EC50 of citosol for cytotoxic effects is 2.74 μg/ml of cytosol for 48-h exposure (Figure 1). This is the first study to show that citosol at a concentration of 3–6 μg/ml can decrease the percentage of viable RAW 264.7 cells.
Much evidence revealed that agent- or chemical compound-induced cell death would have two characteristics: necrosis and apoptosis. 28,29 Furthermore, the character of apoptosis included chromatin condensation and DNA damage (DNA fragmentation), apoptotic body formation, and so on. 30,31 Thus, we used DAPI staining to show whether citosol could induce chromatin condensation and DNA damage, and the result showed that citosol triggered apoptosis in RAW 264.7 cells (Figure 3).
It is well known that the two apoptotic pathways are extrinsic and intrinsic pathways. 32,33 The extrinsic pathway involved the agent that induced Fas/CD95 and Fas-associated protein with death domain, which led to the activation of caspase 8 and 3, causing cell apoptosis. The intrinsic pathway involved the increase in Bax (a pro-apoptotic protein) and the decrease in Bcl-2 (an antiapoptotic protein) that cause mitochondrial dysfunction (decrease the levels of mitochondrial membrane potential) with consequent release of cytochrome c release and activation of caspase 9 and 3, causing cell apoptosis. 32,33 Therefore, we used Western blotting to examine whether citosol would affect apoptotic protein levels, and the results indicated that citosol promoted the levels of AIF and Endo G, and it also stimulated the level of cytochrome c in RAW 264.7 cells (Figure 4). These observations indicated that citosol induced apoptosis through a mitochondria-dependent pathway. Figure 4 also showed that citosol promoted the level of Bax and decreased the level of Bcl-xl, which implied that citosol decreased the level of mitochondrial membrane potential (ΔΨm). In the present study, our results showed that citosol decreased the level of Bcl-xl and promoted the level of Bax in RAW 264.7 cells, which affected the ratio of Bax/Bcl-2, leading to AIF and Endo G release from mitochondria. It was reported that some inducer of apoptosis could induce apoptosis through mitochondria and led to AIF and Endo G release, causing apoptosis. 34 It was also reported that the inducer of apoptosis decreased the ratio of Bax and Bcl-xl and led to mitochondrial dysfunction thereby releasing AIF and Endo G, causing apoptosis. 35,36
To confirm the cytotoxic effects of citosol on apoptotic proteins involved in the associated gene expression in RAW 264.7 cells, we used cDNA microarray to examine the gene expression from RAW 264.7 cells after exposure to citosol, and our results showed that citosol significantly promoted the expression of 5 genes, including Gm4884, Gm10883, Lce1c, Lrg1, and LOC100045878, but it significantly inhibited the expression of 24 genes, including Gm10679, Zfp617, LOC621831, Gm5929, Snord116, Gm3994, LOC380994, Gm5592, LOC380994, LOC280487, Gm4638, Tex24, A530064D06Rik, BC094916, EG668725, Gm189, Hist2h3c2, Gm8020, Snord115, Gm3079, Olfr198, Tdh, Snord115, and Olfr1249 in RAW 264.7 cells as can be seen in Figure 5 and Table 1.
In conclusion, based on these observations, citosol induced cytotoxic effects and the protein levels and gene expressions in mice leukemia RAW 264.7 cells in vitro, and our study is the first to show the cytotoxic and gene regulatory effects of citosol on mice leukemia RAW 246.7 cells.
Footnotes
Funding
This work was supported by the grant DOH100-TD-C-111-005 from Taiwan Department of Health, China Medical University Hospital Cancer Research Center of Excellence.