
Abstract
Study background: Fluorosis is one of the manifestations of chronic poisoning from long-term exposure to high levels of fluoride. An estimated 62 million people in 17 states in India are affected with dental and skeletal fluorosis. Objective: To evaluate the cytological morphology of exfoliated oral mucosal cells among various stages of fluorosis patients compared with controls. Design and methods: Exfoliative cytology PAP-stained smears of 21 cases of fluorosis and 21 controls subjected to morphometric analysis using image Proplus software. For the assessment parameters like maximum and minimum diameter of the nucleus, cell and perimeter of the cell and nucleus were considered. Results: An increase in maximum and minimum diameter of nucleus, perimeter of nucleus and cell in cases when compared to controls. Conclusions: Fluorosis induces oxidative stress, DNA damage and apoptosis which can be the reasons for the increase in the nuclear size and decrease in the cell size. Community dental and medical programmes should be stringently implemented in fluorosis-endemic areas, to create awareness regarding the toxic effects of fluoride to the body, especially within the oro-facial region.
Introduction
Fluorosis is one of the manifestations of chronic poisoning from long-term exposure to high levels of fluoride and is a serious health problem in many parts of the world where drinking water contains more than 1–1.5 ppm of fluoride. Moderate amounts lead to dental defects, but long-term ingestion of large amounts can lead to potentially severe skeletal problems. An estimated 62 million people in 17 states in India are affected with dental and skeletal fluorosis. 1
Non-skeletal fluorosis is an abnormal condition caused by excessive accumulation of fluoride other than skeletal and dental structures. Furthermore, fluoride is also known to cross the cell membrane and enter
Although fluorosis is irreversible, it could be prevented by appropriate and timely intervention through understanding the process at biochemical and molecular levels.
Our study was designed to evaluate the cytological morphology of exfoliated oral mucosal cells among various stages of fluorosis patients compared with controls.
The findings from our study could throw new light on whether local environment in the oral cavity will predict the course of fluorosis including the extent of severity expected in future.
Materials and methods
A total of 21 cases of fluorosis were taken for the present study along with 21 control cases, from endemic fluoride area, Aadi Andhra Colony, Kandukur (mandal), Ongole (dt), Andhra Pradesh (state). The cases were categorized according to the WHO classification of fluorosis.
Study group
Group 1: Mild-7 cases-age group of 9–12 years.
Group 2: Moderate-7 cases-age group of 9–12 years.
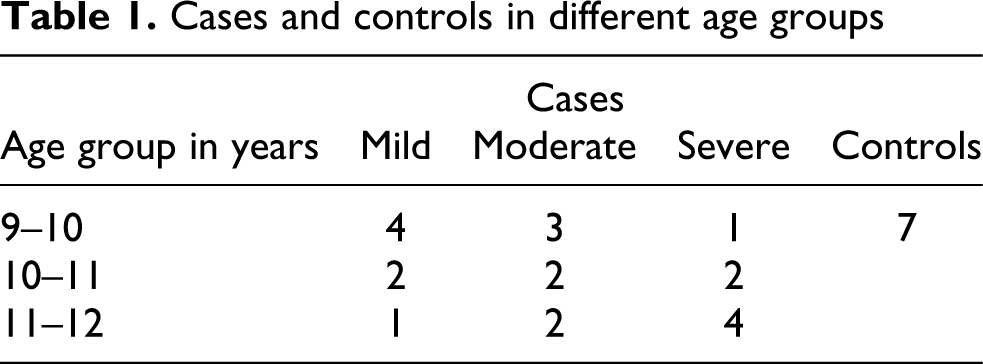
Group 3: Severe-7 cases-age group of 9–12 years (Table 1 ).
Cases and controls in different age groups
Control group
The control group comprised of 21 cases, age- and sex-matched subjects, who had no history of intrinsic and extrinsic stains. All the reference subjects were free from any concomitant systemic diseases. An informed consent was obtained from both cases and control groups. A predetermined data sheet was used to record demographic, data, history, clinical findings and details of drinking water source. All the 21 control cases were selected from non-endemic fluoride area of Chennai, Tamil Nadu state of south India.
Inclusion criteria
Normal: the enamel surface is smooth, glossy and usually a pale creamy-white color.
Questionable: the enamel shows slight abrasions from the translucency of normal enamel, which may range from a few white flecks to occasional spots.
Very mild
Mild
Moderate
Severe

(a) Photomicrograph showing clinical appearance of different categories of fluorosis, (b) measurement of nucleus and cells using image analysis software in mild cases of fluorosis (PAP staining ×20), (c) measurement of nucleus and cells using image analysis software in moderate cases of fluorosis (PAP staining ×20) and (d) measurement of nucleus and cells using image analysis software in severe cases of fluorosis (PAP staining ×20).
The recording was made on the basis of the two teeth that are most affected. If the two teeth were not equally affected, the score for the less affected of the two should be recorded.
Exclusion criteria
Exclusion criteria were taken by categorizing into extrinsic and intrinsic stain producing defects/factors over the teeth.
Extrinsic stain produced due to tobacco, food and beverages, medication, bacterial stains, gingival hemorrhage and restorative materials were excluded.
Intrinsic stain producing defects/factors such as amelogenesis imperfecta, dentinogenesis imperfecta, medications, erythropoietic porphyria, hyperbilirubinaemia, localized RBC breakdown and internal resorption were excluded, cases with fluorosis alone were included.
Collection of samples
After categorization of the cases into three groups, samples of buccal mucosa smears were made by scraping with flat wooden sticks (exfoliative cytology). The smears which are fixed with 100% alcohol were subjected to rapid PAP staining procedure. The protocol was reviewed and approved by an appropriate Institutional Review Board (Institutional Ethical Committee, Saveetha University, Chennai).
Morphometry
After preparation of slides, the sections were subjected to morphometric analysis. For morphometric analysis, images were captured using a 3-chip CCD camera attached to a trinocular research microscope with a 20×objective.
Microscopic fields were selected randomly, commencing with first field on the left-hand side of the section, then moving the stage to the next field, and then continuing the selection to include a minimum of 4–5 fields from each section. The measurements were done using image Proplus V-4.1.0.0 (Media Cybernetics inc, Bethesda MD, USA).
The outline of cells and nuclei were a complete outline could be clearly seen was traced on the screen using a mouse pointer with reduced movement. For the purpose of statistical analysis only 5 cells with the largest area were selected in each representative field of particular compartment. The largest were selected on the assumption that the plane of section would have passed through the center of cells and nuclei and thus would more closely represent the actual size.
For the assessment of the differences between the cases and the controls, six parameters were selected, including maximum and minimum diameter of the nucleus, maximum and minimum diameter of the cell and perimeter of the cell and nucleus (Figure 1b–d). A total of 840 cells were assessed for various parameters.
Statistical analysis
The various data obtained from the study were compared using parametric test namely one-way ANOVA. This method was used in spite of the sample size being less than 30 because the samples followed a normal distribution pattern. Multiple comparisons between the groups were assessed for statistical significance using Tukey HSD test.
Results
Comparison in morphological and cellular changes between normal individual’s buccal smears and individuals affected with mild, moderate, severe fluorosis using the above-mentioned parameters with morphometric analysis.
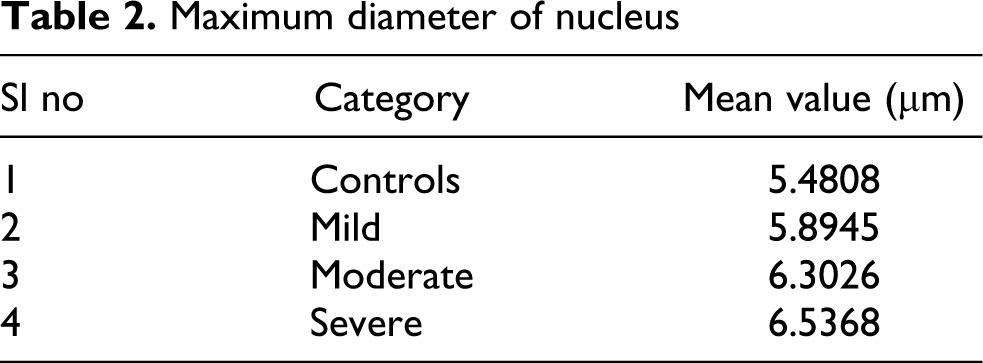
Maximum diameter of nucleus
The mean value of maximum diameter of the nucleus was increased when compared to controls (Table 2 ; Figure 2). The results indicate that p value is found to be statistically significant between controls and the categorized groups and within the categorized groups (Table 3 ).
Maximum diameter of nucleus
Maximum diameter of nucleus (p values)


Maximum diameter of the nucleus among the study groups.
Minimum diameter of nucleus
The mean value of minimum diameter of the nucleus was much higher in fluorosis cases when compared to controls (Table 4 ; Figure 3). The p values were found to be statistically significant between controls and the categorized groups and within the categorized groups (Table 5 ).
Minimum diameter of nucleus

Minimum diameter of nucleus (p values)


Minimum diameter of the nucleus among the groups.
Perimeter of nucleus
The perimeter of the nucleus demonstrated increased mean value in the various categories of fluorosis cases when evaluated against the controls (Table 6 ; Figure 4). The p value was statistically significant among controls and the categorized groups and within the categorized groups (Table 7 ).
Perimeter of nucleus

Perimeter of nucleus (p values)

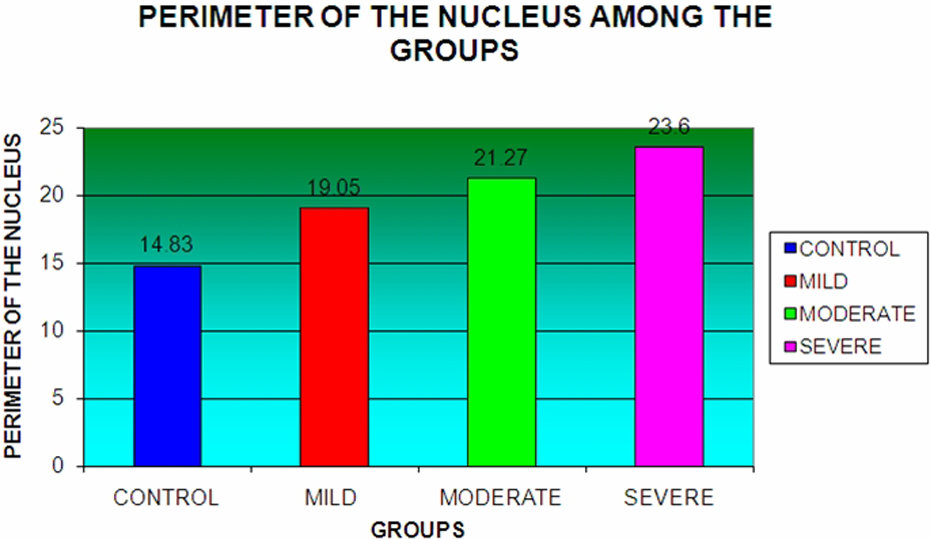
Perimeter of the nucleus among the study groups.
Maximum diameter of the cell
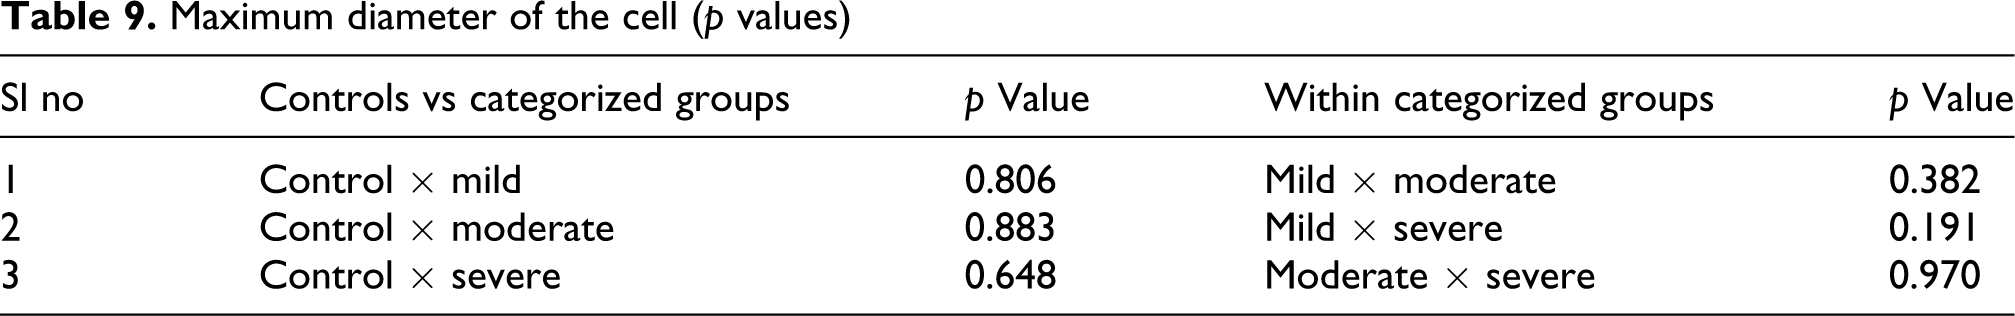
Maximum diameter of the cell in moderate and severe cases of fluorosis demonstrated slightly higher mean value when compared to controls, whereas in mild cases the values were slightly lower than controls (Table 8 ; Figure 5). The p values were also found to be statistically not significant (Table 9 ).
Maximum diameter of the cell

Maximum diameter of the cell (p values)
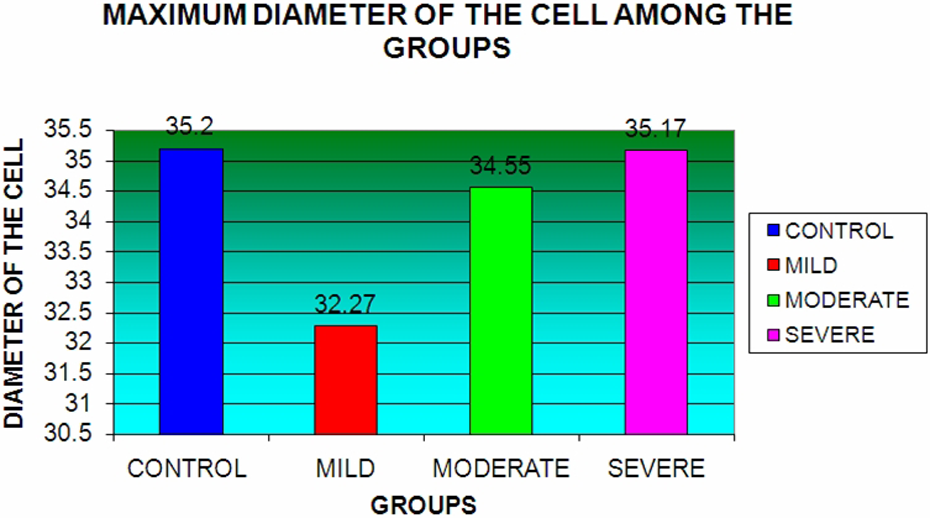
Maximum diameter of the cell among the groups.
Minimum diameter of the cell
The mean value of minimum diameter in all three categories of fluorosis cases were less when compared to controls group (Table 10 ; Figure 6). Statistical analysis was not significant between controls and the categorized groups and within the categorized groups (Table 11 ).
Minimum diameter of the cell

Minimum diameter of the cell (p values)


Minimum diameter of the cell among the groups.
Perimeter of the cell
The mean values of cell perimeter were slightly above when compared to the controls. In contrast, mild fluorosis cases showed lesser values when compared to normal (Table 12 ; Figure 7). The p values were found to be statistically not significant (Table 13 ).
Perimeter of the cell

Perimeter of the cell (p values)

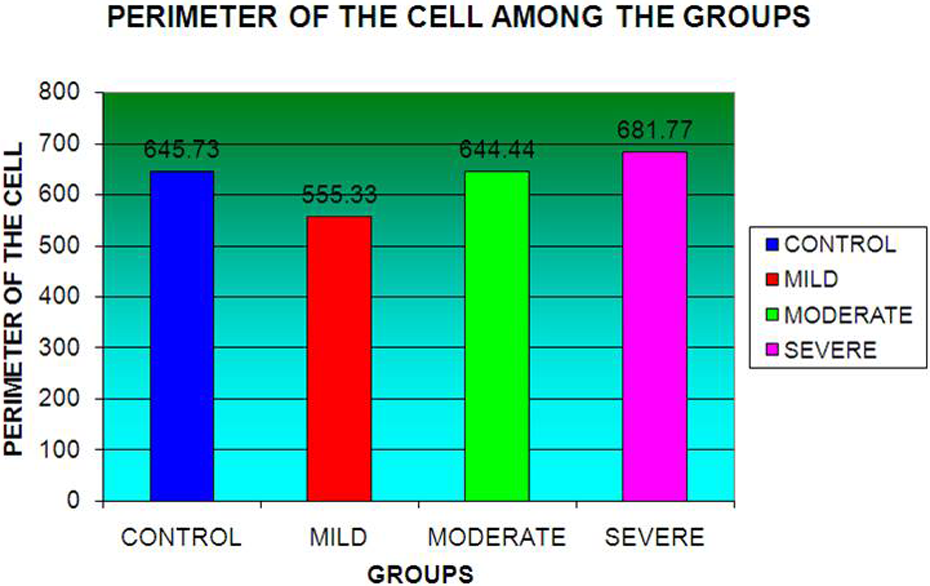
Perimeter of the cell among the groups.
Discussion
India is one of the countries where fluorosis is most endemic. 2 Fluoride intoxication causes damage to osseous tissue and soft tissues. There are many reports on the mechanisms of skeletal and dental fluorosis, but cellular and nuclear alterations of soft tissue has not been clarified. 3,4
Our study consisted of 21 fluorosis-affected individuals, categorized into mild, moderate and severe categories, based on criteria given by WHO-approved Dean’s fluorosis index (DFI) along with 21 controls. The reason for selecting the 9–12 years age range is that these individuals are infrequently associated with habits and were in their growth period. The effect of fluoride on the tissue can be better elucidated at this stage.
In our study, we collected the samples using exfoliative cytology where the technique has added advantages of being noninvasive, adjuvant to biopsy, rapid and mass screening. Also, this technique is helpful in providing well-demarcated individual cells with proper outline of the nucleus and the cell, which allows the appropriate measurement of the volume and surface area of the nucleus and the cell.
The parameters, maximum diameter of the nucleus and the cell and minimum diameter of the nucleus and the cell were used to assess the changes in the volume of the nucleus and the cell, respectively. Perimeter of the nucleus and the cell were used to assess the changes in surface area of the nucleus and cell. All these parameters reflect the activity of the cell.
Our study has demonstrated that there is an increase in mean values of maximum and minimum diameter of the nucleus in fluorosis subjects when compared to controls, which is statistically significant ( p = 0.000).
The increase in the maximum and minimum diameter of the nucleus in fluorosis subjects could be due to chronic exposure to fluoride which causes significant increase in chromosome aberrations and aberrant metaphase percentages in cells. These chromosomal aberration leads to increase in size of the diameter of the nucleus and could be attributed for the increase in the maximum and minimum diameter of the nucleus. 5
When the maximum diameter of the nucleus was compared between different grades of fluorosis subjects, it was found that mean value increases as the condition progresses from mild to severe because the values were statistically significant. These results indicate that maximum diameter of the nucleus increases in relation to severity of fluoride toxicity. As mentioned earlier, increase in fluoride levels causes chromosomal aberrations leading to increase in size. As the fluoride levels would increase with the severity of fluorosis (mild–severe), the nuclear changes follow the suite.
When the minimum diameter of the nucleus was compared between different grades of fluorosis subjects, it was found that mean values increases as the condition progresses from mild to severe though the p values are not significant. The results indicate that minimum diameter of the nucleus proportionally increases with the severity of fluoride toxicity.
Our study has demonstrated that there is an increase in mean value of perimeter of the nucleus in fluorosis subjects when compared to controls which is statistically significant ( p = 0.000). The increase in the perimeter of the nucleus in fluorosis subjects could be due to the morphological changes in the nucleus characterized by dilation of nuclear envelope and endoplasmic reticulum which are the characteristic features in the early stages of apoptosis. 6 Chronic exposure to fluoride causes cell damage by inhibiting glycolysis, because the fluoride ions inhibit the action of the enzyme enolase, which is necessary for glycolysis. 7 So when the levels of fluoride are increased, it leads to inhibition of glycolysis ultimately leading to apoptosis. 8
When the perimeter of the nucleus was compared between different grades of fluorosis subjects, it was found that mean value increases as the condition progresses from mild to severe cases, which were statistically significant. This could be due to the early nuclear signs that occur during apoptosis and with the already existing chromosomal aberrations.
Our study has demonstrated that there is a decrease in mean value of maximum and minimum diameter of the cell in fluorosis subjects when compared with controls which is statistically not significant ( p = 0.205). The decrease in maximum and minimum diameter of the cell could be explained as follows, F has been shown to enhance an intracellular concentration of Ca2+. 9 The increased levels of calcium lead to cytoskeletal damage and increased phospholipase activation resulting in phospholipids degradation, ultimately leading to the membrane damage. Thus, the diameter of the cell is decreased due to membrane collapse or shrinkage.
When the maximum and minimum diameter of the cell were compared between different grades of fluorosis subjects, it was found that mean value increases as the condition progresses from mild to severe, though the values were statistically not significant. The increased fluoride levels can lead to the increase in intracellular calcium. The increased calcium levels may not be sufficient enough to cause the membrane collapse and decrease in size of the cell.
Our study has demonstrated that there was a decrease in mean value of perimeter of the cell in fluorosis subjects when compared with controls. The perimeter of the cell is decreased in compliance with the decrease in maximum and minimum diameter of the cell. This can also be attributed to the increase in fluoride causing changes in the intracellular calcium and membrane damage. Another reason can be there is increase in the reactive oxygen species due to decrease in superoxide dismutase (SOD) levels, which will also lead to membrane damage and shrinkage of the cell.
When the perimeter of the cell was compared between different grades of fluorosis subjects, it was found that mean values increases as the condition progresses from mild to severe though the values were statistically not significant. This could be due to increase in fluoride levels, which causes changes in the intracellular calcium. But the increase in calcium level was not enough to cause the damage to membrane.
Studies have shown that fluoride can induce excessive production of oxygen free radicals and decrease the biological activities of some substances, such as catalase, SOD, xanthine oxidase and glutathione peroxidase, which play an important role in antioxidation and eliminating free radicals. 2 Karaoz et al. 10 showed that chronic fluorosis can lead to lipid peroxidation and kidney tissue change in first- and second-generation rats. Our results displayed that excess fluoride could induce oxidative stress in the cells of oral mucosa.
Data from the various surveys and laboratory investigations support water fluoridation as being causal for cancer in the oral cavity and pharynx. 11 The observation of our study has revealed that cellular alterations do occur apart from the clinically evident changes especially in severe cases of fluorosis. These cellular changes may possibly eventuate into dysplastic alterations, which can progress to oro-pharyngeal carcinomas.
The population under study was below the poverty line and owing to their ignorance and illiteracy those individuals were unaware about the toxic consequences of fluoride. In these geographic belts, defluoridation programmes should be strictly employed to remove the excess fluoride in the drinking water and thereby reduce the noxious effects of fluoride in oral soft tissue cells. Community dental and medical programmes should be stringently implemented in these areas, to create awareness regarding the toxic effects of fluoride to the body, especially within the oro-facial region.
To conclude, in our study individuals with severe fluorosis showed well-established hazardous changes both in dental structures and oral soft tissue cells. In the mild and moderate groups, there were well-established dental abnormalities along with signs of continuous deleterious effect on the oral soft tissues, including increase in the nuclear size and decrease in the cell size. Fluorosis induces oxidative stress, DNA damage and apoptosis, which can be the reasons for the increase in the nuclear size and decrease in the cell size. To the best of our knowledge, this is the first study of its kind analyzing the cellular and morphological alterations of oral mucosal cells in fluorosis patients using morphometry.
Footnotes
This research received no specific grant from any funding agency in the public, commercial, or not for-profit sectors.