
Abstract
Palsa mires are located at the southern border of the permafrost region. Rising temperatures have led to widespread permafrost thaw and rapid palsa and peat plateau degradation. Palsa mires store significant amounts of carbon (C), which is released when permafrost thaws, potentially changing the peatlands from long-term C sinks to temporary C sources. To improve predictions of how palsa mires will respond to ongoing climate change, a better understanding of their past dynamics is vital. Here, we reconstruct the permafrost history of a peat plateau in Karlebotn, northern Norway, using a multiproxy approach. A peat profile was dated by accelerator mass spectrometry radiocarbon method, and analyzed for oribatid mite communities, peat type and peat properties. Oribatid mite analysis is a relatively novel method suggested as a proxy for permafrost initiation. Here, we compared it to more established approaches based on peat characteristics and vegetation changes. Our results suggest that gradual permafrost aggradation at the site began after ca. 1000 calibrated years Before Present (cal year BP; present = 1950 AD) with stable permafrost conditions established by ca. 400 cal year BP. Three peatland succession phases were identified: the first wet fen phase, a transitional phase with wet and dry condition taxa and the last phase dominated by species typical of dry and permafrost-associated conditions.
Our results show that integrating oribatid mite analysis into paleoecological studies offers a more robust reconstruction of past permafrost dynamics, thereby enhancing our understanding of the past, present and future development of palsa mires.
Introduction
Arctic temperatures are rising nearly three times faster than the global average, driving fundamental changes in Arctic ecosystems (AMAP, 2021; Zhou et al., 2024). Permafrost, ground that remains below 0°C for at least two consecutive years, is highly sensitive to Arctic warming and is currently thawing at an accelerated rate. Permafrost covers about 15% of the Northern Hemisphere (Obu, 2021). In the Arctic, continuous permafrost dominates but gradually changes into discontinuous, sporadic and isolated patches toward milder climates (Obu, 2021). Northern peatlands play a significant role in global carbon (C) cycling (Loisel et al., 2014) acting as major C sinks, capturing carbon dioxide (CO2) through photosynthesis while also emitting methane (CH4) due to their waterlogged, anaerobic conditions (Frolking et al., 2011). Estimates suggest that permafrost peatlands store around 185 Pg C forming a significant part of total soil organic C stocks (Hugelius et al., 2020). Climate projections predict that a 6°C rise in global mean annual air temperature could lead to nearly complete disappearance of peatland permafrost (Hugelius et al., 2020). As permafrost thaws, peatlands may shift from C sinks to C sources, releasing stored carbon as CO2 and CH4 through increased microbial decomposition and thermokarst formation, further amplifying climate change (Hugelius et al., 2020; Loisel et al., 2021; Schuur et al., 2015; Zhang, 2018).
Palsa mires are commonly found in northern Fennoscandia (Luoto et al., 2004; Ruuhijärvi and Tuominen, 2022; Seppälä, 2011), and can consist of both palsas and peat plateaus containing a frozen core. Palsas are typically 2–5 m high, dome-shaped, and with smaller diameter, while peat plateaus, that can be considered as a morphological type of palsas (Åhman, 1977), have a flatter surface and cover larger areas. In northern Europe, regions with mean annual temperatures between −3°C and −5°C and low precipitation, typically below 450 mm are optimal for palsas (Luoto et al., 2004). Besides temperature and precipitation, snow cover and wind affect their formation (Seppälä, 2011). Palsas go through a natural cycle of formation, growth, and eventual collapse (Seppälä, 2011). However, under current climate conditions, they are degrading more rapidly than new are forming. Because palsa mires are found at the southern margin of the permafrost region, they are particularly sensitive to climate change (Fronzek et al., 2006; Luoto et al., 2004). A recent study estimated that the palsa and peat plateau area in Finnmark has decreased by 33%–71% since the 1950s (Borge et al., 2017). In Finland, observations suggest a 60%–70% decrease in palsa area and 10%–30% decrease in peat plateau area, with projections indicating their complete disappearance by mid-century (Ruuhijärvi and Tuominen, 2022). Another recent study in Finland by Verdonen et al. (2023) observed a more than 75% decrease in palsa area from 1959 to 2021. Similarly, in Sweden, palsa cover has declined by up to 54% since 1955, attributed to warmer, wetter and shorter winters (Olvmo et al., 2020). Climate models suggest that even minor increases in temperature and precipitation will continue to impair palsa-forming conditions (Fronzek et al., 2006).
Understanding the historical dynamics of palsa mires is essential for predicting their future in a changing climate. Moreover, increased knowledge of the past will help in assessing the impact of warming on their C stocks and estimating the potential future C emissions. Traditional methods such as plant macrofossil analysis together with radiocarbon (14C) dating have been used to reconstruct past permafrost conditions (Oksanen, 2006; Oksanen and Väliranta, 2006). In these cases, interpretations rely on the replacement of wet fen vegetation by dry hummock vegetation as an indicator of permafrost aggradation (Oksanen and Väliranta, 2006). For instance, a shift from wet adapted Sphagnum taxa to dry tolerant species, particularly S. fuscum, is widely interpreted as evidence for the initial onset of permafrost aggradation (Oksanen, 2006; Sannel and Kuhry, 2008). Similarly, increased abundances of dwarf shrubs, ericaceous rootlets, lichens, together with Polytrichum spp. are indicative of dry palsa and peat plateau conditions (Heffernan et al., 2020; Oksanen, 2006; Pelletier et al., 2017; Sannel and Kuhry, 2008). However, the determination of the exact timing of the permafrost initiation is limited by the absence of permafrost-specific plant species (Oksanen and Väliranta, 2006). Moreover, as peatland surfaces transition from wet anaerobic to dry aerobic conditions during frost heave, the degree of decomposition is often high, making it difficult to infer the vegetation composition and to find good material for 14C dating (Hichens-Bergström and Sannel, 2023; Kjellman et al., 2018). Dating of actual initiation of permafrost is also often hampered by hiatuses in peat deposition related to surface emergence (Väliranta et al., 2021). Permafrost aggradation is further associated with distinct changes in peat properties. Carbon-to-nitrogen (C/N) ratio is elevated in permafrost-affected peatlands in comparison to permafrost-free peatlands (Pelletier et al., 2017; Sannel and Kuhry, 2009; Treat et al., 2016). N content is significantly lower in permafrost-affected peatlands (Treat et al., 2016). Additionally, some studies report increased bulk density (BD) during the transition from aapa mire to peat plateau conditions (Heffernan et al., 2020). Although peat properties can provide valuable information on environmental conditions, they should be considered more as supporting rather than definite indicators of permafrost conditions and interpreted in combination with other proxies. As temperatures are rising rapidly, there is a need for bioindicator species that can be used for determining the past changes in permafrost peatlands and associated shifts in biological and C regimes. As a supplementing proxy for these environments, recent studies suggest that oribatid mites (Acari: Oribatida) may serve as effective bioindicators of permafrost dynamics (Markkula et al., 2018; Markkula and Kuhry, 2020). Oribatid mites are soil-dwelling arthropods that exhibit high species diversity and abundance across various soil types—including extremely dry soil (Maraun et al., 2007; Schatz and Behan-Pelletier, 2008; Seniczak, 2011) and are sensitive to changes in moisture levels and other environmental conditions (Gao et al., 2016; Markkula, 2014; Minor et al., 2016). They play an essential role in peatland ecosystems, including nutrient cycling and organic matter decomposition (Schneider et al., 2004; Siepel and Maaskamp, 1994).
Many oribatid mite species have a narrow microhabitat preference, and their distribution is closely linked to variations in moisture levels, vegetation structure, pH, and food resources (Gao et al., 2016; Markkula, 2014; Minor et al., 2016). Recent studies have shown that shifts in oribatid mite communities correspond with the initiation and degradation of permafrost (Markkula et al., 2018; Markkula and Kuhry, 2020). During the transition from wet fen vegetation to dry hummock vegetation associated with permafrost aggradation, oribatid communities undergo clear shifts in species composition, with certain species becoming dominant after permafrost is established. Particularly Carabodes labyrinthicus, Neoribates aurantiacus and Chamobates borealis were observed to indicate permafrost occurrence (Markkula et al., 2018; Markkula and Kuhry, 2020). Consistently, permafrost degradation was indicated by the disappearance of C. labyrinthicus and N. aurantiacus (Markkula and Kuhry, 2020). These studies suggest that in comparison to other proxies, oribatid mites could provide valuable insights into past permafrost dynamics, offering a more detailed record of long-term environmental change.
In this study, we introduce a novel multiproxy approach to study permafrost aggradation and dynamics of a peat plateau in northern Norway. We perform oribatid mite, peat type and peat property analyses for each sample. Moreover, an age-depth model, with 6 dates per 85 cm profile is established using accelerator mass spectrometry (AMS) 14C dating. Earlier studies suggest that the oldest palsas in northern Fennoscandia formed ca. 2700–2500 cal year BP (Kokfelt et al., 2010; Oksanen, 2006), but most palsas and peat plateaus formed after ca. 850 cal year BP, making them less than 1000 years old (Kjellman et al., 2018; Kokfelt et al., 2010; Oksanen, 2006; Sannel et al., 2018; Zuidhoff and Kolstrup, 2000). Previous research has primarily relied on plant macrofossil analysis to reconstruct permafrost history (Kjellman et al., 2018; Kokfelt et al., 2010; Oksanen, 2006; Sannel et al., 2018; Zuidhoff and Kolstrup, 2000). Our study compares different proxies to resolve the timing of permafrost aggradation: (1) oribatid mites, (2) peat type and (3) peat properties. Testing, developing and integrating new bioindicators with established proxies, such as detailed plant macrofossil analyses, will enhance the reliability of interpretations of past peatland dynamics. Our objectives are to provide a chronological overview of the development succession, and to analyze species composition and abundance of oribatid mites at different depths and associated successional stages of the peat sequence. By combining biological data with peat type analysis and peat property measurements, we aim to determine the timing of permafrost aggradation and overall peatland dynamics. Additionally, 14C dating in conjunction with peat property analysis allow the reconstruction of C accumulation rates over different succession stages.
Materials and methods
Study site and field work
The study site is located at Karlebotn (70°07’13.1″N, 28°28’28.3″E, 28 m a.s.l) in Finnmark county in northern Norway (Figure 1). The sampling site represents a peat plateau, which is situated close to the Varangerfjord. At the coast, the climate is relatively wet and mild. At Vardø Radio weather station, which is located about 100 km east of Karlebotn, the long-term mean annual air temperature is +2.5°C and the mean annual precipitation is 610 mm/year (1993–2023; Norwegian Center for Climate Services, 2025).
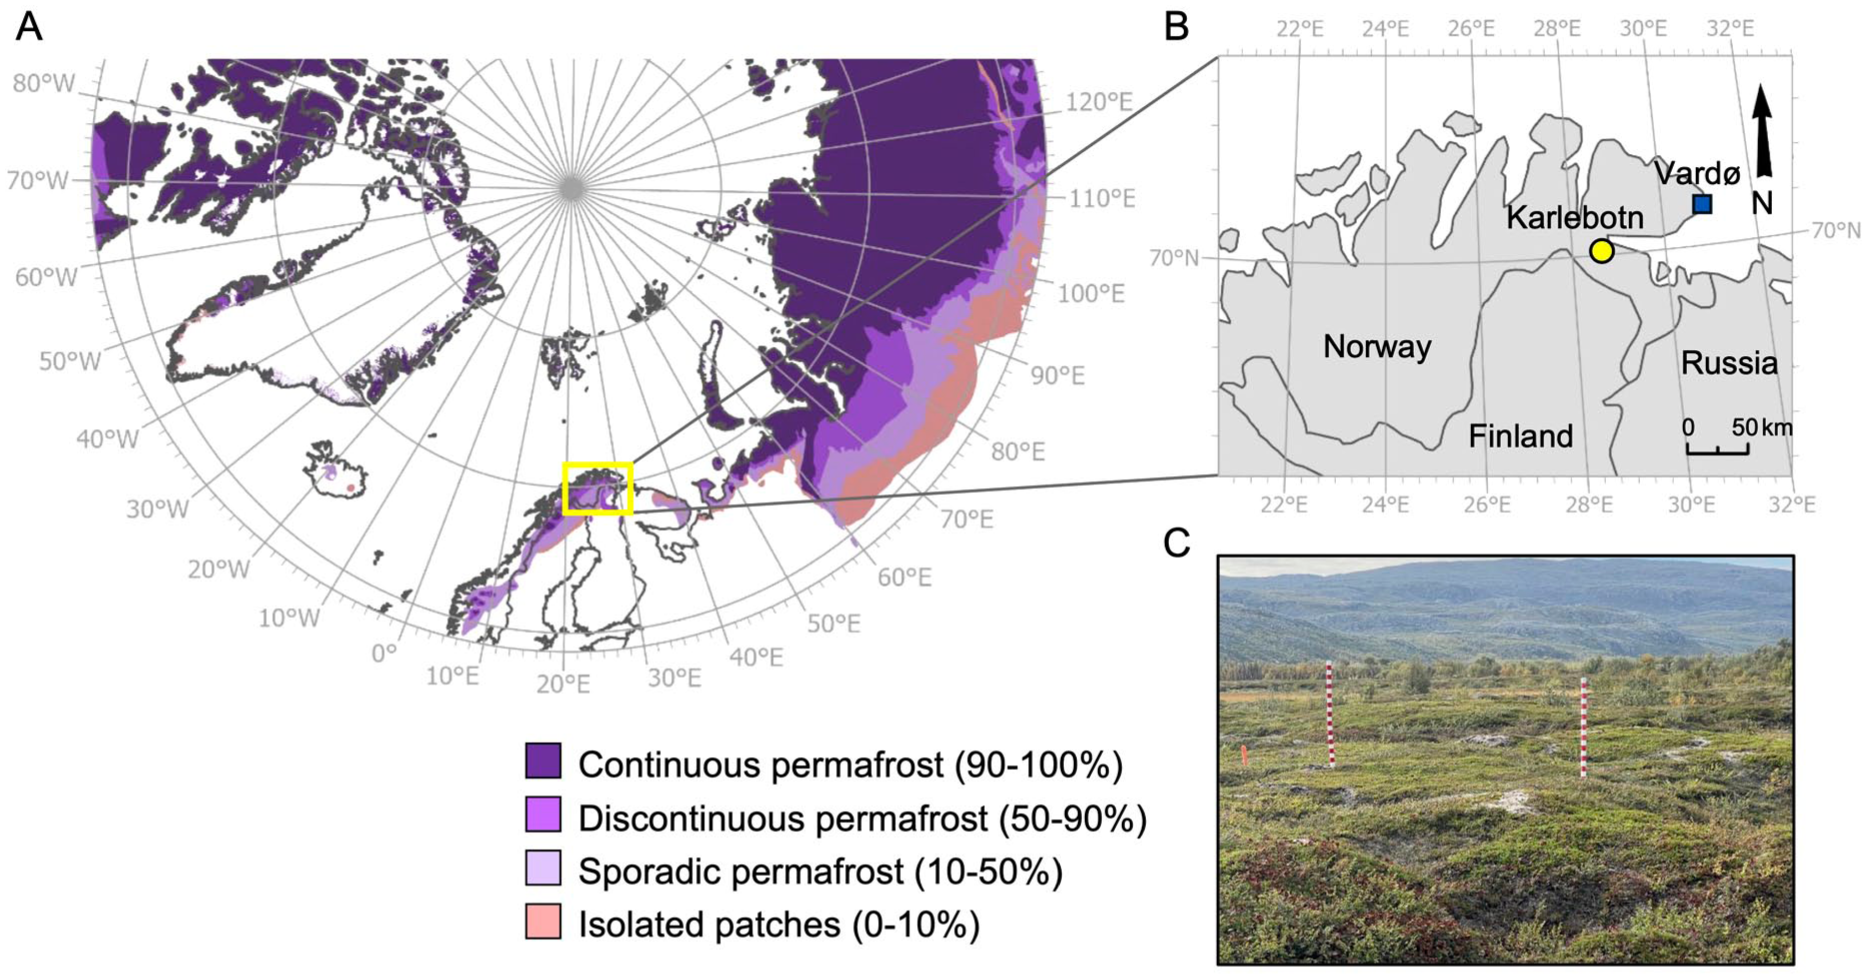
(a) An overview of the permafrost distribution in the study area (adapted from Brown et al., 1997), (b) location of the Karlebotn study site and Vardø meteorological station in northern Norway, and (c) sampling site at Karlebotn peat plateau.
Palsas and peat plateaus cover approximately 110 km2 in Finnmark (Borge et al., 2017). They are mainly concentrated in the inner part of Finnmark, however, coastal sites including Karlebotn represent an area with a high abundance of peat plateaus and palsas. Coastal sites belong to the sporadic permafrost zone, while the discontinuous permafrost zone is found in areas located above 400 m a.s.l. (Gisnås et al., 2017). The palsa and peat plateau area in Finnmark is decreasing (Borge et al., 2017). In addition, the ground temperatures are warming. At the study site in Karlebotn the ground temperature is currently slightly below 0°C and has been rising consistently between 2019 and 2024, suggesting that the permafrost is thawing (unpublished data Väliranta and Sannel).
The vegetation at the study site consists of different dwarf shrubs like Betula nana, Empetrum nigrum ssp. hermaphroditum, Rhododendron tomentosum, Vaccinium uliginosum, Vaccinium vitis-idaea and Andromeda polifolia, as well as Rubus chamaemorus, lichens and bryophytes such as Dicranum, Sphagnum and Polytrichum spp..
One peat core was collected in September 2022. The active layer was sampled using a box corer and permafrost samples using a steel pipe. To collect frozen peat, a steel pipe was hammered into the permafrost and with the help of a wooden rod 5–10 cm peat samples were individually pushed out of the pipe. Altogether 11 peat samples were collected until minerogenic sediment was reached. In total, 85 cm peat profile was obtained, and the samples were put into plastic bags in a way that the upper and lower part could be identified later. Samples from 0 to 60 cm were 10 cm thick and from 60 to 85 cm, 5 cm thick: 0–10, 10–20, 20–30, 30–40, 40–50, 50–60, 60–65, 65–70, 70–75, 75–80 , and 80–85 cm. These 11 samples were immediately placed in a freezer box to prevent thawing and in a freezer at the Kevo research station and transported to Helsinki keeping them frozen.
Sample preparation and peat analysis
Peat samples were first thawed, so that the sample profile’s top and bottom remained distinguishable. After thawing, each sample (e.g. 0–10 cm) was divided into upper, middle and lower subsamples, so that 10 cm3 from the upper and lower part of the sample were collected separately and marked as U (= up) and L (= low) respectively and the rest of the sample was marked as M (=middle). All subsamples were stored at +4°C. For vegetation analysis, 5 cm3 from each of the L subsample and from the U subsample of the 20–30 cm segment were rinsed through a 100 μm sieve until water run clear and the remaining material in the sieve was moved to a beaker. After that, they were investigated under a stereomicroscope (10–160× magnification) for an approximate estimation of the vegetation composition. Based on the approximate vegetation composition, the peat types were classified into five categories of Equisetum, Bryophytes/Carex/Equisetum, Bryophytes, Decayed plant material, and woody/dwarf shrub roots.
Chronology
14C dating was performed to establish a chronology and age-depth model. For dating, identified plant material (Table 1) was carefully collected under stereomicroscope, dried overnight at 100°C to prevent microbial growth and sent to AMS 14C analysis. Altogether seven samples were sent to the Poznan Radiocarbon Laboratory (Poznan, Poland) and one sample to the Finnish Museum of Natural History (LUOMUS, Helsinki, Finland). 14C results were calibrated using IntCal13 calibration curve (Reimer et al., 2013) and are presented in Table 1. Two 14C dates appeared suspiciously modern and were therefore omitted from the model. Six 14C dates were used to generate the age-depth model with BACON v3.5.2 package (Blaauw and Christen, 2011) in R v4.3.2 (Supplemental Figure S1). Age of the surface peat was set to the time of the core collection (–72 cal year BP for 2022).
14C-dating results for the peat profile.
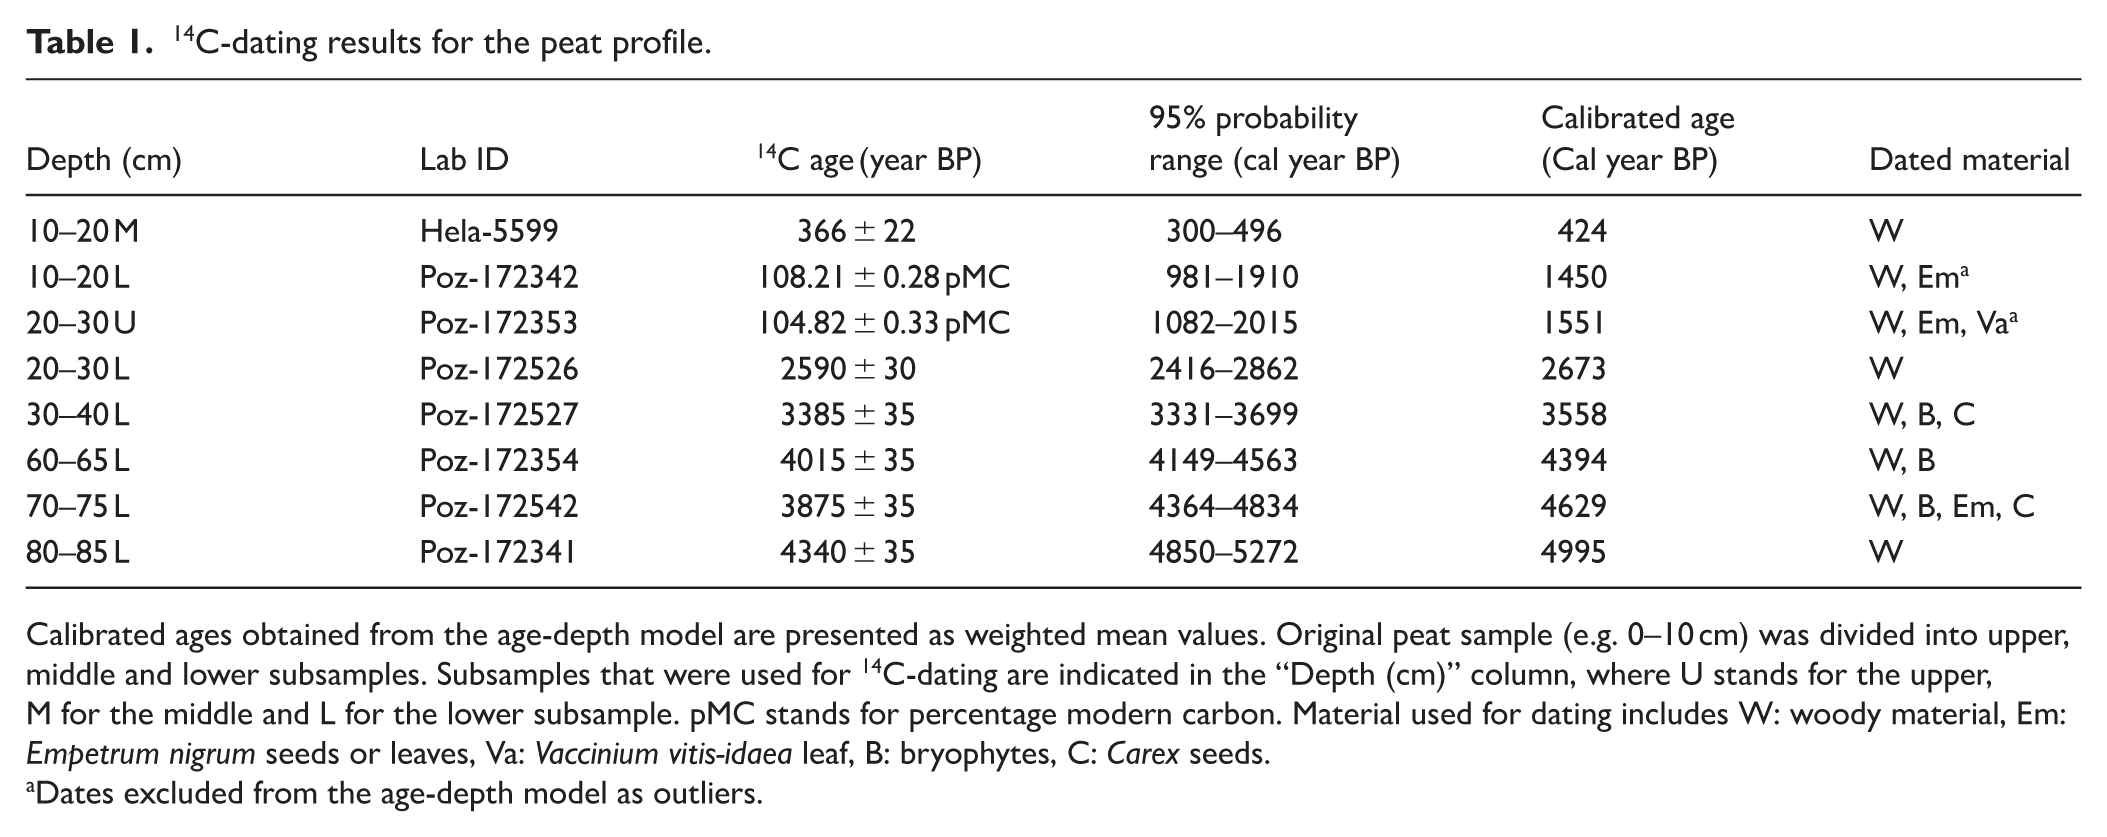
Calibrated ages obtained from the age-depth model are presented as weighted mean values. Original peat sample (e.g. 0–10 cm) was divided into upper, middle and lower subsamples. Subsamples that were used for 14C-dating are indicated in the “Depth (cm)” column, where U stands for the upper, M for the middle and L for the lower subsample. pMC stands for percentage modern carbon. Material used for dating includes W: woody material, Em: Empetrum nigrum seeds or leaves, Va: Vaccinium vitis-idaea leaf, B: bryophytes, C: Carex seeds.
Dates excluded from the age-depth model as outliers.
Oribatid mite analysis
For oribatid mite analysis, 20 cm3 of the M subsamples were rinsed through a 100 μm sieve and the remaining material in the sieve was moved to a beaker. Due to the large sample volume needed to obtain adequate number of mites, the analysis was performed only at 10 cm resolution. Mites were picked from 11 samples under a stereomicroscope, counted and stored in small plastic containers in 70% ethanol at +4 °C for further analysis. Mites were identified to family level using stereomicroscope (10–160× magnification) and light microscope (100–200× magnification). The identification followed Weigmann (2006). All individuals in the peat samples were collected; however, some individuals were missing body parts and were not identifiable (19 out of 459 mites). Only the identified individuals were included in the analyses. The unidentified individuals were found in almost all samples with similar numbers and thus were not expected to affect the results. Number of identified individuals per each 20 cm3 sample (abundance), number of families in the sample (richness) and the Shannon diversity index were calculated. Mean ages derived from the age-depth model were incorporated in the oribatid mite diagram to obtain peatland initiation and permafrost aggradation ages. Data visualization was done with ggplot2 v3.4.2 or riojaPlot v20.1–20 packages (Juggins, 2022) in R v4.4.1.
Peat properties
To analyze the organic matter content, loss of ignition (LOI) analysis was performed. 10 cm3 of each of the 11 M subsamples were dried in 100°C for 20 h to determine the dry weight and furnaced in 550°C for 2 h. At the end, the samples were weighed again to determine the organic matter content.
To analyze the dry BD (g cm−3), 5 cm3 of each of the 11 M subsamples were dried in 100°C oven for 20 h and weighed.
Carbon and nitrogen
To determine the C and N content, the dried samples (M subsample) were homogenized with mortar and pestle and analyzed using LECO TruSpec micro Elemental Determinator.
Peat accumulation rates (mm year−1) were calculated using the weighted mean ages of the age-depth model. The long-term apparent C accumulation rates (g C m−2 year−1) were calculated by multiplying the dry BD with C content and peat accumulation rate.
Results
AMS radiocarbon dating and age–depth model
14C ages, calibrated mean ages, and corresponding dated material for the samples are presented in Table 1. The age-depth model suggests that the lowermost sample (80–85 cm) dates to approximately 5000 cal year BP indicating likely the age of peatland initiation at the site (Supplemental Figure S1; Table 1).
Peat type analysis
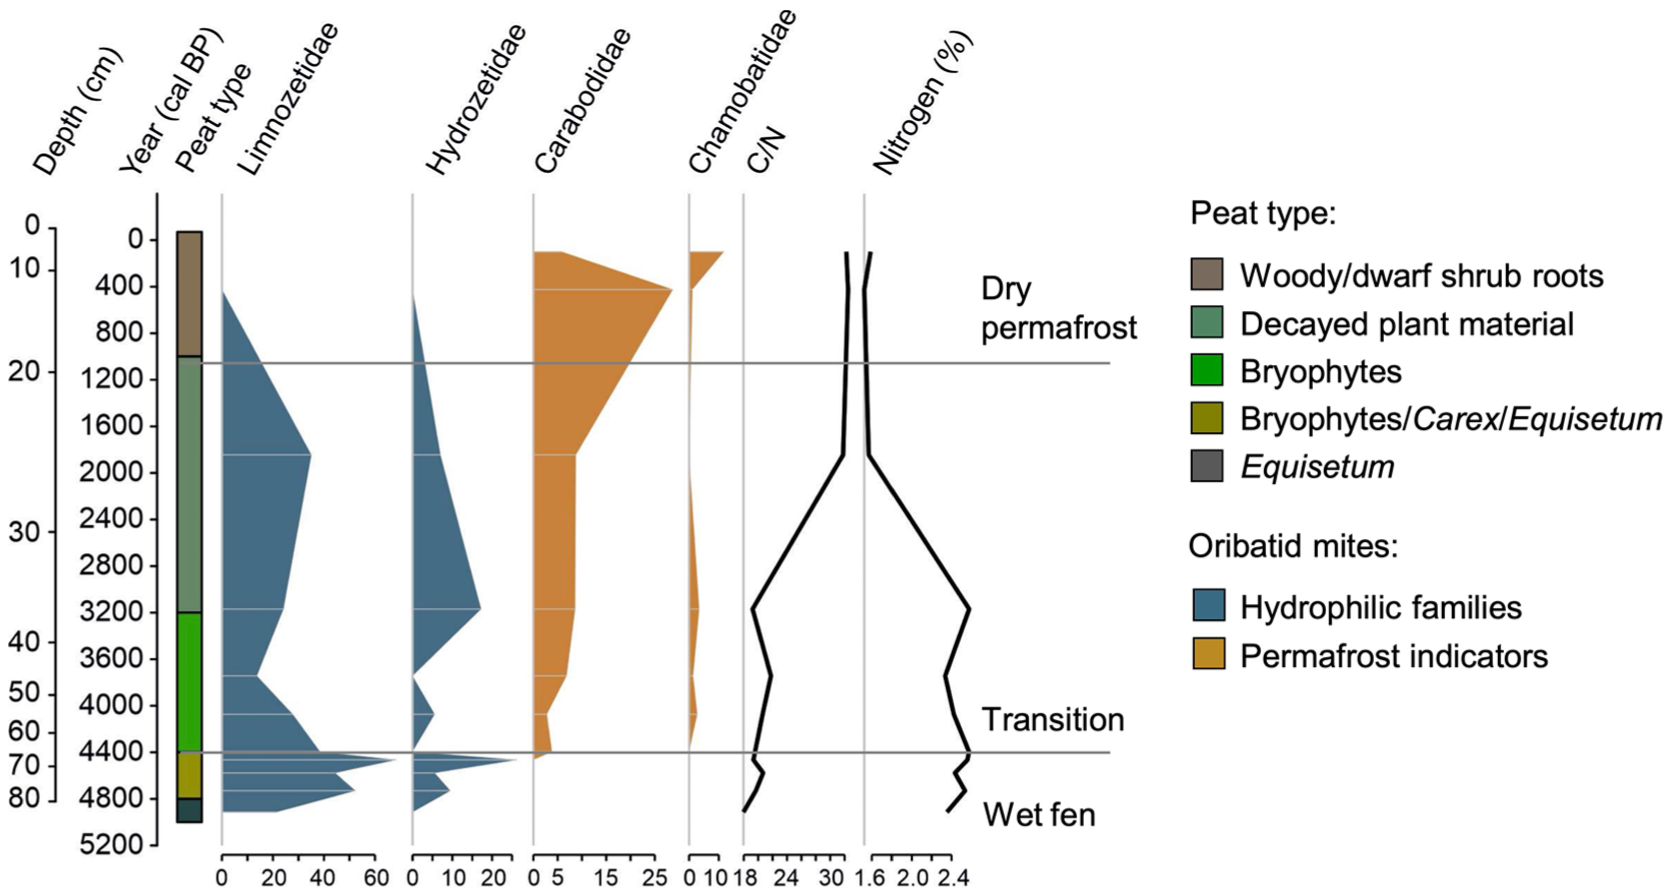
Peat types were classified through coarse vegetation analysis. During the mid-Holocene, the site resembled a wet fen environment, followed by progressive drying and the development of present-day dwarf shrub-dominated vegetation (Figure 2). The vegetation at the lower part of the profile consisted mainly of Equisetum until ca. 4800 cal year BP. The vegetation between ca. 4800 and 4400 cal year BP was characterized by Carex, Equisetum and bryophytes, with Equisetum disappearing after ca. 4400 cal year BP. After that, bryophytes became dominant, and Carex gradually disappeared. Some drier-adapted species, such as E. nigrum ssp. hermaphroditum, R. chamaemorus, and B. nana, concurrently emerged. Fungal sclerotium at ca. 3900 cal year BP also suggests drier conditions. The phase between ca. 3200 and 1000 cal year BP mainly contained highly decayed plant material, that was difficult to identify, while after ca. 1000 cal year BP the vegetation changed to taxa indicating drier conditions, such as woody material, roots and dwarf shrub remains such as E. nigrum ssp. hermaphroditum and V. vitis-idaea leaves.
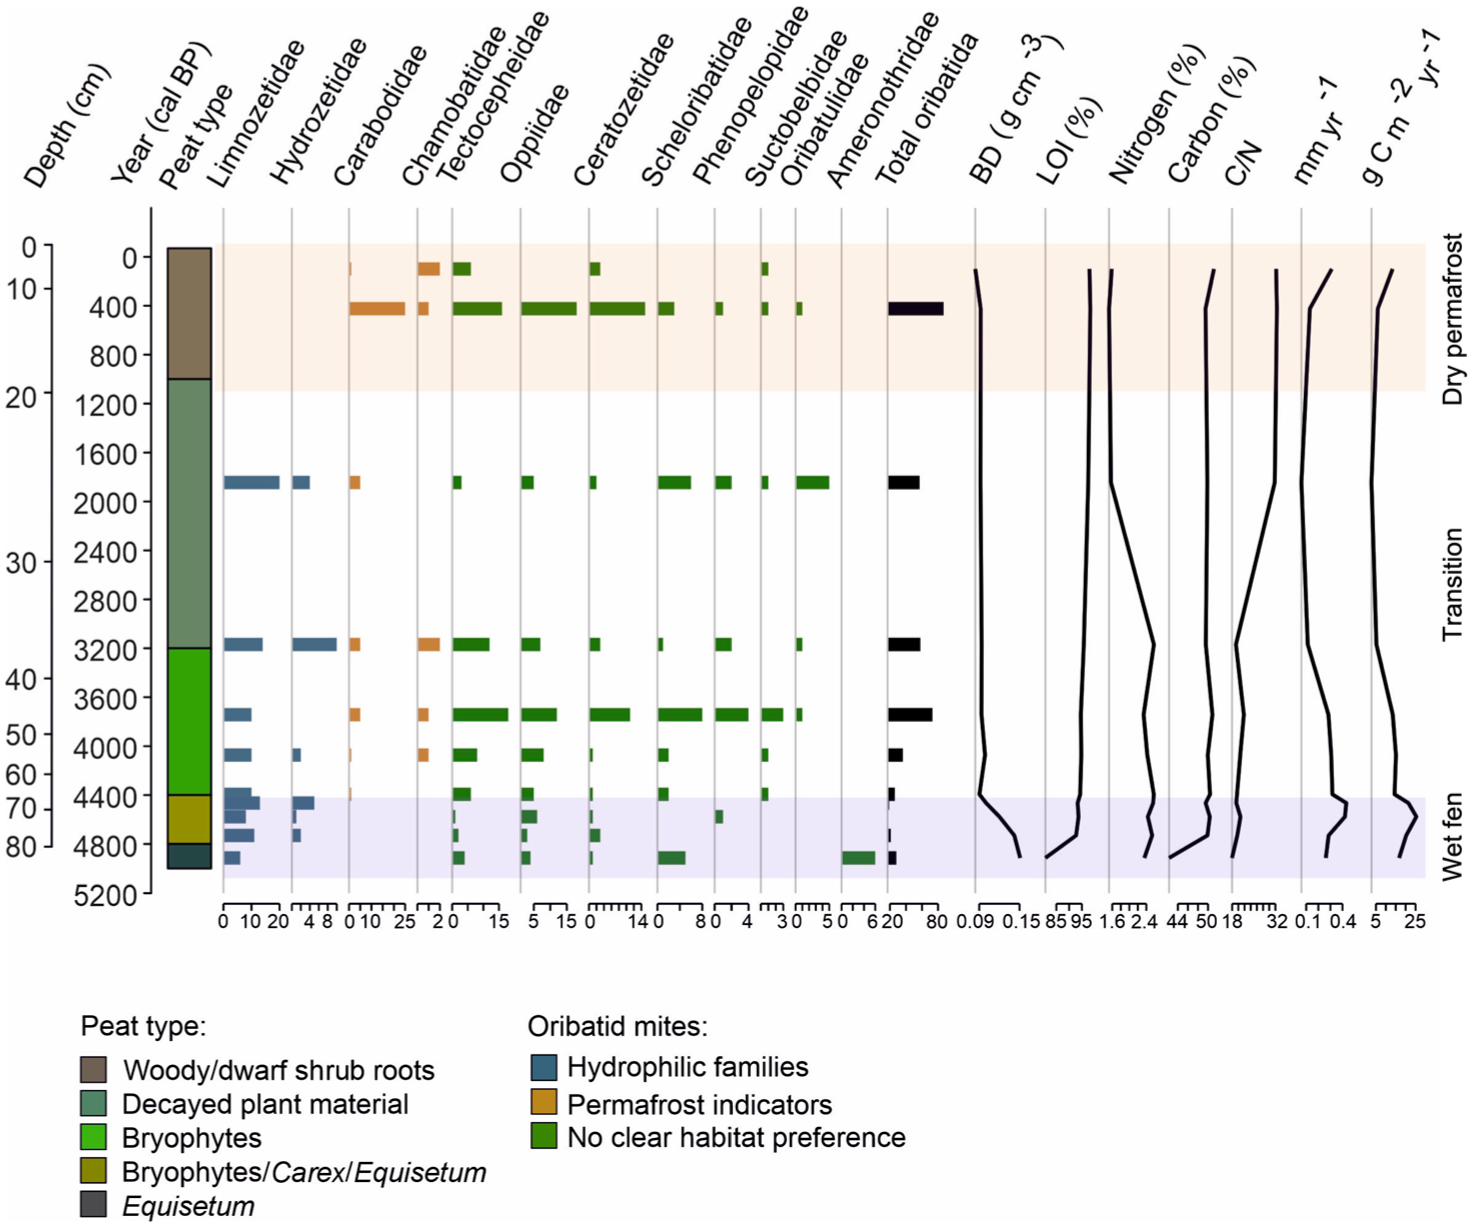
The number of identified oribatid mites per 20 cm3 of analyzed material at different depths combined with peat type and peat property data.
Oribatid mite communities
Altogether 459 oribatid mites were detected in the 11 peat samples (each sample volume 20 cm3), with an average of 42 mites (from 19 to 91) per sample. In total 21 different families were identified. The abundance of mites was low between ca. 5000 and 3700 cal year BP (depths 85–50 cm) when conditions were wet, whereas higher numbers were observed at the dryer phase between ca. 3700 and 400 cal year BP (depths 50–10 cm; Figure 3 and Supplemental Figure S2). The samples that had the highest abundance of mites, also had high family richness and Shannon diversity index (Figure 3). The greatest family richness (13 families) occurred between ca. 2400 and 400 cal year BP (depths 30–10 cm), whereas at ca. 4400 cal year BP (depths 70–65 cm) only three families were found. Shannon diversity index peaked between ca. 3700 and 1000 cal year BP (>2; depths 50–20 cm) and was the lowest at ca. 4400 cal year BP (70–65 cm).
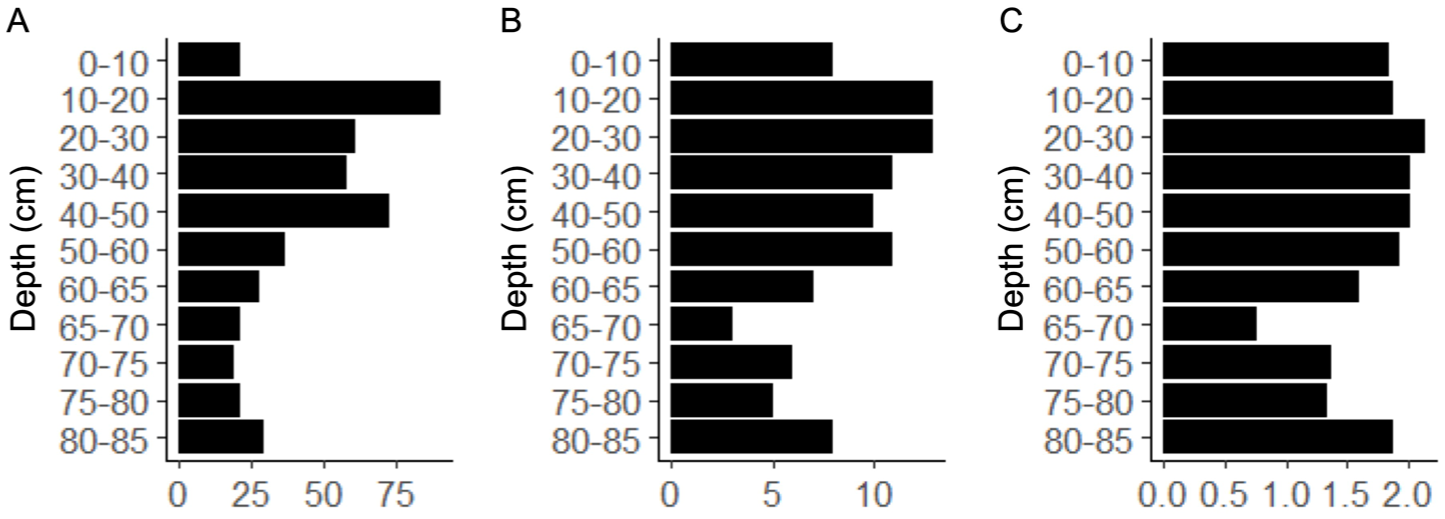
(a) The number of individuals, (b) taxonomic richness as number of families and (c) Shannon diversity index of oribatid mites at different depths.
The three most abundant families were Limnozetidae (102 individuals), Tectocepheidae (76 individuals), and Oppiidae (70 individuals; Figure 2). Limnozetidae was the most abundant family and, along with Hydrozetidae, dominated many depths. Limnozetidae, reached relative abundance up to 68% at ca. 4400 cal year BP whereas they were absent in the upperpart of the peat profile. Tectocepheidae and Oppiidae, both generalist taxa, occurred throughout the profile except that Tectocepheidae were absent at ca. 4400–4500 cal year BP. Other frequently recorded families included Carabodidae (43 individuals), Ceratozetidae (41 individuals), Scheloribatidae (27 individuals), and Hydrozetidae (24 individuals). Carabodidae, often associated with permafrost environments (Markkula et al., 2018; Markkula and Kuhry, 2020), were especially abundant at 10 cm depth, ca. 400 cal year BP (25 individuals, 29% relative abundance). At 5000 cal year BP, Limnozetidae and Ameronothridae were the most abundant families. Ameronothridae were found only at ca. 5000 cal year BP. Ceratozetidae were the most common at ca. 400 cal year BP but occurred consistently throughout the profile. Scheloribatidae and Phenopelopidae were largely absent in the surface and deepest layers but present at intermediate depths.
Oribatid mite community was dominated by Limnozetidae and Hydrozetidae from ca. 5000 to 4400 cal year BP. Both families are truly aquatic (Behan-Pelletier and Eamer, 2007). After ca. 4400 cal year BP Carabodidae and Chamobatidae appeared sporadically, while Limnozetidae and Hydrozetidae remain abundant. The decline of Limnozetidae and Hydrozetidae after ca. 1800 cal year BP occurred simultaneously with increasing presence of Carabodidae and Chamobatidae. Carabodidae became the dominant family by ca. 400 cal year BP, whereas Limnozetidae and Hydrozetidae disappeared.
Peat properties
BD ranged from 0.08 to 0.15 g cm−3 (Figure 2). The lowermost part of the core exhibited the highest, and the surface sample the lowest BD. A clear decrease occurred after peatland initiation until ca. 4400 cal year BP. Organic matter content, assessed via LOI, ranged from 81% to 98%, increasing sharply from ca. 5000 to 4700 cal year BP and more gradually to present day. Changes in BD and organic matter content coincided with a shift from Equisetum-rich to more decomposition-resistant bryophyte-dominated peat type. C content varied between 42.3% and 51.2% and N between 1.5% and 2.6%. C content was the lowest in the deepest sample but stabilized around 50% at other depths, consistent with previous studies (Loisel et al., 2014; Treat et al., 2016). N content decreased significantly from ca. 3200 to 1800 cal year BP. The C/N ratio ranged from 18.0 to 32.5, with the highest values at the upperpart of the sample. A notable increase was observed after ca. 3200 cal year BP, driven by decreased N content rather than changes in C.
Mean C accumulation was 14 g C m−2 year−1, with values ranging from 3 to 25 g C m−2 year−1 (Figure 2). The lowermost samples showed high accumulation rates. Rates decreased from 25 to 15 g C m−2 year−1 by ca. 4000 cal year BP, and further to 3 g C m-2 year−1 at ca. 1800 cal year BP, likely due to a hiatus in the peat sequence. The lowest rates were observed between ca. 3200 and 400 cal year BP.
Discussion
We used oribatid mite community analysis, peat type analysis and peat property measurements to investigate the past dynamics of a peat plateau in Karlebotn. Our multiproxy analysis reveals three key phases in the peatland development (Figure 2):
Mid-Holocene wet fen stage (ca. 5000–4400 cal year BP): Characterized by Carex- and Equisetum-dominated vegetation and hydrophilic oribatid mite communities. BD decreases from early high values, while organic matter and C content increase. Peat and C accumulation rates are relatively high.
Late-Holocene transition phase (ca. 4400–1000 cal year BP): Mixed wet and dry conditions. Vegetation includes bryophytes and Carex, with a gradual shift toward drier conditions. Oribatid mite communities also represent a mixture of both hydrophilic and dry-adapted species. C/N ratio increases, and N content decreases sharply between ca. 3200 and 1800 cal year BP, while peat and C accumulation rates are slow.
Late-Holocene dry permafrost stage (ca. 1000 cal year BP–present): Vegetation shift to dwarf shrubs resembling modern palsa vegetation (Oksanen and Väliranta, 2006). Oribatid mite communities also change, with hydrophilic species disappearing and dry-adapted families like Carabodidae and Chamobatidae (Markkula, 2014; Markkula et al., 2018) becoming dominant by ca. 400 cal year BP, suggesting that permafrost is established by then. Peat and C accumulation rates remain low.
Mid-holocene initiation and development processes in Karlebotn peatland
14C dating indicates that peatland initiation at Karlebotn occurred around 5000 cal year BP, aligning with a previous estimate of ca. 5150 cal year BP for peatland development in the same area (Kjellman et al., 2018). In northern Europe, peatlands generally started forming after deglaciation, around 10,000–9000 cal year BP (Ruppel et al., 2013; Yu, 2012), under a warm climate that favored peatland development (Luoto et al., 2014; Macdonald et al., 2006; Väliranta et al., 2015; Yu, 2012). However, Karlebotn remained below sea level during the early Holocene (Corner et al., 1999), likely delaying peatland initiation until the mid-Holocene. The early Holocene was followed by the Holocene Thermal Maximum (HTM), around 8000–5000 cal year BP (Renssen et al., 2009), a period of warm but drier conditions which generally slowed down peatland expansion and limited new peatland formation (Eronen et al., 1999; Ruppel et al., 2013; Seppä et al., 2009; Yu, 2012). This climate phase was followed by the so called Neoglacial cooling, characterized by a cooler and wetter climate until the last century, which accelerated peatland expansion (Korhola et al., 2010; Ruppel et al., 2013; Seppä and Birks, 2001). Our data suggest that peatland initiation at Karlebotn occurred during the HTM. Peat accumulation reached a peak ca. 4500 cal year BP and was high until ca. 3700 cal year BP (Figure 2), likely due to high plant productivity during the warm, although gradually cooling period (Eronen et al., 1999; Renssen et al., 2009; Seppä et al., 2009; Yu, 2012). Similar to peat accumulation, C accumulation rates peaked during the early fen stage before declining. Besides the warm early Holocene and HTM promoting C accumulation, Equisetum, that can contain high amounts of C, formed a significant part of the early-stage vegetation until ca. 4400 cal year BP.
Our data suggest that over the first millenium the peatland remained wet until ca. 4400 cal year BP. The dominant vegetation included Equisetum, Carex, and bryophytes, while the oribatid mite community was composed of families such as Limnozetidae and Hydrozetidae, which thrive in aquatic conditions (Behan-Pelletier and Eamer, 2007). After ca. 4400 cal year BP, Equisetum remains disappeared, and vegetation became more bryophyte-dominated with some Carex remains, indicating that conditions were getting drier.
Late-Holocene shift from wet to dry conditions
Several proxies suggest that the phase from ca. 4400 to 1000 cal year BP resembles a transition phase from wet to dry conditions. The vegetation was dominated by bryophytes and oribatid mite families preferring dry environments, such as Carabodidae and Chamobatidae (Markkula, 2014; Markkula et al., 2018), began appearing but remained in low abundance initially (Figure 2). Although the hydrophilic families Limnozetidae and Hydrozetidae were still abundant, the co-occurrence of Carabodidae and Chamobatidae suggests that the environment was drying
During the phase from ca. 4400 to 1000 cal year BP, peat and C accumulation rates declined, coinciding with the onset of Neoglacial cooling, and were particularly low between ca. 3200 and 400 cal year BP (Figure 2). In addition to cooling, reduced accumulation may also be caused by a hiatus in the peat sequence, as surface exposure to wind abrasion is common following uplift by frost heave when permafrost is forming (Seppälä, 2005). Permafrost aggradation can also result in enhanced peat decomposition under oxic conditions, slowing down the accumulation rates (Kjellman et al., 2018; Sannel et al., 2018). N content started to decrease at ca. 3200 cal year BP and was significantly lower at ca. 1800 cal year BP, coinciding with a vegetation shift from bryophytes to woody plants. Sphagnum-dominated peat typically has lower N content (Loisel et al., 2014). Here, Sphagnum was present only as isolated, highly decomposed leaves and thus its abundance could not be quantified and the role in driving the observed decrease in N content remains uncertain. Interestingly, permafrost peatlands tend to have lower N content than non-permafrost peatlands (Treat et al., 2016), possibly due to low N uptake, and high N mineralization and nitrous oxide (N2O) emissions (Marushchak et al., 2011; Repo et al., 2009). Consistent with our results, decreasing N content toward the surface peat has been observed in permafrost peatlands in Fennoscandia and has been used to verify the timing of permafrost aggradation inferred from plant macrofossils (Hichens-Bergström and Sannel, 2023; Kjellman et al., 2018). The C/N ratio increased from ca. 3200 to 1800 cal year BP, likely due to decreasing N content. High C/N ratio has been observed in permafrost affected soil indicating low degree of decomposition, differences in N content or vegetation type changes (Sannel and Kuhry, 2009; Treat et al., 2016; Vardy et al., 2000). Several studies have also reported high C/N ratios in the uppermost peat layer and have used the C/N ratio to support other paleoecological proxies for permafrost initiation (Hichens-Bergström and Sannel, 2023; Kjellman et al., 2018; Pelletier et al., 2017; Sannel and Kuhry, 2009).
Late-Holocene permafrost aggradation
Our finds suggest that permafrost aggradation at Karlebotn began after ca. 1000 cal year BP, with evidence indicating a minimum age of ca. 400 cal year BP when permafrost had established at latest (Figure 2). The determination of the exact timing of permafrost aggradation is constrained by the low sampling resolution of the oribatid mite record. In addition, the probable hiatus in the peat sequence between ca. 3200 and 500 cal year BP further complicates the interpretation. However, vegetation consisting of dwarf shrubs at ca. 1000 cal year BP suggests permafrost aggradation around this time. Plant macrofossils consisting of dwarf shrubs and their rootlets are commonly used to indicate dry bog conditions and permafrost initiation (Heffernan et al., 2020; Oksanen, 2006; Pelletier et al., 2017; Sannel and Kuhry, 2008). Moreover, the oribatid mite community gradually changed after ca. 1800 cal year BP from wet to dry-adapted families and by ca. 400 cal year BP, Carabodidae had become the dominant family, marking a shift to dry conditions. In conjunction with Carabodidae, the family of Chamobatidae appeared. Two members of these families, C. labyrinthicus and C. borealis have been associated with permafrost and shown to be the main species after permafrost aggradation (Markkula et al., 2018; Markkula and Kuhry, 2020). The concurrent disappearance of Limnozetidae and Hydrozetidae provides further evidence of drying and permafrost aggradation.
Previous studies have identified two major palsa formation periods in northern Europe: one ca. 2500–2100 cal year BP (Kokfelt et al., 2010; Oksanen, 2006) and another around the Little Ice Age (Kjellman et al., 2018; Kokfelt et al., 2010; Oksanen, 2006; Sannel et al., 2018; Zuidhoff and Kolstrup, 2000) associated to cool climate between ca. 850 until 100 cal year BP (Grudd et al., 2002). Consistent with our finds, a previous study at Karlebotn suggested permafrost formation ca. 950 cal year BP based on plant macrofossil analysis (Kjellman et al., 2018). They also noted a possible earlier permafrost phase at ca. 2200 cal year BP, whereas we found no evidence of this. Another recent study at Karlebotn was unable to precisely date permafrost formation due to a hiatus in the upper peat layers but observed dry surface conditions indicative of permafrost between ca. 2200 and 100 cal year BP (Hichens-Bergström and Sannel, 2023). In their study, initially the site was wet until ca. 3300 cal year BP. Between ca. 3300 and 2900 cal year BP, conditions became dry, possibly indicating permafrost presence, followed by a wetter period that may suggest permafrost thaw (Hichens-Bergström and Sannel, 2023). Our data reveal an older period, dated to ca. 4400–3600 cal year BP, during which hydrophilic mites declined while species adapted to dry environments appeared, indicating either dry hummock conditions or potentially a transient permafrost phase.
Oribatid mites as indicators of past permafrost dynamics
The distribution of oribatid mites is known to be affected by moisture, food source and vegetation (Gao et al., 2016; Markkula, 2014; Minor et al., 2016). In our study, oribatid mite abundance peaked between ca. 3700 and 400 cal year BP, coinciding with decreased moisture levels (Figure 2 and Supplemental Figure S2). In contrast, abundance was low during the wetter period (ca. 5000–3700 cal year BP). The number of families also increased under intermediate moisture conditions but remained lower in wetter conditions. Notably, diversity was particularly low at ca. 4400–4500 cal year BP, where aquatic species dominated. These findings align with previous studies showing that oribatid mite diversity increases in drier environments (Markkula, 2014; Markkula et al., 2018; Minor et al., 2016) and with greater vascular plant diversity (Minor et al., 2016). Previous research has shown that C. labyrinthicus and C. borealis are associated with permafrost habitats and dry-condition vegetation, while hydrophilic species disappear with permafrost aggradation (Markkula, 2014; Markkula et al., 2018; Markkula and Kuhry, 2020). Consistent with this, Carabodidae and Chamobatidae were also linked to permafrost formation at Karlebotn. Our analysis also reveals that dry-adapted and hydrophilic mites coexisted from ca. 4400 to 1800 cal year BP, complicating the precise dating of permafrost onset. However, dry hummocks can be present in peatlands without permafrost and therefore the co-existence of dry and wet adapted species may indicate that the site at that time resembled a typical non-permafrost fen or bog with hummocks and hollows. A similar pattern of the coexistence of wet and dry-adapted species has been observed in Canadian peat plateaus, where it was suggested that peat plateaus may retain more moisture than palsas, allowing some hydrophilic species to persist alongside permafrost indicators (Markkula and Kuhry, 2020). Several mite families showed no clear distribution pattern and were found throughout the peat profile. Tectocepheidae and Oppiidae, known generalists (Weigmann, 2006), were abundant at almost all depths. Ceratozetidae and Scheloribatidae, which occur in various habitats worldwide (Weigmann, 2006), were also common. Notably, Ameronothridae, typically found in marine or freshwater coastal habitats (Behan-Pelletier and Eamer, 2007), appeared only in the lowest sample, reinforcing evidence of wet conditions at ca. 5000 cal year BP. The taxonomy of oribatid mite subfossils is difficult, as key morphological features used for identification in fresh specimens are often absent in fossils (Luoto, 2009). This was also a challenge in our study and therefore we performed a family level identification instead of the species level. While this approach may result in some information loss, our study along with a recent report suggest that oribatid mites remain valuable bioindicators even when identified at coarser taxonomic levels (Meehan et al., 2019). Due to the low abundance of mites in some depths, relatively large sample volumes are required to obtain sufficient material for analysis. In this study, the sample volumes were limited, which constrained the spatial resolution of the dataset. In the future, larger material volumes would be needed for a more robust analysis to improve determination of the exact timing of permafrost aggradation. Despite these limitations, our study supports previous findings that oribatid mites can serve as useful indicators of permafrost formation, especially when combined with other proxies (Figure 4). Although identification was performed only at the family level, it was sufficient to capture environmental variations, with shifts in mite families supporting permafrost establishment by ca. 400 cal year BP.
Comparison of the three proxy methods in indicating permafrost presence.
Conclusions
Comparison of the three proxy methods used in this study reveals that they provide complementary information, contributing to a more accurate reconstruction of the past changes of the peatland. Peat type analysis reveals that after ca. 3200 cal year BP bryophyte-dominated vegetation shifts by ca. 1000 cal year BP to dwarf shrubs. Concurrently, the peat property analysis shows an increase in C/N ratio and decrease in N content after ca. 3200 cal year, stabilizing ca. 1800 cal year BP. Oribatid mite community analysis reveals that dry-adapted families (Carabodidae and Chamobatidae) increase after ca. 1800 cal year BP, becoming dominant by ca. 400 cal year BP. Collectively, the three proxies suggest that a change toward slightly drier surface conditions began to emerge after ca. 4400 cal year BP as indicated by changes in vegetation, C/N ratio and N content, as well as by the co-existence of dry-adapted and hydrophilic mite families. Permafrost aggradation began likely after ca. 1000 cal year BP and at latest by ca. 400 cal year BP, permafrost appears to have been firmly established, as hydrophilic mite families were replaced by the dry-adapted families.
While past studies have relied on plant macrofossils and peat properties, our study uses oribatid mites as an additional proxy. All proxies showed relatively similar permafrost dynamics history, suggesting that oribatid mites may be as good if not even better permafrost indicator than the vegetation, which is lacking a species directly marking the permafrost presence. In earlier studies, the oribatid mites were analyzed together with vegetation shifts, while here we combined oribatid mites also with peat properties. Our results are in line with previous findings showing that mites can serve as a permafrost bioindicator. However, further research with modern calibration data sets is needed to enable full exploitation of oribatid mites as bioindicators of environmental conditions and permafrost peatland successional pathways and associated implications.
Supplemental Material
sj-jpg-1-hol-10.1177_09596836261432397 – Supplemental material for Multi-proxy resolved timing of permafrost initiation in a peat plateau, northern Norway
Supplemental material, sj-jpg-1-hol-10.1177_09596836261432397 for Multi-proxy resolved timing of permafrost initiation in a peat plateau, northern Norway by Elina A. Kiss, Minna Väliranta, Sanna Piilo, Niina Kuosmanen and A. Britta K. Sannel in The Holocene
Supplemental Material
sj-jpg-2-hol-10.1177_09596836261432397 – Supplemental material for Multi-proxy resolved timing of permafrost initiation in a peat plateau, northern Norway
Supplemental material, sj-jpg-2-hol-10.1177_09596836261432397 for Multi-proxy resolved timing of permafrost initiation in a peat plateau, northern Norway by Elina A. Kiss, Minna Väliranta, Sanna Piilo, Niina Kuosmanen and A. Britta K. Sannel in The Holocene
Footnotes
Acknowledgements
We would like to thank Emilia Tuomaala and Teemu Juselius-Rajamäki for assistance in field work.
Ethical considerations
This article does not contain any studies with human or animal participants.
Consent to participate
There are no human participants in this article and informed consent is not required.
Author contributions
Funding
The authors disclosed receipt of the following financial support for the research, authorship, and/or publication of this article: This work was supported by the Opening Pandora’s Box (Interdisciplinary Research Openings, University of Helsinki) and Arctic Avenue (Stockholm University and the University of Helsinki spearhead project).
Declaration of conflicting interests
The authors declared no potential conflicts of interest with respect to the research, authorship, and/or publication of this article.
Data availability statement
The data that support the findings of this study are available from the corresponding author upon reasonable request.*
Supplemental material
Supplemental material for this article is available online.
References
Supplementary Material
Please find the following supplemental material available below.
For Open Access articles published under a Creative Commons License, all supplemental material carries the same license as the article it is associated with.
For non-Open Access articles published, all supplemental material carries a non-exclusive license, and permission requests for re-use of supplemental material or any part of supplemental material shall be sent directly to the copyright owner as specified in the copyright notice associated with the article.