
Abstract
The Western Siberian peatlands rank among the largest in the Northern Hemisphere. This study investigates peatland development and palaeohydrological changes of the Mukhrino mire during the Holocene focussing on climatic, regional and local factors. The multiproxy and multi-core approach reveals spatial variability driven by topography and sedimentary conditions. Our study integrates testate amoebae, plant macrofossils, peat geochemical and biomarkers to provide insights into past vegetation and environmental conditions. Peat accumulation in Mukhrino mire began in the early Holocene, with regional vegetation influenced by climatic and soil factors. Forest cover has been present since the Early Holocene. Birch and pine dominated in the drained areas and episodic regional presence of Tilia and Ulmus indicated warmer intervals. Since ~8800 cal yr BP, Mukhrino mire transitioned to an oligotrophic/ombrotrophic state dominated by Sphagnum fuscum. A key focus of this study is the dynamics of peatland surface wetness over millennia. Proxy-specific responses revealed both short-term variability (via testate amoebae) and long-term climatic trends (via plant macrofossils). Local dry phases (~6500–5700/4700 and 2200–1800 cal yr BP) resulted in partial mire afforestation, while wetter periods (~5700/4700–2500 cal yr BP) facilitated the restoration of its current state. Comparisons with prior studies identified two wet and four dry zones, with synchronised wetness trends across cores despite localised variations in peat accumulation rates. A pronounced local wet phase (~6700–6800 cal yr BP) corresponds with a marker layer from nearby Lake Svetlenkoye sediments (~8000–6700 cal yr BP), attributed to Ob River palaeo-floods. This evidence supports the presence of regionally wet environmental conditions during this period.
Keywords
Introduction
Rapid climate changes in the northern Hemisphere during recent decades might considerably affect the functioning of ecosystems and human practices in the region. Several scenarios of global warming have been developed but all of them expect an air temperature increase in the range of 1.4–4.4°C by 2100, causing climate-related risks and negative impacts across natural and human systems (IPCC, 2023). One of the driving forces of climate change is the anthropogenic release of green-house gases, such as methane and carbon dioxide, which may enhance atmosphere warming and are included in the main biogeochemical cycles. Mire ecosystems play an important role in the global carbon cycle (Yu et al., 2011). One of the most paludified territories in the world is the West Siberian Plain. Up to 20% of the global peat deposits are located here, with the total peatland coverage 22% of the territory reaching 50–75% in some areas (Peregon et al., 2008; Walter, 1997). The regional peat deposits could provide useful information of past environmental changes of this insufficiently studied region. Understanding regional long-term patterns of mire ecosystems is required for reliable forecasts of climate dynamics.
The main controls on peat accumulation in mire ecosystems are the high substrate wetness, low pH and temperature, together with anoxic conditions, which cause only partial decomposition of plant remains. The peat, especially formed in ombrotrophic (oligotrophic) bogs, is stratified archives for investigating the vegetation and environmental conditions of the past. The plant remains are usually well-preserved, reflecting the stages of the ecosystem development. Other valuable proxies are also abundant in peat deposits including seeds, testate amoebae, spores and pollen and others. Thus, multi-proxy palaeoecological reconstructions allow us to reveal various aspects of ecosystem dynamics in the past, such as species diversity, local and regional vegetation distribution, humidity and temperature, greenhouse gas fluxes (Mathijssen et al., 2016).
Palaeoecological reconstructions for individual peatlands are often inferred from analyses conducted on a single core (University Of Leeds Peat Club et al., 2017), that is, single-core approach, which is based on the assumption that bog surfaces react uniformly to, and are primarily driven by, allogenic factors (e.g. climate change; Barber, 1981; Walker and Walker, 1961). This approach has been justified by the analysis of vertical peat stratigraphy, which revealed relatively continuous accumulation across several locations (Lapshina and Zarov, 2023) and has been largely adopted for labour intensive high-resolution palaeoecological reconstructions (Amesbury et al., 2011; Lamentowicz et al., 2015; van der Knaap et al., 2011). However, it has been argued that even ‘a well-placed single core’ might be a poor representation of regional-scale processes and be greatly affected by local conditions (or autogenous processes) when applied to mire complexes or sites with distinct microtopography (University of Leeds Peat Club et al., 2017). In all cases, distinguishing external forcing (i.e. climate) from autogenic signals (i.e. peat accumulation) and noise is aided greatly by within- (Blaauw and Mauquoy, 2012) and between-site (Charman et al., 2006; Swindles et al., 2013) replication.
One of the most studied mires in Western Siberian Plain is Mukhrino mire which has been recently used for studies on carbon cycle and hydrology (Bleuten et al., 2020; Zarov et al., 2023a), local geography (Dyukarev et al., 2021b; Kupriianova et al., 2023), fire history (Lamentowicz et al., 2015) and humidity changes (Tsyganov et al., 2021; Zarov et al., 2023b). Besides, more data is available from nearby Lake Svetlenkoye that reveal the local Holocene flooding and vegetation dynamics (Amon et al., 2020). The main aim of this work is to reconstruct the Holocene vegetation, climate and hydrological changes of Mukhrino mire based on the multi-proxy and multi-core approach, including palaeobotanical record, peat humification degree, testate amoebae (TA) and geochemical characteristics.
Materials and methods
Study region and site
The study region is located on the Western Siberia Plain (Figure 1a) which represents a vast and weakly dissected accumulative plain with the absolute elevations not exceeding 140 m a.s.l. (Zemtsov, 1976). The territory is characterised by river valleys, flat interfluves and large wetlands. The landscape was largely shaped by glacial activity and generally composed of Quaternary deposits. The palaeo-relief is occasionally structured by moraine hills and ridges, while in the south, it features low sandy ridges. The vegetation in the area belongs to the middle taiga sub-zone and dominated by dark-coniferous forests (Picea obovata – Abies sibirica – Pinus sibirica) which occupy well-drained areas along rivers. Aspen-birch and birch (Populus tremula – Betula spp.) forests can be observed at sites undergoing post-fire recovery. Pinus sibirica forests grow on sandy soils at river terraces and outwash plains. There is no present permafrost in the region (Bleuten and Filippov, 2008). The climate is continental (Kremenetski et al., 2003). The mean January temperature is −19.1°C and the mean July temperature is +18.2°C, the mean annual precipitation is 548 mm (Hydrometeorological Research Centre of Russian Federation, Khanty-Mansiysk meteorological station, time period 1991–2020; https://meteoinfo.ru/climatcities, accessed 14.07.2025).
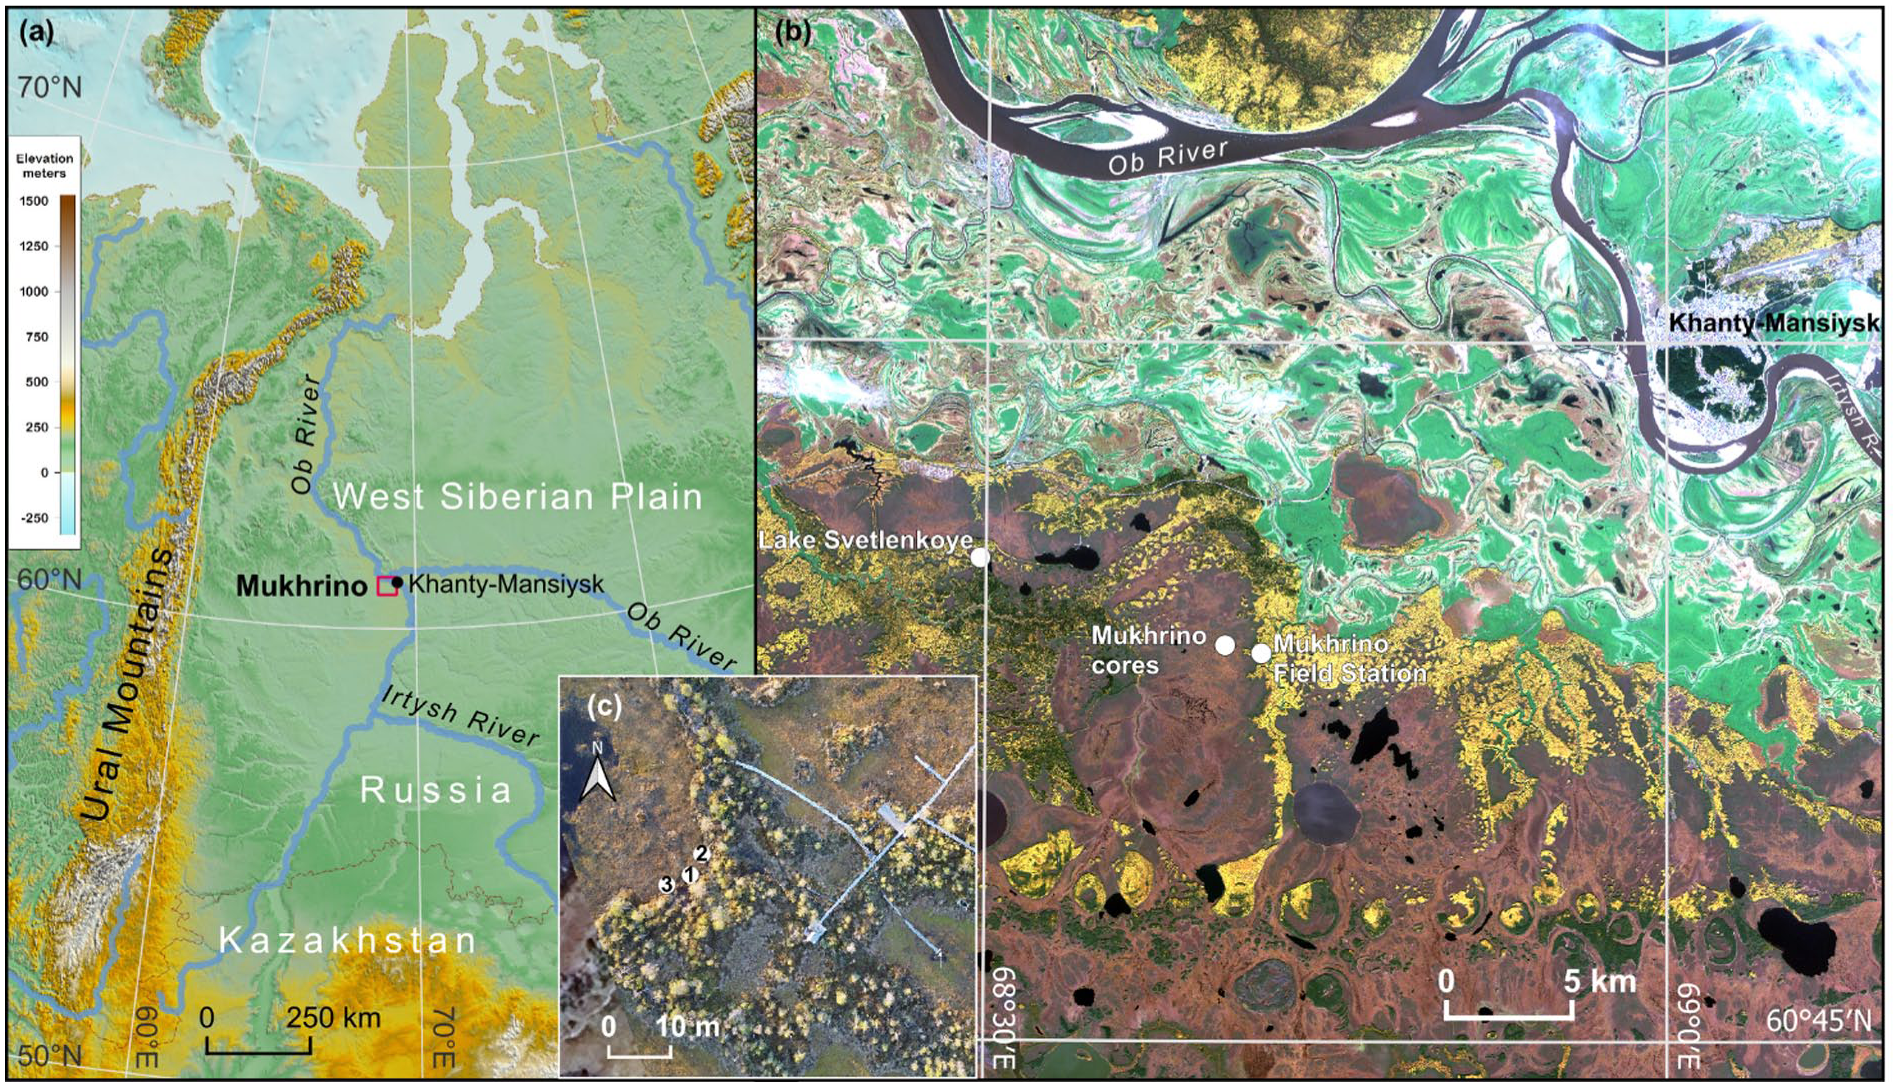
The overview map (ETOPO 2022 60 Arc-Second Global Relief Model) of West Siberian Plain (a) and (b) the location of the Mukhrino mire (Copernicus Sentinel data 2018) and (c) the location of the coring sites marked by white circles (1 – Core2017, 2 – Core2019 and 3 – Core 2020).
Mukhrino mire is a dome-shaped ombrotrophic bog located in the middle taiga zone in Western Siberia (Gvozdetskii et al., 1973), on the left terrace of Irtysh River 20 km south-west of Khanty-Mansiysk (Figure 1b). The mire occupies a watershed between Mukhrina and Bolshaya rechka rivers and covers a total area of ~75 km2. The lake and peat deposits of Mukhrino lie on clay-silt sediments (including moraine remnants consisting of Oligocene marine clays) of the second above-floodplain terrace, formed approximately between 57,000 and 26,500 years ago (Leshchinskiy et al., 2006). The vegetation is presented by ridge-hollow-pool and ridge-hollow patterned complexes, Sphagnum bog with sparse low pine trees and wooded pine-dwarf shrub-Sphagnum bog (Dyukarev et al., 2021b). The mean annual air temperature is −1.0°C and the mean annual precipitation is 470 ± 68 mm (Dyukarev et al., 2021a). The ground water level generally rises rapidly in April–May due to snow melting, then drops until the end of August and rises again because the evapotranspiration rates deplete and precipitation increases during autumn (Dyukarev et al., 2021a; Zarov et al., 2023b). The average peat depth is 3.4 m, the shallower deposits (0.5–1.7 m) are located on the bog outskirts and around mineral islands; the deepest peat deposits (5.3 m) were observed in the ancient riverbed and the lake basin (4.8 m). Approximately two-third of the peatland volume is composed of Sphagnum peat at the top, with a thin interlayer (<0.5 m) of mesotrophic peat and eutrophic peat (0.7 m) at the bottom (Zarov et al., 2023a).
Field sampling
For this study, two peat cores at the border between the ridge and the hollow (60.891719°N, 68.675906°E) were extracted using a Russian corer with a half-cylindrical sampler (50 cm in length, 5 cm in diameter, Eijkelkamp, Netherlands). The peat core (referred as Core2017) for pollen and carpological analysis was extracted in June 2017 (Figure 1c) to the overall depth of 5.0 m including the mineral layers at the bottom. The second core was extracted at the same site in June 2019 (referred as Core2019) to be analysed for bulk density, CHN, ash content, geochemical characteristics, peat humification and testate amoebae. The third core (Core2020) was retrieved in 2020. Plant macrofossil analysis was performed for all three cores. The cores were transferred into C-shape foamed polyethylene carcasses, wrapped in plastic, placed in boxes and stored at +4°C. The cores were cut into 5 cm contiguous samples in the laboratory for further multi-proxy palaeoecological analysis.
Chronology
The peat chronology was based on AMS 14C radiocarbon dating which was performed in Poznan Radiocarbon Laboratory, Poland (Poz-) and in the Institute of Geography, Russian Academy of Sciences (IGAN-). Altogether, 12 radiocarbon dates (Table 1) were obtained from Core2017 and Core2019. The age-depth models were established using the OxCal 4.4 deposition model (Bronk Ramsey, 2008, 2009) and IntCal20 calibration curve (Reimer et al., 2020). All modelled ages in this study are given as median calibrated years before the present (cal yr BP), where the present is 1950 CE.
Radiocarbon dates of the peat cores from the Mukhrino mire. The dates which were considered as outliers are marked by asterisks (*) and were not included in the model.
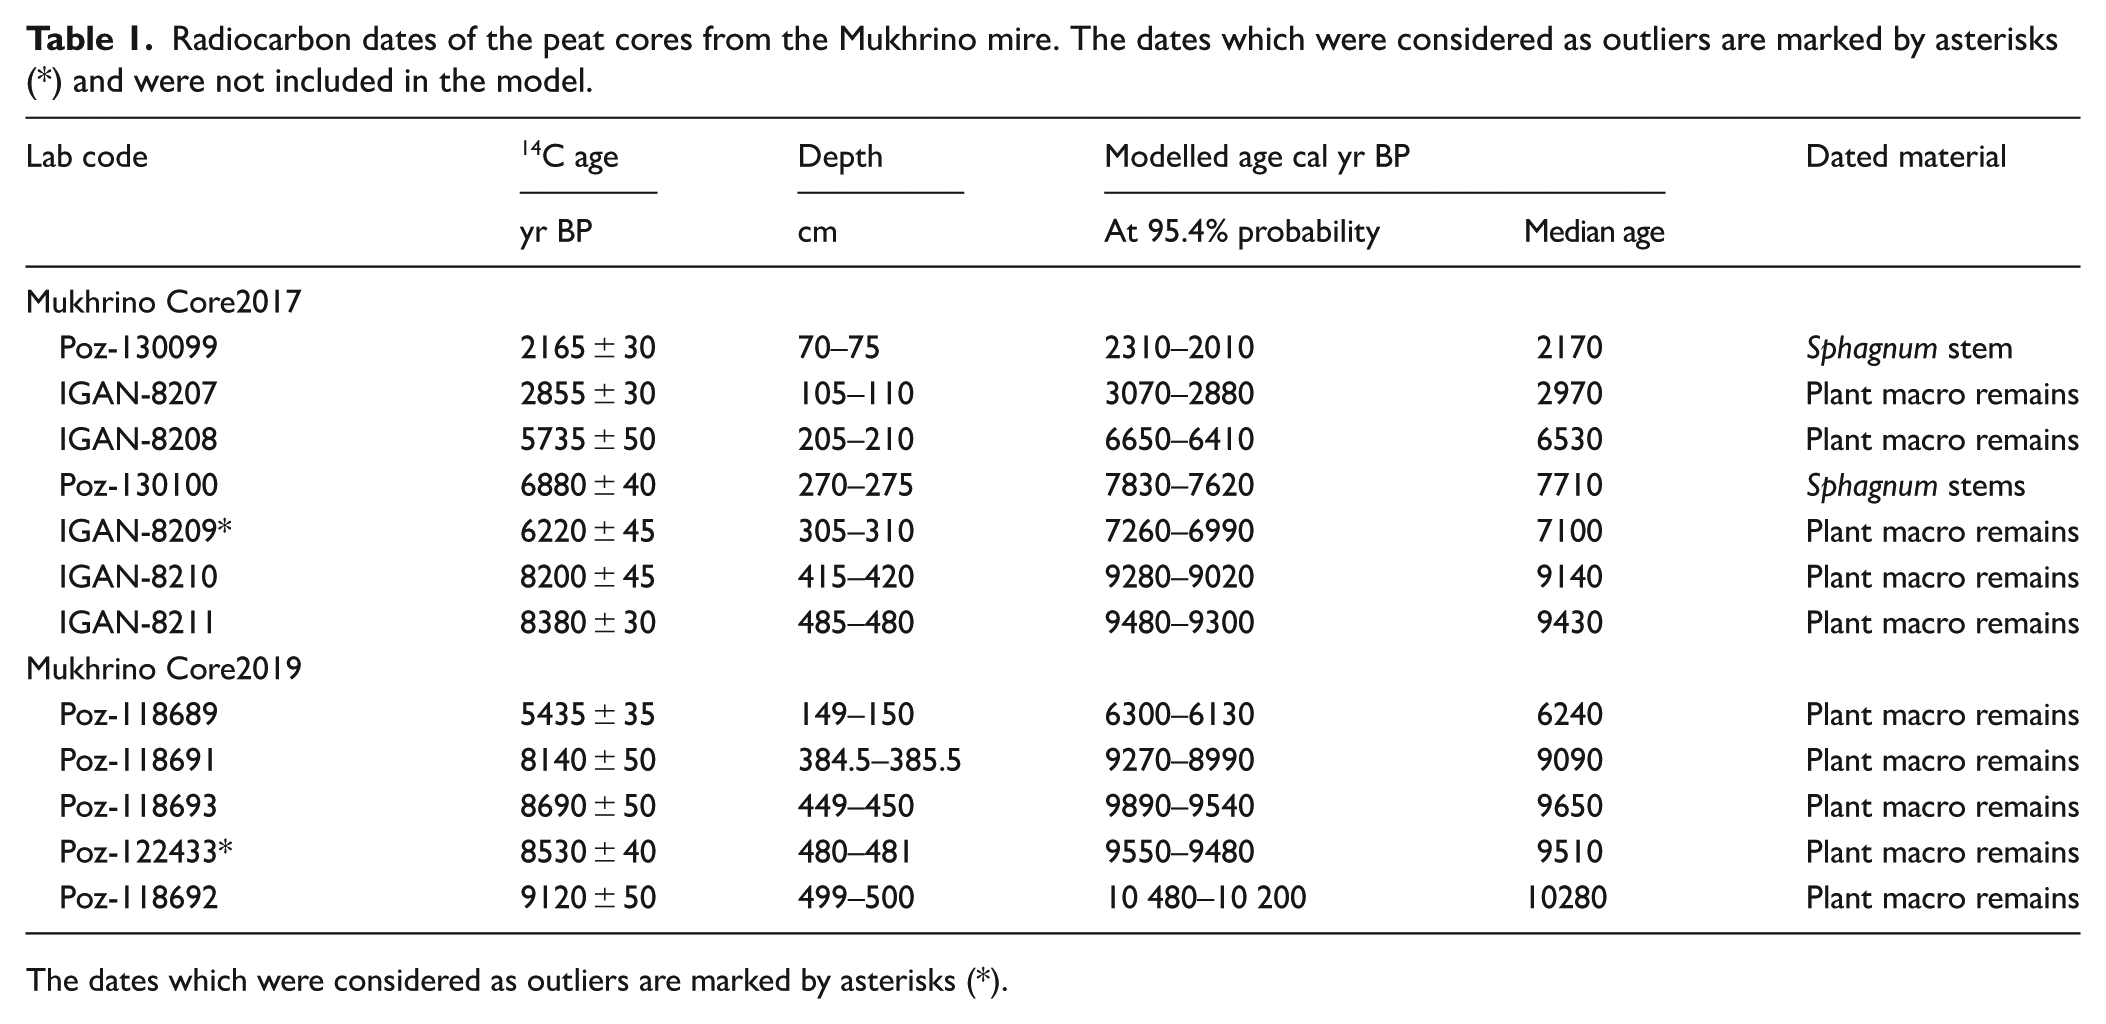
The dates which were considered as outliers are marked by asterisks (*).
Bulk density, ash content and chemical analyses
The bulk density was determined as a ratio of the dry weight (24 h at 105°C) 5 cm thick samples to the sample volume (~49.0 cm3). The ash content was calculated as percentage (%) of an ash in the dry peat sample combusted in a muffle furnace (10 h at 525°C). CHN content was determined using a gas-chromatograph element analyser EA-3000 (EuroVector, Italy), which combusts samples in the helium flow on the catalyst (copper and chromium oxide) at 1200°C and abundance of oxygen. The volatile element forms were separated on the chromatography column and detected by a thermal conductivity detector. Atropine standard (C = 70.56%, H = 8.01%, N = 4.84%) was used for calibration.
Peat humification
Peat humification was determined using the standard alkali-extraction and colourimetric method (Chambers et al., 2011). The samples were dried at 50°C,weighted (0.2 g) and grounded with agate mortar. Afterwards, they were placed in 100 ml of 8% NaOH and heated at 95°C for 1 h. The extract was diluted to 200 ml with distilled water and filtered (Whatman No 1). The light absorbance of the filtrate (50 ml diluted to 100 ml with distilled water) was measured with a spectrophotometer at a 540-nm wavelength (KFK-3-01-ZOMZ’, Russia). Greater values of light absorbance indicate greater peat humification and vice versa. The obtained values were corrected for the content of organic matter per sample by multiplying of the light absorbance values by loss on ignition values as proportions.
Geochemical proxies and biomarkers: n-Alkane and δ13C analysis
In total, 11 peat samples were analysed for n-alkane and δ13С content (15–20, 35–40, 40–45, 80–85, 85–90, 160–165, 270–275, 340–345, 345–350, 420–425, and 475–480 cm) from the Core2019. Peat samples were dried, ground and sieved (mesh size 1 mm). The extractable organic matter (EOM) was extracted using a Dionex ASE 350 accelerated solvent extraction system at 60°C and 1500 psi. The samples went through four 20 min cycles with chloroform–methanol (93/7 v/v). The extracts were collected into individually weighed vials and evaporated in the Genevac Rocket Evaporation System using the preprogrammed Method (T = 40°C and gradually decreasing pressure to 50 mbar). Half of the extract was used for EA-IRMS analysis to determine δ13С values in EOM and the second half to separate fractions.
The n-hexane (40-fold quantity by weight) was spiked to the analysed EOM sample of known weight in a hermetically sealed glass vial. Afterwards, the vial was set in a dark place at room temperature for 12 h to remove waxes and high-molecular compounds by sedimentation process. The solvent was subjected to column chromatography on silica gel (Merck, 63–200 μm) to collect the aliphatic fraction. The aliphatic fraction was weighted to estimate its relative abundance in the extract.
Determination of n-alkane content and their parameters was performed using GC/MS analysis on aliphatic fractions primarily re-dissolved in 0.1–0.5 ml of n-hexane using trace 1310/TSQ 8000 EVO instrument equipped with TG-5MS capillary column 30 m × 0.25 mm × 0.25 µm. The oven temperature programme was set from 60 to 310°C, 4°C/min, the final hold time was 40 min. High purity helium was used as a carrier gas in constant flow mode 1 ml/min. The samples (1–2 µl) were injected into a split-splitles injector operating in split mode (1/10) at 310°C. The mass spectrometer was operated in the electron impact mode at 70 eV, scan range 45–550 a.e.m. (0.2 s total scan time). The Xcalibur 4.0 software was used to process the data. N-alkanes were identified in relation to the mass-chromatogram of standard n-alkane C7–C40 mixture (49452-U, Supelco). Peak integration was performed on reconstructed mass chromatograms of the ion current m/z 85. The obtained data were used to calculate average chain length (ACL) and a proxy for aquatic macrophytes (Paq; Ficken et al., 2000) using the following equation:


EA-IRMS analysis δ13С was performed using a Thermo Scientific Delta V Advantage isotope ratio mass spectrometer. The spectrometer is connected via ConFlo IV interface to EA Isolink CNSOH Flash IRMS. For analysis EOM and saturated fractions samples were primarily re-dissolved in dichloromethane until 15–30 mg/ml concentration and aliquots of 25–50 μl were placed in tin capsules. Capsules without tops were put on a heated plate for 20–30 min to evaporate the solvent. Afterwards, the capsules were accurately folded to remove excessive air and then introduced into the EA system using the auto-sampler. Combustion furnace temperature was set at 1020°C. High purity helium was used as a carrier gas at the flow rate of 180 ml/min. The δ13C values were calculated relative to CO2 reference gas with a known δ13C isotopic value. The δ13C values were expressed as per mille (‰) relative to the Vienna Peedee Belemnite isotope reference (VPDB standard) and were calculated by Thermo Isodat 3.0 software. The accuracy of the instrument was tested by measuring the USGS24 Graphite and IAEA-CH-7 standards. The absolute deviation for standards did not exceed ±0.1‰. Two parallel measurements of δ13С values were performed for each sample and average for the two runs was accepted as the result. The standard deviation on average was less than ±0.2‰.
Plant macrofossil analysis
The peat plant macrofossils were identified in samples collected at 5 cm interval. A subsample of 5 cm3 was taken along a sample depth (50 subsamples in total), washed out through the 0.25 mm mesh sieve. Macrofossil analysis was carried out under a binocular microscope at 10–40× magnification (Zeiss Axiostar, Germany) following a protocol by Mauquoy et al. (2010) and Mauquoy and van Geel (2013). Plant remains were identified according to Matukhin et al. (2000). Zones were defined by constrained incremental sum of squares cluster analysis (Grimm, 1987) and a broken-stick model (Bennett, 1996). The borders among plant macrofossils zones were defined as averaged for three cores. The stratigraphy diagram was created using the ‘rioja’ package (Simpson, 2007) in the R language environment (R Core Team, 2021). The plant macrofossil data were used to reconstruct the mire surface wetness based on the Ramenskiy wetness grades (Ramenskiy et al., 1956). The Ramenskiy wetness scale was developed on the empirical data about the plant ecological niche in respect to environment humidification. The plants from the extremely dry biotopes have the lowest scores ranging between 1 and 17, while the hydrophilic plants have the highest scores in the range of 110–120. The final wetness grade for each sample is calculated as a mean value of all plant species in the community.
Carpology
The peat Core2017 was subsampled for carpological analysis between the depths of 503–60 cm. The lower part of the peat core (503–471 cm) was sampled continuously with the sample thickness of 2 cm. Starting from ~470 cm, the sample thickness was increased to 10 cm (every second sample was analysed for the depths from 470 to 400 cm). The sample volume was standardised to 3 cm3 and after that they were wet sieved through a mesh of 0.125 mm. Fruits and seeds were examined using a stereo- and light microscope at the magnification of 20–100×. Relevant literature, atlases, and reference collection were used for seed identification (Cappers et al., 2006; Katz et al., 1977).
Pollen analysis
Samples for palynological analysis (volume 1 cm3) were collected from Core2017 at 2 cm interval from the silt and 9 cm interval for the rest of peat deposits (Appendix A1) that resulted in a total of 54 samples. The palynological analysis was performed at the Laboratory of Mesozoic and Cenozoic Continental Ecosystems of Tomsk State University (LMCCE TSU). Chemical treatment of samples was carried out at the Laboratory of Micropalaeontology (LMP TSU). NaOH (10%) and HCl (10%) were used sequentially during sample preparation according to the standard procedure (Zaklinskaya and Panova, 1986). Slides were inspected under a Leica DM 1000 microscope at 400×, 630× and 1000× magnification. We counted at least 400 pollen grains of trees and tall shrubs, in the samples with the predominating tree pollen we counted at least 500 pollen grains and spores, in the samples with dominating spores we counted at least 5170 grains. Published atlases, articles, and the LMCCE TSU comparative collections were used to identify pollen and spores (Bobrov et al., 1983; Grichuk and Monoszon, 1971; Kupriyanova and Aleshina, 1972, 1978).
The palynological data were visualised using diagrams based on taxon relative abundance and concentrations. The relative abundances were calculated to the total number of terrestrial plant pollen (AP + NAP; AP – pollen of trees and tall shrubs, NAP – pollen of dwarf shrubs and terrestrial herbs). Spores and pollen of mire and aquatic plants were calculated as a percentage of AP + NAP. The concentrations were calculated using Lycopodium spores as an exotic marker (Batch No 3862), which were added during the sample preparation (Stockmarr, 1971; Figure SM2). Palynological zones were determined based on the results of the constrained cluster analysis together with the visual inspection overall composition of the spore and pollen data. Subzones (a, b, c, etc.) were determined based on the changes in relative abundance and concentration of a particular taxon.
Testate amoeba analysis
Samples for testate amoeba analysis were prepared following the method based on suspension in water, physical agitation and subsequent settling (Mazei et al., 2007). Three grams of peat were soaked in distilled water for 24 h, agitated on a flask shaker for 20 min, sieved and washed through a 500-µm mesh to remove coarse material and then left to settle for 24 h. The supernatant was decanted off and the samples were mixed with formaldehyde and placed in glass vials for storage. One millilitre of the concentrated sample was placed in a Petri dish (5 cm diameter), diluted with deionised water and inspected at 200× magnification. All encountered testate amoebae were identified and tallied with the aim of 150 tests per sample. The data were analysed and plotted in R (R Core Team, 2021) using ‘rioja’ and ‘analogue’ packages (Juggins, 2023; Simpson and Oksanen, 2021). Zones were defined by constrained incremental sum of squares cluster analysis (Grimm, 1987) and a broken-stick model (Bennett, 1996). Mire surface wetness was reconstructed as water table depth (WTD, cm) using a testate amoeba-based transfer function (Tsyganov et al., 2017).
Results
Chronology and peat stratigraphy
The two OxCal age-depth deposition models, Core2017 and 2019 (Figure 2 and Table 1) were created and they show both high agreement indices. For Core2017 age model seven radiocarbon dates were available and additionally Poz-118689 (Core2019) were used. However radiocarbon date IGAN-8209 is clearly outlier. For Core 2019 age model five radiocarbon dates were available and for upper part we used four radiocarbon dates from Core2017 (Poz-130099, IGAN8207, IGAN8208 and Poz-130100), however Poz-122433 is outlier as it is younger than nearby dates). The results of radiocarbon dating indicate that the fen peat accumulation started about 9600 cal yr BP at Core2017 and 10,400 cal yr BP at Core2019, where fen peat layer is 30 cm thicker. Sphagnum peat started to accumulate at both cores about 8900 cal yr BP. The fen peat accumulation rates were higher (12 and 10 mm/yr for Core2017 and Core2019 respectively) than for the Sphagnum peat which accumulated about 7 mm/yr until 6600 cal yr BP when accumulation rate decreased to 2–3 mm/yr. The sharp change in accumulation rate corresponds to the increased proportion of shrubs in peat stratigraphy. In Core2017, the sediment intervals 146–145 and 65–62 cm consisted of very dark, almost black peat, which might potentially contain high charcoal concentration (Appendix 2).
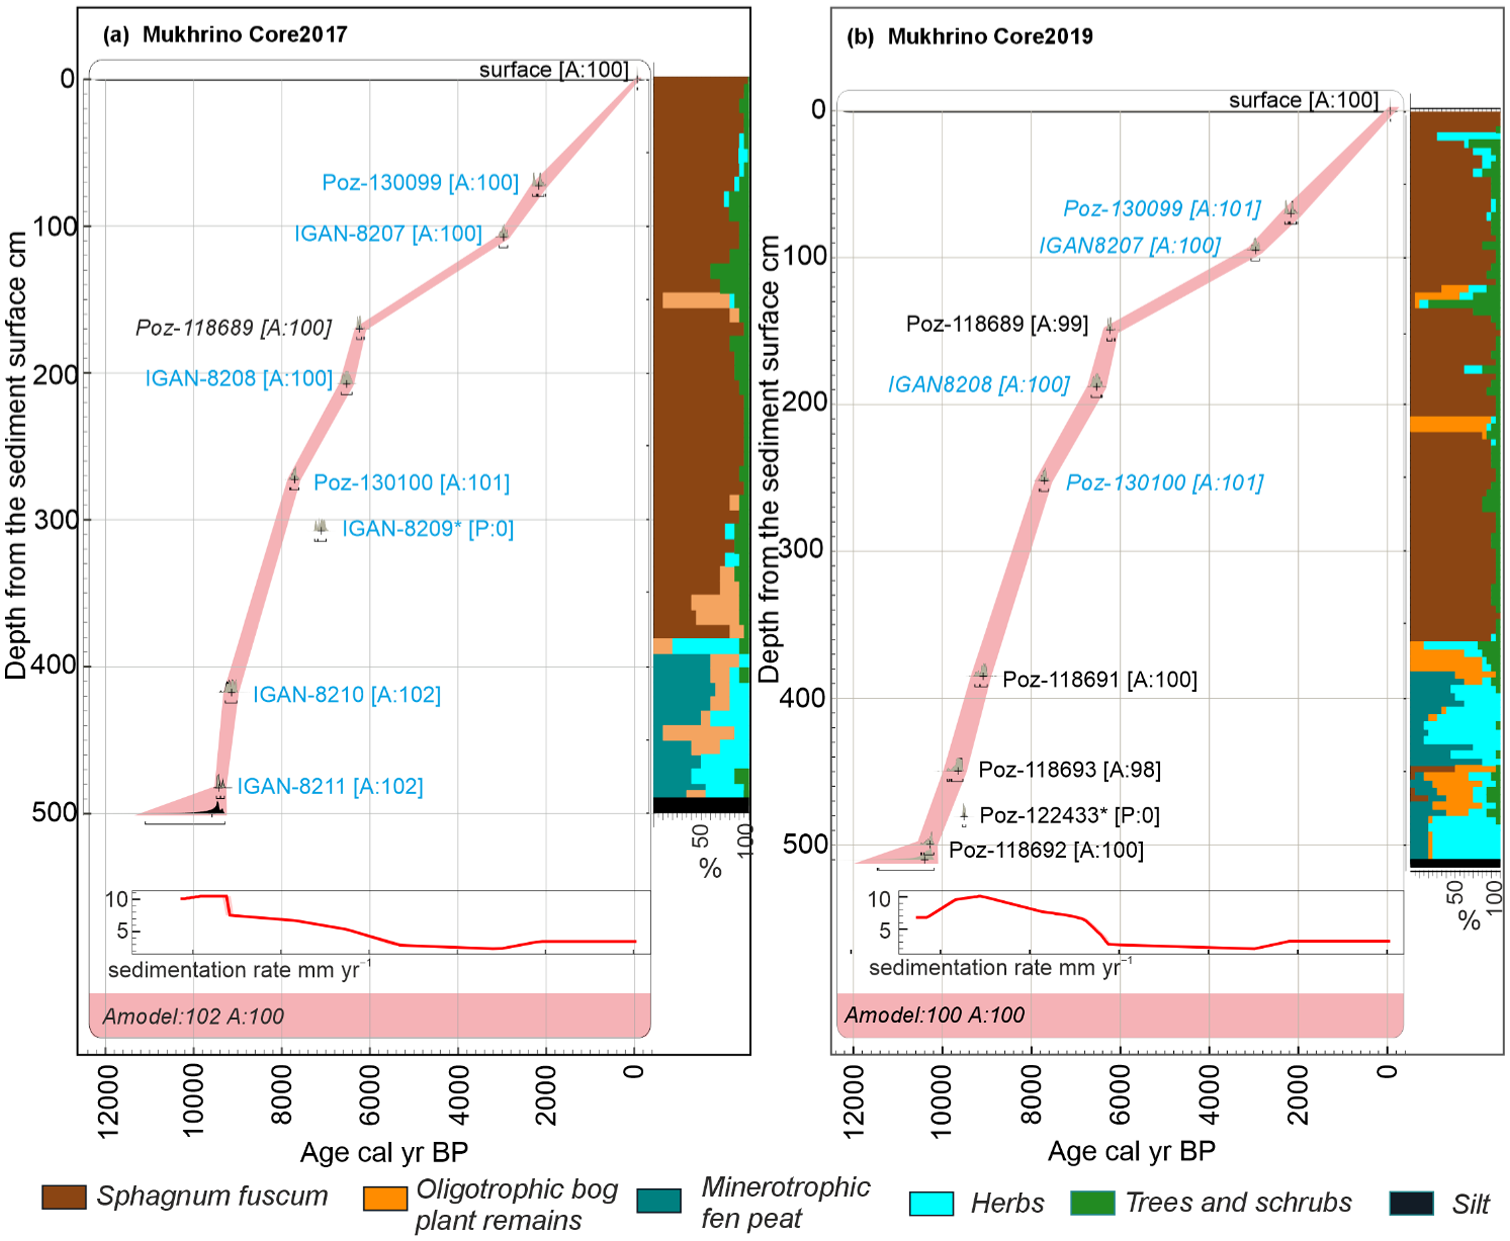
The age depth model, sedimentation rate and the stratigraphy of the peat deposits of the Mukhrino mire for the cores sampled in 2017 (a) and 2019 (b). The calibrated 14C dates are shown in blue for Core2017 and black for Core2019, age depth curve (pink) corresponds to the 95% probability range. The dates which were considered as outliers and not included in the model are marked by asterisk (*). Oligotrophic bog plant remains – Sph. angustifolium, Sph. divinum/medium, Sph. fallax, Sph. teres, Sph. warnstorfii and Hypnales. Minerotrophic fen peat – Carex. Herbs – Equisetum, Eriophorum, Scheuchzeria palustris, Polypodiopsida. Trees and shrubs – Betula, Picea, Pinus, Salix and shrubs.
Physical-chemical peat properties
The bulk density of peat gradually decreased from 0.3 to 0.8 g/cm3 at the mineral bottom to ~0.07 g/cm3 at the surface layers (Figure 3). The local peaks were observed at 400–380 (0.19–0.20 g/cm3), 180–190 (0.14–0.15 g/cm3), 100–150 (0.19–0.28 g/cm3) and 30–40 cm (0.17 g/cm3). The ash content dropped from 9% to less than 4% at the bottom layers (500–460 cm) and remained at these values throughout the entire deposits except for a peak at the depths 360 (~7%) and 90 cm (~17%). Peat humification was the greatest at the bottom (500–400 cm, 10300–9200 cal yr BP) that might be related to the considerable age of the deposits and the intensive decomposition in minerotrophic conditions. At 390–180 cm, peat humification decreased indicating a wetter period with short-term dry phases at 310 cm (8300 cal yr BP) and 260 cm (7800 cal yr BP), each represented by a single sample. Starting from the depth of 180 cm, peat humification increased, reaching the maximum at 150–140 cm (6230–5670 cal yr BP). After that, peat humification decreased to the depth of ~90 cm that can be explained by the predominance of undecomposed organic materials deposited in those layers. Another short-term peak of high decomposition is detected at the depth 50 cm (1530 cal yr BP) and at the surface.
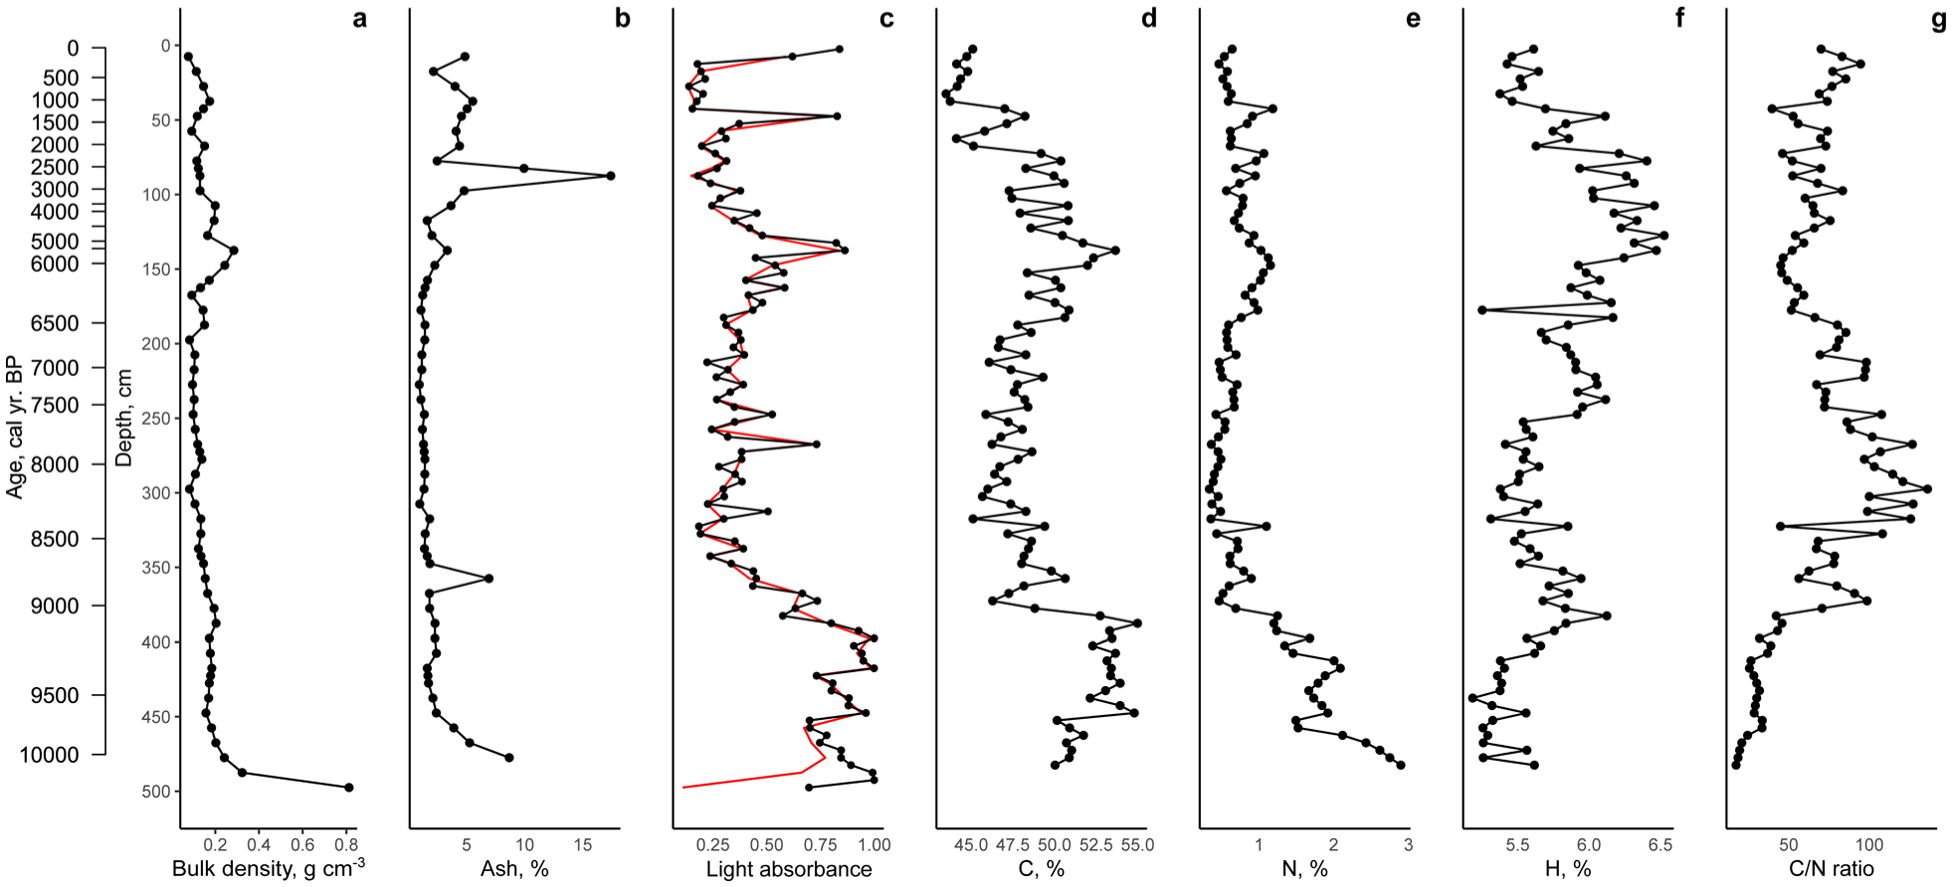
Physical and chemical properties of the peat deposits in the Mukhrino mire. (a) Bulk density (g/cm3). (b) Ash content (%). (c) Peat humification measured as light absorbance (the black line raw measurements, the red line is the values corrected for loss on ignition). (d) Carbon content (%). (e) Nitrogen content (%). (f) Hydrogen content (%). (g) C/N ratio.
The overall values of local carbon content in the studied peat core ranged from 55.0 to 45.0%. At the bottom (500–380 cm) the carbon content was high 52–55%, then sharply dropped to 46% at the depth of 375 cm. From 375 to 80 cm the carbon content increased reaching the greatest values of 53.6% at the depth 140 cm. Then it gradually decreased to the surface reaching minimal values 45–47% at the top. The local nitrogen content decreased from ~2.9% at the mineral bottom to ~0.5% at the surface. The maximal values of nitrogen content were observed at the bottom, then they gradually decreased reaching minimal values 0.5% at the depth of 370 cm. Then it varied around this value to the depths 180–130 cm where it increased to 0.97%. The hydrogen content increased from ~5.2% at the mineral bottom and to its maximum values 5.9–6.5% at 175–75 cm. Local peaks and drops can be observed at the depths 385 cm (~6%) and 180 cm (5.2%), respectively. Simultaneous local peaks of carbon, nitrogen and hydrogen content can be observed at the depths 375, 150–140, and 50 cm. The C/N ratio gradually increased at the depths from 500 to 300 cm reaching its maximum and indicating the decline in nutrient availability. After that it decreased and varied at the levels typical for oligotrophic mires.
Plant macrofossil analysis
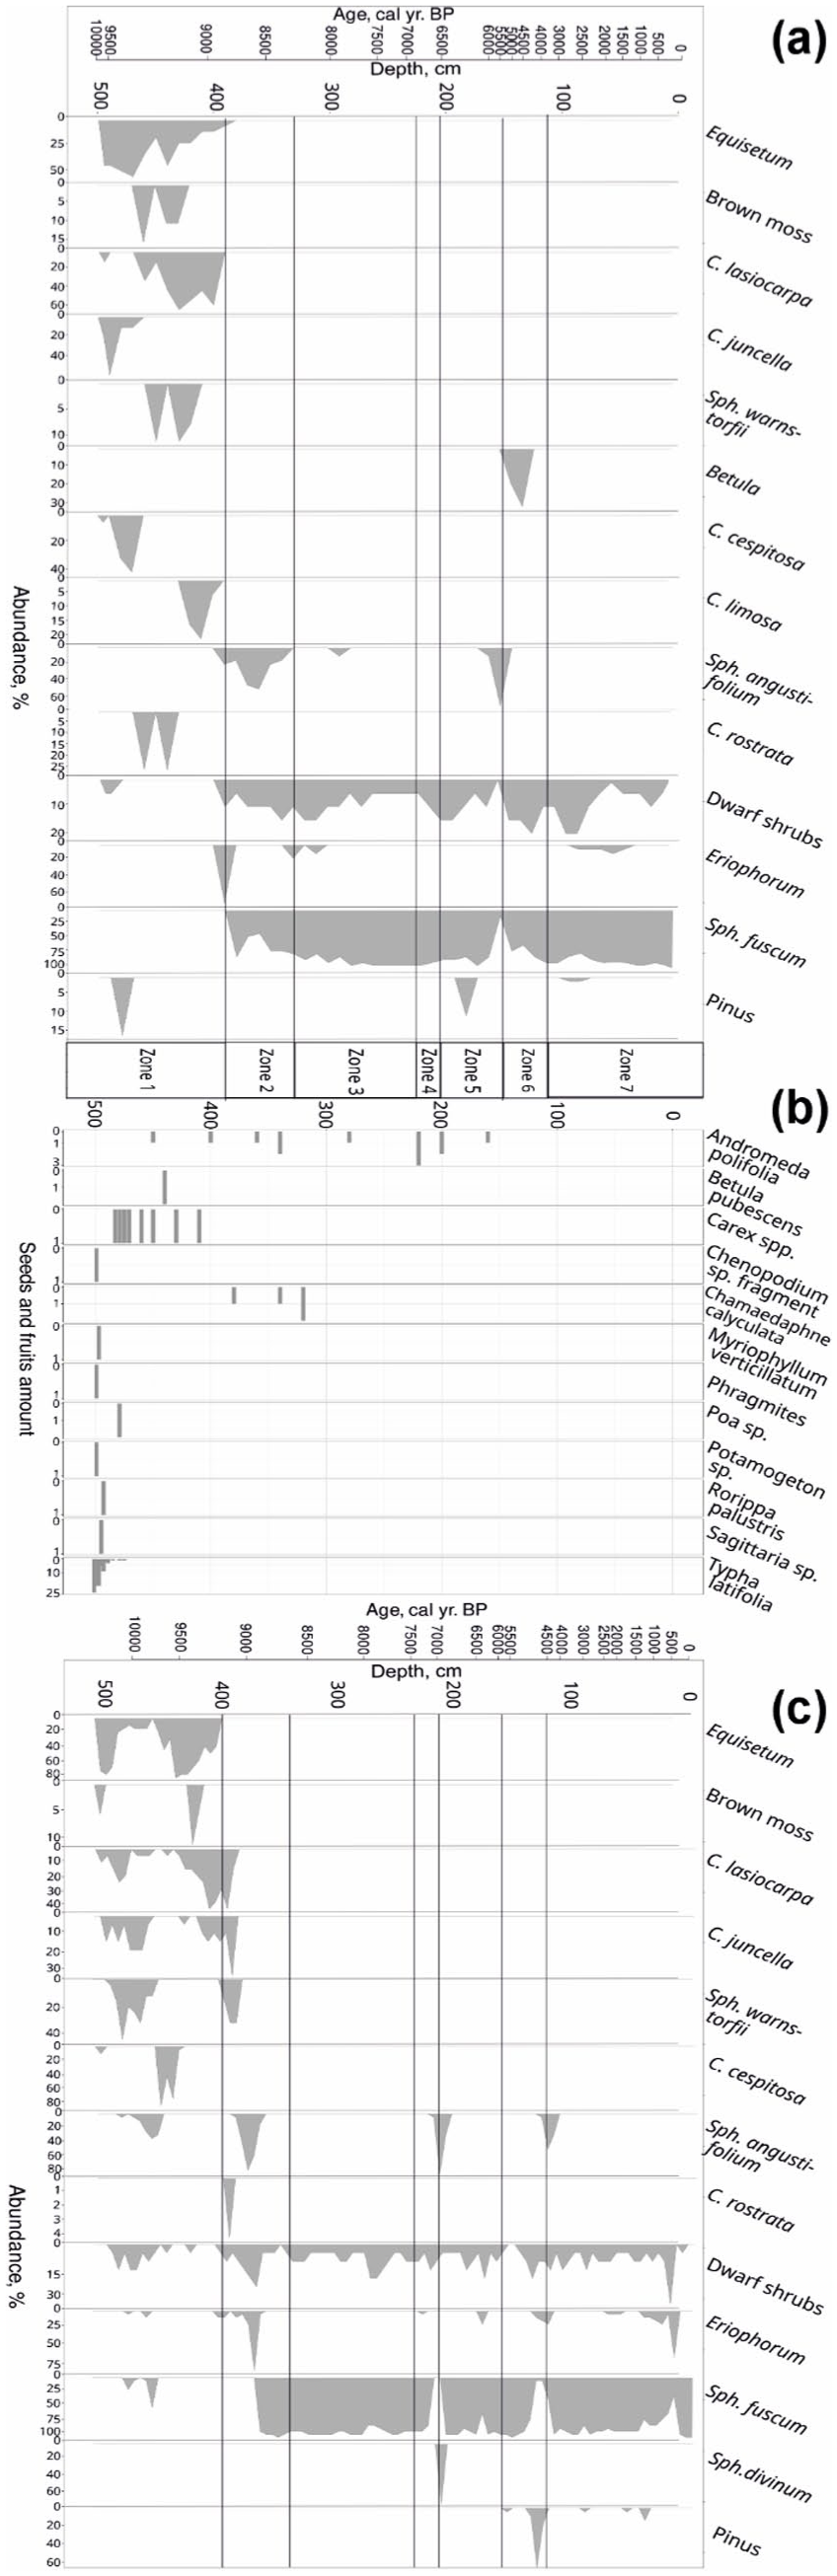
Plant macrofossil (a and c) and carpological composition (b) of the peat deposits in the Mukhrino mire. The figures (a) and (b) are based on Core2017 and figure (c) on Core2019. The species with low abundances or observed in one core only (Sph. balticum, Sph. fallax, Sph. teres, Scheuchzeria sp., Dryopteris thelypteris and Salix) are not shown. The plant macrofossil composition of Core2020 is presented in Supplemental Material, Figure SM1.
Carpological analysis
The sediments of the Core2017 consisted of seeds of aquatic and mire/wetland plants. In total, 12 taxa were identified (Figure 4). In the basal samples (501–495 cm, ~9600–9500 cal yr BP), the main findings were the seeds of Typha, with few others (Phragmites and Chenopodium). The occurrence of aquatic seeds (Potamogeton, Myriophyllum and Sagittaria) confirms the onset of the organic matter sedimentation in the aquatic environment. The amount of Typha seeds declines starting from the depth of 495 cm (~9500 cal yr BP) and since then the majority of the observed seeds belonged to wetland/mire plants (Carex, Andromeda and Chamaedaphne). Only one tree seed (Betula pubescens) was found around 9200 cal yr BP.
Testate amoebae
The peat deposits can be divided into six zones based on the species composition of testate amoebae: TA1 (500–490 cm, 10,290–10,160 cal yr BP), TA2 (490–450 cm, 10,160–9650 cal yr BP), TA3 (450–400 cm, 9650–9220 cal yr BP), TA4 (400–180 cm, 9220–6470 cal yr BP), TA5 (180–70 cm, 6470–2170 cal yr BP) and TA6 (70–0 cm, 2170 cal yr BP–2019 CE; Figure 5). Testate amoebae were not observed in Zone TA1, which probably can be attributed to a high mineral content of the bottom sediments. In Zone TA2, Sphagnum-dwelling hydrophilic taxa Archerella jollyi (74%, here and further to the total counts per zone) and Archerella flavum (8%) were the most abundant. In addition, a xerophilic taxon Assulina muscorum (13%) was also present. The mean reconstructed values of WTD in this zone is 17 ± 6.4 cm. Testate amoebae were almost absent in Zone TA3, except for several shells of aquatic Centropyxis aculeata, that might indicate flooding. Zone TA4 was generally dominated by hydrophilic taxa Archerella jollyi (31%), Archerella flavum (8%) and Hyalosphenia papilio (7%) although some short-term dry periods with the dominance of xerophilic Trigonopyxis arcula and Trigonopyxis minuta can be identified at 340–310 cm and 285–260 cm. The mean value of reconstructed WTD in this zone is 17.2 ± 9.8 cm reaching approximately 40 cm during the dry phases. In Zone TA5, Sphagnum-dwelling xerophilic taxa Trigonopyxis arcula (35%), Arcella arenaria compressa (25%) and Trigonopyxis minuta (20%) became the most abundant. The reconstructed WTD values increased to 25.9 ± 6.0 cm (Figure 5). In Zone TA6, the abundance of the xerophilic taxa which was dominant in the previous zone decreased and assemblages became more diverse with the predominance of Cryptodifflugia oviformis (25%), Trigonopyxis arcula (15%), Trinema lineare (15%) and Trigonopyxis minuta (10%). The values of reconstructed WTD increased to 29.7 ± 6.8 cm.
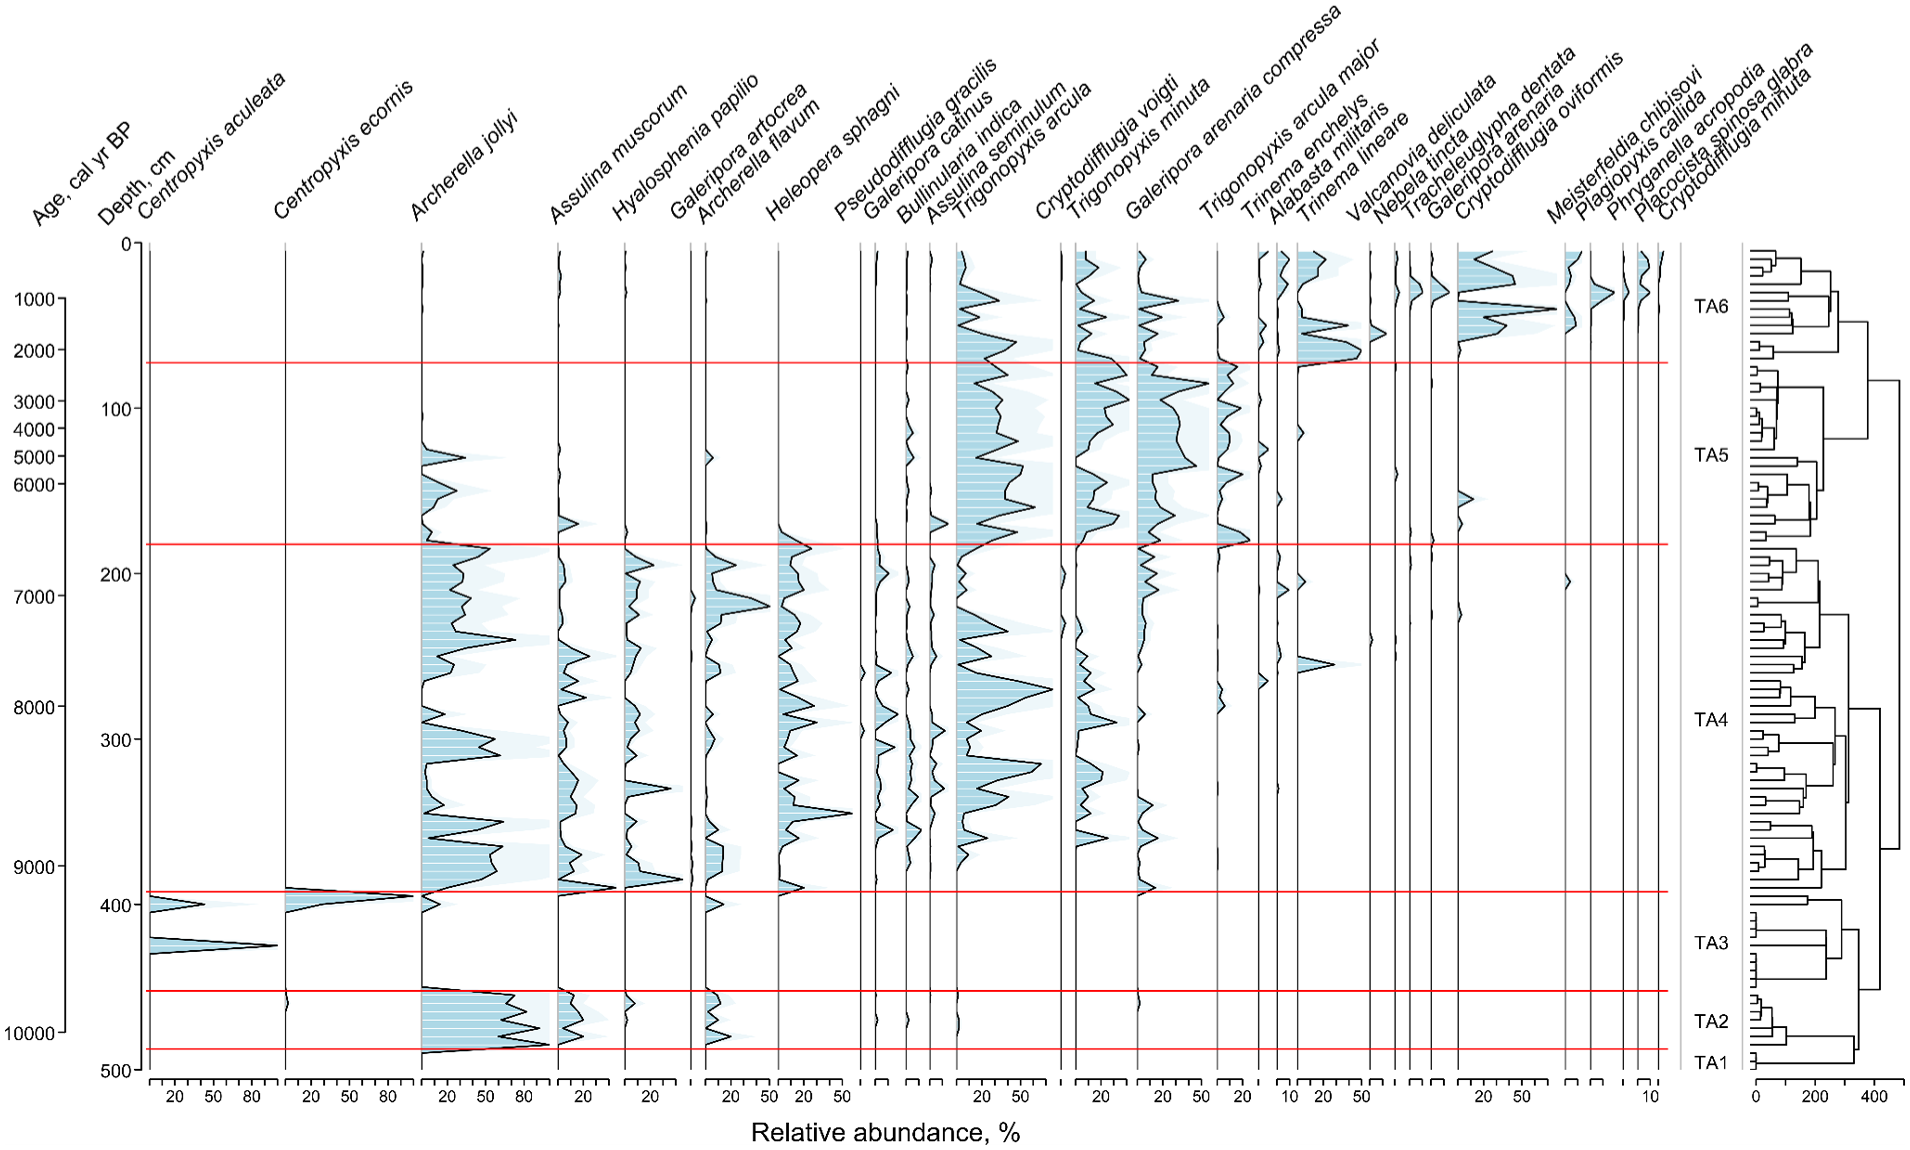
Testate amoeba diagram showing the most common testate amoeba taxa (occurred in two or more samples with the relative abundance greater than 3% at least in one sample). Six zones (TA1–TA6) were identified based on the constrained incremental sum of squares. The taxa are ordered by weighted average age of the depth/time axis.
Palynological analysis
Based on the results of pollen analysis seven main biostratigraphic zones (Figure 6, Supplementary Materials Figure SM2 – pollen concentrations) could be identified. All zones are characterised by high content of tree pollen, which indicates the presence of forests in the study area for the entire period.
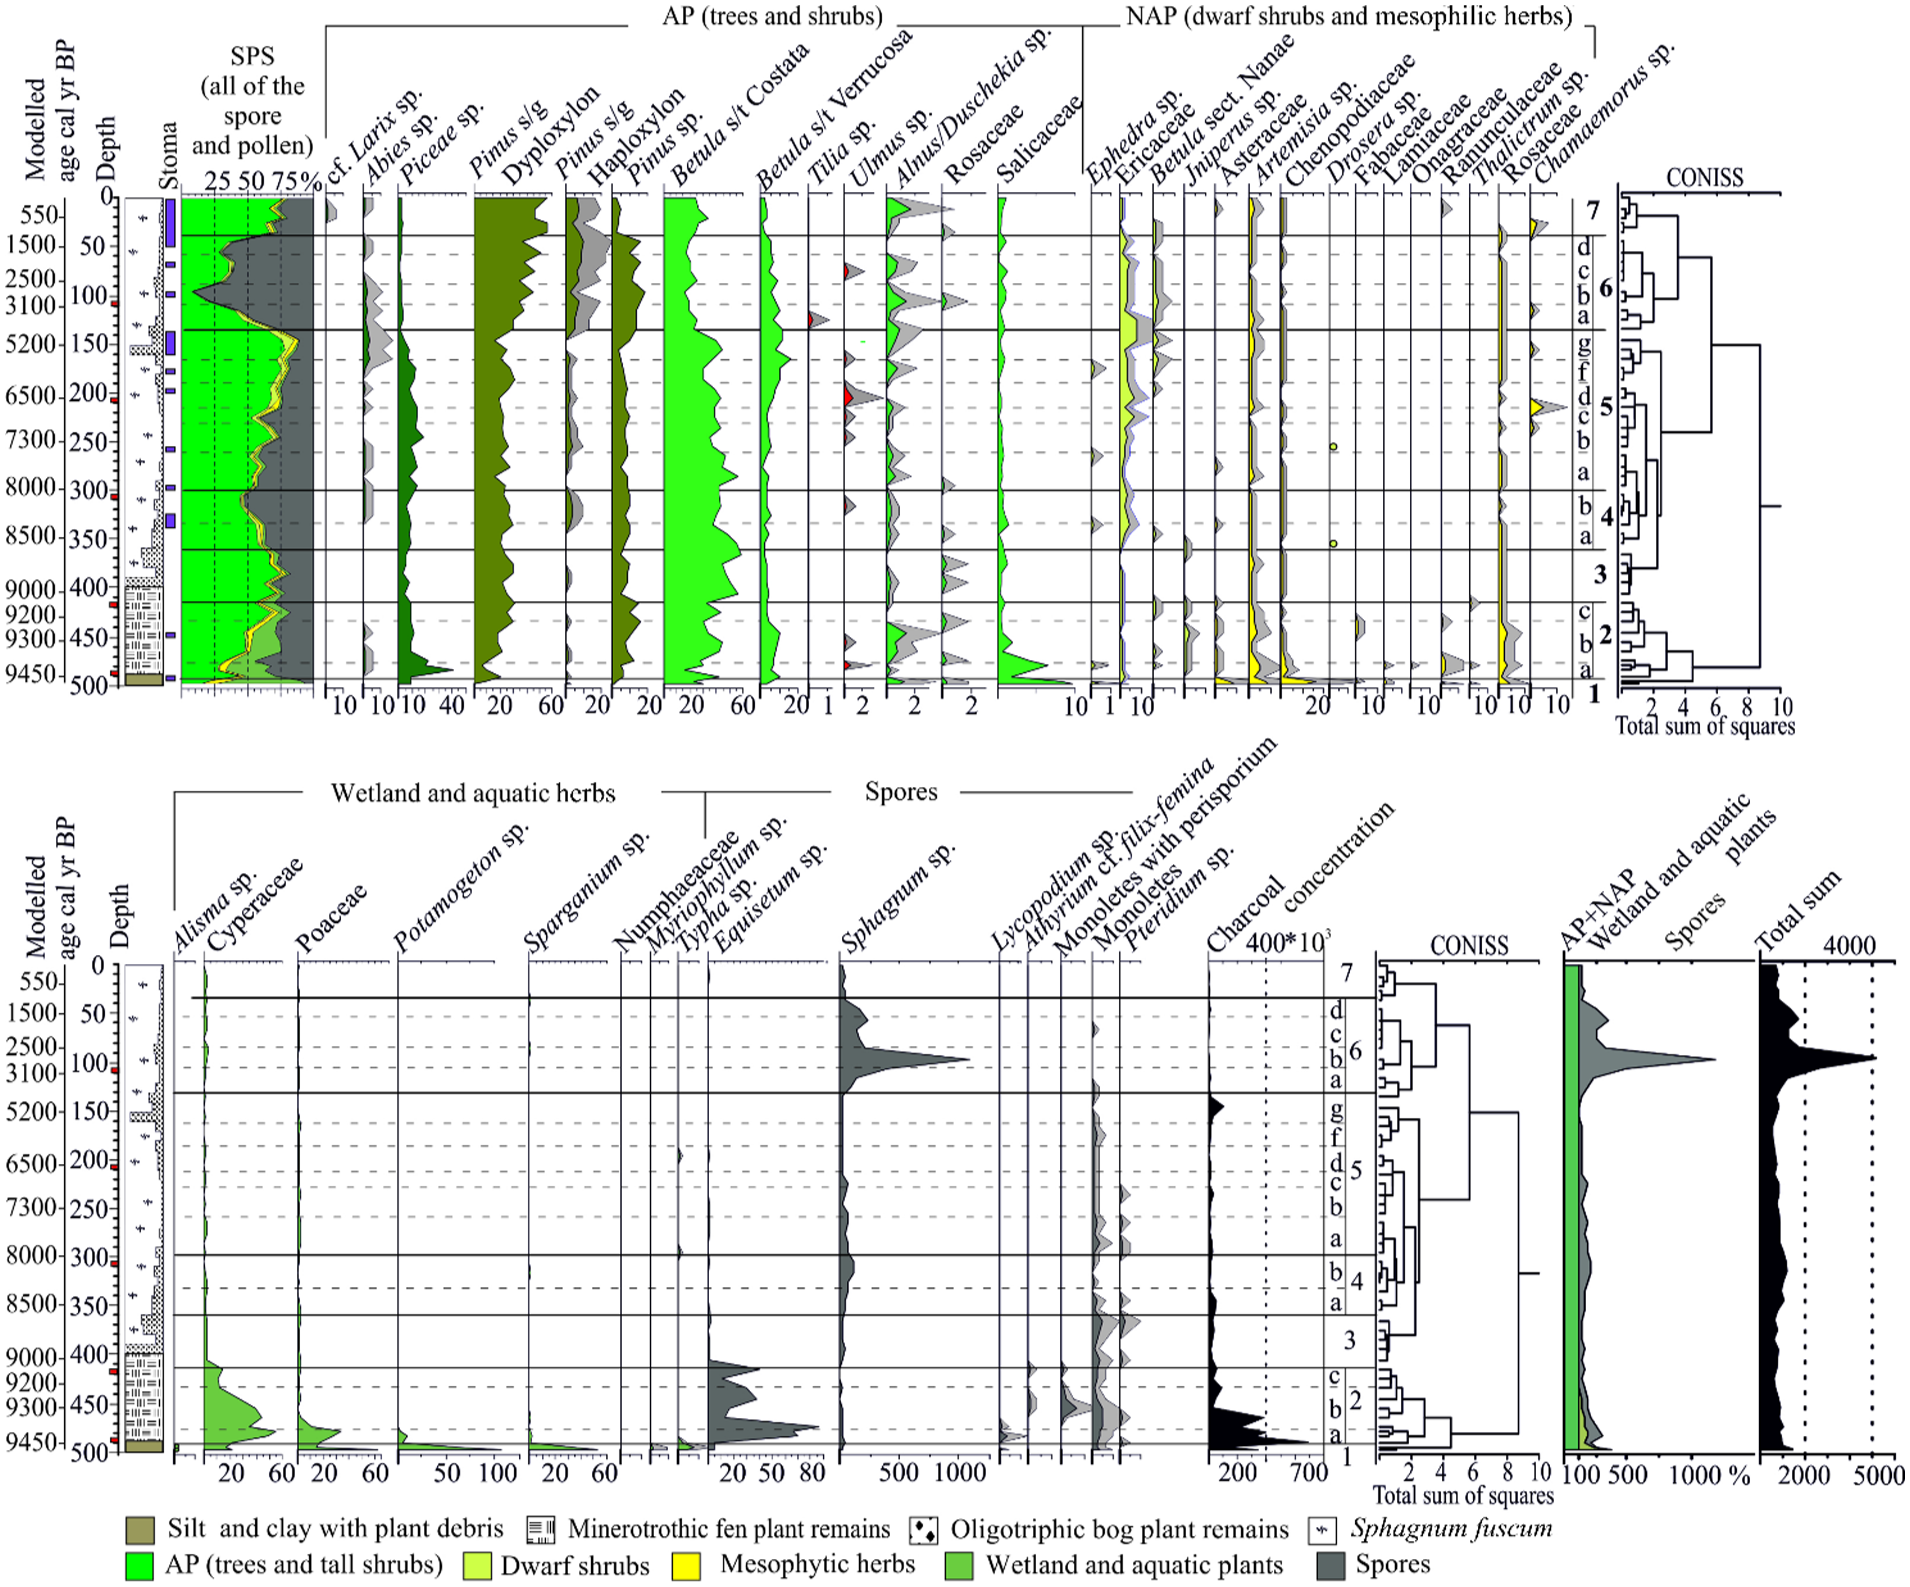
Diagram of pollen percentages in the peat deposits of the Mukhrino mire.
During
In
In
Geochemical proxies and biomarkers: n-Alkane and δ13C analyses
The extracted organic matter (EOM) content in peat core varied from 20.5 to 75.4 mg/g reaching its maximum at 85–90 cm (~2600–2800 cal yr BP; Figure 7). It gradually increased from 480 cm up to 90 cm (except for a small shift at 350–340 cm) and then decreased to the top of the deposits. The concentrations of the n-alkane homologues from nC17 to nC33 (Figure 7) show that their total content per sample ranged from 0.00001 to 0.45 mg/g of dry peat. The proportion of various n-alkane homologues to the sum of all identified n-alkanes varied from 0.15% to 18.7%. The maximum concentration was measured at the depth 40–45 cm (~1200–1400 cal yr BP). The most abundant homologues were nC25, nC27, nC29, nC31 and nC33 while the amounts of nC17 and nC21 were generally low. The concentration of nC17 was very low and maximum value was 0.019 mg/g in the uppermost peat sample. The concentration on nC21 ranged between 0.0007 and 0.038 mg/g of dry peat. The concentration of the most abundant n-alkane homologue nC31 varied from 0.007 to 0.45 mg/g of dry peat. In the basal samples, the content of nC27, nC29 and nC31 were high. At 345–340 cm (~8700 to 8600 cal yr BP) the content of n-alkanes decreased notably and nC31 became a prevalent n-alkane homologue. An increase in the concentration of n-alkanes occurred at a depth of 90 cm (~2800 cal yr BP). nC31 reached a maximum proportion 18.7% of the sum of all identified n-alkanes and 0.45 mg/g of dry peat at a depth of 45 cm (~1400 cal yr BP).
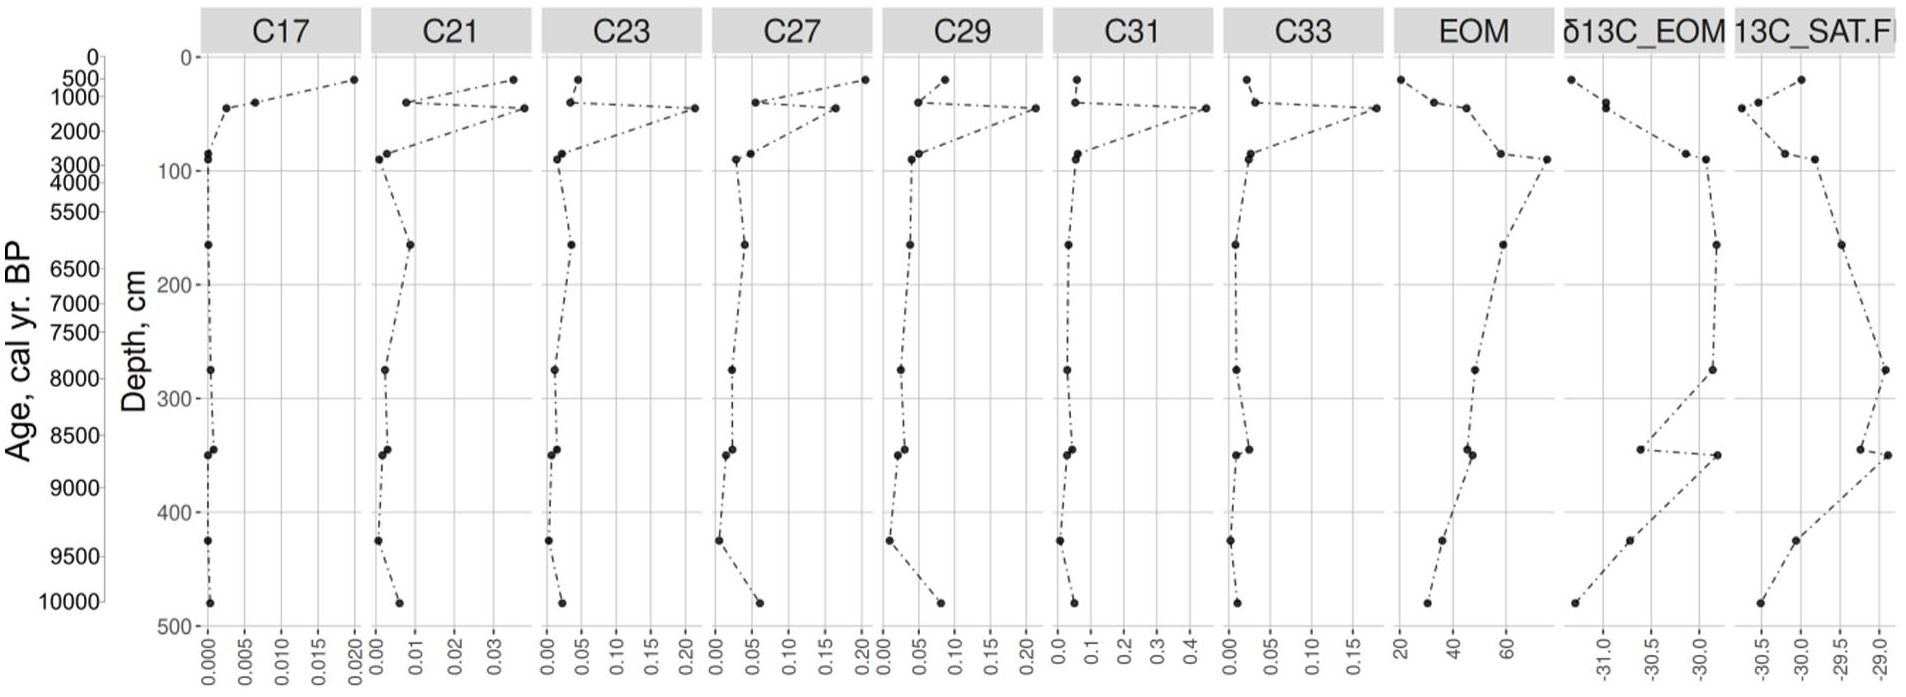
The n-alkane (the C-index means the length of n-alkane chain) content (mg/g of dry peat) in the Core2019 in Mukhrino mire.
The δ13С ranged from –31.33‰ to –29.81‰. δ13С increased from the bottom to the depths of 350–345 cm, reaching its maximal values and then it sharply dropped. This might indicate the transition of the mire from the mesotrophic to the oligotrophic stage and the corresponding changes in vegetation. After that, δ13С values remained stable to the depth of 90 cm (~2800 cal yr BP) that can be related to the stability of climate humidity and macrofossil composition. At the depths of 90–0 cm, δ13С gradually decreased, reaching minimal values at the top showing a decrease in surface wetness.
Discussion
The Holocene changing vegetation patterns in Western Siberia has been influenced by many factors, including climatic conditions, landscape change, permafrost conditions, fire regimes. The findings of this study enable a multiproxy reconstruction with focus on local dynamics of vegetation and the hydrological regime within the Mukhrino mire complex and surrounding areas, utilising two adjacent peat cores. By incorporating the pollen record from the peat deposits, this research provides the first opportunity for a regional assessment and comparison with the previously published palaeoecological records from Western Siberia. The results will be interpreted in the context of prior studies (Amon et al., 2020; Lamentowicz et al., 2015; Tsyganov et al., 2021; Zarov et al., 2023a) on mire ecosystems, facilitating the identification of local variations in mire development and hydrological patterns. Previous research (Tsyganov et al., 2021; Zarov et al., 2023a) has highlighted the complex onset and development of the mire, potentially influenced by variations in initial peat accumulation conditions, microtopography and localised fire events. The spatial heterogeneity of mires complicates precise age correlations and challenges age-scale modelling efforts. Nonetheless, employing a multi-core approach offers the means to address the limitations associated with single-core methodologies, which have been predominant in palaeoecological research.
The onset of the organic accumulation and eutrophic stage (10,400/9600–9300 cal yr BP)
Our results indicate the different onset of the organic accumulation around 11,500–10,200 (median age 10,400) and 10,700–9300 (median age 9600) cal yr BP at 95.4% probability for Core2019 and Core2017, respectively. The two cores are only several metres apart but the differences in the sedimentation and chronologies are a common feature in mire studies that is generally related to the underlying topography of the mineral ground (Bauer et al., 2003). The previous study by Tsyganov et al. (2021) shows that the age of the basal organic layers in the Mukhrino bog were around 9360 cal yr BP. Blyakharchuk et al. (2021) reported the age 11,300 cal yr BP for the basal sediment of swamp lake near Mukhrino mire station. Zarov et al. (2023a) have dated the start of the accumulation of the fen peat in seven cores in the range between 11,000 and 10,000 cal yr BP. The latter study also suggested that a lake existed in the western part of the Mukhrino bog before 10,050 cal yr BP and in the eastern part ancient riverbed was dated to 11,000 cal yr BP. Our findings corroborate the results of the previous study which reported a widespread wetland formation in Western Siberia between 10,000 and 11,000 cal yr BP (Kremenetski et al., 2003). In addition, the results of our pollen analysis revealed the presence of Ephedra, Ulmus, Juglans, Carya, dark coniferous taxa and charcoal particles, which might indicate redeposition from older sediments. Overall, this indicates that the accumulation of organic rich sediments in Mukhrino started 11,000–9360 cal yr BP and was directly connected to the complex underlying topography and its active transformation at the initial stages of paludification.
The initial conditions of peat accumulation for two adjacent cores Core2017 and Core2019 were different (Figure 8). The basal organic layers in Core2019 were mainly formed by remains of Carex and Equisetum with brown mosses, that points to wet but relatively well drained conditions (eutrophic fen). The prevalent n-alkanes were nC27, nC29 and nC31, indicating its origin from higher terrestrial plants. On the other hand, the initial sedimentation of Core2017 was characterised by a well-developed layer of basal silt with aquatic seeds (e.g. Potamogeton, Myriophyllum, Figure 4, section b) indicating aquatic environments. The initial aquatic sedimentation is also supported by the pollen and spores record of Core2017. The pollen spectra of Zone PZ1 (9600–9450 cal yr BP, Figure 6) indicate the presence of aquatic environments surrounding herbaceous meadows and Salix sp. Overall, this indicates an early and a short stage of the landscape development when local depressions formed waterbodies, and watersheds were colonised by tree taxa. The regional vegetation at that time was represented by pine-birch forests, possibly with dark coniferous species (Binney et al., 2017). The spread of the tree vegetation is also confirmed in Subpolar Urals (Larix, Betula, Picea; Antipina and Panova, 2016). The palaeoecological records from West Siberian southern taiga zone describe the postglacial succession starting with steppe-type communities during the Lateglacial period followed by forests with various proportions of Betula or/and conifers (Borisova et al., 2011).
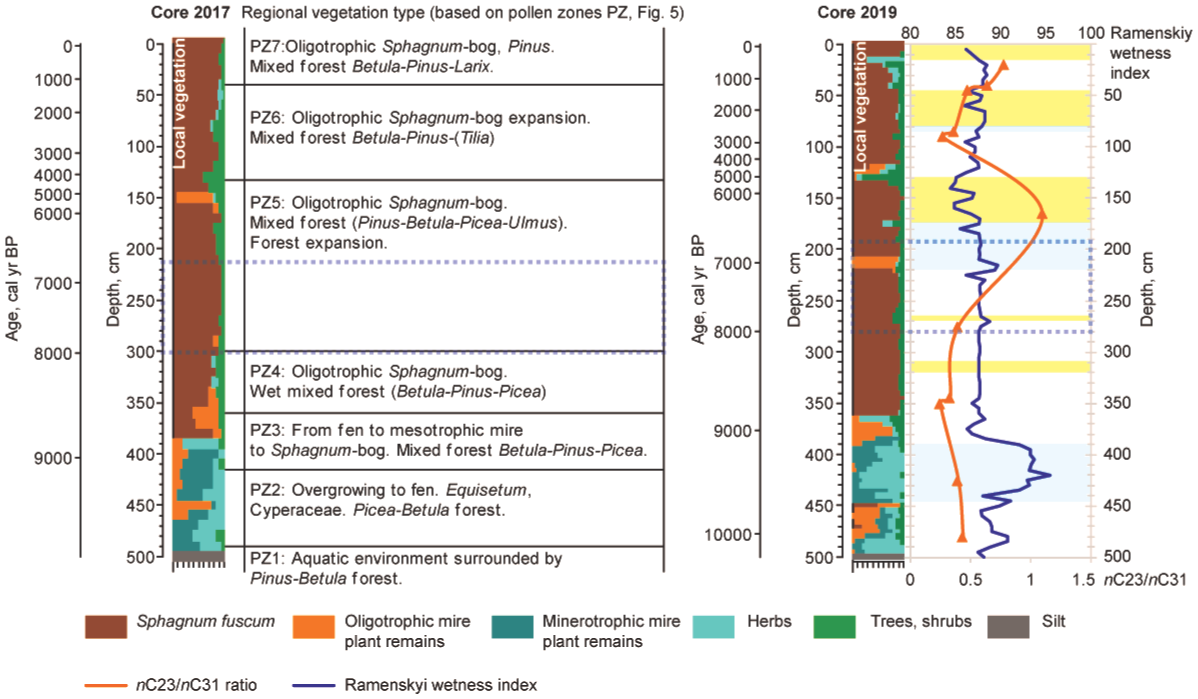
The overview of regional and local vegetation development and wetness indicators of Mukhrino mire. The Core2017 record includes local and regional vegetation dynamics. The Core2019 record summarises local vegetation, n-alkane-based nC23/nC31 ratio (orange line), Ramenskiy wetness index (blue line) and testate amoebae-based wet/dry intervals (blue – wet phase, yellow – dry phase). The local vegetation composition legend follows Figure 2. The dotted section indicates the flooding period (~8000 to 6800/6700 cal yr BP) of nearby Lake Svetlenkoye (Amon et al., 2020). Oligotrophic bog plant remains – Sph. angustifolium, Sph. divinum/medium, Sph. fallax, Sph. teres, Sph. warntstorfii and Hypnales. Minerotrophic fen peat – Carex. Herbs – Equisetum, Eriophorum, Scheuchzeria palustris, Polypodiopsida. Trees and shrubs – Betula, Picea, Pinus, Salix and shrubs.
The aquatic site (Core2017) overgrew to fen as a result of peat accumulation that permitted their colonisation by terrestrial plants. The overgrowth is characterised by abundant presence of Typha seeds and remains of various sedges (Carex) and horsetail (Equisetum). The eutrophic vegetation formation was supported by underlying mineral-rich deposits as shown by high N content and C/H ratio and low C/N ratio. The pollen data also indicates that the water basin and the surrounding territory starts to transform into a fen. The fen site (Core2019) was characterised by high local wetness as indicated by Ramenskiy index and poor preservation of testate amoebae. The low preservation of testate amoebae at eutrophic stages of mire can be commonly observed (Payne, 2011).
The n-alkane-based ACL value (Figure 9a) characterises the average length of the carbon chain of n-alkanes in the sample, which varies depending on the predominant species of peat-forming plants. The appearance of these plants in turn reflects the climatic and environmental (i.e. hydrological) conditions of the study area. Therefore, the dynamics of ACL values can indirectly reflect changes in both plant communities and the environmental regime. The predominance of medium-long chain n-alkanes (nC23 and nC25) is mainly attributed to aquatic sources or Sphagnum species (Baas et al., 2000; Nott et al., 2000), whereas long-chain components are mainly attributed to terrestrial plants and macrophytes (Eglinton and Hamilton, 1967). For example, the predominance of nC31 in the concentration distribution may indicate grasses, while trees preferentially synthesise nC27 and nC29 alkanes (Thomas et al., 2021). The ACL values in Mukhrino record vary between 27.1 and 28.6 (Figure 9). In the basal samples, the ACL value is 27.8–28.0. The vegetation type was also characterised by n-alkane-based nC23/nC31 ratio (Figures 8 and 9a). In the eutrophic stage, n-alkane-based nC23/nC31 ratio was low, ~0.4 and in accordance with local vegetation record (Figure 4), proving the dominance of sedges, shrubs and horsetails. The Paq parameter (Ficken et al., 2000) can reflect the predominant contribution of algae, aquatic macrophytes or terrestrial plants in the organic matter of lake sediments. High Paq values indicate high aquatic input and low values indicate low aquatic input relative to terrestrial material (Toney et al., 2020). For example, n-alkane distribution of Sphagnum species is similar to aquatic macrophytes, so the Paq parameter can be used to assess the relative share of Sphagnum compared to other peat-forming plants in boreal peatlands (Nichols et al., 2006). Paq value for the onset and eutrophic stage of Mukhrino mire is rather low 0.35–0.37 (Figure 9a).
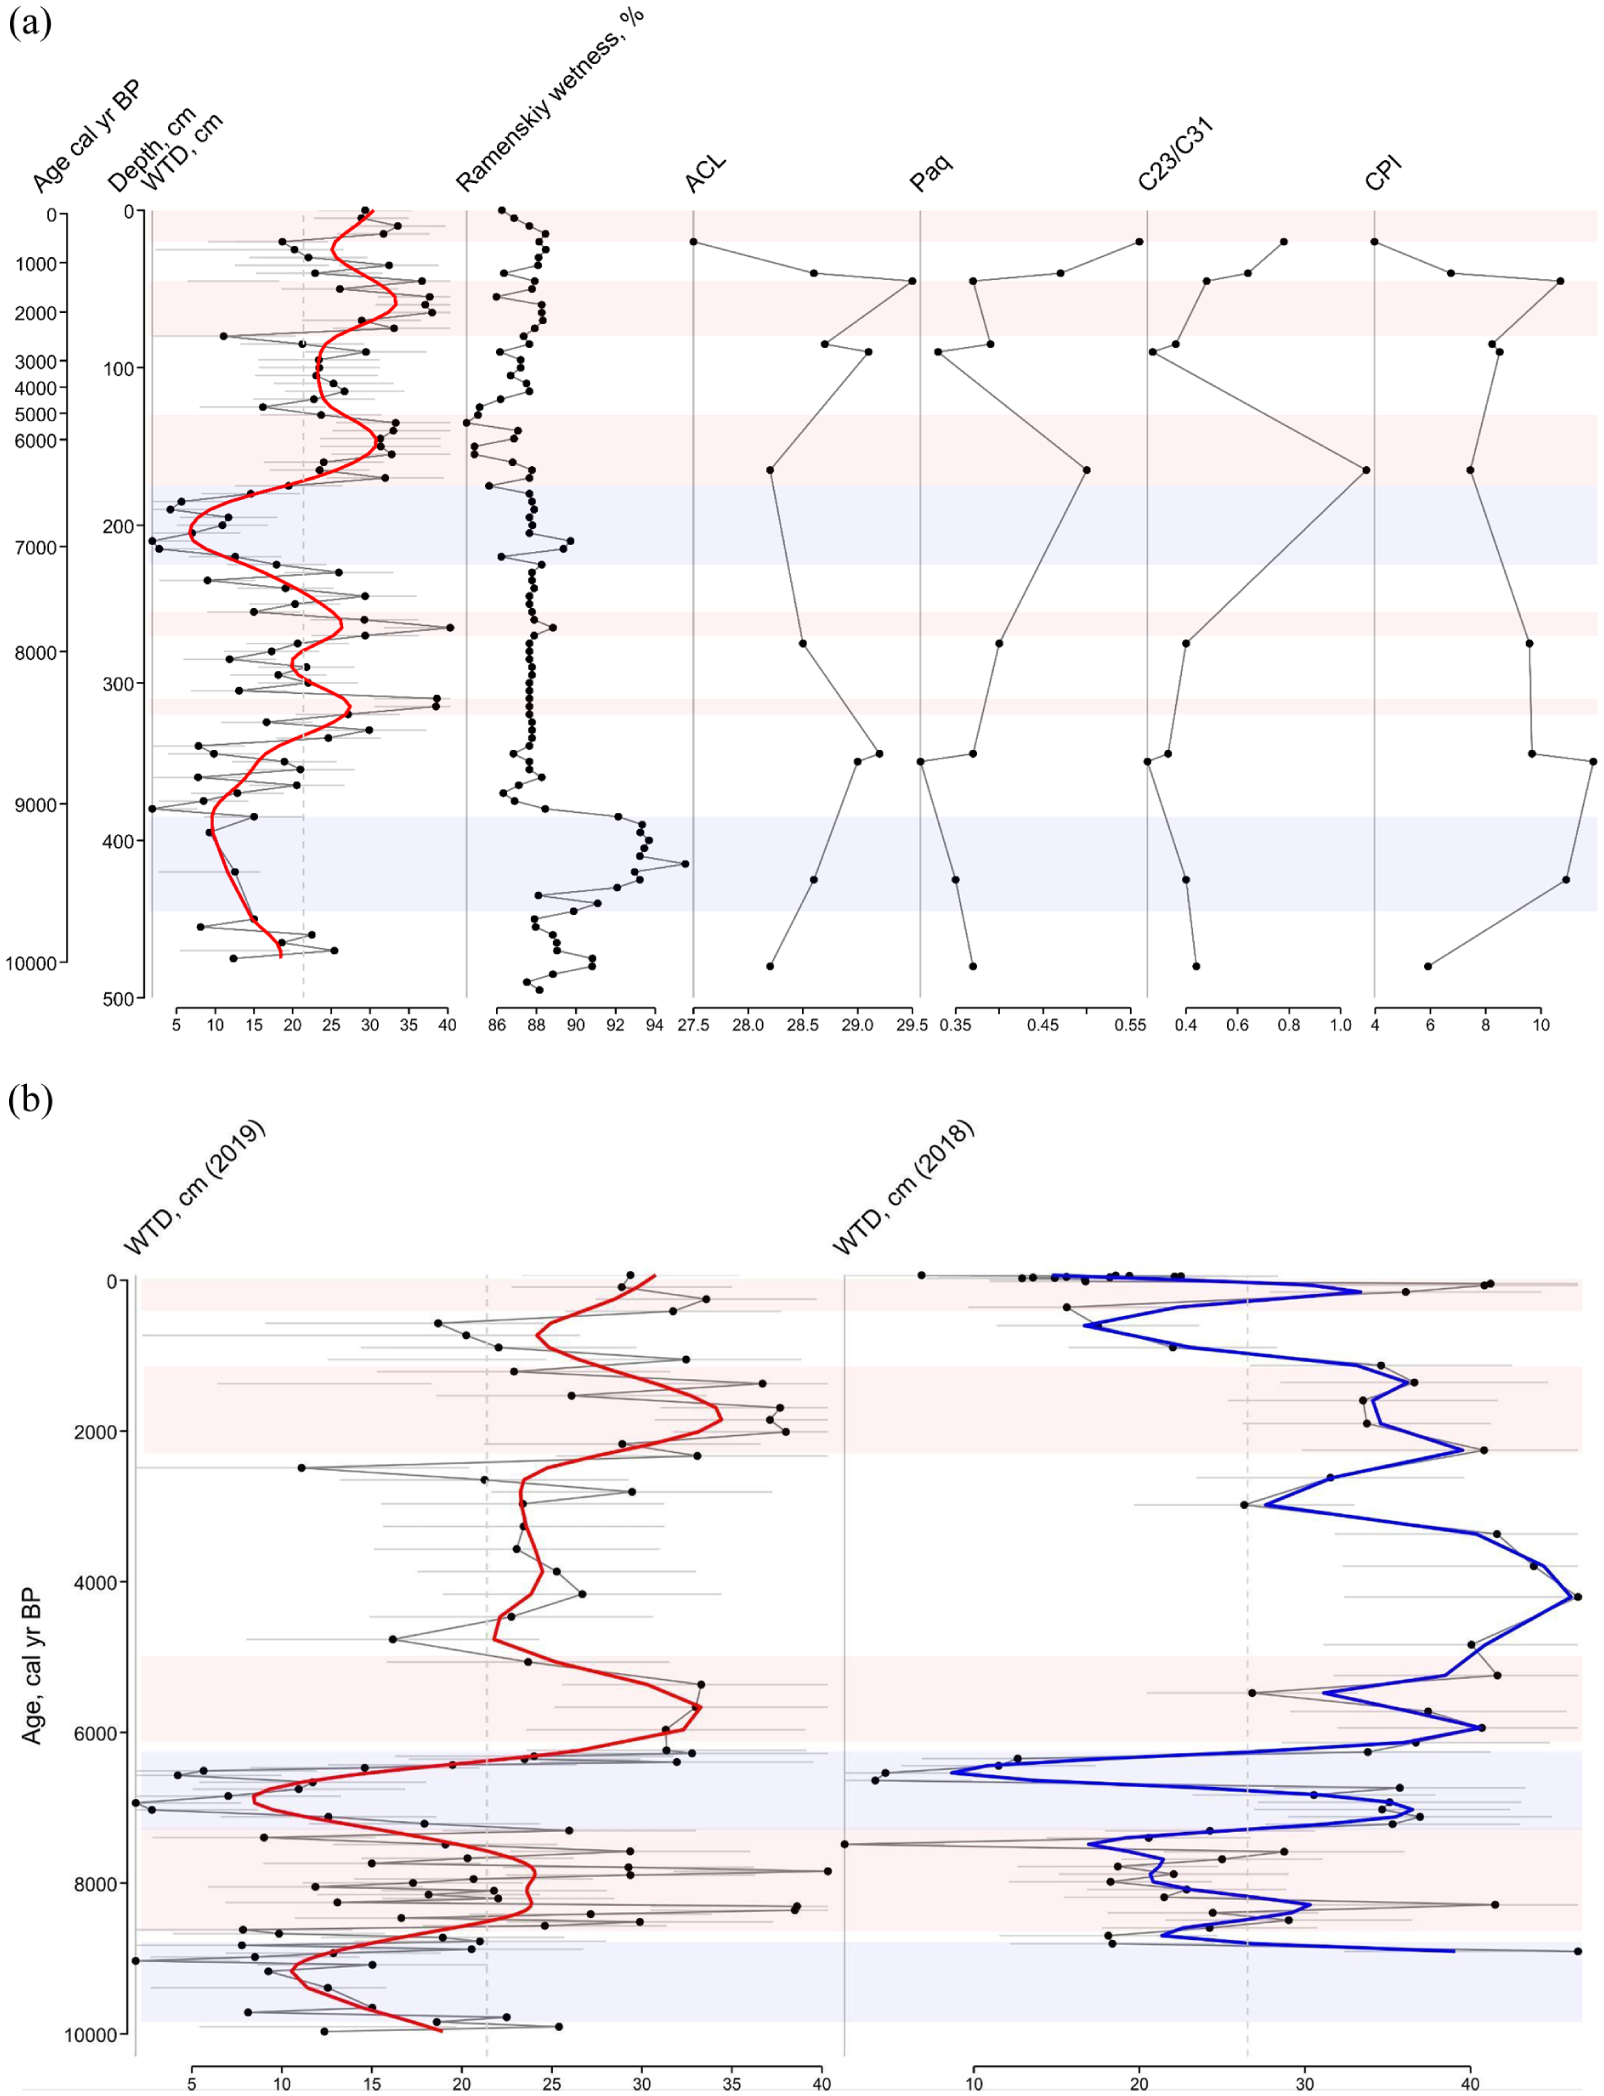
(a) Summary of surface wetness indicators for the peat deposits of the Mukhrino mire: WTD (cm) – testate amoeba-based reconstruction of water table depth, the grey bar are reconstruction errors, the red line is smooth estimates by generalised additive models, Ramenskiy wetness (%) – plant macrofossil-based estimation of surface wetness using the Ramenskiy scale, ACL – average chain length, Paq – aquatic to terrestrial plants ratio, nC23/nC31 ratio, CPI – carbon preference index. Blue zones indicate wet periods, orange – dry periods in comparison to the mean WTD for the entire period (dashed line). (b) Comparison of testate amoeba-based reconstructions of water table depth using the data presented in this paper (Core2019) and data published by Tsyganov et al. (2021). The data are plotted against age that resulted in smoothing of short-term periods.
The regional vegetation shows climate warming so that starting from this period, Ulmus is constantly present at the adjacent territories. The forests were generally dominated by Picea with an admixture of Betula sp. on the elevated areas around the mire that were replaced by birch forests due to fires. High local wetness of the study site was related to topographic position and low permeability of underlying clay and promoted further paludification of the site. The high level of sedimentary charcoal may reflect large fires in the watershed that may hint at the drier or warmer conditions in the region (Blyakharchuk, 2009). Our findings are in accordance with a recent palaeo-fire study from this study region reporting intense early Holocene fires (Blyakharchuk, 2009; Pupysheva and Blyakharchuk, 2024).
The mesotrophic stage of mire development (400–350 cm, ~9300–8800 cal yr BP)
During this relatively brief period, the local vegetation changed from eutrophic to mesotrophic. This might indicate that the peat layer became thicker, but the subsurface mineral soil was still reachable by plant roots to support the plant growth (Payne et al., 2016). At the beginning (9200–9000 cal yr BP) it gradually became dominated by dwarf shrubs (Chamaedaphne and Andromeda) while horsetail (Equisetum) and Carex species disappeared. Peat humification and C/N ratio sharply decreased (Figure 3) indicating reduced nutrient availability and decomposition rates. The pollen spectra also showed the formation of mesotrophic mire which was intensively colonised by Sphagnum. Despite the mire expansion, mixed forests of Betula sp., Pinus sp. and Picea sp. continue to dominate the landscape. Mesophytic meadows completely disappeared from the study area. The environmental conditions were generally dry but became wetter by the end of the period. Local surface wetness was clearly reduced; however, the rate of this reduction was different depending on proxies. Ramenskiy wetness index, based on local vegetation, indicated a sharp decrease, whereas testate amoebae showed a more gradual shift. The biomarker-based wetness indicators support the gradual drier conditions. The n-alkane concentrations were increasing, and the dominant homologues were nC29 and nC31 derived from terrestrial plants, sedges, grasses. However, these local drier conditions may be related to peat accumulation and microtopography. The previous studies demonstrated that this period was characterised by relatively high temperatures and precipitation levels (Blyakharchuk, 2009) with low seasonality (Groisman et al., 2013) and few fires (Pupysheva and Blyakharchuk, 2024). These conditions promoted active mire development in the region (Pitkänen et al., 2002; Tsyganov et al., 2021). Therefore, the local reduction in surface wetness in our study could be generally explained by peat accumulation and related changes in topography (autogenic factors). The overall dryness indicated by pollen is a result of Betula expansion to the previously flooded sites which also can be related to reduced climate seasonality (Groisman et al., 2013). Overall, our data show that despite the generally wet regional conditions local wetness might be reduced due to peat accumulation and changes in flooding regime.
Fen-to-bog transition and initiation of an oligotrophic bog (~8800–6500 cal yr BP)
The transition from the mesotrophic to the oligotrophic stage took place around ~8800 cal yr BP and was relatively rapid (fen-to-bog transition). After that the vegetation was mainly dominated by Sphagnum fuscum. Overall, the period corresponds well to the other studies (Tsyganov et al., 2021; Zarov et al., 2023a) which dated this transition by 8760 cal yr BP. The surrounding forests had the same vegetation composition as in the previous zone (Betula-Pinus-Picea), but the general wetness of the territory increased. There was just a short dry period during 8400–8300 cal yr BP whichcoincides with proposed episode of higher fire activity in Mukhrino mire (Blyakharchuk et al., 2021). Pine appears closer to the sampling site, as indicated by the presence of stomata. At the beginning of the zone (360–340 cm, 8600–8400 cal yr BP), the peak concentration values of most of the taxa might indicate slower peat accumulation rate. At the same time, testate amoebae also indicated a short-term dry period (8600–8300 cal yr BP, 340–310 cm). Another short-term dry period was observed in the testate amoebae record during 8000–7800 cal yr BP (285–260 cm).
The end of this period was characterised by wet environmental conditions indicated by testate amoebae and high Sphagnum spore content which generally corresponds to 8.2 ka event (Walker et al., 2019). The high wetness was a regional-scale process because the traces of past high water-levels were also observed in the nearby lake sediments. The sediment record from Lake Svetlenkoye (<10 km northwest from Mukhrino mire) consists of a section with specific diatom assemblage and high sedimentation rate ~8000–6700 cal yr BP. It was interpreted as a record of the past flooding period (Amon et al., 2020) and connected with a higher palaeo-humidity reconstruction in Western Siberia (Blyakharchuk, 2009). The two coring sites from Mukhrino mire now offer the terrestrial comparison (Figure 9b). In the landscape, Mukhrino mire (~32 m) is elevated compared to Lake Svetlenkoye (~28 m). Two humidity maxima in Mukhrino mire, ~6800 to 6700 cal yr BP and ~8000 to 7600 cal yr BP are visible from past wetness reconstruction (Tsyganov et al., 2021) that corresponds well with the past flooding period from lacustrine record of Lake Svetlenkoye. The most distinctive past wetness maximum, ~6700 to 6800 cal yr BP coincides with the highest lacustrine sedimentation rate (~7100–6700 cal yr BP) detected from the Lake Svetlenkoye record. The pollen record suggests ~7900–6700 cal yr BP the territory was an oligotrophic bog with conditions favourable for Sphagnum mosses. Forests were generally formed by Pinus and Betula with a significant admixture of Picea and Ulmus. Environmental conditions gradually became drier as the water levels in the Ob’ and Irtysh rivers (Figure 1) decreased. As a result, the floodplain was colonised by Betula sp. forests with fern in the herb layer with later addition of Pinus.
Dry period and bog partial afforestation (6500–5700/4700 cal yr BP, 180–140 cm)
Most of the proxies (testate amoebae, pollen data, peat humification, plant macrofossil) indicate dry conditions during this period. Our pollen data show that during 6700–4400 cal yr BP the oligotrophic bog was gradually drying with a peak during ~5700–4700 cal yr BP (at 160–140 cm depth in Core2017). The high concentrations of mesophytic taxa and microcharcoal indicates the driest conditions that also might reduce peat accumulation rates. The area of the bog was partly overgrown by trees (Betula, Pinus and Abies). By the end of this period, Picea decreased considerably. Seeds and plant macrofossils of trees (Pinus, Betula and Salix) were found. The observed delay in the response of pollen to the dryness as compared to the local indicators (testate amoebae and peat humification) might be related to the greater sensitivity of the latter ones. The n-alkane-based Paq index increased and reached a high value (0.5) at ~6400 cal yr BP. It coincides with a notable rise in the concentration of nC23 as compared to other n-alkanes. This n-alkane homologue is often linked with mosses, Sphagnum in our case. This interpretation is also supported by the maximum value of nC23/nC31 ratio. Other sources of nC23 can be aquatic plants. At the same time, there are no changes in the concentration of nC17 which is also indicative of algal and aquatic inputs thus supporting the moss-based origin of nC23. The layer (highly decomposed peat, with shrub and wood remains) can be observed across the entire peat deposits (Zarov et al., 2023a) that indicate the climate-related changes in environmental conditions. Dry conditions for this period have previously been noted in studies of low geomorphic levels of the Ob River valley, where paleosols and peat layers are expressed (Leshchinskiy et al., 2006, 2011). Pollen-based regional reconstructions suggest the prevalence of taiga and cool conifer forest biomes (Tarasov et al., 1998).
Regionally warm and moist with bog recovery (5700/4700 to ~2500 cal yr BP)
Oligotrophic bog recovered and expanded over the previously forested area. At the beginning of the zone, the forests were dominated by Betula and Pinus with dark coniferous and broadleaf taxa (e.g. Tilia). Around ~3100 cal yr BP, tree pollen proportion sharply declined and regional humidity increased by ~2900 to 2700 cal yr (105–95 cm). Overall, this period was characterised by domination of Sphagnum fuscum whereas testate amoeba-based reconstruction of WTD indicated average local wetness conditions. Both Paq and nC23/nC31 (0.27) indexes had a low value until ~2800 cal yr BP but started increasing gradually. All together this might indicate high precipitation but low local wetness due to higher evapotranspiration or higher surface level of the mire above the surrounding landscape. That makes it more difficult for the mire to retain water, which mainly came with the atmospheric precipitation (Couwenberg et al., 2022). If this moist period can be attributed to 4.2 ka event (Walker et al., 2019), remains open to further studies. Starting from this period the peat accumulation rate decreased, which might be related to a greater peat decomposition rate because the location became drier.
Dry oligotrophic bog reaching its recent state (~2500 cal yr BP–present day)
Radiocarbon date from 70 to 75 cm depth (Core 2017 Poz-130099) suggests that the uppermost 70 cm of the peat deposited during last 2000 years, which is almost 1500 years older than the results of the Lamentowicz et al. (2015) where the ages of 500 and 1220 cal yr BP were reported at the depths of 70 and 100 cm respectively. Similarly, Tsyganov et al. (2021) reported the age 1500 cal yr BP at the depth 90 cm. However, Zarov et al. (2023a) have shown that for the upper part of the peat, there is large variability in ages, being at depths 50 cm from modern to 1500 cal yr BP and at depths 100 cm from 600 to 2600 cal BP. The possible explanation is the disturbance (flooding, fire) that resulted in a hiatus in peat accumulation at the depth ~70 cm (Lamentowicz et al., 2015). For an additional challenge for age-time modelling, we had outliers in our radiocarbon dates from both cores (Table 1). The set of various factors may also be an explanation if and why the pollen results may be shifted in time.
Pollen record reflects that the previous high precipitation period was followed by a short dry period (2200–1900 cal yr BP, 75–62 cm). Macro-remains of Pinus were recorded assuring the local growth of the species. The testate amoeba record also supports this observation indicating dry local conditions. The n-alkane record and ACL displayed maximum concentrations at ~1400 cal yr BP. The nC31 n-alkane homologue reaches the highest concentration measured for the entire core (Figure 7). Other abundant homologues are nC29 but also nC23. In plant macrofossil data, at the same layer the majority of peat consists of Sphagnum fuscum but also Eriophorum vaginatum, different dwarf shrubs and ~15% Pinus remains. The nC23/nC31 ratio in the described layer is average (0.48). Since ~1200 cal yr BP pollen data indicate vegetation typical for the recent state of the mire, that is, Sphagnum-dominated oligotrophic bog with presence of Pinus. The surrounding landscapes are dominated by Betula-Pinus forests, whereas Picea and Abies are present in the regional vegetation. Paq index reaches the maximum value (0.56) of the measured record in the uppermost sample. The nC23/nC31 ratio gradually increases up to the topmost sample (0.78). The topmost sample also has a different n-alkane concentration pattern as it is the only measured sample where nC27 is the dominant homologue. The plant macrofossil record shows the analysed layer consisted of 70% of Eriophorum suggesting this species as a possible local source for nC27. Testate amoeba and Ramenskiy wetness index indicate dry conditions in the topmost layer of the peat. There is somewhat contradictory evidence about the hydrological regime of the mire during this period have been reported in the literature. Lamentowicz et al. (2015) reported a dry period during 1170–70 cal yr BP, whereas Tsyganov et al. (2021) reported a wet period. This was explained by the spatial heterogeneity of the mire related to complex microtopography.
Conclusions
The initiation of peat development started in the early Holocene (10,400/9600 cal yr BP) that corresponds well to the regional data and was probably driven by climatic factors. The prerequisite for peat accumulation was the absence of flooding that would have disturbed the peat accumulation. The initial local conditions were moderately moist but the abundant sedimentary charcoal suggests frequent and intensive fires in the watersheds. However, our multi-core study indicates a well-pronounced spatial variability related to the topography of the underlying bedrock materials and/or sedimentary conditions.
The climate palaeoreconstruction multiproxy/multi-core approach provides comprehensive information about vegetation and environmental conditions in local and regional scales, which may be different or even opposite. The important effects of surface topography in regulating local wetness were observed at the mesotrophic stage when pollen data indicate wet climate, whereas most of the other proxies showed a local drying trend that might be related to the intensive peat accumulation at the previous stage.
Mukhrino mire has turned into oligotrophic/ombrotrophic mire since ~8800 cal yr BP and its local vegetation is dominated by Sphagnum fuscum. During the transition phases, testate amoebae and plant macrofossil indicate different patterns of surface wetness that is generally related to body-size of the proxies (i.e. testate amoebae are strongly controlled by water content in the top layer, whereas plant can still use roots to get water from underlying layers). Another reason the weaker or delayed response of plant macrofossils is that the vegetation shows long-term climate changes when the testate amoebae cover the short-term variation.
The regional vegetation for the study period was controlled by both climatic and edaphic factors. Forests have been present and dominant in drained areas since the Early Holocene. The local presence of Betula and Pinus is supported by macrofossils. During the Mid and Late Holocene, Tilia and Ulmus episodically grew in the nearby region indicating warmer periods.
A dry period was detected around 6500–5700/4700 cal yr BP that resulted in afforestation of the mire. The regional climate became wetter and warmer during 5700/4700 to ~2500 cal yr BP that resulted in a recovery of the mire, which turned to its present conditions since then. Another dry episode was detected during 2200–1800 cal yr BP.
The dynamics of the reconstructed local wetness based on the records of testate amoebae, plant macrofossil (Ramenskiy scale) and biomarkers (n-alkane ACL) is generally comparable with the results of the previous studies (Tsyganov et al., 2021) and discussed regarding our pollen results and regional Holocene palaeoecological overviews. Based on Core2019 in present study, we identified two wet and four dry zones. The studied site was on average drier than the core described by Tsyganov et al. (2021). The wet/dry trends from both cores are largely comparable, indicating the principally synchronised wetness changes within Mukhrino mire. The differences may be due to variation in local rates of peat accumulation.
A wet period ~8000 to 6700 cal yr BP was detected from lacustrine sediments (high sedimentation rate, specific diatom record) from nearby Lake Svetlenkoye (Amon et al., 2020). It was interpreted as palaeo-floods from river Ob indicating the regional wet conditions. The wet conditions and gradual drying during the mentioned period was also supported by our pollen record. The Mukhrino local palaeohydrological signal from the previous (Tsyganov et al., 2021) and present study partially coincides with the described palaeo-flood period. It proves the regional-scale increased wetness during this period.
Supplemental Material
sj-docx-1-hol-10.1177_09596836251387252 – Supplemental material for Regional and local drivers of vegetation and humidity dynamics in Western Siberia during the Holocene: A case study of Mukhrino mire
Supplemental material, sj-docx-1-hol-10.1177_09596836251387252 for Regional and local drivers of vegetation and humidity dynamics in Western Siberia during the Holocene: A case study of Mukhrino mire by Leeli Amon, Andrey N Tsyganov, Evgeny A Zarov, Elena Burkanova, Jüri Vassiljev, Mikhail G Kulkov, Ivan Krivokorin, Viktor A Chernyshov, Natalia G Mazei, Gulmira T Salakhidinova, Anastasiia Gulina, Yaroslav Kuzmin, Yuri A Mazei and Elena D Lapshina in The Holocene
Footnotes
Author’s note
The analytical data gathered in this article will be available upon request to the author responsible of the specific proxy.
Author contributions
Funding
The authors disclosed receipt of the following financial support for the research, authorship, and/or publication of this article: The work was supported by the Estonian Science Foundation grant PRG1993. Testate amoebae analysis (YAM, NGM and ANT) was financially supported by the Russian Science Foundation (24-14-00065). The work by Y.V. Kuzmin was supported by the State Assignment # 122041400252-1.
ORCID iDs
Supplemental material
Supplemental material for this article is available online.
References
Supplementary Material
Please find the following supplemental material available below.
For Open Access articles published under a Creative Commons License, all supplemental material carries the same license as the article it is associated with.
For non-Open Access articles published, all supplemental material carries a non-exclusive license, and permission requests for re-use of supplemental material or any part of supplemental material shall be sent directly to the copyright owner as specified in the copyright notice associated with the article.