
Abstract
This study investigates the use of planform sinuosity as a metric to produce an automatic classification of waterways in the pre-modern and present-day irrigation networks in the Konya Plain in south-central Türkiye. Results show that such automatic classification may replace a time-consuming manual classification or provide a preliminary classification for subsequent manual refinement, depending on the number of classification categories used, the distribution of sinuosity across the network, and the degree of human modification. They also show that sinuosity thresholds for classification are area- and time-specific. Sinuosity is then used to quantify and interpret network changes in planform alignment and expansion and to identify long-term trends and areas of landscape modification. Results reveal a general pattern of decreasing sinuosity over time in the Konya Plain, indicating a continual human intervention, with areas where the present-day network was built upon the old Ottoman system. The methods presented in this investigation may be applicable to other studies of irrigation-network evolution and impact on landscape and can be used in conjunction with archeological and historical analysis.
Introduction
Throughout the course of history, the modification of watercourses, along with the development of technologies for flow control and collection, have allowed humans to increase available land for arable farming and agricultural output. Palaeohydrological research to track human intervention on the landscape, chiefly through (but not limited to) remote sensing, has been recently growing. In Southwest Asia specifically, Wilkinson and others (Hritz and Wilkinson, 2006; Jotheri, 2018; Jotheri et al., 2016; Wilkinson et al., 2015) have used satellite imagery analysis to study ancient water channels and canals and how they have been shaped and modified by human activity. Studies by Geyer and Monchambert (2015), An Heyvaert and Baeteman (2008), Heyvaert et al. (2012), and Orengo and Petrie (2017, 2018) have also reconstructed ancient water networks to investigate how methods of human intervention exploited the surrounding landscape morphology across Asia. Much of this work was based on field work and remote sensing to interpret the morphological features of the channel form over a distance.
Using remote sensing, geometric features of a waterway network can be analyzed, such as the sinuosity of the individual channels or canals. Sinuosity is the ratio of stream length to valley length and is used to quantify the degree of meandering in a channel (Leopold and Wolman, 1957: 60). Sinuosity can then be used to assess whether a waterway is natural or artificial, as demonstrated by Rutishauser et al. (2017: 109), who aimed to understand the development of the Seyhan and Ceyhan rivers in the Cilicia Plain, Türkiye. Rutishauser et al. (2017) found that relict canals have a lower sinuosity when compared to palaeochannels and were able to use this to identify areas where there had been alterations to the river courses.
Other studies used sinuosity to classify diachronic development of individual waterways. Santos et al. (2019) used historical maps to evaluate the change in sinuosity values of three canals, the Piabanha, Quitandinha, and Palatino, between 1846 and 1999, in Petrópolis, Brazil. The sinuosity classification put forth by Leopold and Wolman (1957), who defined streams with sinuosity lower than 1.5 as “straight” and larger than 1.5 as “meandering” (Leopold and Wolman, 1957: 60), was used by Santos et al. (2019) to relate historically recorded floods to changes in sinuosity and degradation of vegetation in the areas surrounding the canals.
Rashidian (2021) identified a type of manipulated canal found in the Greater Susiana region (southwestern Iran), which they defined using the term “nahr.” A sinuosity of one was used to define straight canals and a sinuosity larger than 1 was used to define old meandering rivers (Rashidian, 2021: 252). Using this classification, they attempted to define nahr as a third type of waterway, somewhere in between a canal and a river, to be considered for irrigation in ancient Southwest Asia.
The abovementioned studies used sinuosity to characterize and understand the development of individual water features instead of a whole hydrographic network, which would be beneficial toward understanding how a region has evolved over time as a result of human- and environment-related changes. Furthermore, the sinuosity thresholds adopted in those studies were not based on similar waterways in the same network, but rather on the general threshold proposed by Leopold and Wolman (1957), which is designed as a morphometric indicator rather than distinguishing channels that are human made or modified.
The aim of this study, which focuses on the Konya Plain in south-central Türkiye, is to propose a new method to classify waterways automatically based on planform sinuosity and therefore degree of human modification, by considering all hydrographic linear features within a basin and providing tailored sinuosity thresholds dependent on local geomorphological conditions. Sinuosity values are then used to quantify the changes and identify long-term patterns of landscape modification and intervention.
Study area
The Konya Plain is a large agricultural basin in south-central Türkiye as well as one of the driest regions in the country, with a mean annual precipitation of 324 and 320 mm in Konya and Çumra respectively, where the study area is located (Altın, 2022: 38; Türkeş, 1996: 1064). Low rainfall and high interannual variability have led to added pressure on the water resources available (Türkeş, 1996: 1074). Additionally, this is an endorheic basin, with all waterways creating bajadas and the water disappearing underground or through evapotranspiration (Kuzucuoğlu, 2019; Roberts, 1980; Wainwright and Ayala, 2022).
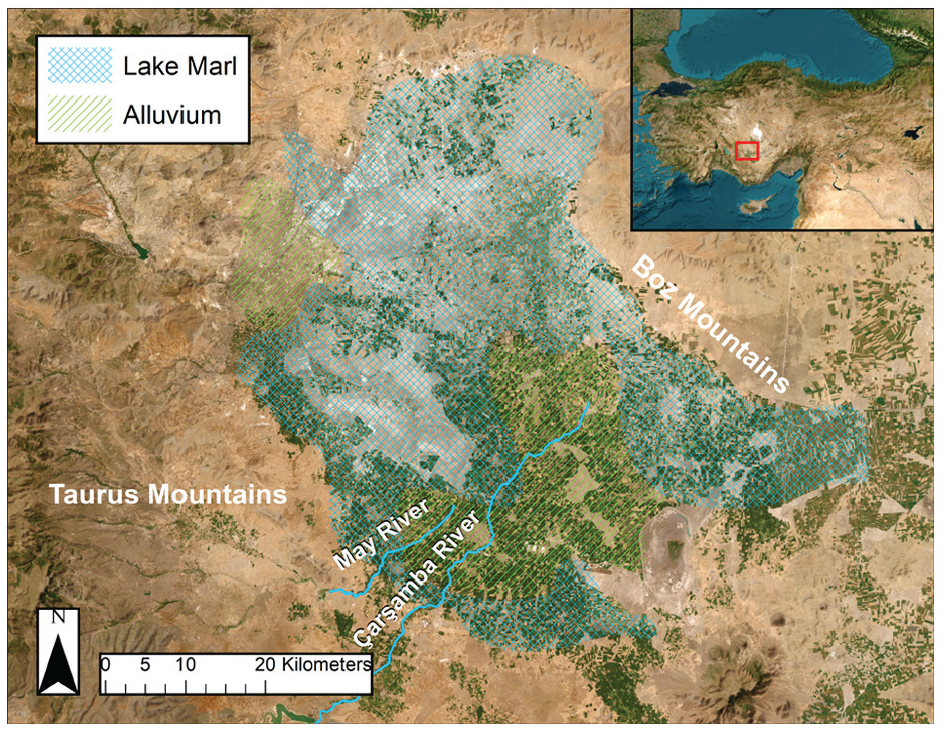
Four main geomorphological units are found within the study area (Figure 1). First, the highlands, which are constituted by the western and central Taurus Mountains and the Boz Mountains. Second, the bed of Palaeolake Konya, composed of mainly lacustrine marls from the Pleistocene (Boyer et al., 2006: 676). Third, the Çarşamba River complex that formed during the Holocene, after the retreat of the Konya Paleolake (Ayala et al., 2017; Boyer et al., 2006). The fourth main geomorphological feature is the alluvial fans of minor water streams on the Taurus piedmont (Boyer et al., 2006: 676; Naruse et al., 1997: 179).
The geomorphology of the Plain has made it an ideal location for human settlement. It historically featured some of the earliest examples of sedentary, agropastoral communities in Southwest Asia (Baird et al., 2018: E3077; Roberts, 1991). Among these sites is Çatalhöyük, where evidence for large-scale mixed farming dates to at least 7100 cal BCE (Bayliss et al., 2015: 17). Persistent occupation and agricultural production within the basin indicate the ability of early communities to overcome environmental issues such as flooding and drought, which have continued to plague the region (Wainwright and Ayala, 2022: 1301).
While the need for some form of small-scale irrigation might have occurred toward the end of the third millenium BCE in more distal areas, inferred from the suggestion by Boyer et al. (2006: 695) that Çarşamba flooding after this period was less extensive, the first evidence for widespread canal-building activities seems to have occurred in the late first millenium BCE, when large numbers of small farming settlements start appearing in areas previously devoid of sedentary occupation (Massa et al., 2020: 50). The presence of water management-related infrastructure in the plain grew during the Ottoman period. In the 16th century, a canal was constructed between the Lakes Beyşehir–Suğla and the Çarşamba as one of the first in a series of failed attempts to supply villages in the Konya Plain with water and mitigate the effects of droughts. In the early 20th century, a contract awarded to the Osmanlı-Anadolu Demiryolu Şirketi (Ottoman-Anatolia Railway Company) marked the start of a new plan to construct a canal connecting the Çarşamba directly to Lake Beyşehir (Wainwright and Ayala, 2022: 1278). The 217 km long canal was completed in 1912 and resulted in significant modification of the lower part of the Çarşamba, greatly increasing the level of agricultural production due to the ability to farm larger areas of land that were also further away from the main watercourses. It also resulted in a shift from traditional field systems made up of narrow irregular fields to larger rectilinear fields not long after the program was initiated, because the latter were easier to irrigate (De Meester, 1970: 198; Jackson and Moore, 2018: 198).
Materials and methods
Pre-modern and present-day waterway networks
Two waterway networks, pre-modern and present-day, were considered in this study. The present-day digitized hydrological network was obtained from the Harita Genel Müdürlüğü (HGM, General Directorate of Mapping in Türkiye), and consists of 14,345 polylines corresponding to 7813 km of both human-made and natural active waterways as of 2019 over an area of about 5000 km2. We checked the quality of the data for the present-day network by identifying where polylines were split. Several major waterways were found digitized as a single continuous feature despite their appearance on satellite imagery, which showed differences in planform configuration, such as a sudden change in direction or a sinuous section becoming straight: these waterways were therefore split to compute their sinuosity appropriately.
The digitized pre-modern waterway network was identified and reconstructed through analysis of historical (1971) Hexagon imagery and modern satellite imagery from Landsat, Sentinel-2, and Google Earth. The network was further validated by a 30 m resolution Digital Surface Model (DSM), Alos World 3D Digital map, provided by the Japan Aerospace Exploration Agency. The high-resolution Hexagon imagery depicts a landscape still not heavily modified by mechanized agricultural practices introduced in the 1950s, which has allowed for the palimpsest of all the Holocene waterways to be traced in detail (Massa et al., in preparation). The digitized pre-modern network consists of 762 polylines. The use of high-resolution imagery allowed for obtaining robust estimates of stream and valley lengths for each digitized polyline, which is important for accurate estimation of sinuosity (Andrle, 1996: 270; see also Dodov and Foufoula-Georgiou, 2004; Stølum, 1998). Massa et al. (in preparation) adopted the following process for producing the polylines and deciding where each individual polyline started and stopped, given that the system is effectively a set of continuous lines. At first, only waterways that were absent in the present-day waterway network were digitized, which consisted of both active and inactive/buried features. Once the pre-modern waterways were clearly distinguished from the modern set, modern waterways with a planform shape reminiscent of the pre-modern were also digitized. This was also based upon both morphology and context, particularly the probable stream direction and branch structure of the waterways (Figure 13b). Even if a feature seemed continuous, Massa et al. (in preparation) digitized it separately if it was oriented in clearly different directions. Also, if a clear visible difference in planform configuration (degree of meandering) was observed between two segments of the same waterway, then it was split into two separate features. The total area covered by the pre-modern waterway network is about 5000 km2 with about 1994 km of waterways.
Waterway subsets
To establish region-specific ranges of sinuosity that characterize “canals” (entirely artificial waterways) or “natural channels” (waterways not modified by human intervention), we identified two subset groups of waterways (Figure 2) that could be distinguished with high confidence as canals or natural channels, respectively.
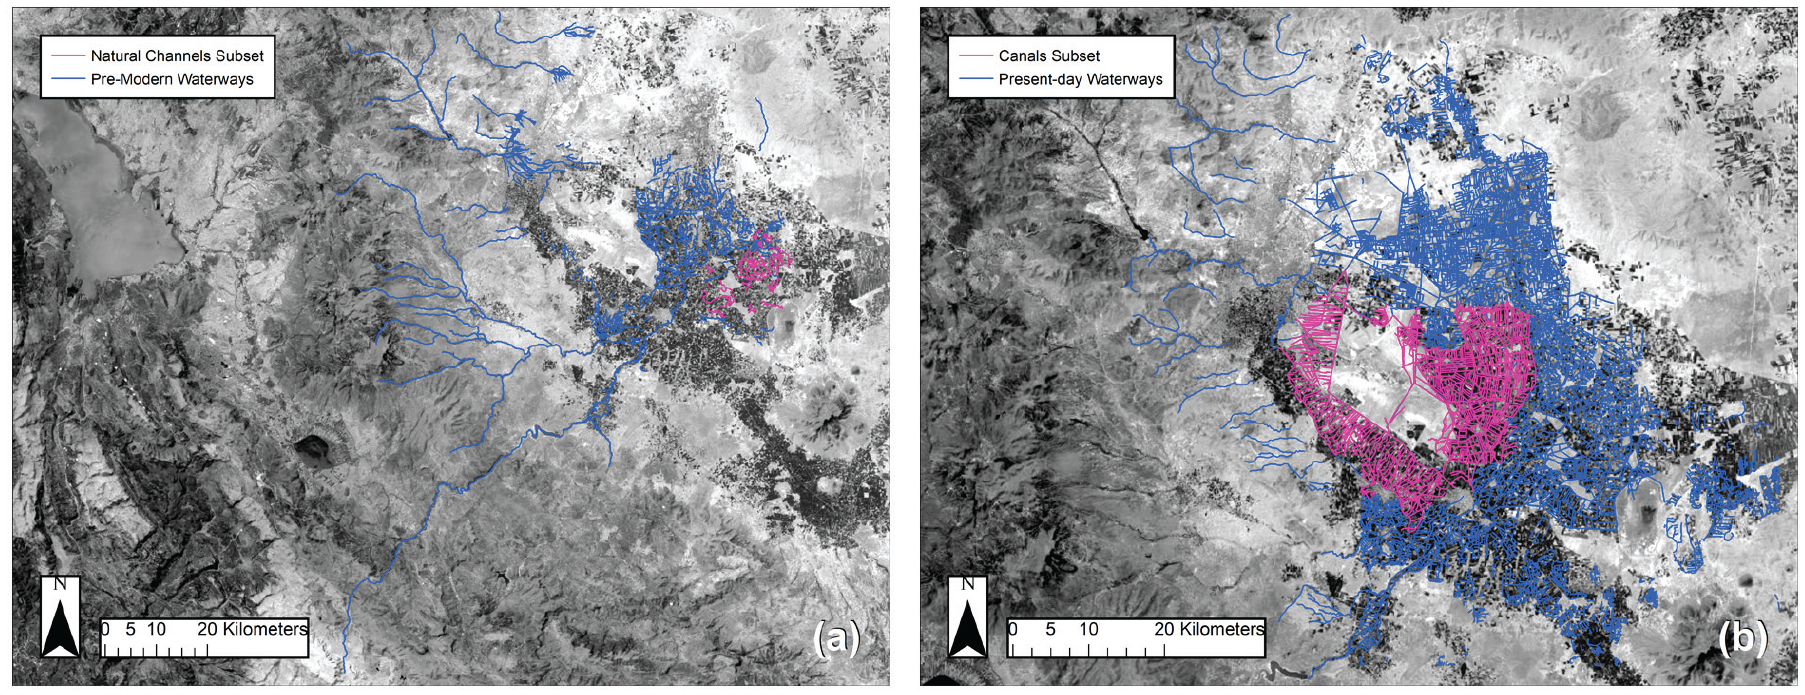
(a) Subset of natural channels in the pre-modern network and (b) subset of canals in the present-day network.
For the “canals” subset, we selected, within the present-day network, the central area of the plain where modern canals do not appear on the Hexagon imagery, meaning they were certainly built after 1971. An area in the western part of the plain was also selected, where all the modern canals appear only in post-1912 topographic maps, which means that they were made within the framework of the abovementioned 1912 irrigation system (Massa et al., in preparation).
The “natural channels” subset consists of pre-modern waterways that were only visible as crop marks (as patches of darker color under the soil), which suggests that they had already been abandoned for quite some time before 1971 (Massa et al., in preparation). The selected palaeochannels are in proximity of archeological sites starting in the Early Chalcolithic (ca. 6000–5500 BCE), at a time when, to the authors’ knowledge of the literature, there is no archeological evidence in Anatolia for technology able to create canals up to 5–10 km long.
Computation of sinuosity
Given the planform alignment of a reach of a waterway, sinuosity is calculated by dividing the total stream length (measured along the waterway centerline) by the length measured along the valley direction (in this study, the straight distance between the upstream and downstream ends of the waterway reach considered) (Leopold and Wolman, 1957: 60). The minimum possible value of sinuosity is 1.0 for a perfectly straight waterway, and progressively larger values characterize increasingly meandering waterways.
To calculate sinuosity, we used a Python script that calculates the sinuosity of each waterway centerline traced in GIS as a shapefile polyline (ArcGIS, 2024). In its original form, the script calculates the inverse of the sinuosity, and we modified it to directly output sinuosity. The script works by calculating a sinuosity value for each individual polyline within a shapefile. To validate the output of the tool, a number of polylines were randomly tested, first using the Python script and then checking its result by comparing it with the value computed as a ratio of the waterway and valley lengths measured with an in-built GIS geometry tool. All analysis was carried out in ArcGIS-ArcMap 10.8.1.
Qualitative waterway classification based on human judgment
A qualitative classification of the pre-modern waterways was conducted by Massa et al. (in preparation) by visually comparing features in this research with previously identified features from the study area (with modern canals and buried waterways being at the two ends of the spectrum) and with identified and characterized waterways from similar studies across Southwest Asia (Rutishauser et al., 2017; Wilkinson, 2003; cf. also Charlton, 2008 for definition of such features). Three main types were identified: “canal” (defined, as mentioned in Section 3.2, as an entirely artificial waterway), “maintained channel” (a natural waterway somewhat modified by human activity, such as straightening or diverging of its course) and “natural channel” (defined, as mentioned in Section 3.2, as not modified by human intervention).
A qualitative classification of present-day waterways was documented by the HGM, using three types: “small canal,” “canal,” and “channel.” Based on our analysis of the HGM digitized network, these were interpreted and renamed as “canal,” “channelized river,” and “natural channel.”
To make the qualitative waterway classifications of the pre-modern and present-day networks uniform and use them for validation of the quantitative sinuosity-based characterization of the two networks, proposed in this study, the original qualitative classifications were re-classified in either two or three categories, as shown in Table 1. The two-category classification is the simplest possible; in the three-category re-classification, the term “maintained channel” indicates a modified natural waterway, through maintenance or channelization.
Original and re-classified categories.

Figure 3 shows example close-up views of canals, maintained channels and natural channels, with the digitized waterways overlain over 1971 Hexagon imagery (pre-modern network) or modern satellite imagery (present-day network).
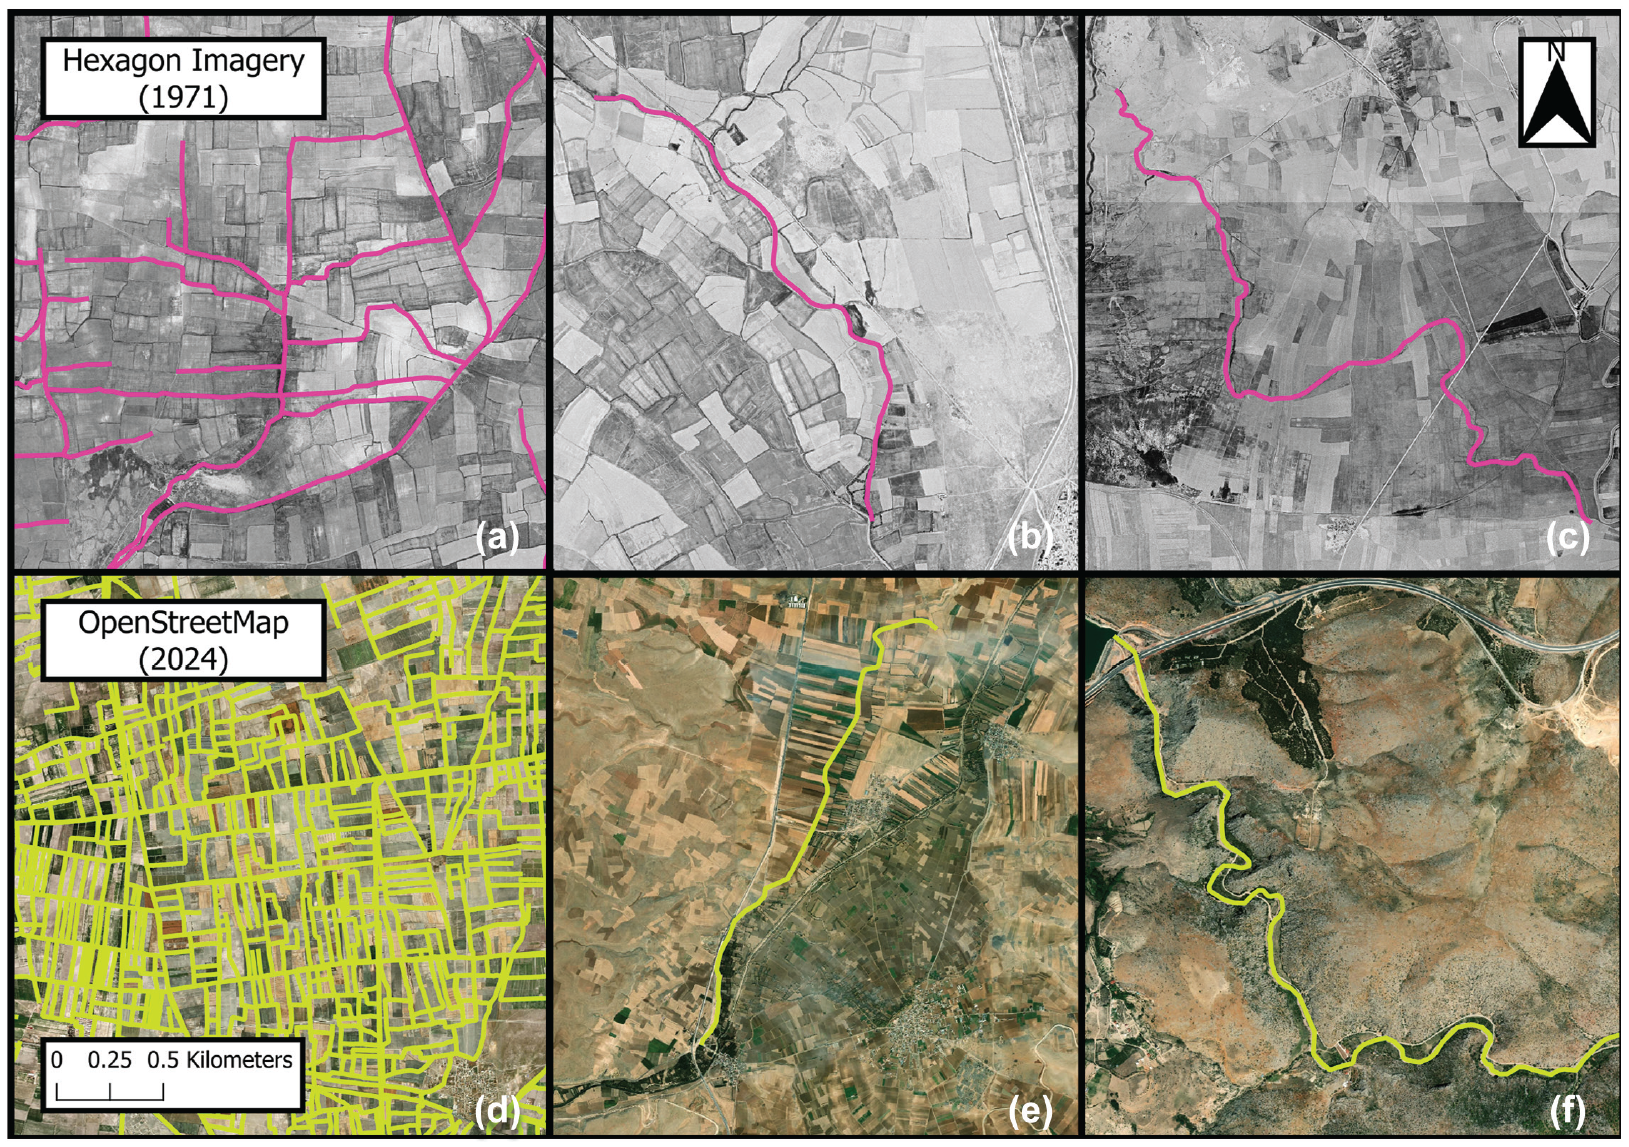
Example (a) canals, (b) maintained channel, and (c) natural channel for the pre-modern network on 1971 Hexagon imagery. Example (d) canals, (e) maintained channel, and (f) natural channel for the present-day network on modern satellite imagery.
Research workflow
In Sections 4.1.1 and 4.1.2, sinuosity was calculated for all polylines in both pre-modern and present-day waterway networks using the tool described in Section 3.3. Focusing on the two waterway subsets (Section 3.2), a range of sinuosity was obtained for the “canals” subset and the “natural channels” subset.
Then, an automatic two-category classification (“canal” vs “natural channel”) of the full waterway network, either pre-modern or present-day, was carried out in Section 4.1.3, based on the computation of the sinuosity of each of the polylines in the network using the Python script and the use of a single threshold value, below which the waterway is defined as “canal” and above which as “natural channel,” informed by the ranges of sinuosity computed from the subsets. The accuracy of the automatic sinuosity-based two-category classification was then assessed against the two-category re-classified qualitative classification (Section 3.4).
An automatic, sinuosity-based three-category classification (canal vs maintained channel vs natural channel) was then carried out in Section 4.1.4 for both pre-modern and present-day waterway networks, using two threshold values (“canals” are those below a certain lower sinuosity threshold value; “natural channels” are those above a certain higher sinuosity threshold; and “maintained channels” are those with a sinuosity between lower and higher sinuosity thresholds), again informed by the ranges of sinuosity computed from the subsets.
Finally, an automatic sinuosity-based fuzzy five-category classification, where the term “fuzzy” (Zadeh, 1965, 1975) here describes a classification with no “hard” sinuosity thresholds and instead associates certain sinuosity ranges with more than one waterway type, was implemented (see Section 4.1.5).
As in the case of the automatic two-category classification, the accuracy of the automatic three-category classification and the automatic five-category fuzzy classification was assessed in Section 4.1.6 against the three-category re-classified qualitative classification (Section 3.4).
Sinuosity was then used to identify and interpret spatial patterns of sinuosity in the study area (see Section 4.2.1) and to identify the changes in sinuosity between pre-modern and present-day irrigation networks and the location of those changes (Section 4.2.2).
Results and discussion
Automatic waterway classification based on sinuosity
Sinuosity distribution for pre-modern and present-day networks
Figure 4 displays the distribution of sinuosity across the pre-modern network (Figure 4a and c) and the present-day network (Figure 4b and d). From the plots, the pre-modern network is characterized by a wider distribution of sinuosity, whereas most of the heavily modified present-day waterways are significantly skewed toward very low sinuosity (1.0–1.1 range).
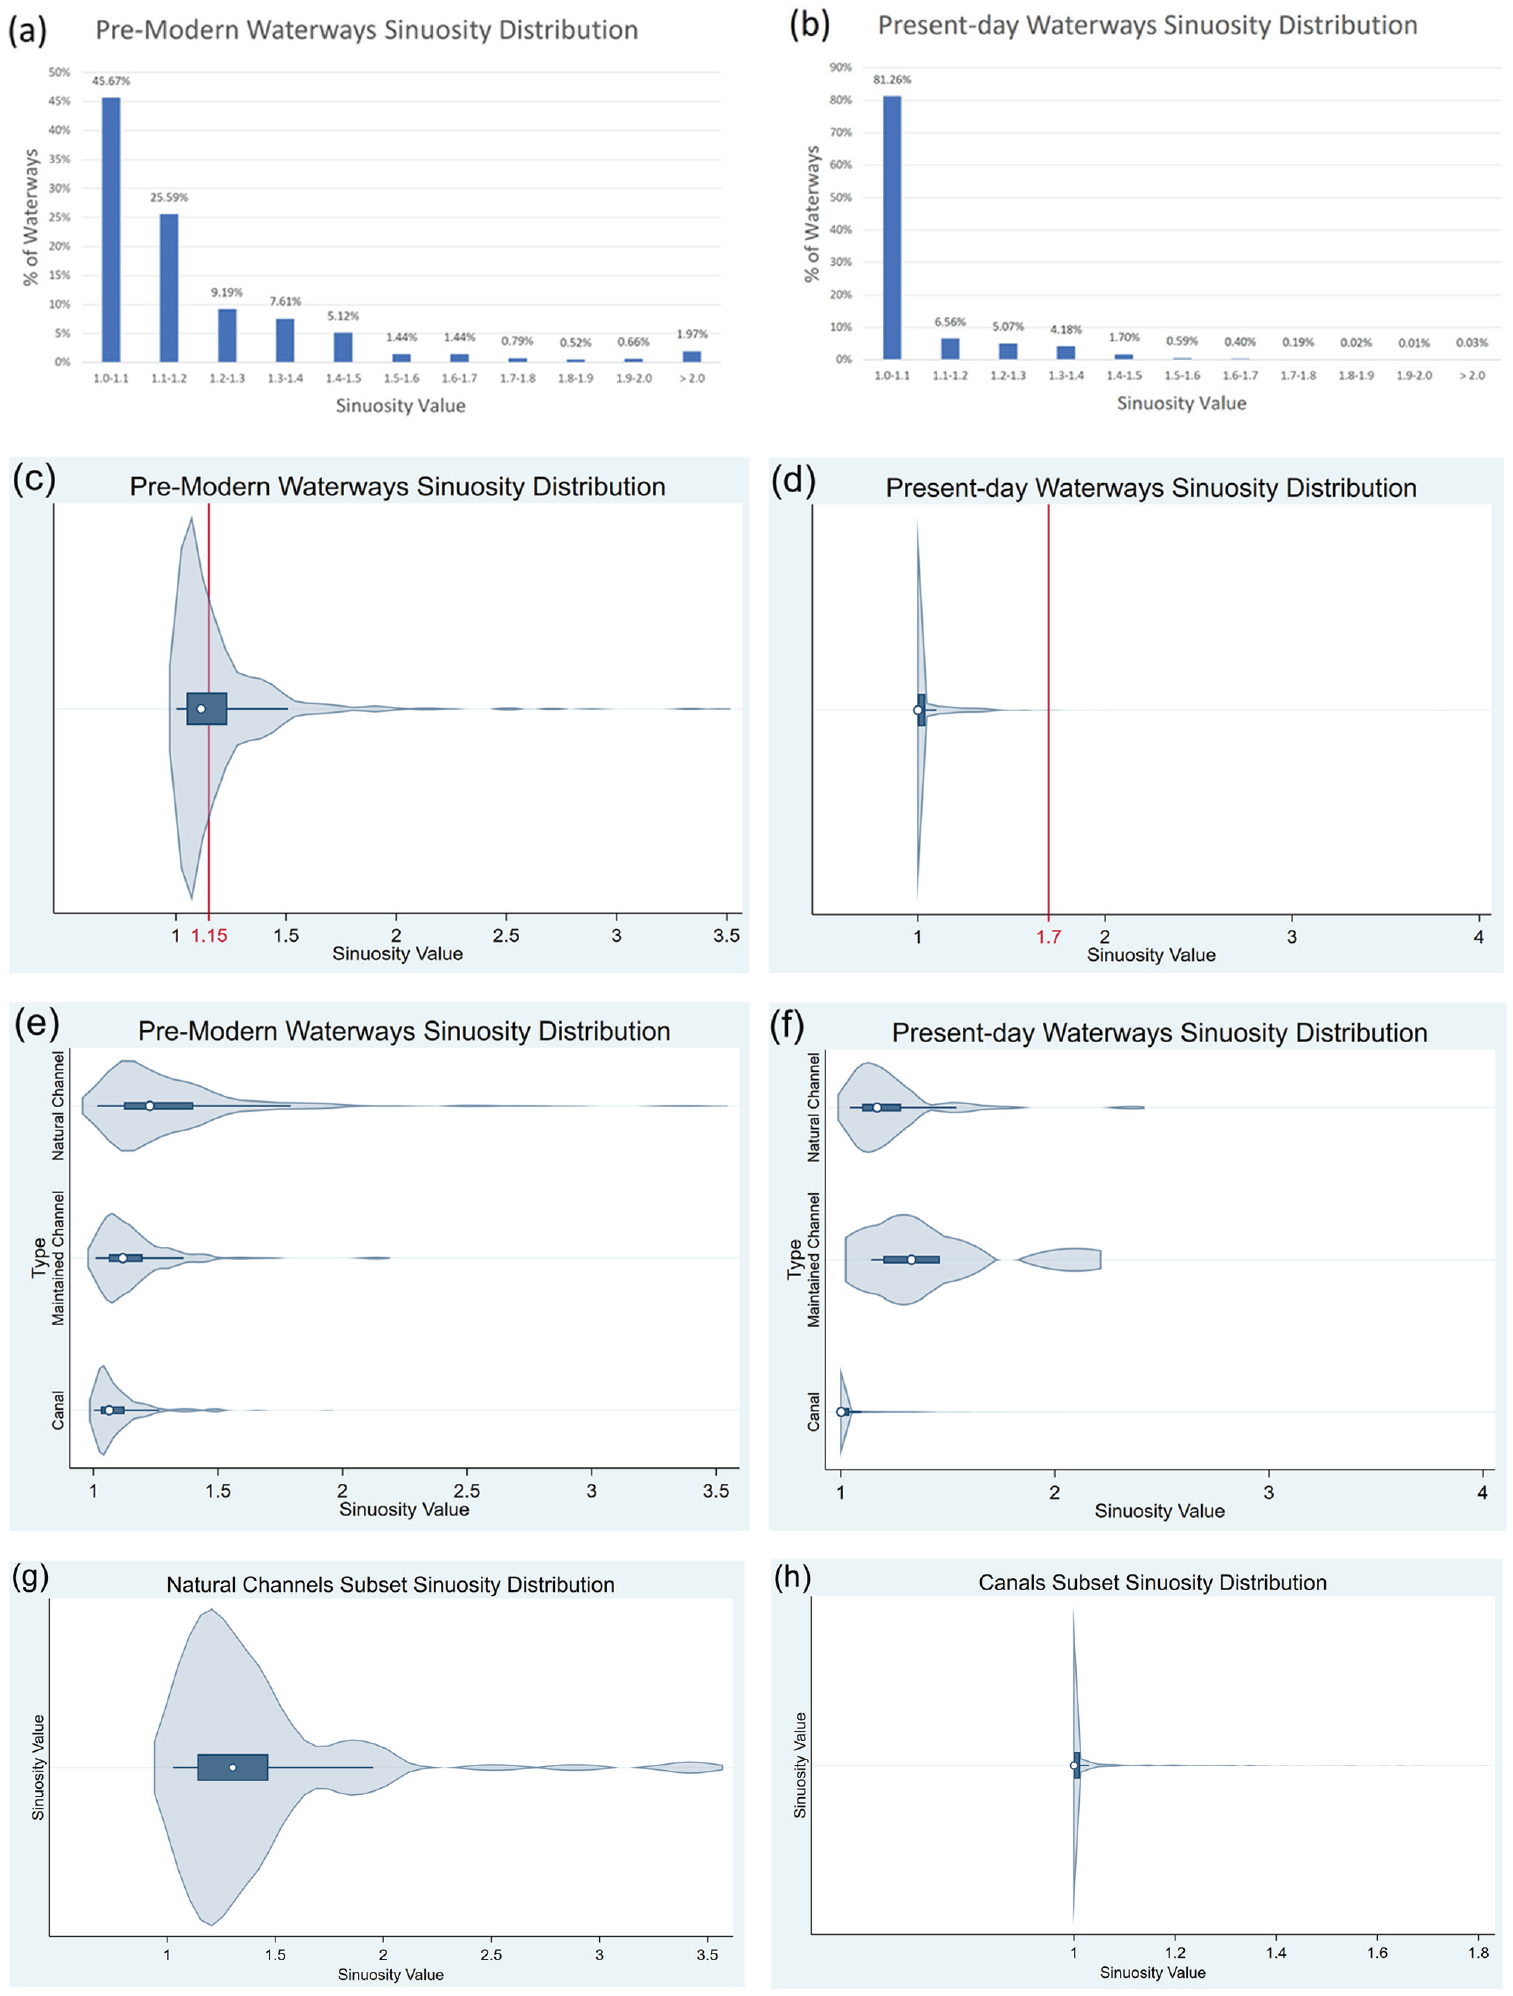
Sinuosity distribution for (a, c, and e) pre-modern and (b, d, and f) present-day waterway network and (g) natural channels’ subset and (h) canals’ subset, as identified in Section 3.2. Outliers were not included in panels c, e, and g.
Figure 4e and f break down the sinuosity distribution for “canals,” “maintained channels” and “natural channels” (as defined in Section 3.4). For the pre-modern network, sinuosity generally increases between “canals,” “maintained channels” and “natural channels.” For the present-day network, “canals” are characterized by a very narrow sinuosity range, while “maintained channels” and “natural channels” span across a significantly larger range.
Sinuosity ranges from subsets
As described in Section 3.2, two subsets were identified within the network, one consisting of waterways on the heavily modified spectrum (“canals”) and the other on the definitely natural spectrum (“natural channels”). Computing the sinuosity for all polylines in both subsets returned a range of 1–1.82 for the canals (Figure 4g) and a range of 1.02–3.49 for the natural channels (Figure 4h). The overlap of these two ranges, 1.02–1.82, was used to inform the selection of the threshold value(s) for automatic sinuosity-based waterway classification.
Automatic sinuosity-based two-category classification
To automatically classify the waterways in the pre-modern network, either as “canal” or “natural channel,” multiple sinuosity threshold values within the range 1.02–1.82, defined from the subsets (Section 4.1.2), were considered.
Three initial alternative threshold values, 1.2, 1.4, and 1.8, were tested to identify where the best threshold value was located within the subset-defined range. These returned an agreement with the qualitative two-category waterway classification (Section 3.4) for 64%, 56%, and 51% of the waterways, respectively. To compute the percentage agreement, for each waterway the outcome of the sinuosity-based classification was compared with the qualitative classification: if they matched (a canal was correctly classified as canal or a natural channel was correctly classified as natural channel), a value of “true” was assigned to the waterway; otherwise, either because a canal was misclassified as natural channel or vice versa, a value of “false” was assigned to the waterway. The percent agreement is the percentage of waterways with an assigned “true” value over the total number of waterways.
An optimal sinuosity threshold value was then sought by trial and error, to maximize the agreement between the automatic sinuosity-based waterway classification and the qualitative waterway classification. Given that the threshold value of 1.2 returned the highest agreement out of the three initial test values, we then tested a threshold larger than 1.2 and a threshold that was smaller. The smaller threshold value returned a better agreement result, meaning that the optimal threshold value was to be found between 1.02 and 1.2. Further testing resulted in an optimal sinuosity threshold value equal to 1.15 (i.e. waterways with sinuosity lower than 1.15 are classified as “canals” and larger than 1.15 as “natural channels”), returning a 68% agreement. Though a method of trial and error was used to refine the sinuosity threshold value, we still consider the method to be automatic, as the classification is automatic once a threshold is set.
Figure 5 shows the sinuosity-based and qualitative two-category waterway classifications of the pre-modern waterways and their comparison. Most of the incorrect automatic classification results are in the distributary area of the Çarşamba River: this is because the pre-modern waterways have a wider distribution of sinuosity (see Figure 5a and c), meaning that a certain portion of waterways will always return a “False” result regardless of the threshold adopted for the automatic sinuosity-based classification.
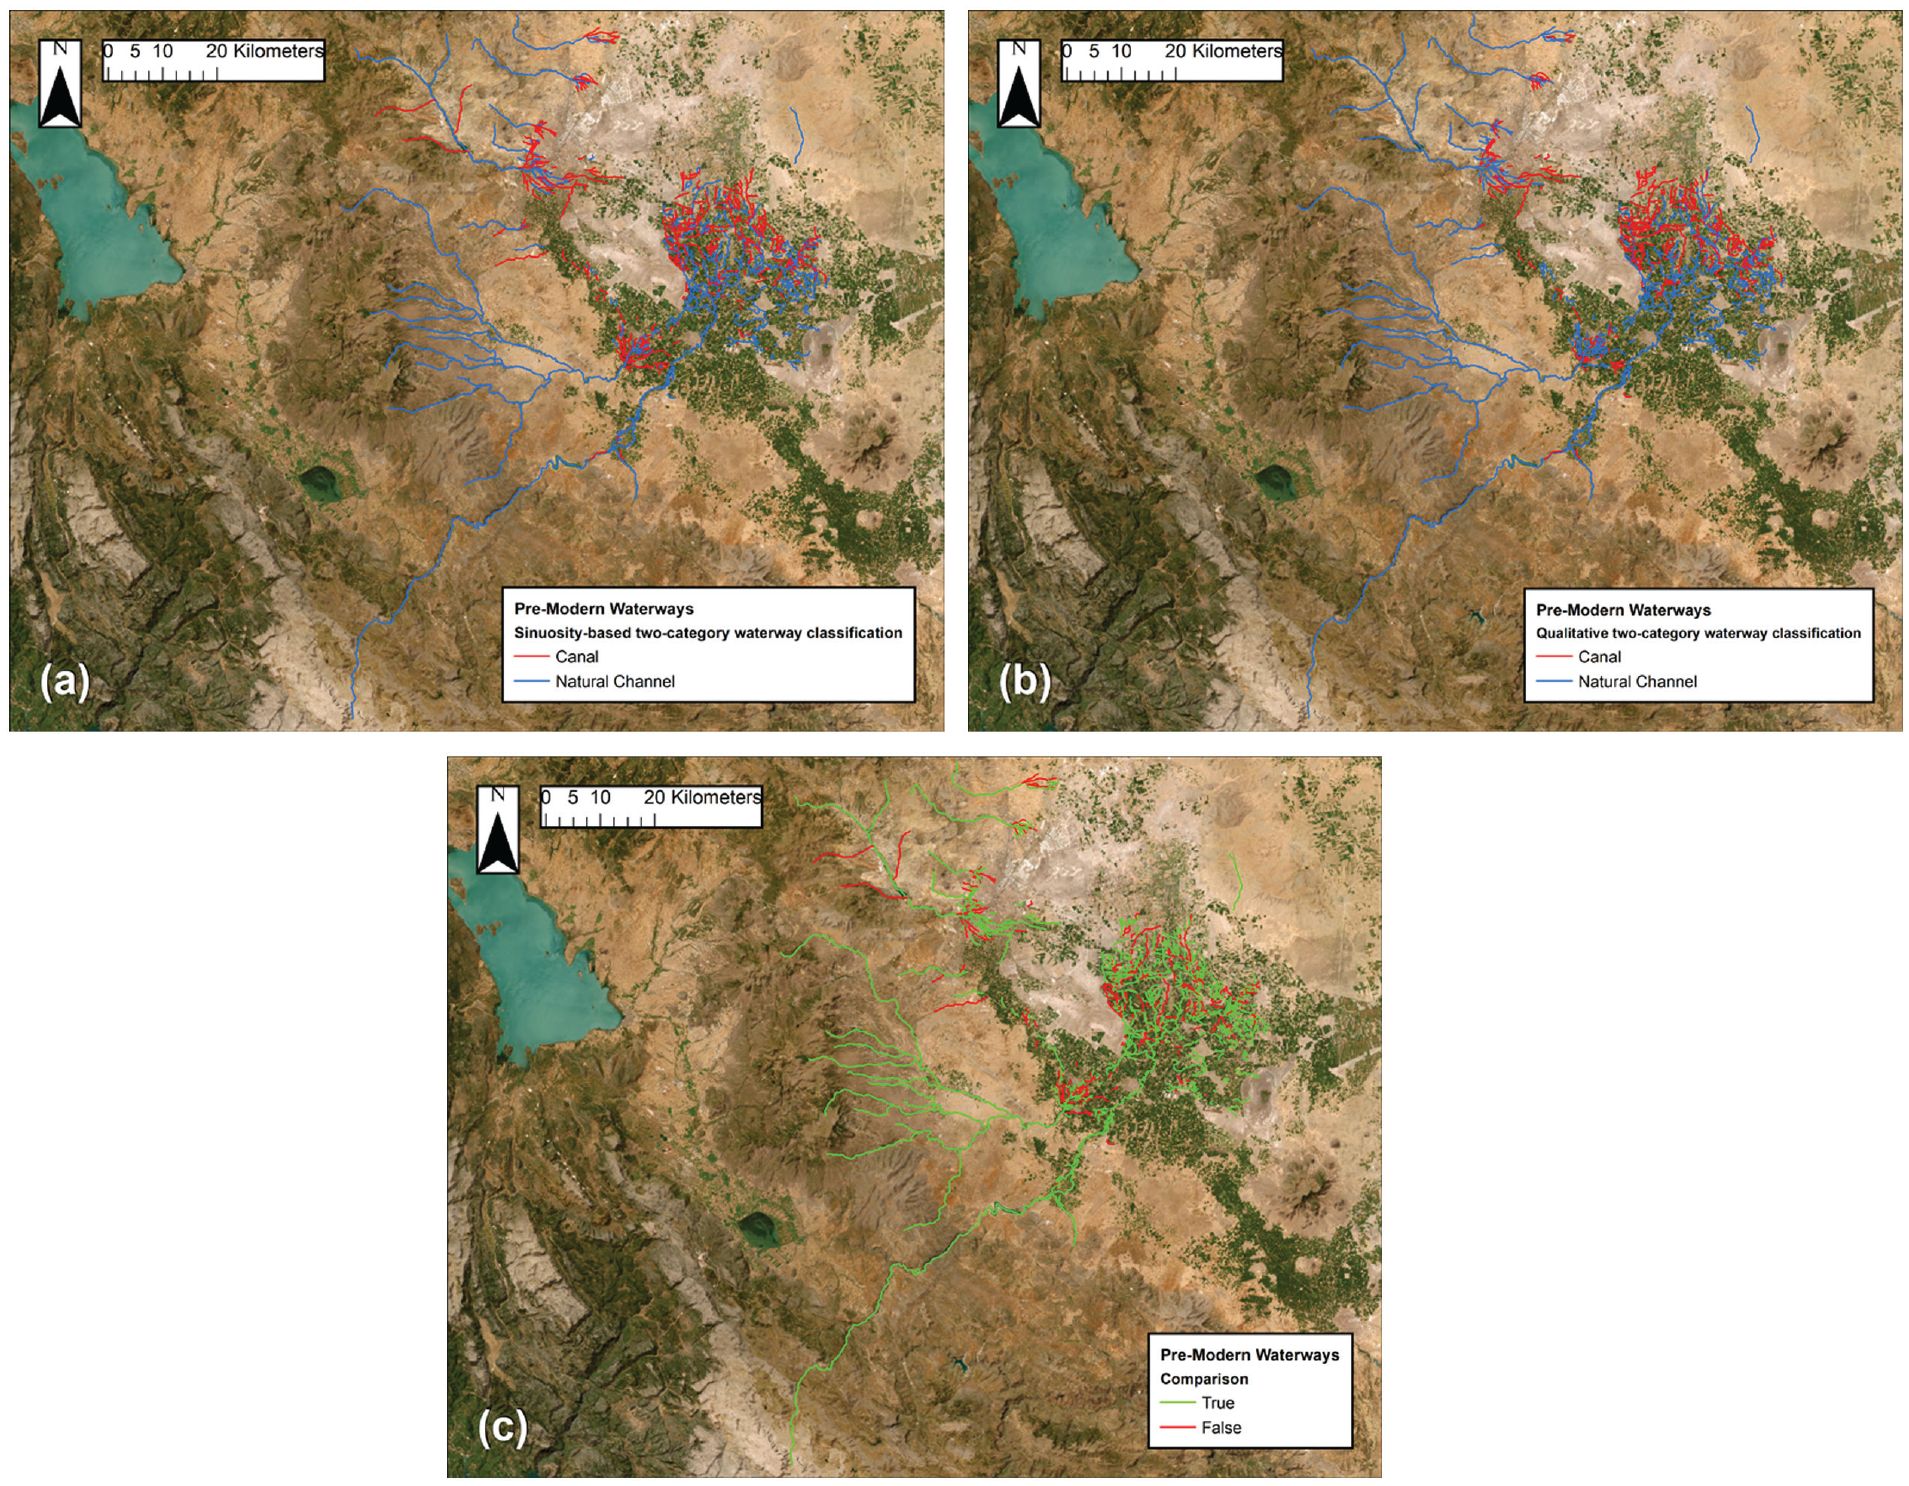
(a) Sinuosity-based two-category waterway classification of the pre-modern waterways, using a sinuosity threshold of 1.15. (b) Qualitative two-category waterway classification of the pre-modern waterways. (c) Comparison of sinuosity-based and qualitative classifications (“True”: sinuosity-based and qualitative classifications are the same; “False”: the two classifications differ).
To visually illustrate the process of search for the optimal sinuosity threshold described above, Figure 6 shows, for different threshold values, including the optimal value (1.15), a breakdown of the percentage of “true” instances, “false” instances, “false” instances corresponding to natural channels misclassified as canals and “false” instances corresponding to canals misclassified as natural channels. There are generally more natural channels misclassified as canals than vice versa: this is expected, as the range of sinuosity for natural channels is wider (Figure 4), hence a larger chance for misclassification. Also, as the sinuosity threshold increases, an increasing portion of natural channels is misclassified as canals.
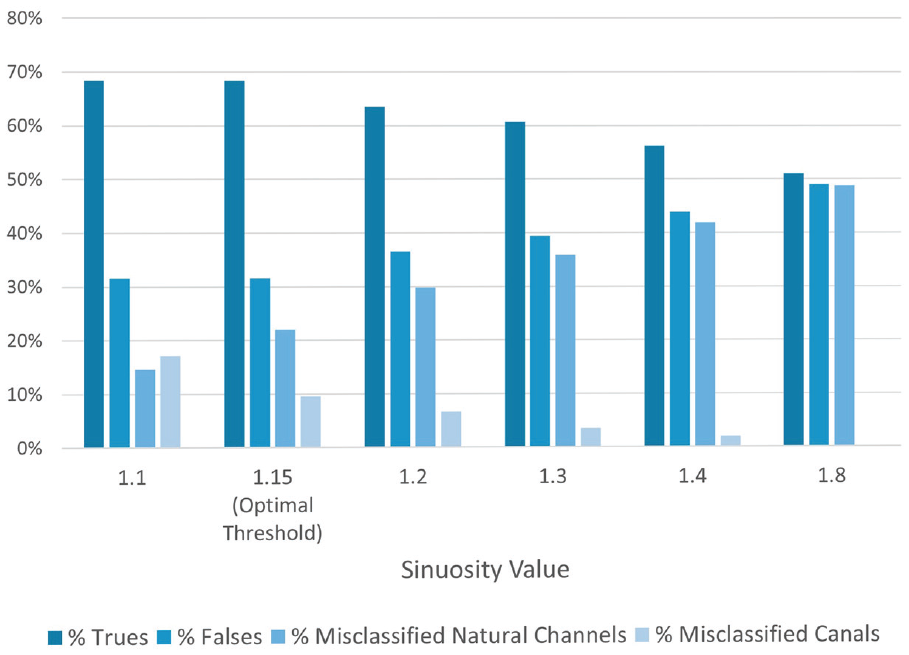
Results of the trial and error search for the optimal sinuosity threshold for the two-category classification in Figure 5.
Using the trial-and-error method again, sinuosity threshold values of 1.2, 1.4, and 1.8 were tested to automatically classify the waterways in the present-day network, either as “canal” or “natural channel,” returned an agreement with the qualitative classification of 88%, 97%, and 99.6%, respectively. We found the optimal value of sinuosity threshold to be 1.7, which provided a very high classification accuracy of 99.5% (Figure 7). Though 1.8 returned a better agreement, we found that because the dataset is mostly composed of canals, an increasing threshold value will continue to return an increasing agreement result as well. However, this then results in most natural channels being misclassified. Therefore, we opted for the threshold value of 1.7 as it returned the best agreement for both canals and natural channels.
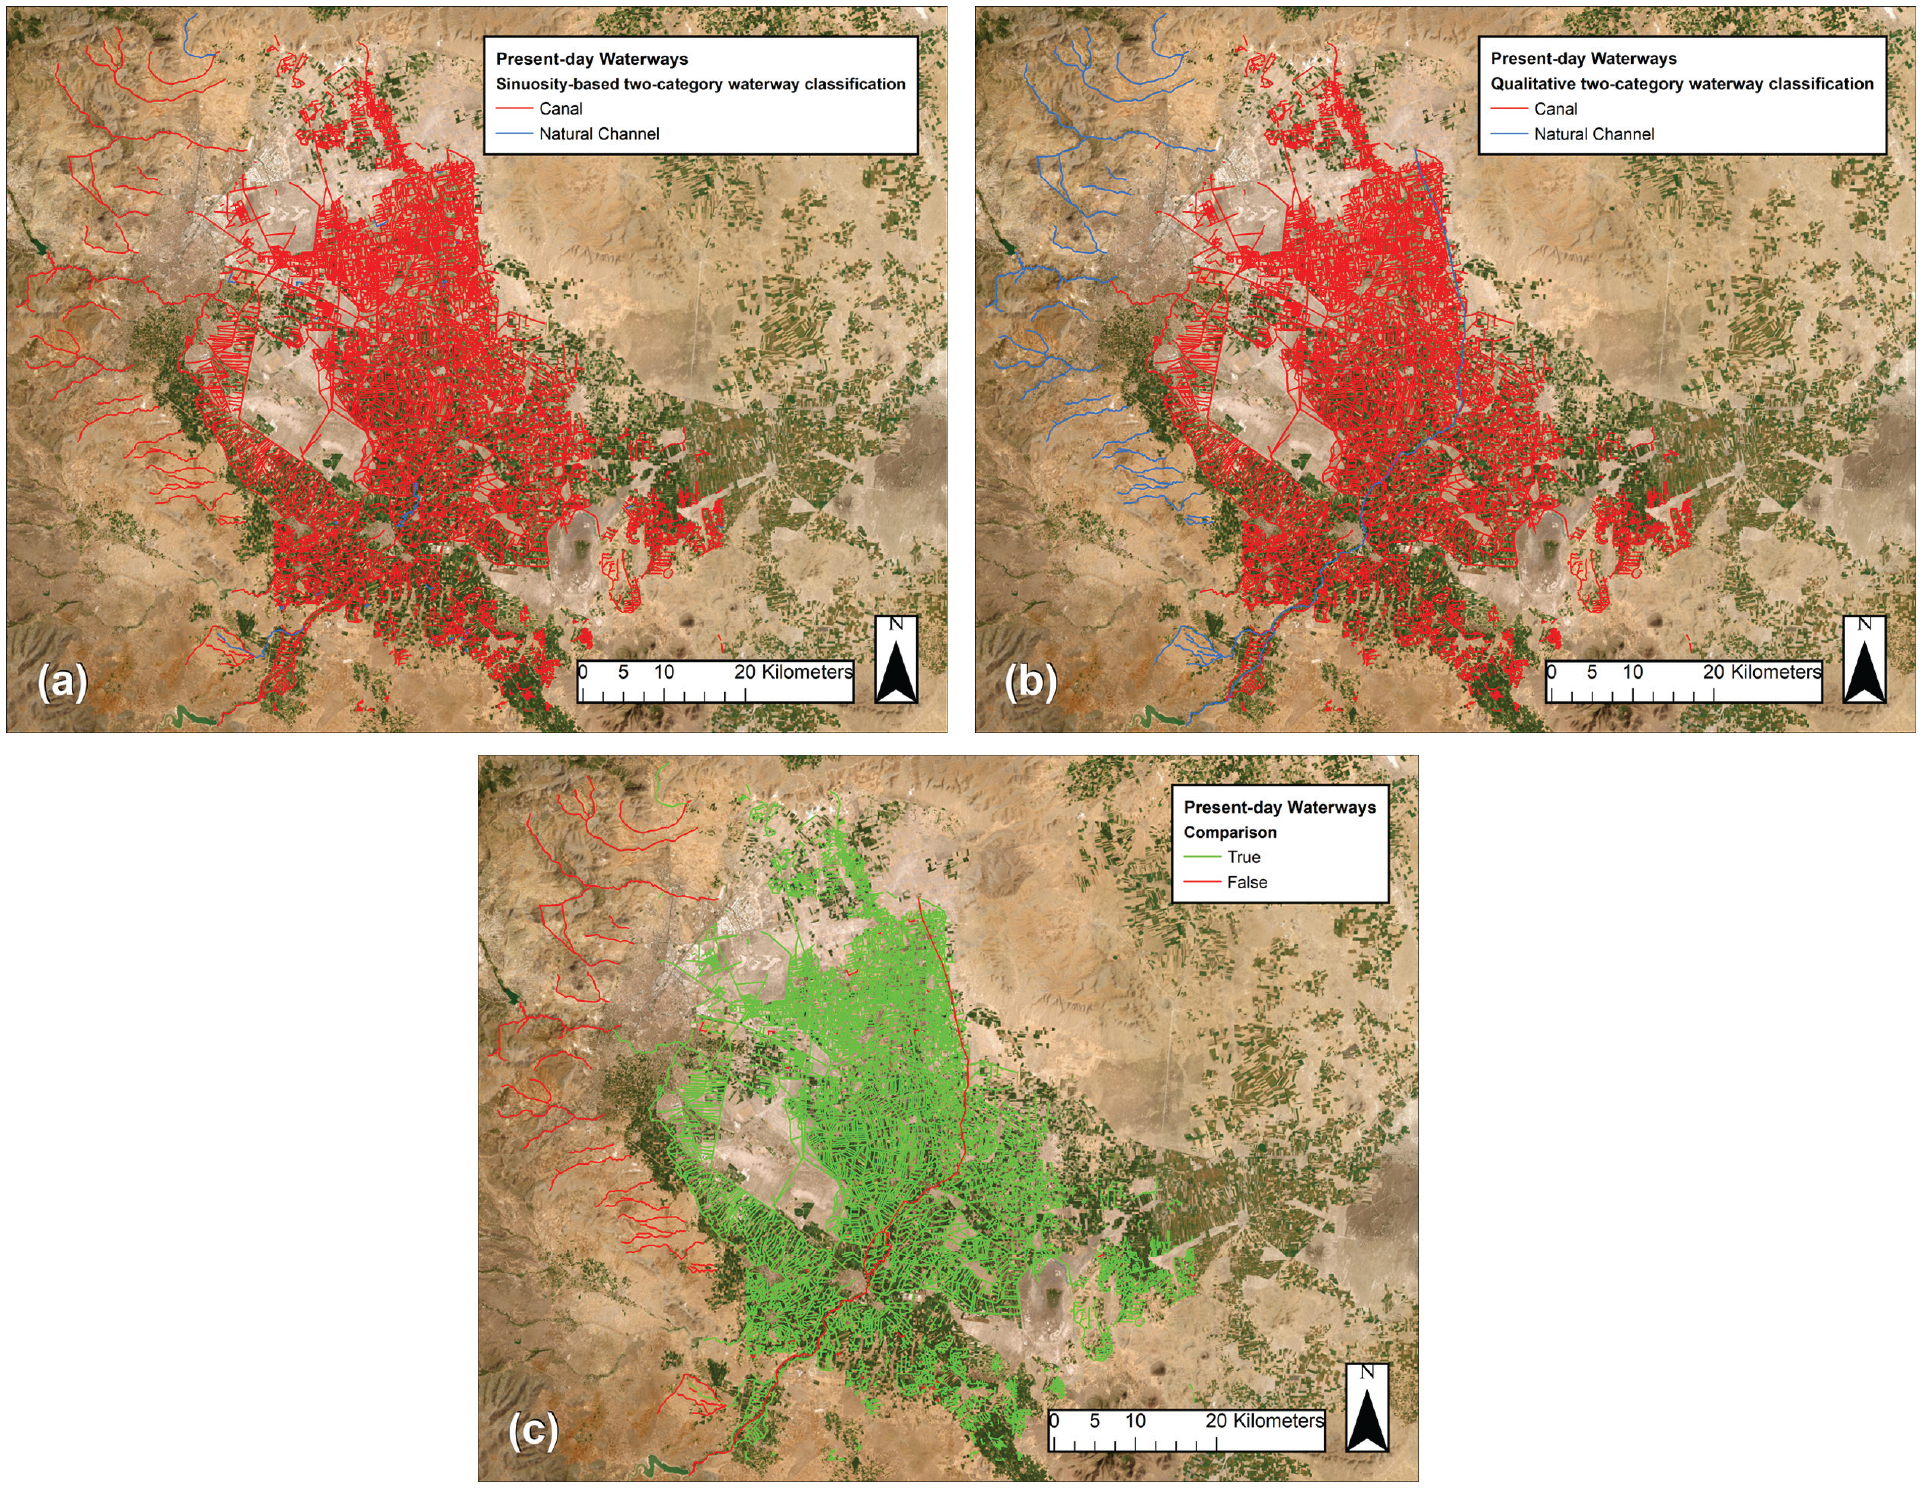
(a) Sinuosity-based two-category waterway classification of the present-day waterways, using a sinuosity threshold of 1.7. (b) Qualitative two-category waterway classification of the present-day waterways. (c) Comparison of sinuosity-based and qualitative classifications (“True”: sinuosity-based and qualitative classifications are the same; “False”: the two classifications differ).
Using a high sinuosity threshold resulted in the misidentification of the minor water streams on the Taurus piedmont, which have low sinuosity due to topographic constraints (discussed in Section 4.1.6), resulting in them being classified as “canals” when they are “natural channels” (Figure 7b). The Çarşamba River, which cuts across the distributary area, was identified as a “canal” (Figure 7a and c) as opposed to the qualitative classification as “natural channel.” This misclassification reflects the human intervention over the millennia on this watercourse, originally a natural river, which the sinuosity-based classification reflects in a “canal” classification. In other words, the automatic classification reveals the true nature of the modern Çarşamba River, which is effectively that of a highly modified watercourse (see further discussions in Sections 4.1.6 and 4.2.2).
Automatic sinuosity-based three-category classification
The sinuosity ranges defined from the subsets (Section 4.1.2) were again used to determine threshold values for a three-category waterway classification. Initially, ranges of <1.02, 1.01–1.82, and >1.82 were used for the automatic three-category sinuosity-based classification for “canals,” “maintained channels,” and “natural channels,” respectively, and this returned an agreement with the qualitative classification of 29%. The sinuosity ranges were then refined by trial and error, as <1.15, 1.15–1.25, and >1.25, returning a 58% agreement (Figure 8). “False” instances are distributed across the three categories and this performance is worse than that obtained with the automatic two-category classification. This is again due to the wide distribution of sinuosity in the pre-modern network (Figure 4a and c), which makes it challenging to identify a specific sinuosity range for a certain type of waterway.
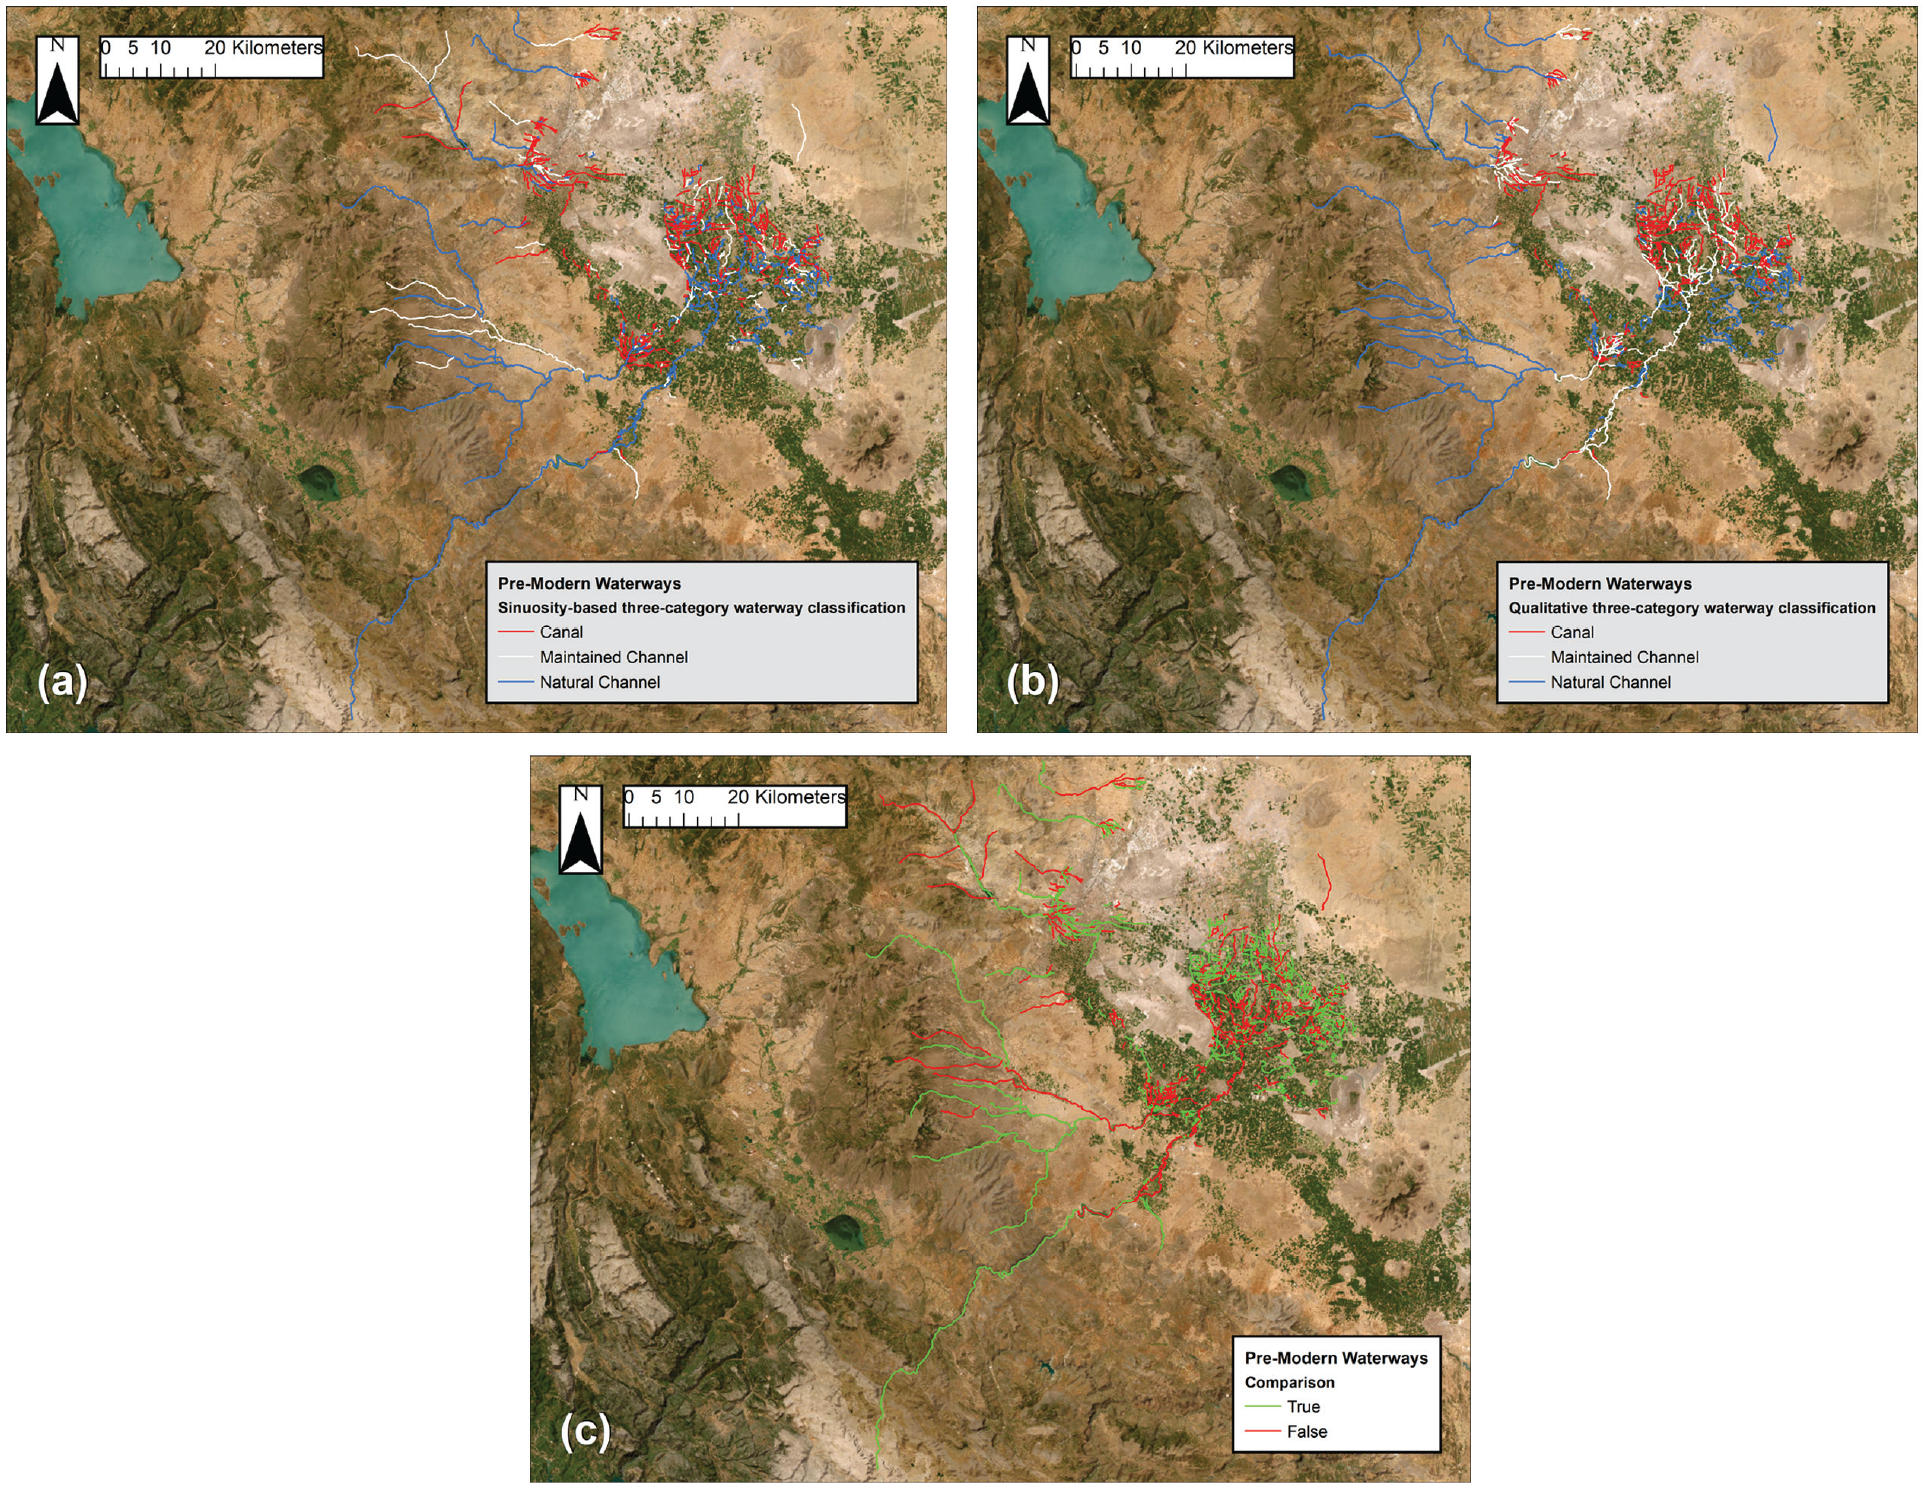
(a) Sinuosity-based three-category waterway classification of the pre-modern waterways, using sinuosity threshold ranges of <1.15, 1.15–1.25, >1.25. (b) Qualitative three-category waterway classification of the pre-modern waterways. (c) Comparison of sinuosity-based and qualitative classifications (“True”: sinuosity-based and qualitative classifications are the same; “False”: the two classifications differ).
The same procedure was followed for the present-day network: sinuosity-based classification of <1.02, 1.02–1.82, and >1.82 returned a 70% agreement. The optimal classification, found to be <1.5, 1.5–1.7, and >1.7 returned a 98% agreement (Figure 9). As in the case of two-category classification, the minor water streams on the Taurus piedmont were misidentified as “canals” and the Çarşamba River continues to be classified as “canal.”
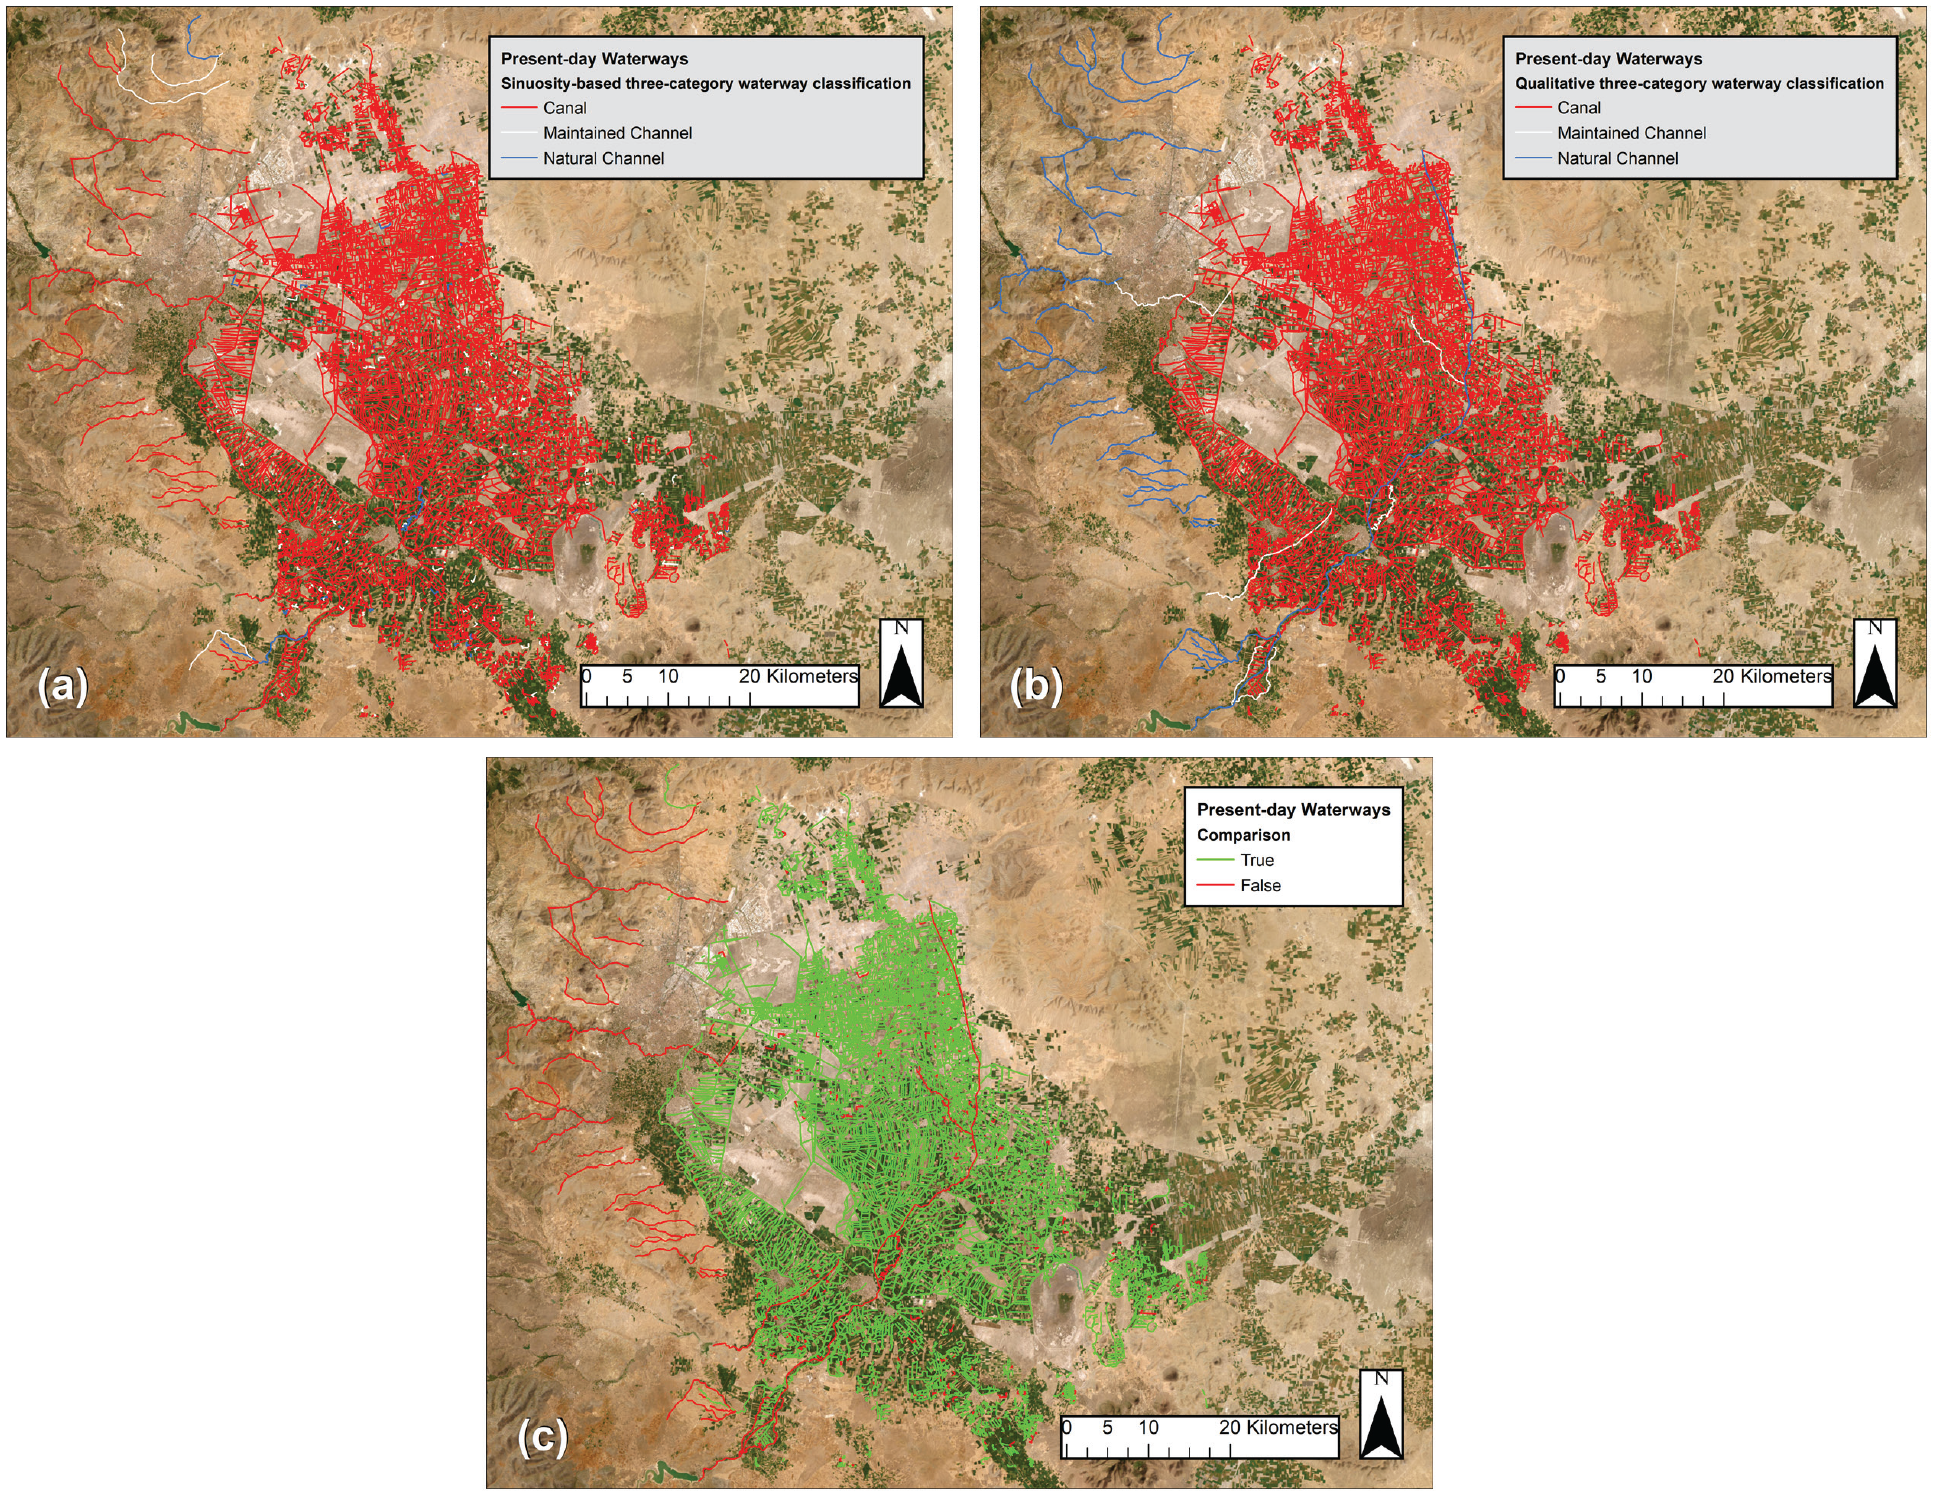
(a) Sinuosity-based three-category waterway classification of the present-day waterways, using sinuosity threshold ranges of <1.5, 1.5–1.7, >1.7. (b) Qualitative three-category waterway classification of the present-day waterways. (c) Comparison of sinuosity-based and qualitative classifications (“True”: sinuosity-based and qualitative classifications are the same; “False”: the two classifications differ).
Automatic sinuosity-based fuzzy five-category classification
The automatic sinuosity-based fuzzy classification was based on five categories: “canal,” “maintained channel or canal,” “maintained channel,” “maintained or natural channel,” and “natural channel.” The associated sinuosity thresholds were initially set as <1.05, 1.05–1.1, 1.1–1.5, 1.5–1.8, and >1.8, respectively, based on the sinuosity ranges for the waterway subsets, resulting in a 51% performance for the pre-modern network. A more constrained sinuosity threshold range, <1.1, 1.1–1.2, 1.2–1.4, 1.4–1.6, and >1.6 returned the best performance at 68% (Figure 10a and b), on par with the performance obtained with the two-category automatic classification. To clarify the meaning of “true” in the fuzzy classification context, a sinuosity-based classification including two waterway types (e.g. “maintained channel or canal”) returned a value of “true” if either of those two waterway types was the same as the qualitative classification (e.g. either “maintained channel” or “canal”).
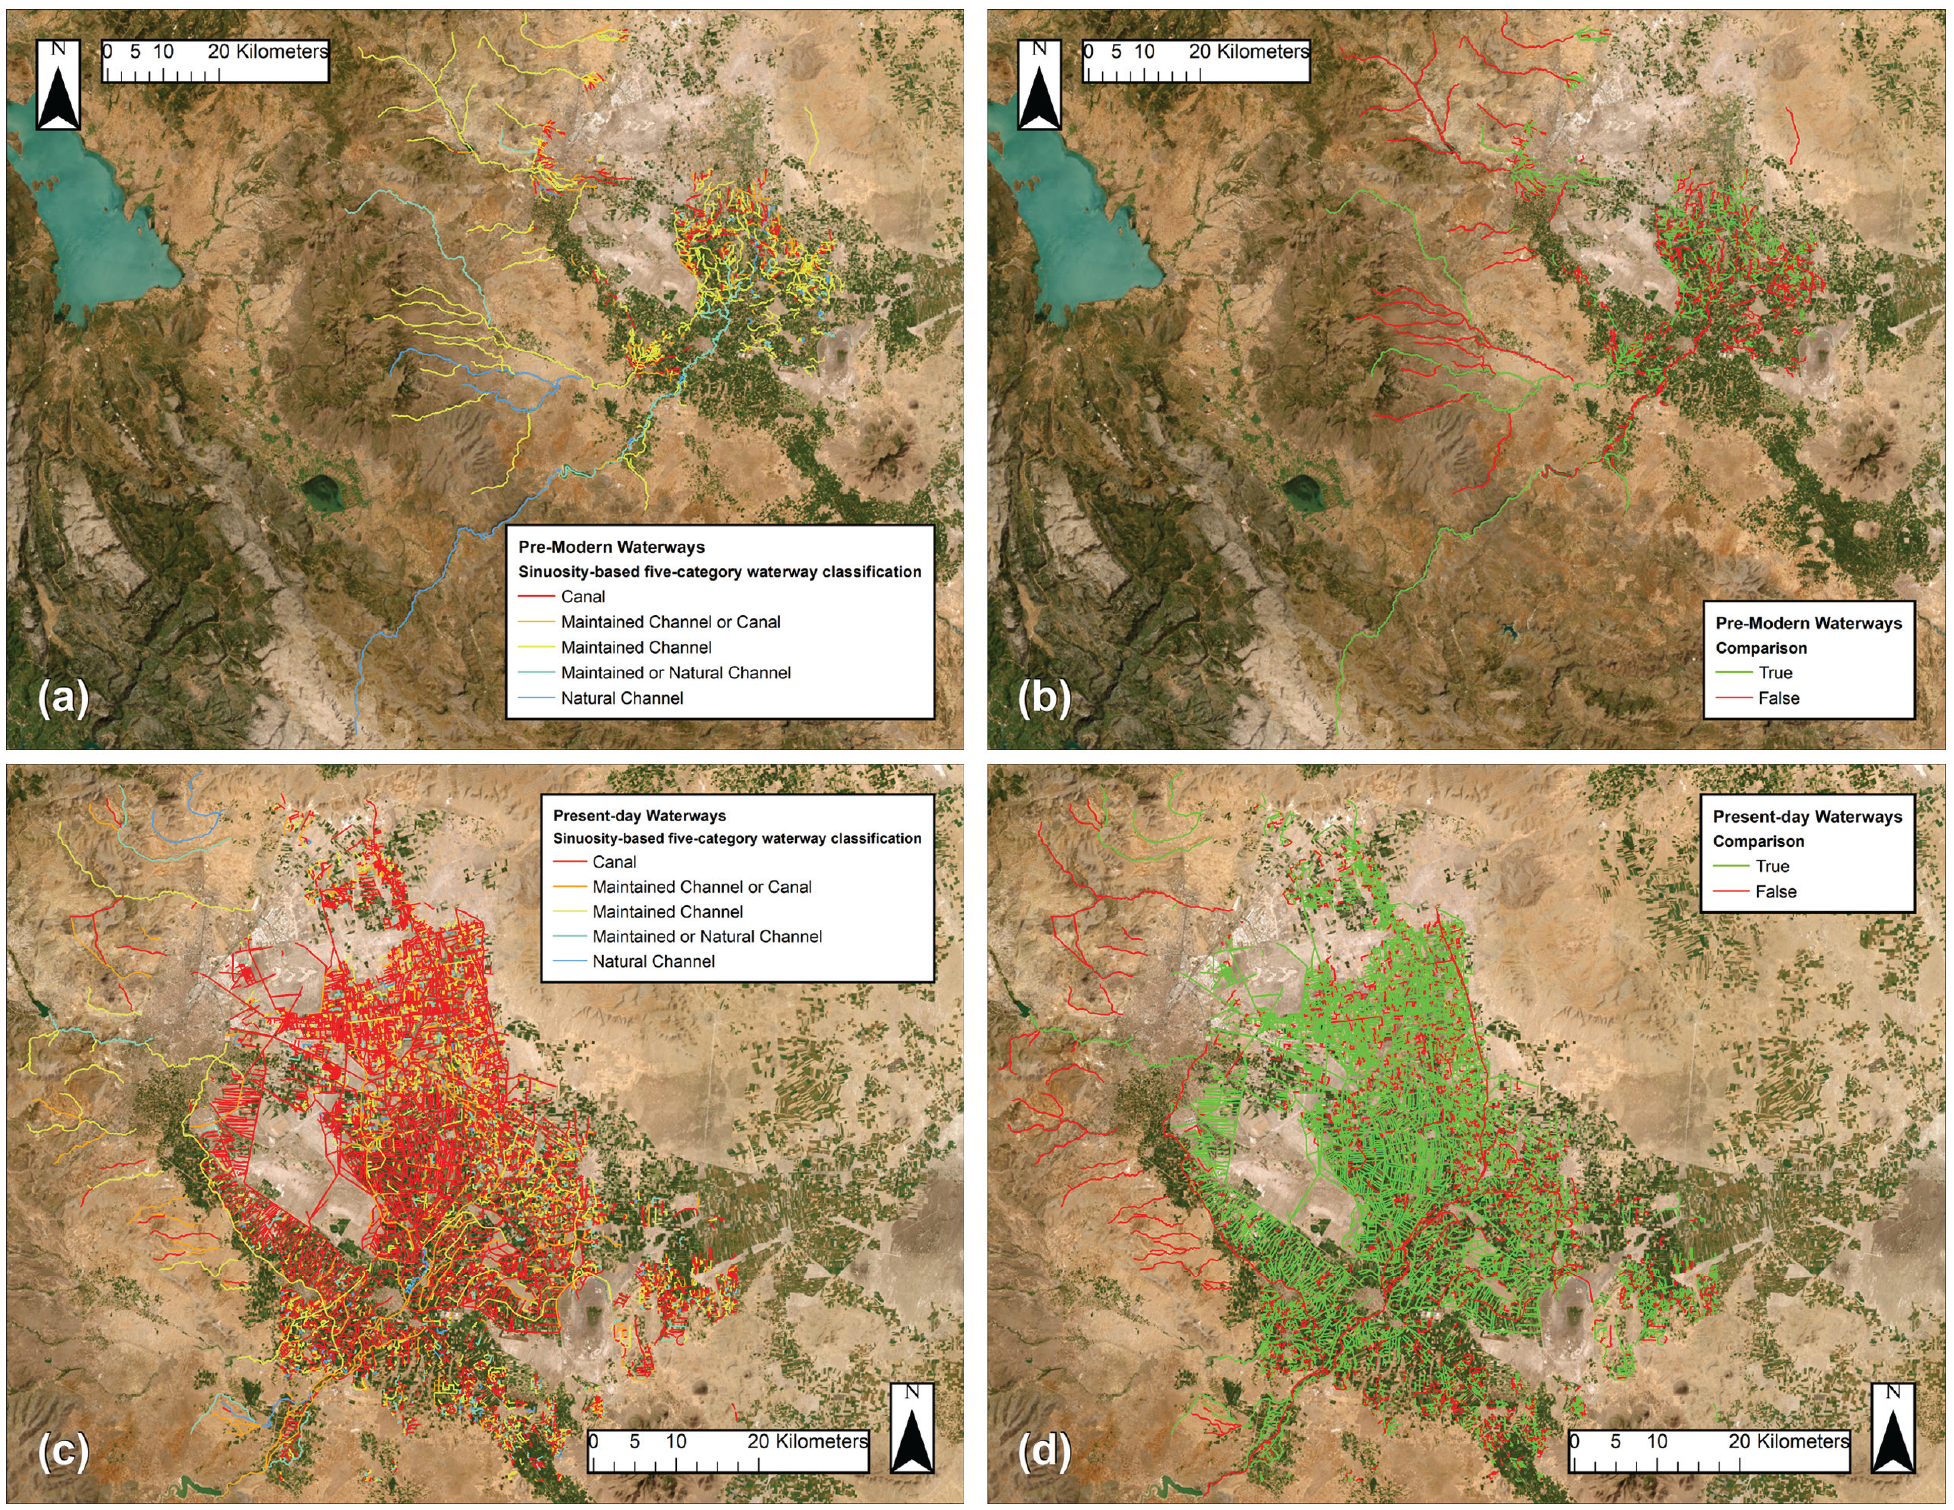
(a) Sinuosity-based five-category waterway classification of the pre-modern waterways, using sinuosity threshold ranges of <1.1, 1.1–1.2, 1.2–1.4, 1.4–1.6, >1.6. (b) Comparison of sinuosity-based and qualitative classifications for the pre-modern waterways. (c) Sinuosity-based five-category waterway classifcation of the present-day waterways, using sinuosity threshold ranges of <1.1, 1.1–1.2, 1.2–1.4, 1.4–1.6, > 1.6. (d) Comparison of sinuosity-based and qualitative classifications for the present-day waterways (“True”: sinuosity-based and qualitative classifications are the same; “False”: the two classifications differ).
The five-category sinuosity-based fuzzy classification for the present-day network (Figure 10c and d) performed well in terms of number of “true” results, but not better than the two-category classification. The wider threshold range was first tested on the present-day waterways, returning an 81% performance. Similarly to the pre-modern network, the present-day network also performed better under the more constrained sinuosity threshold range, with an 88% performance.
Though both networks saw an increase in accuracy when using the five-category fuzzy classification compared with the three-category classification, the pre-modern network saw the more significant improvement.
Performance of the various automatic sinuosity-based classifications
When using sinuosity to automatically classify waterways, we found that the classification performance was higher when adopting only two categories (“canal” vs “natural channel”) and when applied to a network (in this study, the present-day network) characterized by marginally overlapping sinuosity ranges for “canals” and “natural channels.” The accuracy obtained for the pre-modern network (68% accuracy) is significancy less than that obtained for the present-day network (99% accuracy), but still shows that automatic classification of waterways based on sinuosity can be a useful first step, to be followed by manual human judgment-based checking and refinement.
Introducing a more nuanced classification in three categories (“canal” vs “maintained channel” vs “natural channel”) comes at the cost of a reduced performance of the sinuosity-based classification, especially for the pre-modern-network, with accuracy down to 58% (Figure 8c) from 68% (Figure 5c). This is due to the wide and overlapping sinuosity ranges for the three categories in the pre-modern network (Figure 4e). A better classification performance can be obtained for the network, back to 68% (Figure 10b), using a fuzzy classification approach with no “hard” sinuosity thresholds, which shows the fuzzy approach to be a valid alternative to a less informative two-category classification for networks not as heavily human-modified as the present-day network.
We also found that threshold values for sinuosity-based classifications vary depending on the waterway network considered, which means that they are area- and time-specific. The area in which a network is located will have a huge impact on how it has developed, due to factors such as topography, though it can also be constrained by the specific time period of development, which affects the available technology and human labor. Sinuosity threshold values must therefore be informed by observations on the waterways of interest, not by previous studies for other areas.
An issue in the automatic classification was identified, as mentioned, for the streams on the Taurus piedmont, incorrectly classified as “canals” (see for instance Figure 7c). This misidentification is due to the rather low sinuosity of these streams, which is the result of topographic control. Some scholars have discussed the effect of elevation of natural watercourses. Jha and Diplas (2018) presented elevation as a unifying parameter for stream-classification purposes, and they also identified consistent morphological trends exhibited by streams that are related to changing elevation. Regarding sinuosity, they found that lower elevation zones correlate with higher sinuosity values (Jha and Diplas, 2018: 303). This finding therefore suggests that higher elevation can impact the sinuosity of channels, which was also observed by Leopold and Wolman (1957) as well as Harden (1990). Figure 11a shows that the ground elevation in the areas of the streams in the Taurus piedmont is generally higher compared with the rest of the network in the distributary area. Figure 11b shows the ground slope spatial distribution, highlighting the valley narrowness for these streams, which contributes to containing meandering and therefore sinuosity. These factors explain the relatively low sinuosity of these natural watercourses, hence their misclassification as “canals”. Thus, an automatic sinuosity-based waterway classification approach may perform better when considering networks in areas characterized by relatively uniform topographic setting.
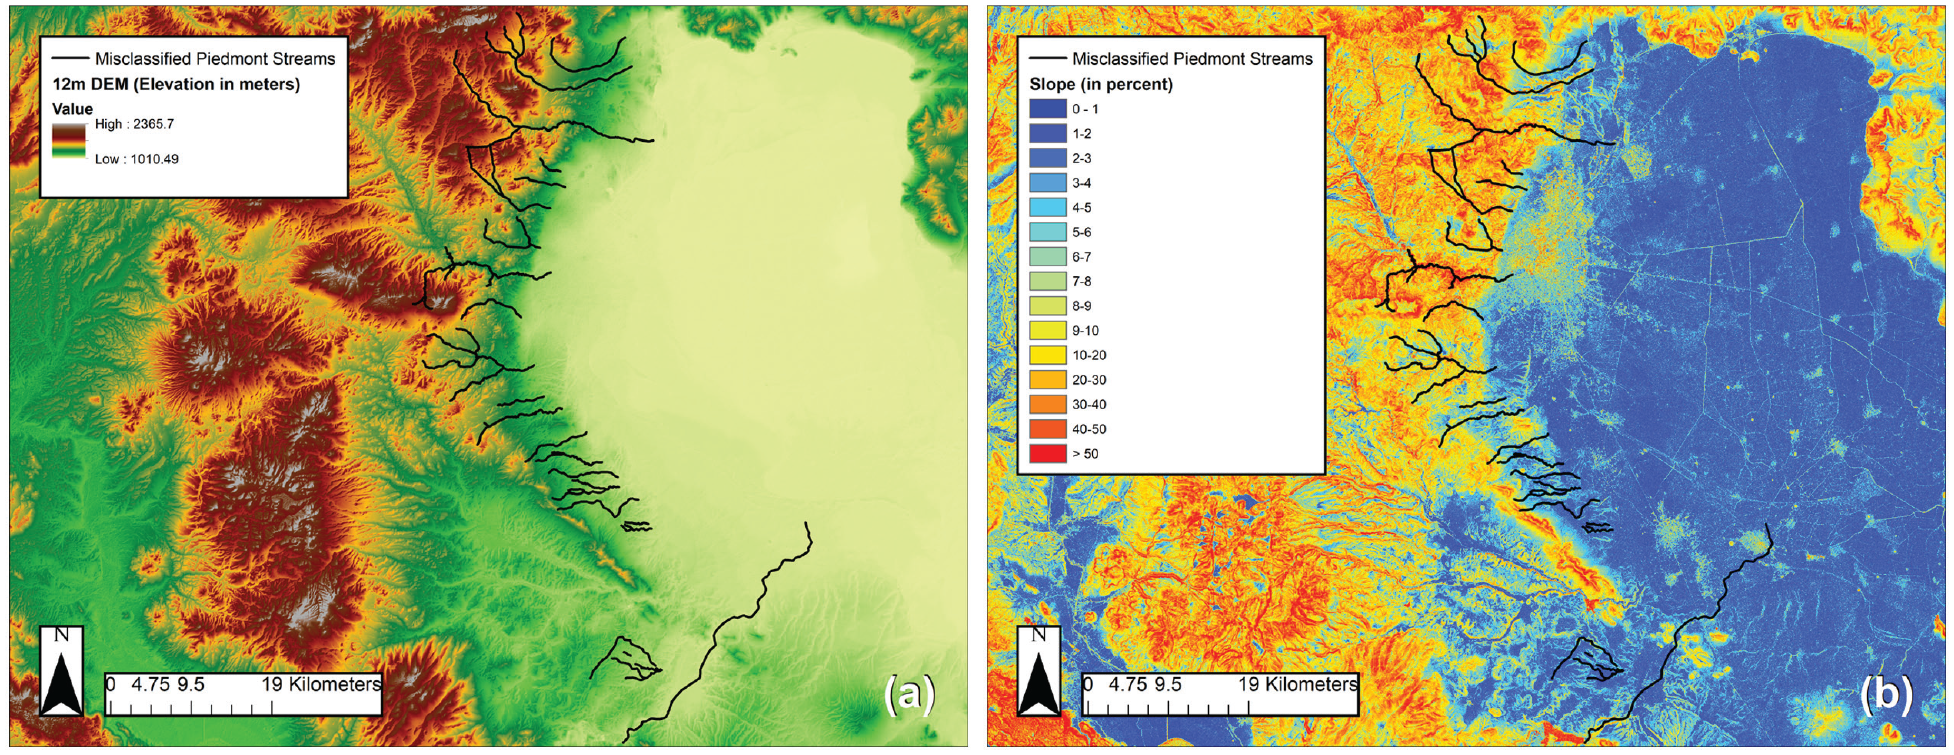
(a) Ground elevation and (b) slope in the study area.
The Çarşamba River was also classified as “canal” based on sinuosity. While it is named a “natural channel” in the classification from the HGM (Section 3.4), its planform configuration has been significantly altered by humans throughout history. Wainwright and Ayala (2022) state that the channel in its lower reaches tended to be multi-threaded in the early Holocene, changing to being a meandering channel possibly as early as the Chalcolithic. These changes could have resulted from climate fluctuations or internal variation in the geomorphology, but evidence from late prehistory does show that the Çarşamba was human modified at least in part for irrigation purposes as the population expanded in the basin (Massa et al., 2020: 56). There is also evidence for channel straightening in satellite imagery between the Apa Dam and Alemdar. These modifications are reflected in the “canal” automatic classification.
Long-term development of the irrigation network
Spatial patterns of sinuosity
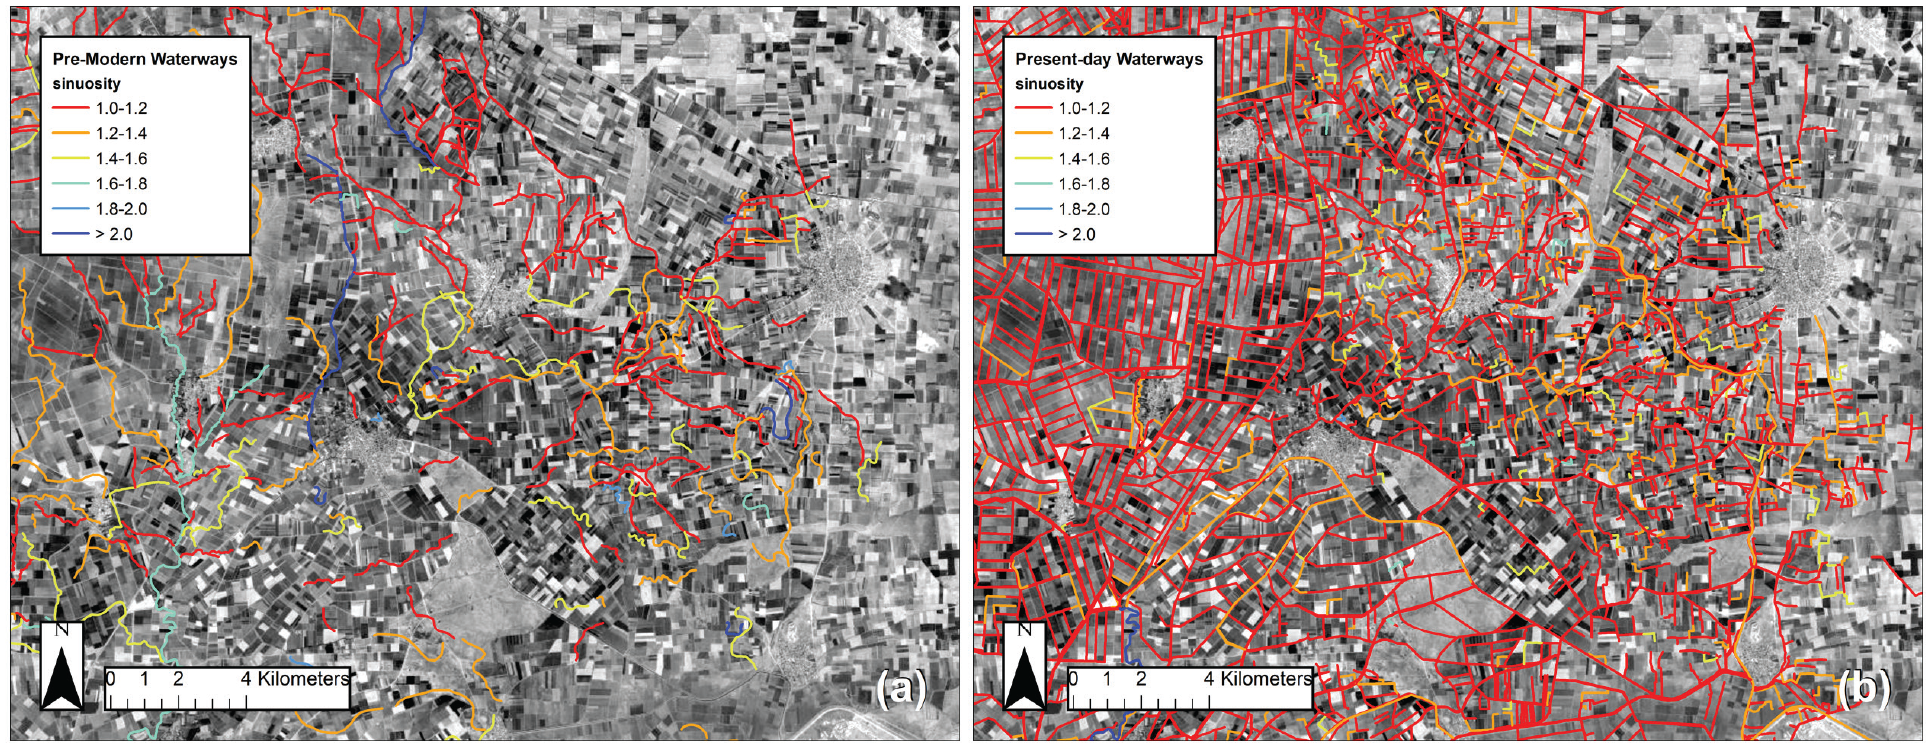
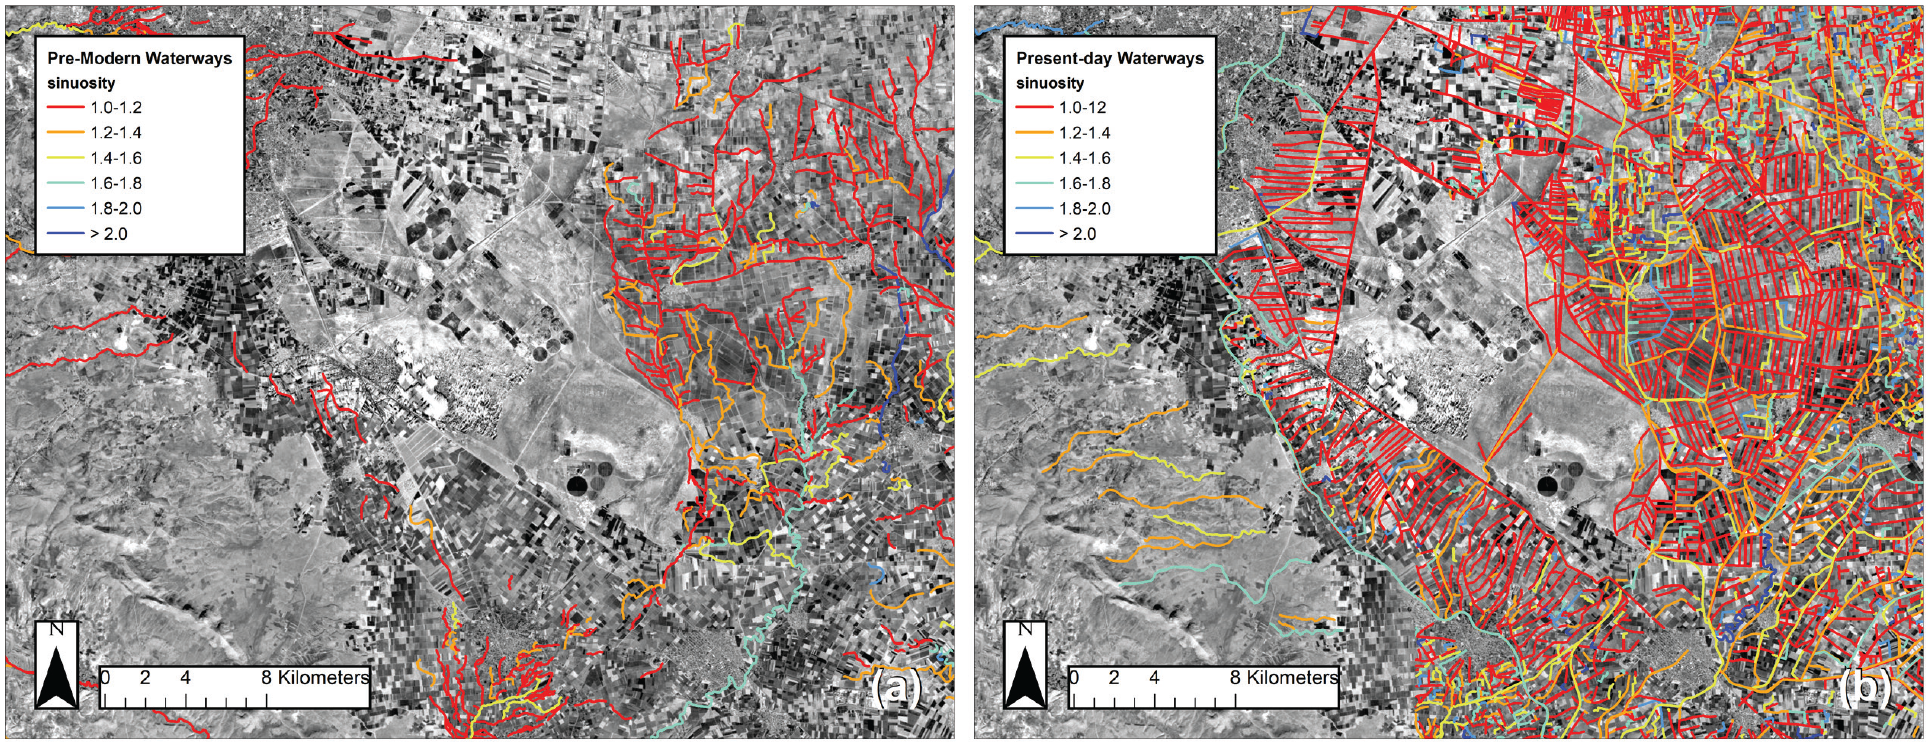
Mapping of the pre-modern and present-day networks based on sinuosity reveals significant spatial patterns in the area. Pre-modern waterways follow a pattern of diminishing sinuosity (Figure 12) moving from upstream, higher-slope areas into the flatter and lower elevation distributary area. Considering that (i) previous studies have found lower sinuosity to indicate human intervention on watercourses (Rashidian, 2021; Rutishauser et al., 2017), (ii) our analysis in Section 4.1.2 for the “canals” and “natural channels” subsets generally shows larger sinuosity values for the latter, and (iii) the general observed global relation of decreasing sinuosity for increasing slope (Frasson et al., 2019), especially in unconstrained valleys (see Figure 11 and the discussion in Section 4.1.6 for the streams on the Taurus piedmont), the decreasing sinuosity moving into the distributary area suggests human intervention and modification of the irrigation network, including expansion, into the plain.
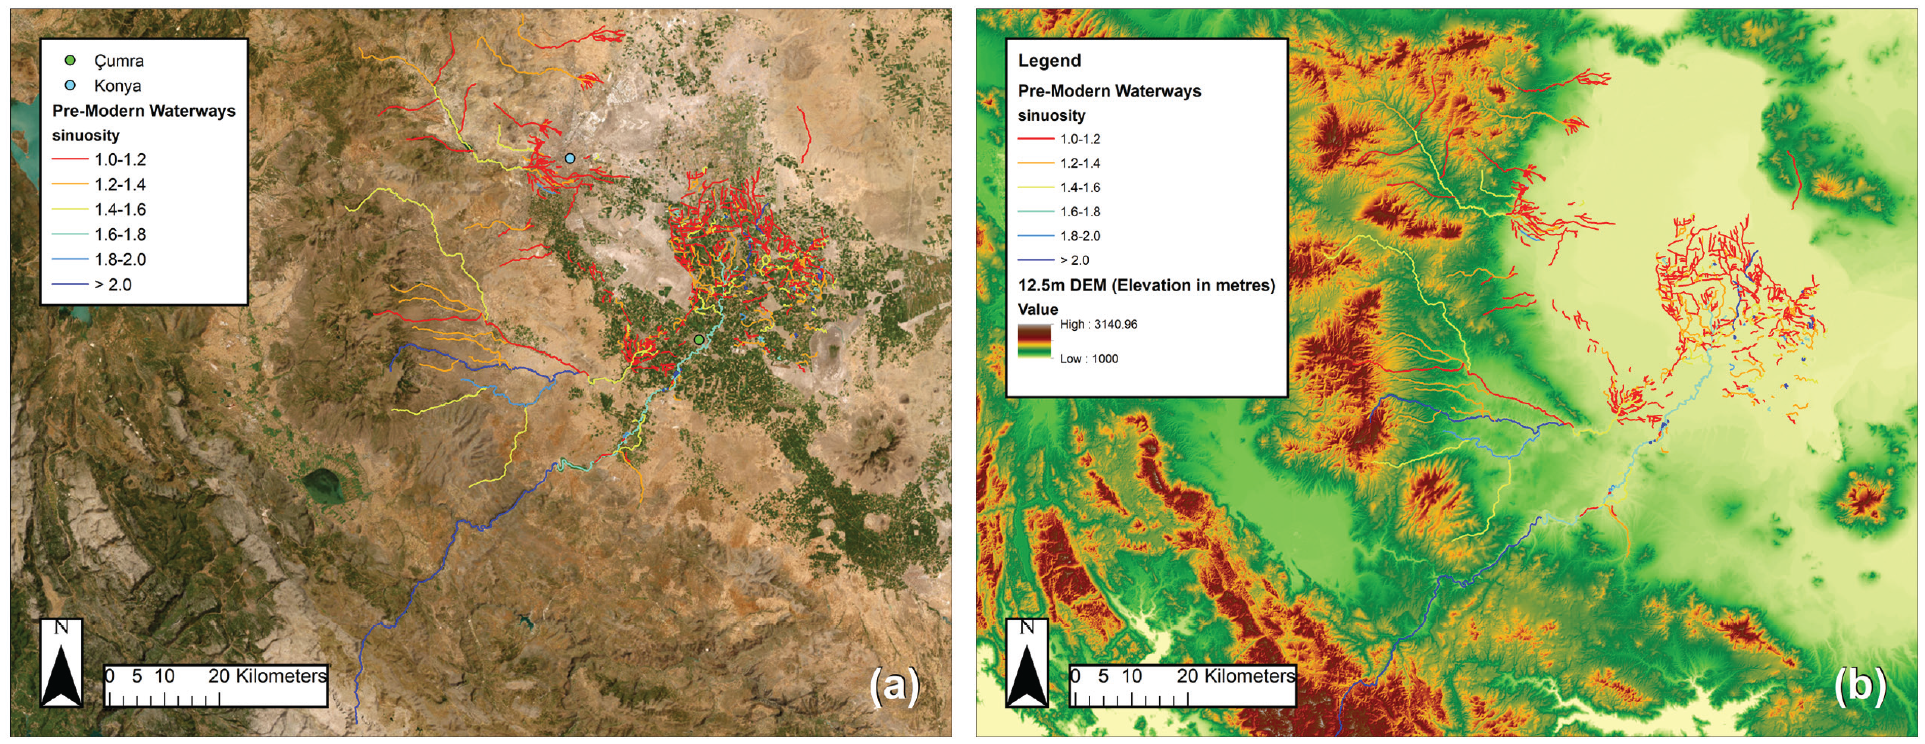
Sinuosity values of the pre-modern waterways on (a) satellite imagery background and on (b) 30-m digital elevation model background.
The present-day waterways are less clustered and are characterized by very low sinuosity values throughout much of the network, which suggests that it has been heavily modified (Figures 4b, d, and 13a). There are, however, still a few areas of slightly higher sinuosity which is where the present-day network appears to have been built over the late Ottoman irrigation system. In Figure 13b, area “A” comprises a group of low sinuosity canals (average sinuosity 1.03) constructed near two areas labeled “B” where there are higher sinuosity waterways (average sinuosity 1.09). The two “B” areas are where the new system has been built on top of the old, resulting in a nonuniform system of canals and sinuosity values.
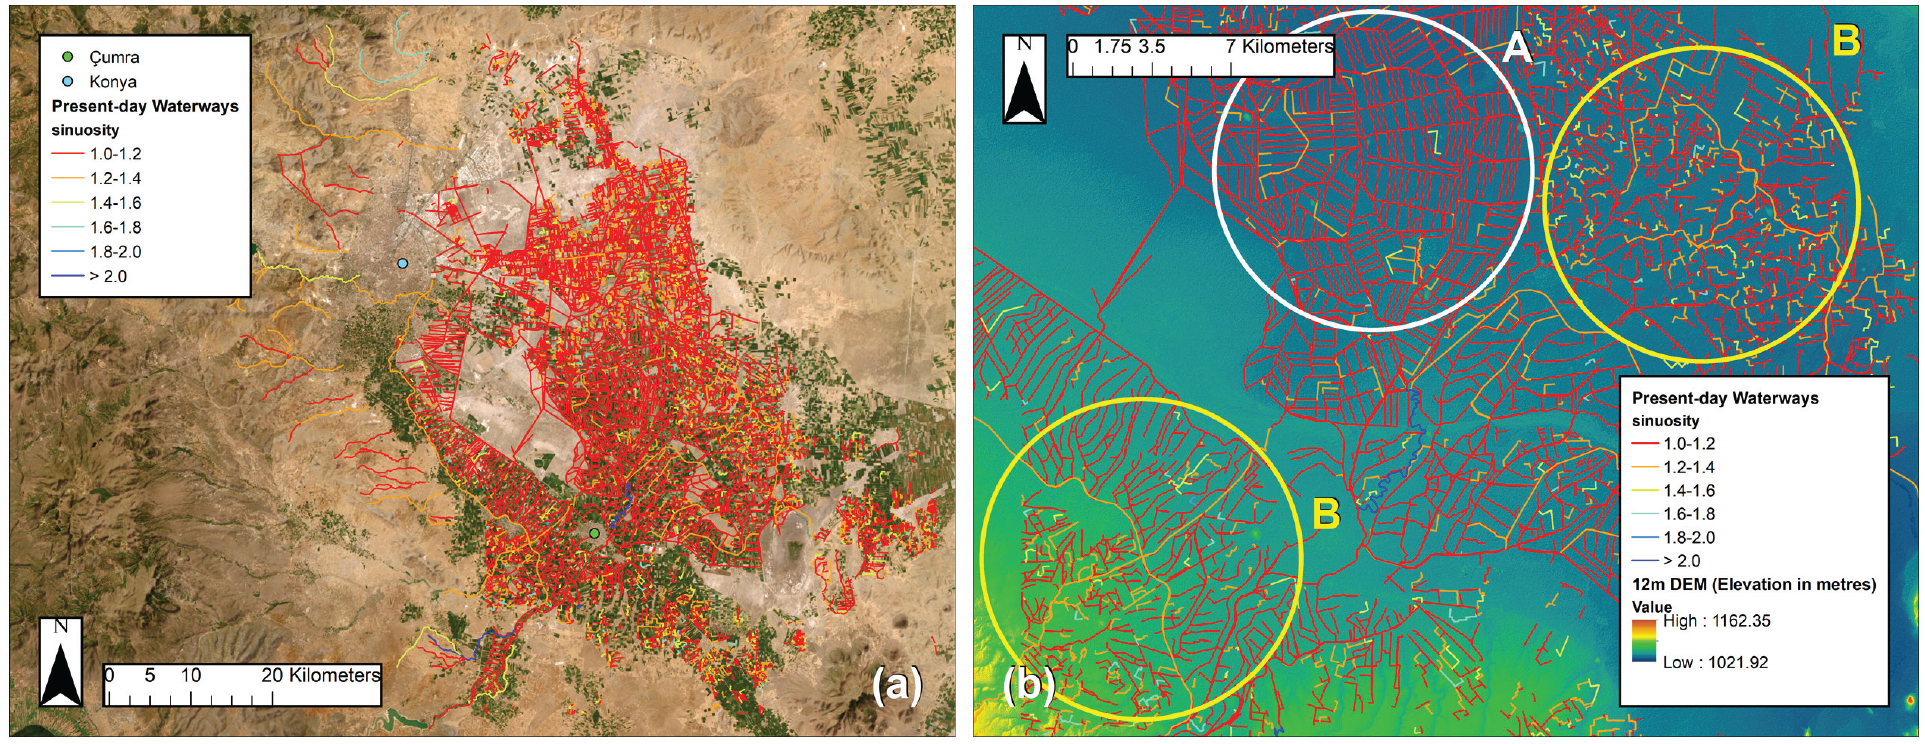
(a) Sinuosity values of the present-day waterways on present-day satellite imagery background. (b) Low sinuosity canals (area “A”) located near higher sinuosity canals that have been built upon the old Ottoman system (areas “B”).
These trends are also visible by looking at just the inactive waterways in the pre-modern network (Figure 14). In most cases, these are buried palaeochannels which are not connected to the present-day irrigation network and therefore predate both the 1913 system and its late Ottoman predecessor (Massa et al. in preparation). In Figure 14a, these palaeochannels cluster on the eastern margins of the distributary area and can be broadly dated by association with known archeological sites, though the end date of inactive palaeochannels is unknown (Massa et al., in preparation). The earliest of these sites start in the Early Chalcolithic (around 6000 BCE) and some continue until the present. The visibility of these palaeochannels could be the result of the eastern edge being outside of core agriculture areas, where they may still conduct water during wet periods, whereas in irrigated agriculture areas there tend to be fewer visible palaeochannels as a result of plowing and managed water systems. Another factor could be the increased adoption of water pumps, which has contributed to the abandonment of canal maintenance, because the pumps are considered to be a more efficient and independent source of water (Lemel, 2009: 433). Figure 14b shows the sinuosity distribution of the inactive pre-modern waterways, which is even wider than the pre-modern network as a whole (compare Figure 14a with Figure 12a). As an additional dataset, the inactive pre-modern waterways can be viewed as the first of three time slices, “pre-modern inactive,” “pre-modern active” and “present-day.” The observed chronological pattern of decreasing sinuosity through these three time slices (Figures 14a to Figure 12a to Figure 13a) again suggests a trend of progressively higher human intervention.
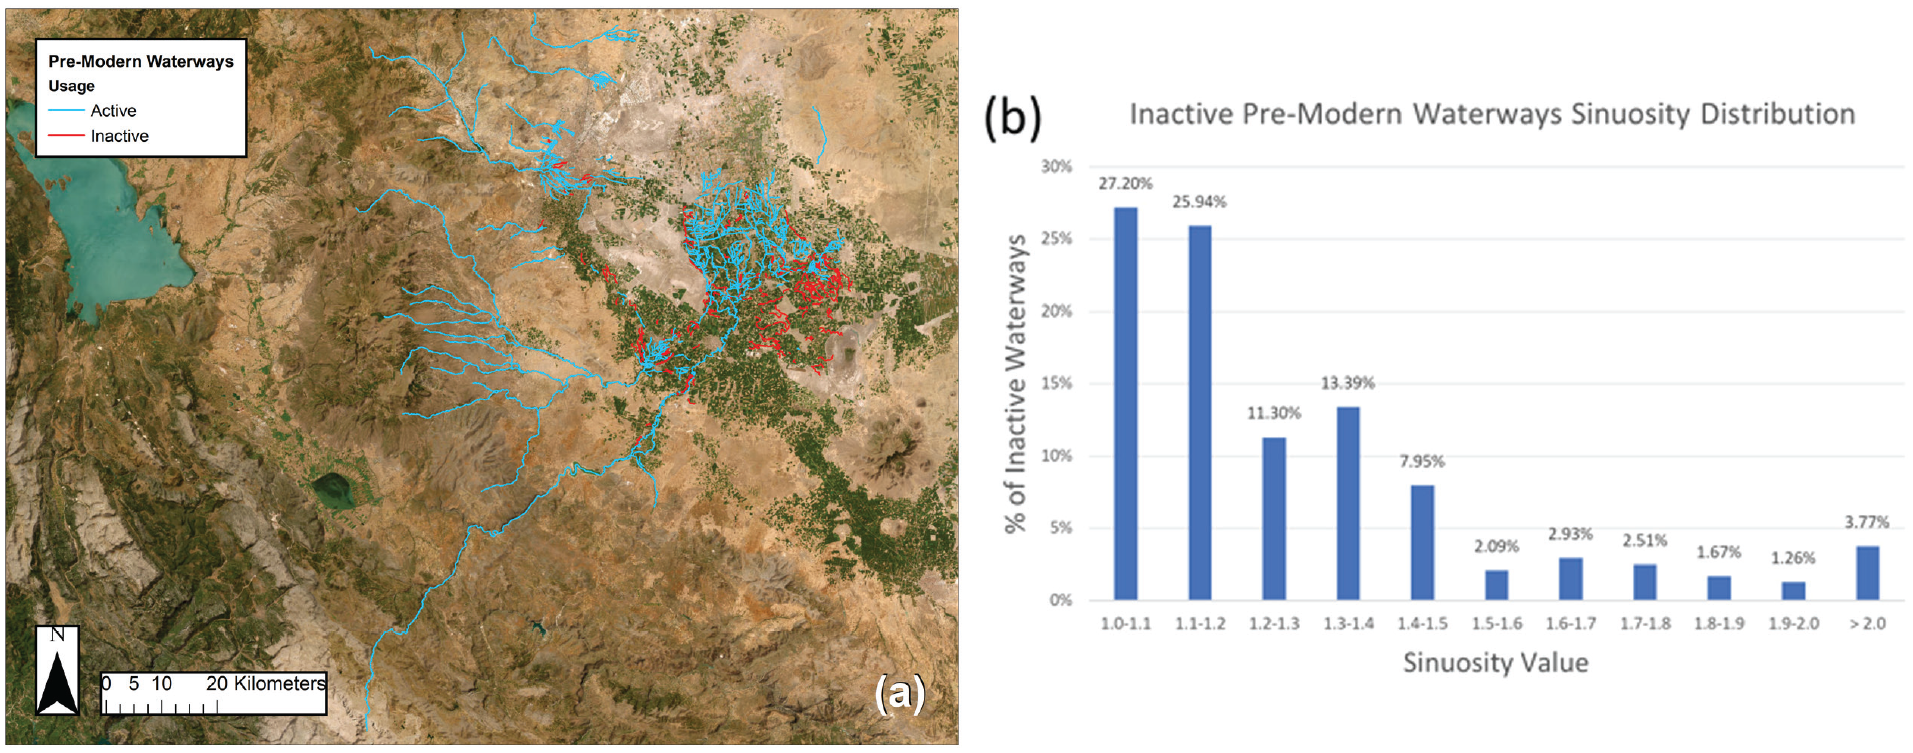
(a) Active and inactive pre-modern waterways and (b) sinuosity distribution for the inactive pre-modern waterways as percentage of the total inactive waterways.
Comparison of pre-modern and present-day waterway networks
When superimposing and comparing sinuosity maps for pre-modern and present-day waterway networks, changes in sinuosity highlight areas of human intervention or expansion (Jotheri, 2018; Santos et al., 2019; Wolf et al., 2021: 4). As discussed in Section 4.1.6, the Çarşamba River has experienced a decrease in sinuosity, which means it has undergone intervention and modification. This is especially evident in its downstream reaches, characterized by lower and lower sinuosity (Figure 15). Other more general areas of marked intervention include the north of the distributary area, where the canals of the present-day network have been constructed in close proximity, in order to supply the smaller-sized field systems (Figure 16). The east of the distributary area consists of the pre-existing Ottoman waterways which have been reused for the present-day network (Figure 17). In the west and southwest, however, the modern network was constructed mostly from scratch with larger parallel canals (Figure 18).
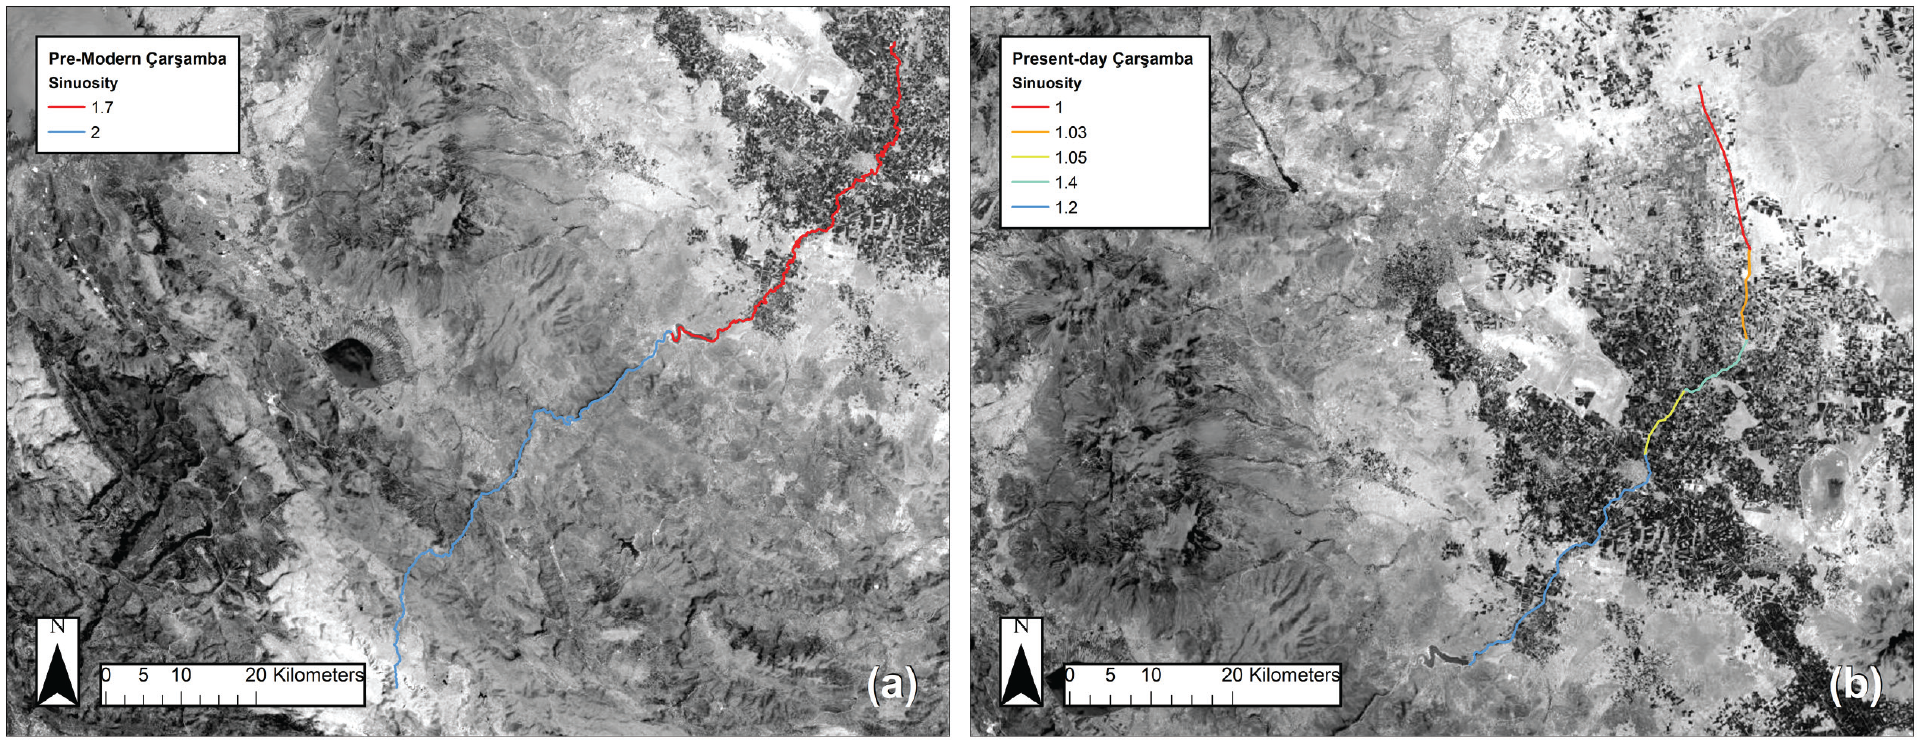
Sinuosity of the Çarşamba River for (a) pre-modern and (b) present-day network.
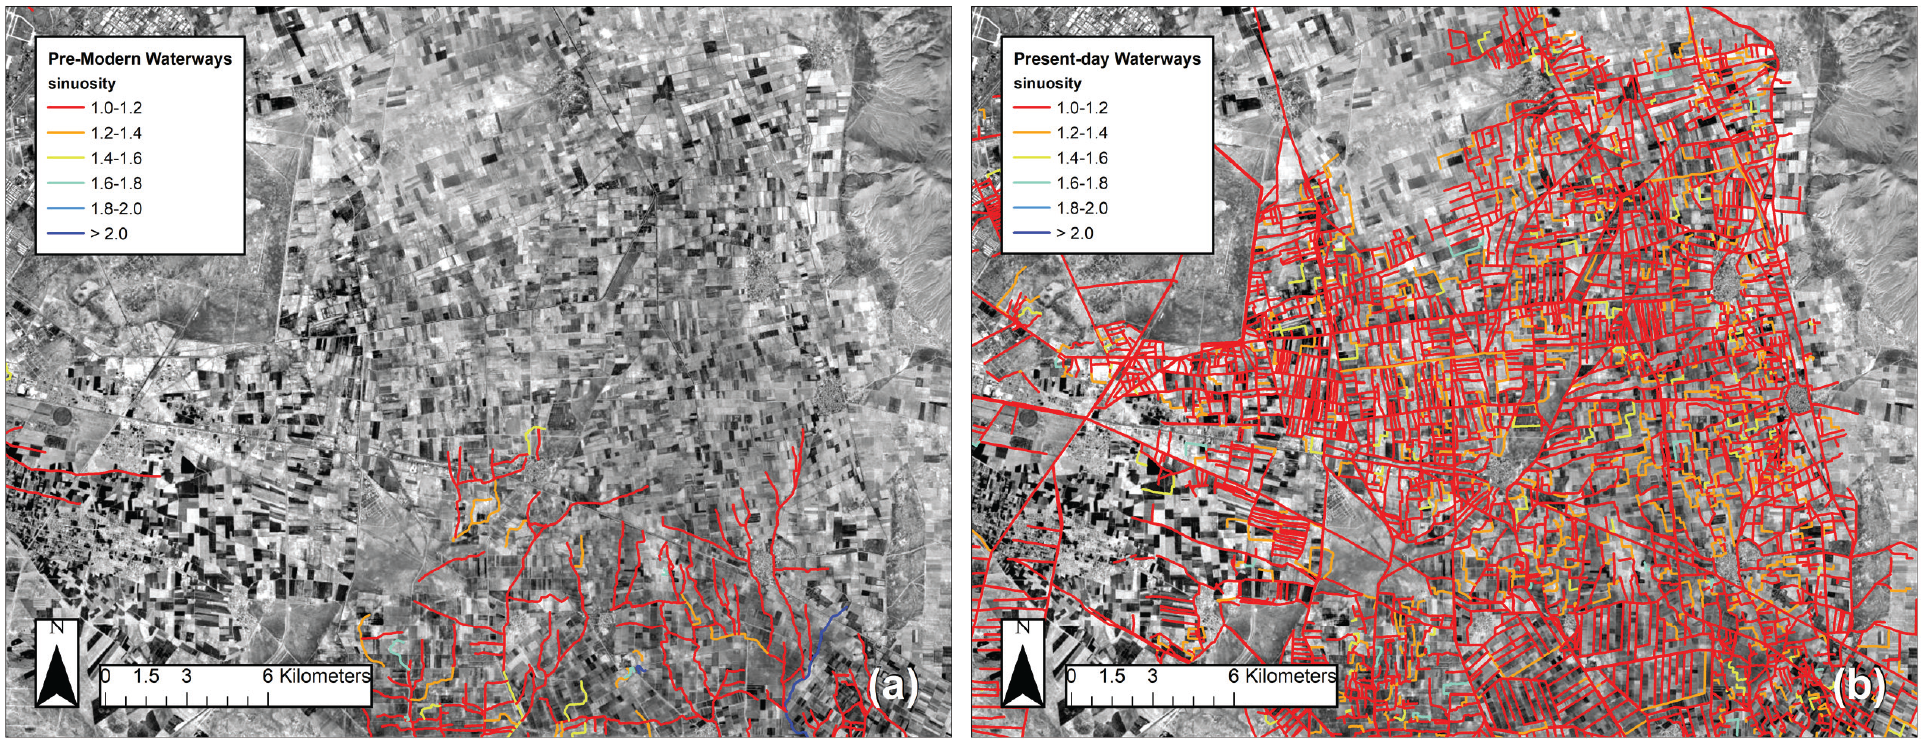
Sinuosity in the north of the distributary area for (a) pre-modern and (b) present-day network.
Sinuosity in the east of the distributary area for (a) pre-modern and (b) present-day network.
Sinuosity in the west and southwest of the distributary area for (a) pre-modern and (b) present-day network.
Conclusions
Our analysis of the irrigation network in the Konya Plain in Türkiye for two configurations, pre-modern and present-day, shows that using sinuosity to classify waterways may potentially replace a time-consuming manual classification, if categories are kept to the minimum value of two, that is, “canal” versus “channel,” and where the waterway network (in this study, the present-day network) is heavily modified and characterized by practically separate sinuosity ranges for “canals” and “natural channels.” The threshold sinuosity value for classification is generally expected to be specific to the area and period of interest, and therefore must be derived from observations in the study area, not literature (on the other hand, resulting similar sinuosity threshold values from different areas may potentially reveal analogies in canal construction or waterway modification techniques). The automatic classification demonstrated in this investigation should also be carried out exclusively in areas characterized by a relatively uniform topographic setting.
It is important to note that a sensibly digitized waterway network, where polylines are split appropriately to avoid considering natural and modified segments as a single feature, is a key starting point for the application of the automatic sinuosity-based classification. As mentioned, the waterway networks considered in this study, whether they were produced from scratch (pre-modern network) or provided by an external source (present-day network), were quality-controlled and edited to ensure this.
Where the distribution of sinuosity is wider and ranges overlap for different waterway types (in this case, in the pre-modern network), or where the categories considered for waterway classification are more than two, automatic sinuosity-based fuzzy classification may be used as a first step, to be then refined manually. This manual step will be important especially in identifying waterways where the degree of human intervention is minimal or where they have become inactive. Visual inspection of remote sensing data also means other features commonly associated with human-made channels, such as the remains of offtakes or other water management features (if visible), can be factored into the classification, using, for instance, machine learning approaches.
Our findings suggest that sinuosity can be used to characterize and help interpret how a network of waterways developed. Significant reduction in sinuosity (in space within a given network, or in time at a given location) indicates modification of the planform alignment and therefore maintenance and/or expansion of the irrigation system. In some cases, a sinuosity distribution heavily skewed toward low sinuosity values may also point to the existence itself of an irrigation system.
In the case of the Konya Plain, we found that sinuosity can be used to distinguish between newly constructed canals and those modified from older irrigation systems. Classifying by sinuosity can therefore potentially allow for identifying types of network planform layouts in an irrigation network in a time-efficient manner. Furthermore, sinuosity may be used to distinguish between systems of different phases, where networks have been built in the same area sequentially or are closely connected.
Superposition of sinuosity maps for different time periods allows for visually identifying areas of human-made waterway modifications as well as possibly supporting the dating of pre-modern digitized waterways. Such insights may be obtained when the quantitative information from the sinuosity metric is used in conjunction with interpretation based on the archeological and historical context. In the case of the Konya Plain, we have witnessed an irrigation network that is ever-changing and evolving, most evidently within the last century or so. The pre-modern network has become the underlying structure for the present-day network, showing how the system has expanded from the early palaeochannels through the Ottoman period and into the 20th century with the construction of the 1913 network. Furthermore, identifying the trends in decreasing sinuosity has not only pinpointed areas where the new has taken charge of the old, but also how the continual impact of human intervention can and will affect the characteristics of a landscape.
It could be of interest to test the methods presented in this study in other regions that have had a similar history of water management as the Konya Plain, such as agricultural landscapes in Syria or Turkmenistan. These regions have analogous environments and extensive irrigation networks that developed over long periods of time. Furthermore, they have been studied with regards to identifying and recording the pre-modern irrigation networks (see Cerasetti, 2001; Rayne, 2015). Datasets like these, which have already been collected and digitized, are valuable for using our proposed methods to understand and identify long-term trends and areas of landscape modification.
Footnotes
Acknowledgements
We thank the Harita Genel Müdürlüğü (HGM, General Directorate of Mapping in Türkiye) for providing the present-day digitized hydrological network for the Konya Plain.
Author contribution(s)
Funding
The author(s) disclosed receipt of the following financial support for the research, authorship, and/or publication of this article: This study was partially funded by the British Academy (project “Fragile Landscapes: Past, Present and Future of Sustainable Water Management on the Konya Plain, Turkey,” grant number TGC\200113) and by internal research funding from Northumbria University (Davide Motta’s previous institution).