
Abstract
This study aims to reconstruct the changes in storminess during the past 7600 years in the northeastern Baltic Sea region. For storminess reconstructions, aeolian sand influx (ASI) in coastal peat bog deposits was applied as an indicator of the past storminess. We analyzed cores from four peat bogs in the western and northern coastal areas of Estonia: the cores from Hiiumaa N, Hiiumaa SW, Saaremaa and Juminda study sites covered the past 3700, 3750, 2400, and 8400 years, respectively. The sediment chronologies were established using 36 14C dates. Image-analysis method (ImageJ) was used to count and measure the grain size of all sand particles at every centimeter to gain high-resolution ASI records. Although minor site-to-site variations exist, all four ASI records were in general consistent, suggesting that stormier periods occurred around 7300, 6600, 5900, 4600, 3600, 2900, 2400, 2100, and 1600 cal yr BP and over the last 1200 years. The results and comparisons with other storminess and climate studies indicate a shift in climatic conditions around 2500 cal yr BP when stormy periods became more frequent. The ASI values were also high during the last millennium, suggesting either higher storminess or more suitable transport mechanisms for sand into the coastal bogs: the niveo-aeolian transport mode could have been favored in winters, especially during the Little Ice Age, and human impact on landscapes has probably increased over the past centuries.
Introduction
Storm activity is an important factor in coastal evolution greatly affecting the resilience and stability of natural coastal environments and various aspects of human activity (Beniston and Stephenson, 2004). Coastal zones are one of the most densely populated yet most threatened areas on Earth in terms of future climate change. Hence, there is a need for a better understanding of various aspects of past, present and future storminess (Matulla et al., 2008). In order to generate accurate future predictions, it is essential to better understand how climatic conditions and coastal processes interact. Although instrumental records of meteorological parameters typically span a few centuries already, there is a need to extend those series. Using various proxies’ data (glacial, geomorphic, biological, archeological, etc.) and other kinds of indirect (e.g. written, painted) evidence, a wide range of global and regional climatic reconstructions have been generated (see e.g. for global overviews in IPCC (2021), and the Baltic regional overview in BACC (2015)). So far, minor attention has been given to paleostorminess (paleotempestology) in paleoclimatological reconstructions.
In Estonia, near-continuous sea level measurements at tide gauges were started in the 1840s, regular (instrumental) meteorological observations in the 1860s, and archived records for some weather parameters are available since 1200 CE (Tarand et al., 2013). Based on wind measurements, Jaagus and Suursaar (2013) and Orviku et al. (2003) have studied variations of storminess in Estonia over the instrumental era (roughly since the 1920s). Even then, the older records are typically less exact and merging material from different sources has caused inhomogeneities in the series (e.g. Suursaar et al., 2015). Attempts have been made to reconstruct or aggregate much older storminess data into one data set. There is a growing pool of such reconstructions and reviews for western Europe (Feser et al., 2015; Kylander et al., 2020; Olsen et al., 2012; Orme et al., 2015, 2016; Pouzet et al., 2018) and several studies from northern Norway by Nielsen et al. (2016a, 2016b, 2024). Geographically, the closest studies of past storminess to Estonia are from Sweden by Björck and Clemmensen (2004), de Jong et al. (2006), and Kylander et al. (2023). Yet the list of such studies for the eastern Baltic Sea region is rather limited so far. The available studies also vary in temporal coverage and archive type. For instance, the work on paleostorminess by Kalińska-Nartiša et al. (2018) from Latvian coastal lakes covers a period between 8500 and 4000 cal yr BP, and the study by Moskalewicz et al. (2020) from a coastal peatland in Poland covers just the last 1300 years. A study from the Estonian coastal bogs (Vandel et al., 2019) includes reconstructed storminess variations for the last 600 years. Based on the occurrence of higher ridge sets within the strandplains in the western Estonia, Suursaar et al. (2019, 2022) have derived some intervals of enhanced storminess within the past 5400 years. However, the comparison of results obtained by different methodologies and from different isolated locations is usually complicated and has yielded merely a satisfactory compatibility, at best (Suursaar et al., 2022). A larger number of independent studies are needed to assess and verify the results.
It is not reasonable to compare all the individual peaks from different studies using various proxies. As suggested also by Kylander et al. (2023), there are analytical and site-specific uncertainties along with spatial and temporal heterogeneity of the storms. Rather we should look at overall trends and larger stormy periods. We must take into account that the cyclones that originate from the North Atlantic Ocean reach the Baltic Sea in a somewhat dissipative state (Suursaar et al., 2018). The Estonian coast is generally less windy than for example, the westerly exposed shores of Scotland, Sweden, or Denmark and not all westerly storms present in those regions reach the eastern coast of the Baltic Sea.
Among the methods of paleotempestology, a quite ingenious way to study past storminess is to use peat deposits that act as a trap for sand particles, which are carried inland by winds from coastal areas. First proposed by Björck and Clemmensen (2004), the aeolian sand influx (ASI) was subsequently considered as a valuable indicator of past storminess (de Jong et al., 2006; Goslin et al., 2018; Orme et al., 2016). Vandel et al. (2019) verified the ASI methodology to be suitable for reconstructing past storminess in selected Estonian coastal locations by comparing high-resolution ASI data to wind speed based datasets of storms. The study demonstrated that there is a significant positive correlation between the number of storms and the ASI over the period from 1920 to 2015. The current study is aimed to extend this method (Vandel et al., 2019) at the same locations back to the past ~8000 years. As Estonia lies downwind of the main North Atlantic Oscillation (NAO) influence area, we can assume that major shifts in large-scale circulation patterns should be more or less concurrently recorded both in Estonian peat deposits and in other case study locations throughout northern Europe. To consider the influence of various regional and local climate forming factors, the storminess reconstructions from eastern Europe (Estonia) have to be compared with storminess records from other European regions.
This study aims to reconstruct changes in regional storminess regimes over the past 7600 years in the northeastern Baltic Sea region. The reconstruction is based on ASI records from four well-dated peat cores from coastal areas of Estonia. Doing this, the previously published records can be spatially expanded adding valuable information about climate forcing factors for future projections. We expect that these findings allow us to distinguish similarities, but also to discern some dissimilarities in past storminess compared to the reconstructions from other nearby (Scandinavian, North European) regions.
Study area
Four study sites (bogs) were selected along the Estonian coast (Figure 1), where loose sand on beaches and in nearby dunes is available. Three sites were selected from the west Estonian archipelago and one from Juminda Peninsula on the northern coast of mainland Estonia.
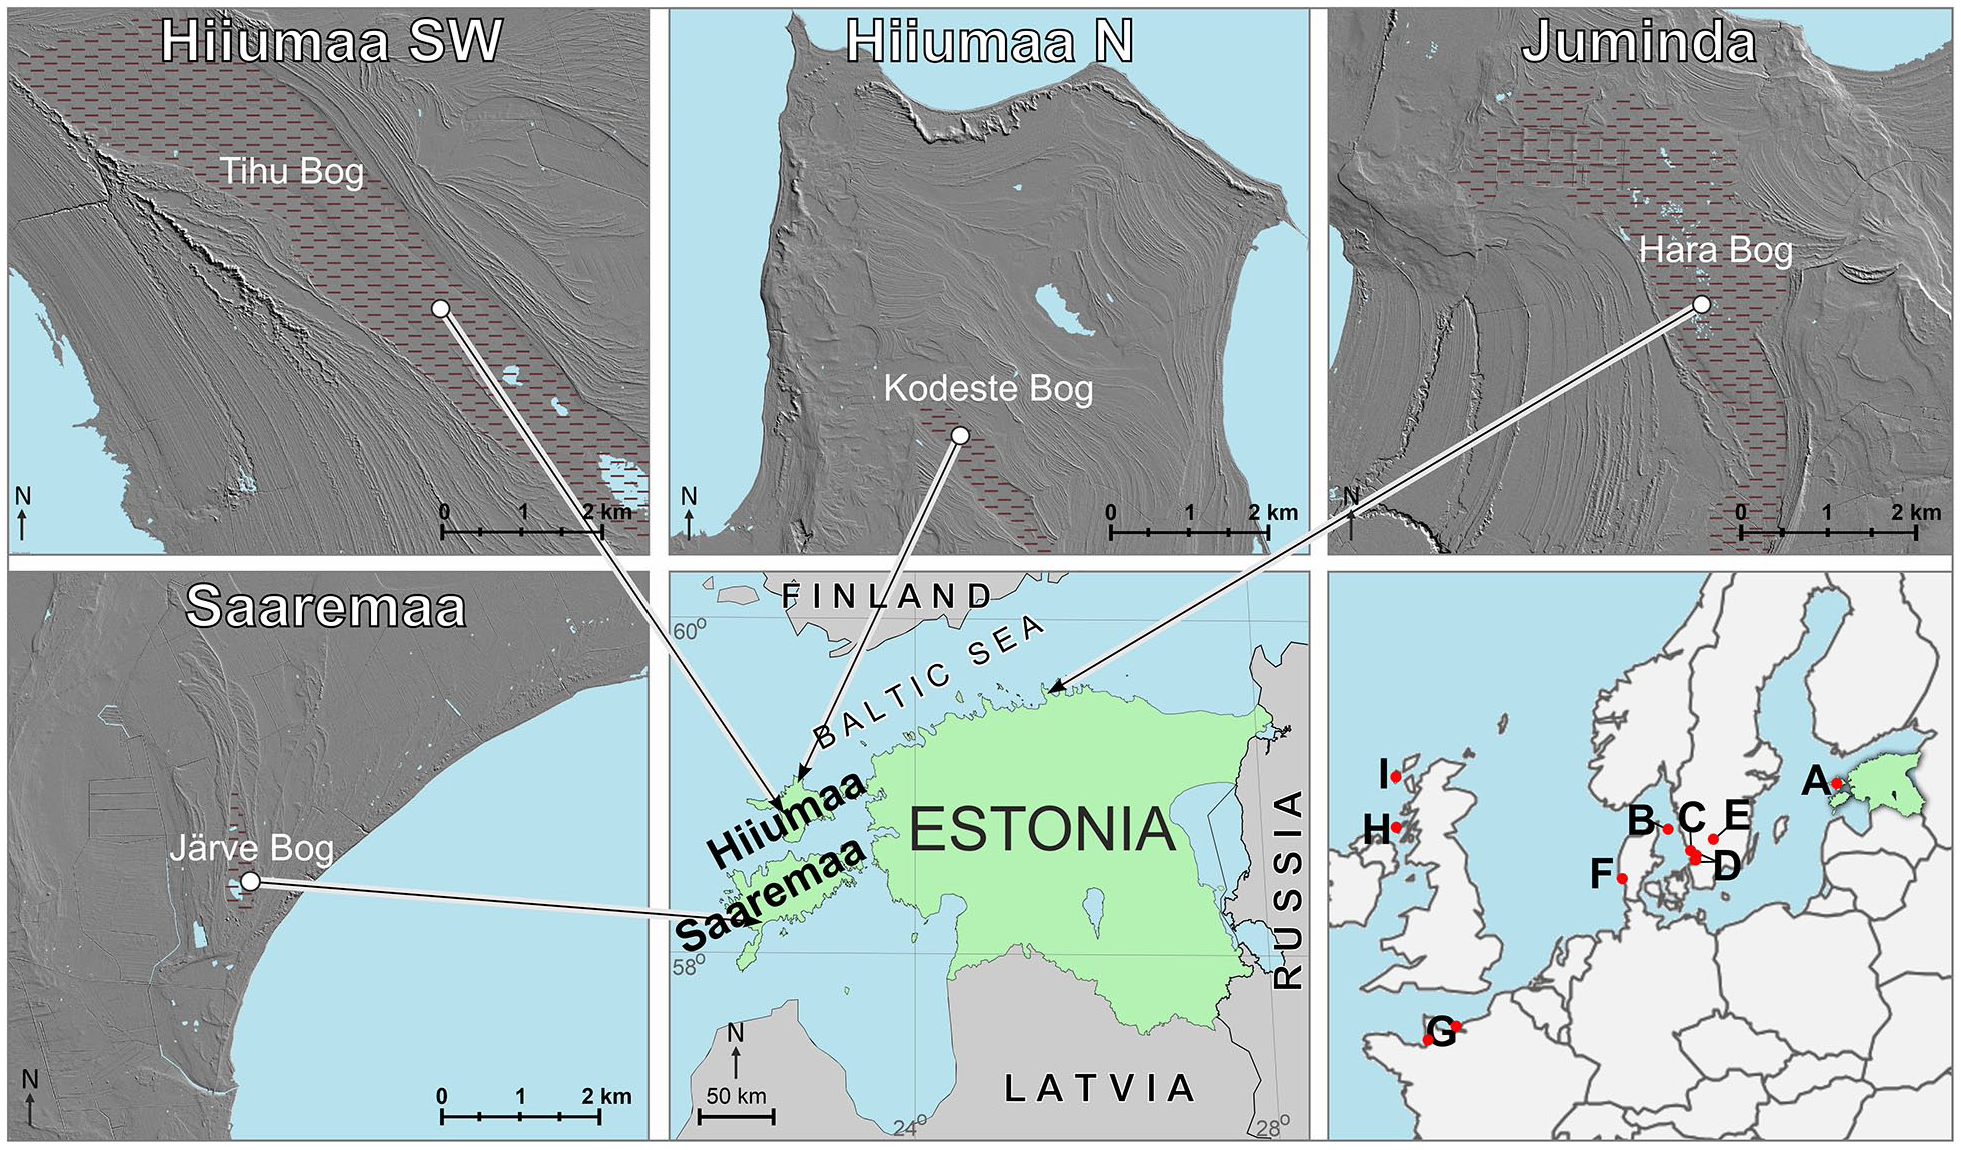
Location of Estonia and the coring points (white circles) in the study areas. Down right section shows the location of comparison records in Europe. (a) Island Hiiumaa, Estonia (Suursaar et al., 2022). (b) Island Læsø, Denmark (Hansen, 2017). (c) Undarsmosse bog, Sweden (de Jong et al., 2006). (d) Hyltemossen and Boarps mosse bogs, Sweden (Björck and Clemmensen, 2004). (e) Store mosse bog, Sweden (Kylander et al., 2023). (f) Filsø, Denmark (Goslin et al., 2018). (g) Northwestern France (Sorrel et al., 2012). (h) Laphroaig bog, Scotland (Kylander et al., 2020). (i) Outer Hebrides, Scotland (Orme et al., 2016).
After deglaciation of the Fennoscandian Ice Shield and due to glacial isostatic adjustment (GIA) related land uplift, all the study sites started to emerge from the sea, depending on location, about 10,000–4000 years ago (Saarse et al., 2010; Vassiljev et al., 2015). Relative sea level (RSL) has varied considerably through the Baltic Sea development stages, but has been falling at nearly an even rate since 7300 years ago. The uplift still continues with geocentric rates between 1 and 3.5 mm/yr in Estonia (Suursaar and Kall, 2018; Vestøl et al., 2019). Due to this uplift, the distance from the sea to the study sites has gradually increased since the formation of the bogs. However, the seashore is not the sole source of sand particles. The sampling locations were on strandplains, where sandy ridges usually form shore-parallel rows. Species-poor pine forests grow on podzols formed on these ridges and peat bogs with Scots pines (Pinus sylvestris) and some birches (Betula pubescens) occur in the swales in between.
Climatically, the study area is located in the westerlies zone of temperate latitudes, where maritime and continental weather patterns alternate (Kont et al., 2007). During the NAO+ phases, mild winters with high precipitation and strong winds prevail, and the NAO− phases bring along relatively cold and stable weather (Jaagus et al., 2008). In coastal areas, the vicinity of the Baltic Sea makes the local climatic conditions milder. Yet the climate is remarkably seasonal in Estonia. In the study sites of the islands (Hiiumaa and Saaremaa), the long-term (1991–2020) temperature normals are −1.5°C–0°C in winter, and 14°C–18°C in summer (EEA, 2024). On the Juminda Peninsula, the winter mean temperature is about −3°C and the summer temperature is around 16°C. The long-term mean annual precipitation amount is between 600 and 700 mm in Estonia and one-third falls as snow in winter (EEA, 2024). Coastal sediments, including sand, are usually frozen in winter. The mean snow cover duration in Saaremaa is 85, in Hiiumaa 95, and in Juminda 105 days (Jaagus and Kadaja, 2006). On average, the sea is covered by ice for 60–90 days in western Estonia and for 120–130 days in northern Estonia (in 1950/1951–2004/2005) (Sooäär and Jaagus, 2007). However, the trend is clearly decreasing both for snow and sea-ice (BACC, 2015). The prevailing wind direction is from the southwest. The mean annual wind speed on the coasts of Hiiumaa and Saaremaa is ~6 m/s and on the coast of northern Estonia (Juminda) 4.4 m/s. However, sustained wind speeds during extreme (westerly) storms may reach 25–30 m/s and gusts up to ~40 m/s in Estonia (EEA, 2024). The western coast is much stormier (~20 storm days/yr) than the northern coast (ca. 5 storm days/yr) (Jaagus and Suursaar, 2013; Tarand et al., 2013).
Hiiumaa N study site
The Hiiumaa northern (Hiiumaa N) study site is situated on Tahkuna Peninsula (Figure 1). The peninsula started to emerge from the sea during the regressive phase of the Littorina Sea ~5000 years ago (Vassiljev et al., 2015). The RSL lowering, mostly due to (geocentric) postglacial land uplift, has been ~3.4 mm/yr at the site over the period starting ~7300 years ago and ending with the onset of the industrial era around 1850–1900 (IPCC, 2021), when the global sea level rise gradually began to compensate for it (Suursaar et al., 2019). The Ordovician bedrock is overlain by Quaternary sediments, where the main deposits consist of marine sands that cover till and varved clay layers (Raukas et al., 1994). Sandy erosion-accumulation plains of marine origin have formed during the Littorina and Limnea stages (Hyvärinen et al., 1988). The area is covered by Scots pine forest. The predominant landforms are up to 10 m high dunes, ancient sandy ridges (mainly 1–2 m high), and paludified depressions between them. The Kodeste Bog is located in one such depression, where the coring site of the Hiiumaa N is situated (59°2′34.488″N and 22°37′34.846″E; Figure 1). Kodeste bog (68 ha and its maximum elevation is 15.5 m a.s.l.) is a Sphagnum dominated raised bog and is sparsely covered by low-growing Scots pines. The shortest distance from the coring point to the seashore is 2.7 km to the west, 4.3 km to the north, and 3.2 km to the east, but sandy terrain (though vegetated) occurs around the study site at shorter distances as well.
Hiiumaa SW study site
The area of Hiiumaa southwestern (Hiiumaa SW) study site (Figure 1) started to emerge from the sea during the regressive phase of the Littorina Sea ~5000 years ago (Vassiljev et al., 2015) and the postglacial land uplift has been ~3.2 mm/yr there (Suursaar et al., 2019). The Ordovician bedrock, consisting of argillaceous limestone, is covered by Littorina and Limnea Sea sediments. The terrain includes about 100 shore-parallel sandy ridges, which are up to 2 m high in the eastern section of the strandplain and mostly 0.2–0.5 m in the seaward part (Suursaar et al., 2022). Most of the old coastal landforms are covered with boreal heath forest but in moist areas the vegetation is characterized by paludified pine forest. Sandy ridge-dune complexes dominate over humid ridge-hollow complexes. Near the coring site, there are Tihu relict lakes, whose areas have been gradually decreased due to swamping and artificial lowering of the water level by 1 m in the 1930s (Mäemets, 1977; Sepp, 1974). The coring site is situated in the Tihu Bog (58°52′28.920″N and 22°30′40.320″E; Figure 1). The bog (1200 ha; maximum height 17 m a.s.l.) is a Sphagnum dominated raised bog and is sparsely covered by low-growing Scots pines. The shortest distance from the coring point to the seashore is 4.6 km to the west. Nowadays, the till shore is not a sand source anymore, but rather a strandplain with ridges between the sea and the study site, where sand lies beneath a sparse plant cover.
Saaremaa study site
The Saaremaa study site is situated on the southern coast of Saaremaa Island (Figure 1). The area started to emerge from the sea ~4000 years ago (Poska and Saarse, 2002) and the postglacial land uplift rate has been ~2.3 mm/yr (Suursaar and Kall, 2018). The upper Silurian bedrock, consisting of argillaceous limestone, dolostone, and marl, is covered by Quaternary sediments mostly represented by marine sediments from Littorina and Limnea Sea stages. The coast, south of the study site, is a typical sandy beach with backing dunes (Orviku et al., 2003). The beach in front of the dunes (up to 5.8 m a.s.l.) is 20–30 m wide and 8 km long (Orviku et al., 2003; Rivis et al., 2016). Toward inland, the predominant landforms are ancient spits (mainly 1–2 m high), which are sporadically covered with younger foredunes. Boreal heath forest characterizes the vegetation cover. The coring site is situated in Järve Bog (58°11′26.371″N and 22°15′23.010″E; Figure 1) which is a remnant from a former lagoon. The coring site is close (20 m) to the Järve Lake (6 m a.s.l., surface ~3.4 ha and max depth of 2 m) with peaty shores (Mäemets, 1977) which occupies the depression. Nowadays, the Järve Bog (36 ha; 7 m a.s.l.) is a forested bog where Scots pine dominates. The shortest distance from the coring point to the seashore is 0.7 km to the south-east, but the area was also exposed to the south-west and south, when a barrier spit emerged and grew about 4000–2500 years ago. Since ~2500 years ago, the SW-exposure was closed up by emerging new land in that direction.
Juminda study site
The Juminda study site is situated on Juminda Peninsula in northern Estonia (Figure 1). The peninsula started to emerge from the sea shortly after deglaciation during the Ancylus Lake stage ~10,300 years ago (Saarse et al., 2010). The postglacial land uplift rate has been ~2.7 mm/yr between 7300 BP and CE 1850, but before ~7300, there were some considerable water level variations as transgressive and regressive phases altered (e.g. Rosentau et al., 2013; Saarse et al., 2010). At the study site, the Cambrian bedrock, consisting of sandstones and clays, is covered by Quaternary sediments. The Quaternary cover is represented by till and varved clay, overlain by sand. The material for modern landforms (a number of ridge systems, spits, scarps and terraces) was derived from the eroded glacial formations, accumulated and reshaped by earlier transgressive-regressive phases of the Baltic Sea (Saarse and Vassiljev, 2010) and the ancient ridges have been reworked by wind, and dune-landscapes can be found in the western and southern parts of the peninsula (Linkrus, 1976; Saarse et al., 2010). The ridges and dry plains are covered with boreal heath forest but paludified pine forest is characteristic of the moist swales in between the ridges. The coring site is situated in the middle of the Hara Bog (59°32′24.745″N and 25°37′46.909″E; Figure 1). Hara Bog (747 ha, maximum elevation up to 31 m a.s.l.) is bordered by the above-mentioned beach formations. It is a Sphagnum dominated bog with a sparse cover of low-growing Scots pines. The shortest distances from the coring point to the seashore are 3.0 km to the north-east and 4.2 km to the west, but loose sand can be found at any direction.
Methods
Sampling
In order to identify the deepest part of each peat deposit for coring we applied ground-penetrating radar (GPR; type GSSI SIR-3000 with 270 MHz antenna). Peat cores were collected with a 1 m long Belarus (Russian) peat corer (7.5 cm in diameter) in the summer of 2014. Parallel cores from two very close points were extracted in order to overlap the transitions between 1 m long primary cores (parallel coring was done with 50 cm overlap: the primary core started from the surface and the parallel core started 50 cm from the surface) to get full undisturbed and uncontaminated stratigraphic sequences. A core of 170 cm in length (165 cm of organic rich deposit) was obtained from the Hiiumaa N site; 330 cm (313 cm of organic rich deposit) from the Hiiumaa SW; 135 cm (125 cm of organic rich deposit) from the Saaremaa, and 465 cm (450 cm of organic rich deposit) from the Juminda study site. The cores were described and photographed in the field and packed into bisected PVC tubes. The cores were subsampled into 1 cm thick slices in the laboratory and samples were stored in a cold room (+4°C) until further analysis.
Lithological composition
The composition of organic and mineral matter was determined by ashing the dried (at 105°C) samples at 550°C (Heiri et al., 2001) to a constant weight with a thermogravimetric analyzer (Precisa prepASH 340 Series). Approximately 5 cm3 of the sample was used per centimeter. The loss on ignition at 550°C was considered as the content of organic matter, and the residue as mineral matter.
Chronology
Using an accelerator mass spectrometry (AMS), the chronologies of cores were determined by 36 14C datings of terrestrial plant macro-remains (Table 1). All the dates were obtained at Poznan Radiocarbon Laboratory, Poland. The dates were converted to calendar years using the IntCal13 calibration curve (Reimer et al., 2013) with Bacon ver. 2.3.5 software (Blaauw and Christen, 2011).
Radiocarbon datings from cores of four studied bogs: depth of dated layers, description of dated material, 14C and calibrated ages.

ASI analysis
As the mineral matter concentration in the peat deposits was very low, an image analysis method was applied for the grain-size analysis (Vandel et al., 2020). The grain-size analysis was done for every centimeter, making up a total of 1000 samples. The residue (ash) of the ignition at 550°C was used for the grain-size analysis. The ash was set on the 65 µm mesh, dissolved with 10% HCl to remove carbonates, and was cleansed with distilled water afterward (Konert and Vandenberghe, 1997). To remove diatoms and cleanse the samples, 10% KOH was used (Vaasma, 2008). After rinsing with distilled water, the sample was dried at 45°C. After pretreatment, the mineral grains were collected on a microscope glass and photographed using a polarized microscope (Leica DM75OP) and Olympus SC100 digital microscope camera. Photos were processed in the way that every single grain was quantifiable using the ImageJ image processing software (Schneider et al., 2012). All grains were counted and measured automatically resulting in the data of area, circumference, diameter etc. for each counted grain. The measured mineral grains were between 65 µm (the mesh size used in the chemical treatment of the samples) to 2000 µm in size. The sampling, pretreatment of the samples, and details of image analysis are described in more detail in a methodological article by Vandel et al. (2020).
The concentration of sand grains in 1 cm3 of the sample (grains per cm3) was calculated based on the volume of the analyzed bulk sample and the number of counted grains. The aeolian sand influx (ASI) as grains/cm2/yr was calculated based on the concentration of sand grains (counted grains/cm3) and accumulation rates of the sampled cores. Accumulation rates (mm/yr) acquired from an age-depth model were calculated with Bacon ver. 2.3.5 software (Blaauw and Christen, 2011).
The lowermost (oldest) grain concentration (i.e. potentially ASI) values in a sequence could have been influenced, aside from aeolian contribution, also by some other grain influx mechanism, for example, overwash (Vandel et al., 2019). As far as meteorologically induced sea level variations in the Baltic Sea can reach several meters, the transport of sand particles with slightly different grain-size distribution patterns could have occurred after the emergence of the study sites from the sea. To compare the grain-size distribution patterns of each sample with every other sample, and to decide whether the samples are from the same population, two sample Kolmogorov-Smirnov test (K-S test) was used. The K-S test is a nonparametric test of the equality of continuous, one-dimensional probability distributions (Davis, 2002). For the test, the median diameter of mineral grains and the size distribution of mineral grains were used. Analysis was established for each core separately.
For the selection of stormy periods and comparing the obtained ASI curves with other storminess records and climatological proxies, the ASI sequences were also presented in a smoothed, logarithmic way. The initial descriptive statistics (e.g. Vandel et al., 2019) showed that the range of ASI values within each sequence was about three orders of a magnitude, and averages and maxima differed between the study sites by ca. 10-fold. Clearly, such a large spread originates from local (lithological, geographical, etc.) conditions, as well as from peculiarities of the ASI method. However, long-term variations in “storminess” proxies occur (and are usually presented) in a relatively narrow variability range. Therefore, for comparison purposes, the ASI time series were smoothed with 200 (±100) year moving average, and the curves were presented in a logarithmic scale (after the zeros were substituted with very low values, 0.01). This procedure ensured that we were able to compare the temporal sequences of storminess periods, not their numerical ASI-manifestations at various sites.
Spearman’s rank-order correlation was used to identify possible relationships between the ASI values of different cores. For equalizing the proportion of lower ASI values, the square root was taken prior in calculating the correlations. To minimize possible temporal discrepancies between the age-depth models of different cores, a 50-year interval of the ASI values were used.
Results
Radiocarbon datings
The age of the deepest peat deposit sample in Hiiumaa N is ~3700 cal yr BP (from 162 to 165 cm layer); ~3750 cal yr BP (301–303 cm) in Hiiumaa SW, ~2400 cal yr BP (116–118 cm) in Saaremaa, and ~8400 cal yr BP (463–464 cm) in Juminda (Figure 2 and Table 1) cores. According to the age depth curves (Figure 2), the accumulation rate of the deposits has been quite stable in all the study areas. In Hiiumaa N and Saaremaa the accumulation rates are slightly higher during the first 500 years of the peat deposition. During the first 4000 years, small fluctuations in the accumulation rate occur in Juminda.
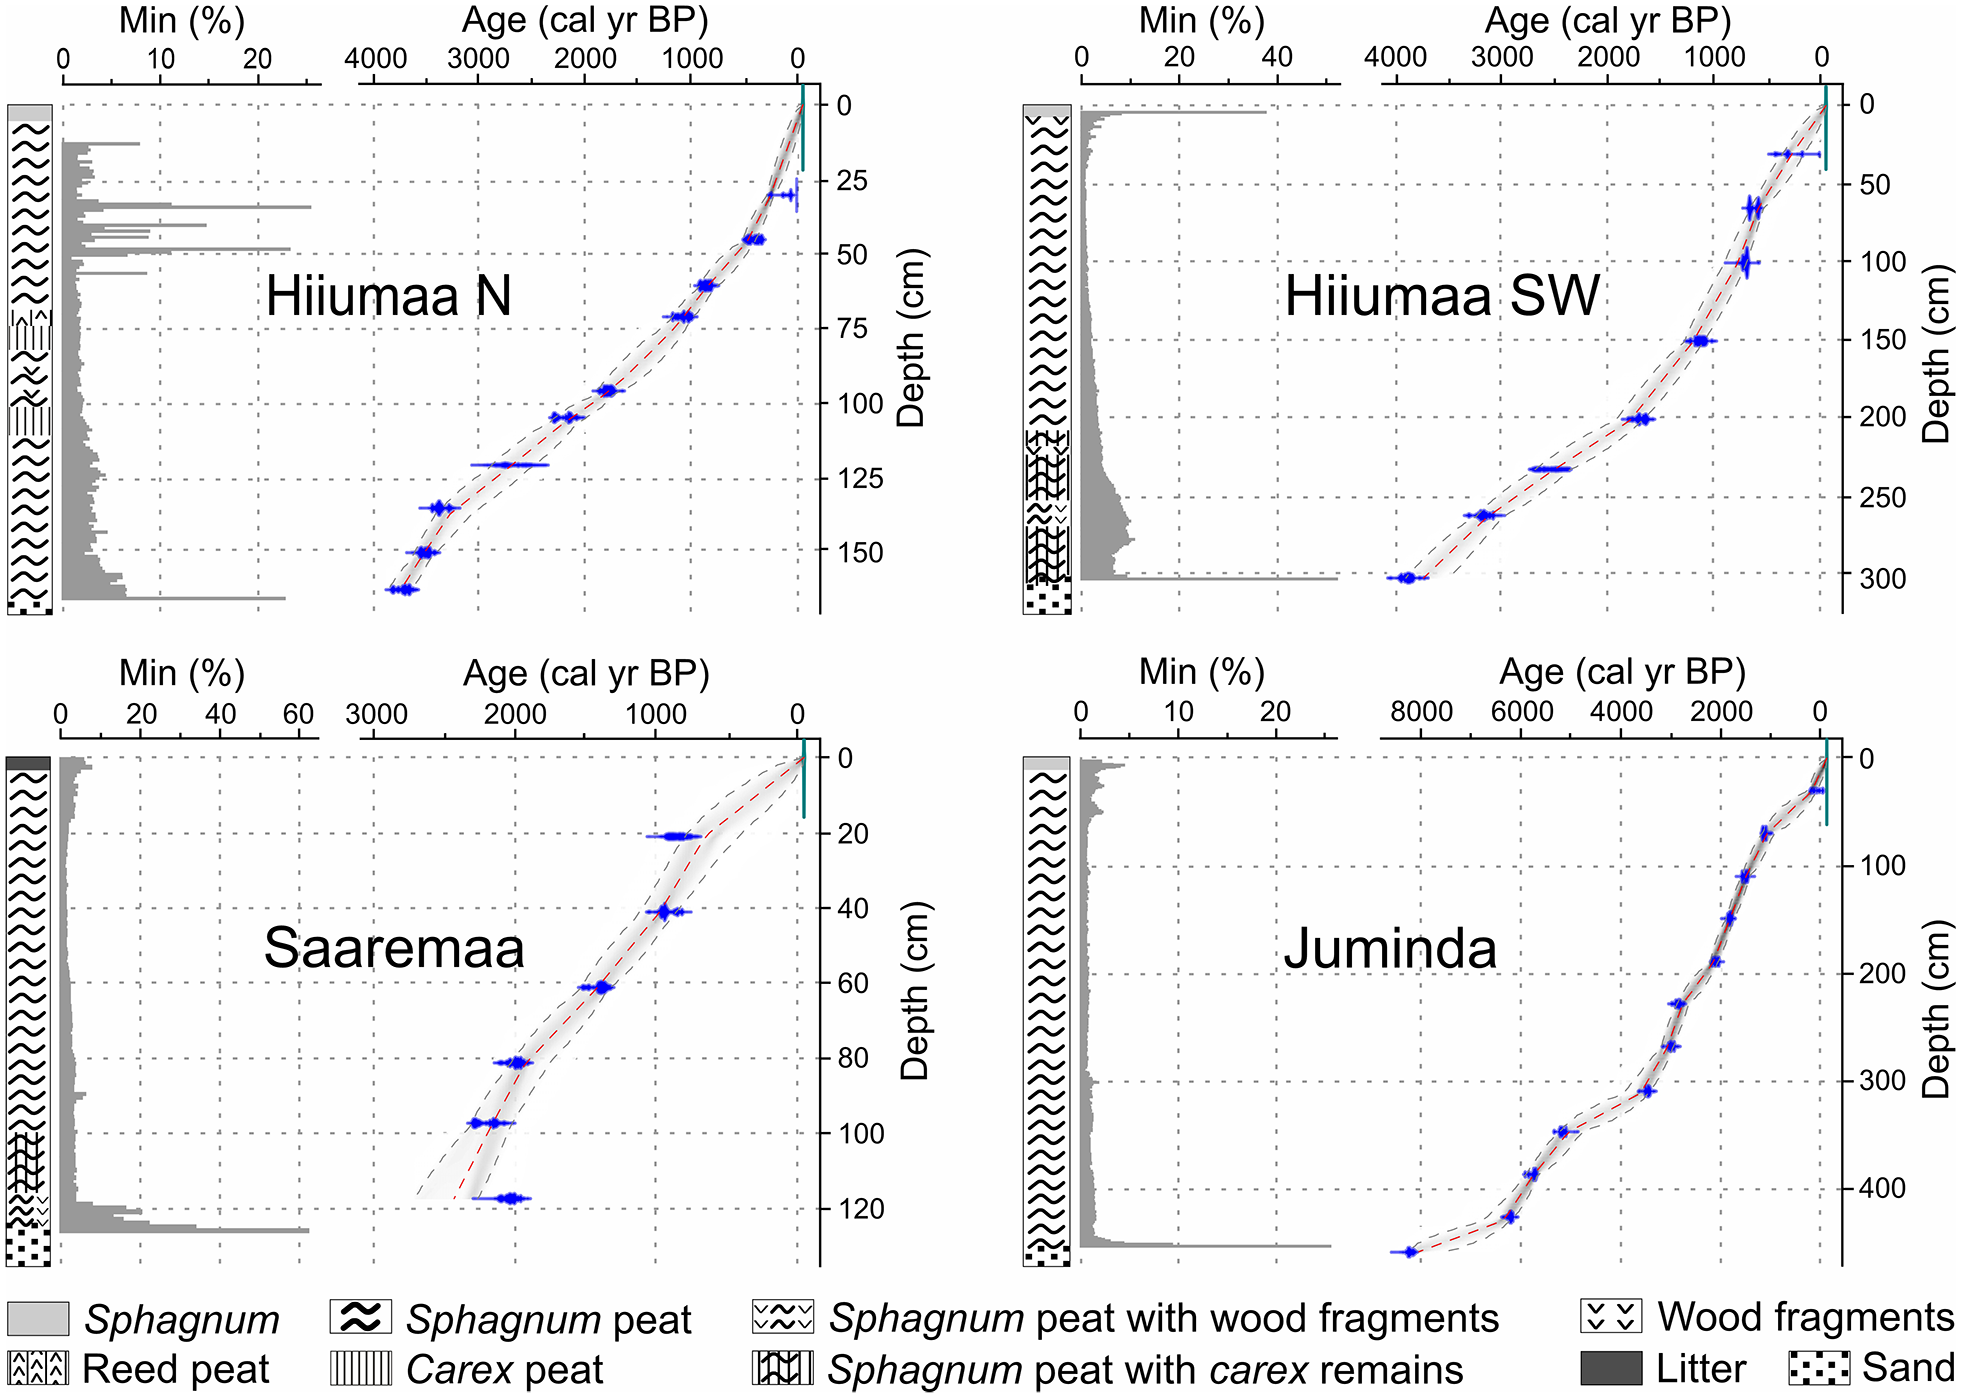
Stratigraphy, mineral matter percentages (Min %) and Bacon-based age-depth models for four studied cores. Age-depth models are based on AMS 14C dates given in Table 1. On the age depth model graphs gray dashed lines represent 95% confidence intervals, red curves the “single best model based on the mean age for each depth,” blue indicates the probability distribution function of estimated age for the individual calibrated 14C dates, and shadowed gray areas show “more-likely calendar ages” (Blaauw and Christen, 2011).
Lithological composition
The high mineral matter percentages in the bottom layers of cores (Figure 2) represent the periods when the bogs started to form. All four studied bogs were formed on sandy substrate and the deposited material consisted mainly of Sphagnum peat. Reed and Carex peat layers with some wood particles can be found in the middle of the Hiiumaa N core. From the bottom up to 200 cm (2000 cal yrs BP), the Hiiumaa SW core consists of Sphagnum peat with Carex remains. The bottom organic layer of the Saaremaa core consists of Sphagnum peat with wood particles on which a layer of Sphagnum peat with Carex remains lay (118–100 cm: until 2200 cal yr BP). The core from Juminda consists only of Sphagnum peat.
The mineral matter percentages in all four cores have similar tendencies: high mineral matter content in the bottom of the cores is followed by lower values (Figure 2). In the Hiiumaa cores, the decrease in mineral matter content is gradual, reaching the lowest values around 800 cal yr BP (from the bottom up to 60 cm) in the Hiiumaa N (1.3%) and around 500 cal yr BP (from the bottom up to 50 cm) in the Hiiumaa SW (0.5%). In Saaremaa and Juminda cores, the drop in mineral matter content is more abrupt and the values are low (2.7% on average in Saaremaa and 0.8% on average in Juminda) until 1000 cal yrs BP (depth in Saaremaa 40 cm and in Juminda 60 cm). During the last 1000 years, the mineral matter contents increase in every core, reaching maximum values of up to 37.6% in the uppermost layer of the Hiiumaa SW core, 25.3% (300 cal yr BP: in the depth of 35 cm) in the Hiiumaa N, 7.7% (35 cal yr BP: in the depth of 3 cm) in the Saaremaa, and 4.4% (560 cal yr BP: in the depth of 11 cm) in the Juminda cores.
Sand grain distribution and the ASI
Early in bog formation, sand grain sedimentation near the shoreline might have been influenced by floods and catchment area erosion in addition to aeolian activity. The aim of the K-S test was to distinguish differences in grain-size distributions that may reflect different sediment transport mechanisms into the lowermost layers of the bogs. Indeed, the results of the K-S test (Figure 3) from Hiiumaa SW and Saaremaa sites demonstrate that the grain-size distribution from the lowermost layers (periods between 3700 and 3600 and 2400–2250 cal yr BP, respectively) differ from the rest of the core. This may indicate that the deposited sand grains were not transported to these sites by wind during the initial bog formation stages. Hence these two periods are excluded from further analysis. All other peaks of sand influx are considered to be signals of aeolian activity.
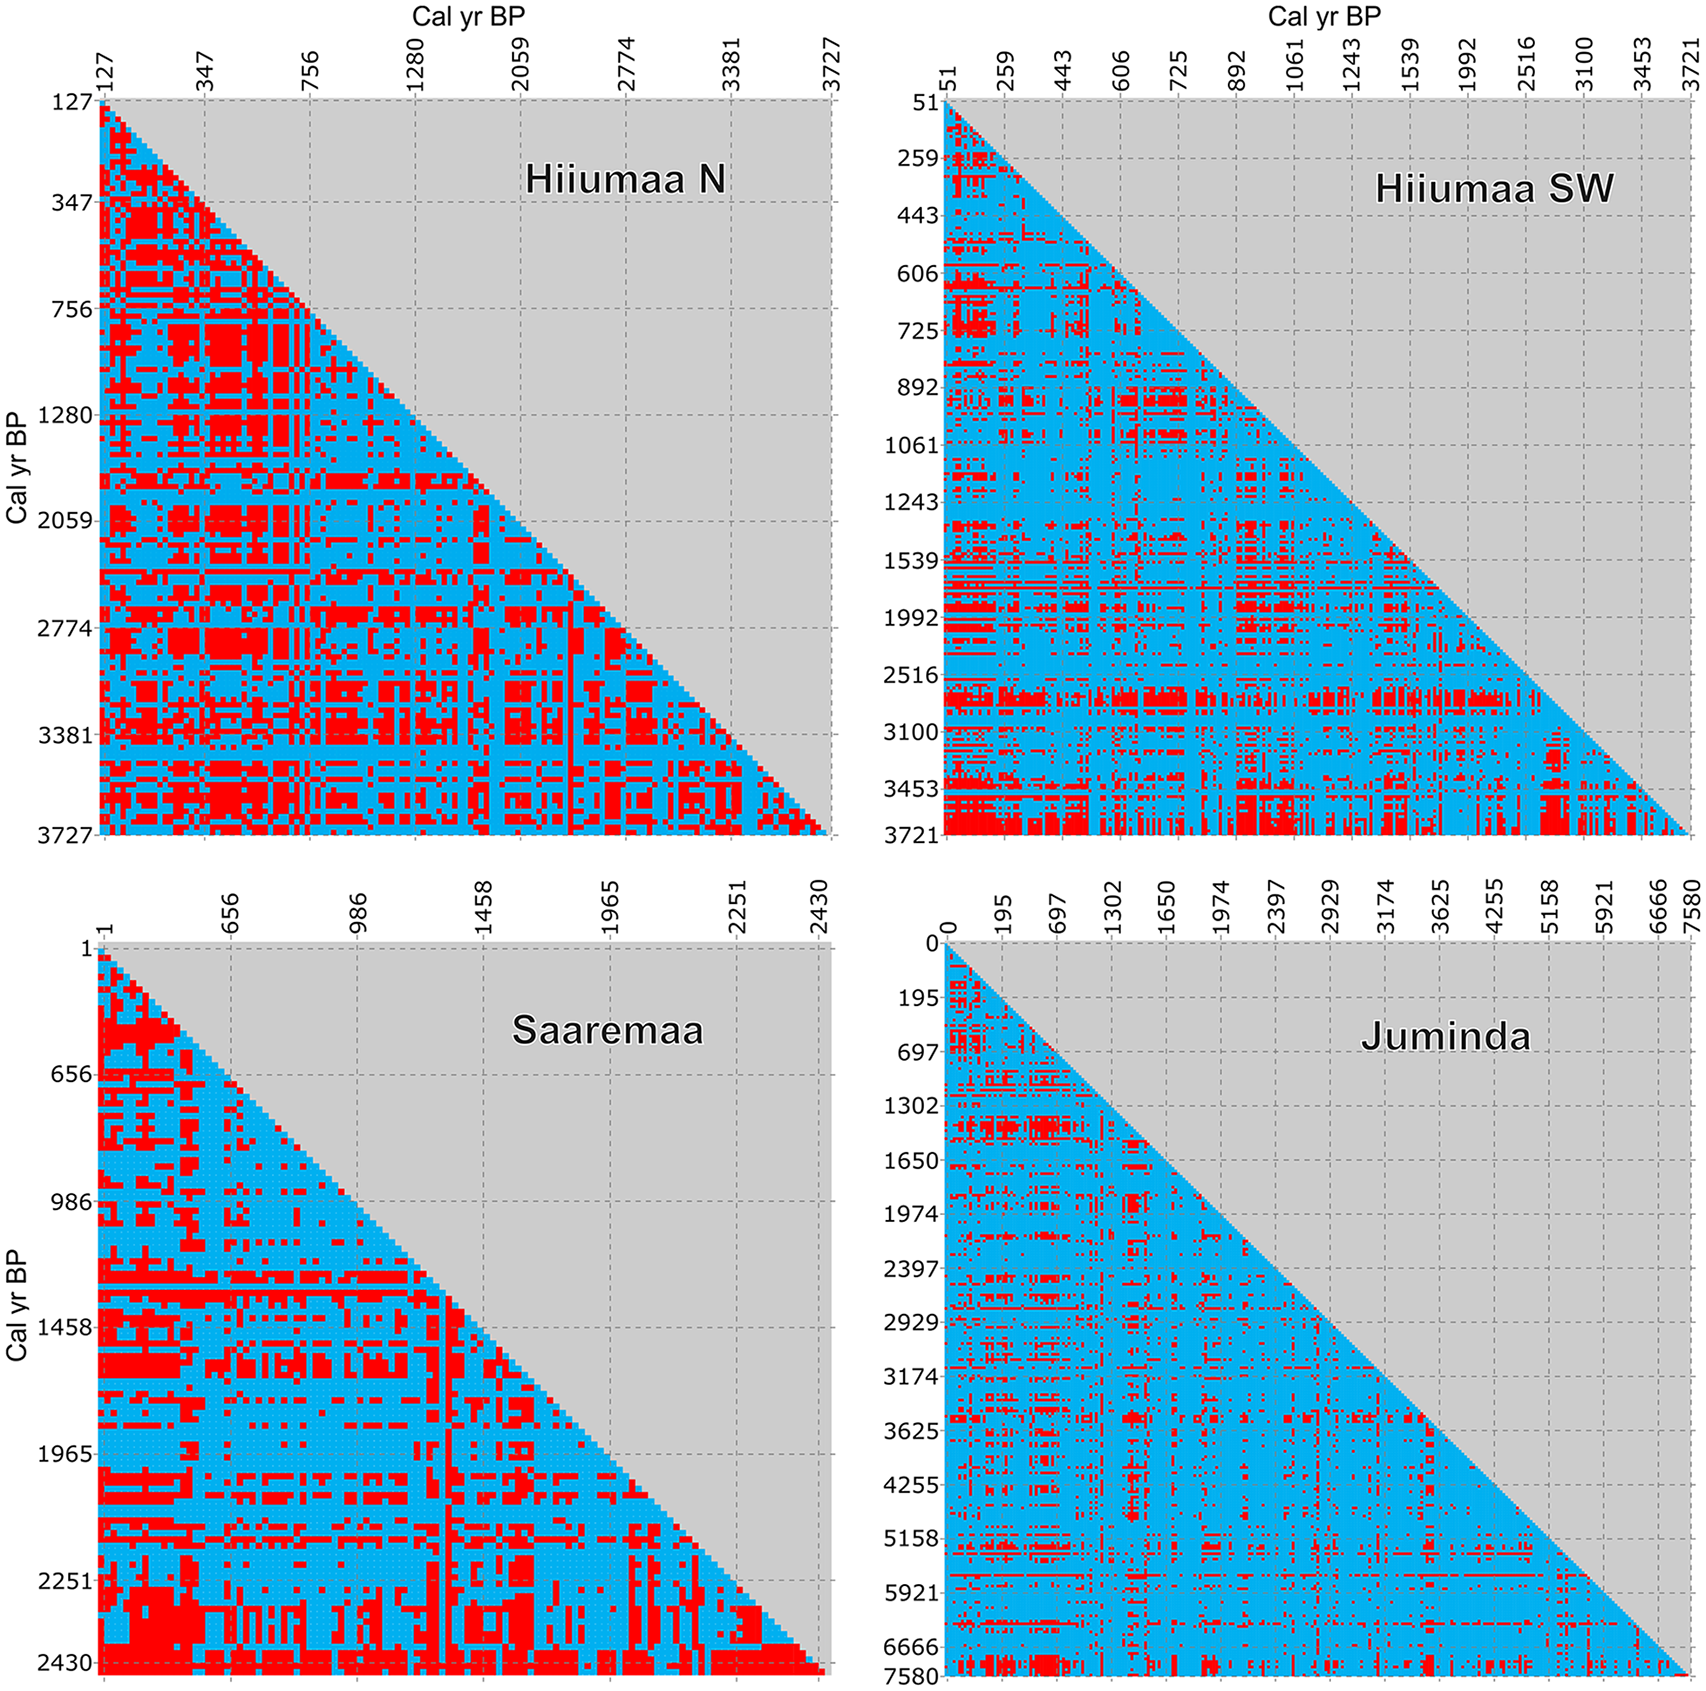
Results of the two sample Kolmogorov-Smirnov test (K-S test). The matrix of the K-S test compares the grain-size distribution of each sample with every other sample in the core. Statistically similar (p-values higher than 0.05) samples in grain-size distribution are shown by blue color and the samples that differ (p-values less than 0.05) from each other are shown by red color.
Medium sand (>250 µm) dominates in the Hiiumaa N peat deposit. The concentration of sand is higher in the bottom layers (until 3600 cal yr BP) and between the depths 145 and 115 cm (3400–2450 cal yr BP), and in the top 60–20 cm (800–140 cal yr BP) (Figure 4). The ASI records start (3700–3300 cal yr BP; 165–140 cm) with high values (up to 6.1 grains/cm2/yr; Figure 5). Afterward, the overall influx is low until 800 cal yrs BP (60 cm) with short periods of slightly higher ASI between 3000 and 2700, around 2450, 2100, 1500, and 1100–900 cal yr BP (depths respectively 130–122, 112, 105, 88, and 74–65 cm). Last 800 years (upper 60 cm) include the highest ASI values (up to 45 and 7.2 grains/cm2/yr on average). The average ASI value in the Hiiumaa N core is 1.6 grains/cm2/yr.

The number of counted sand grains and median grain-size values in four studied cores by every centimeter. Gray rectangles in Hiiumaa SW and Saaremaa graphs represent non-aeolian sand grains according to the K-S test.
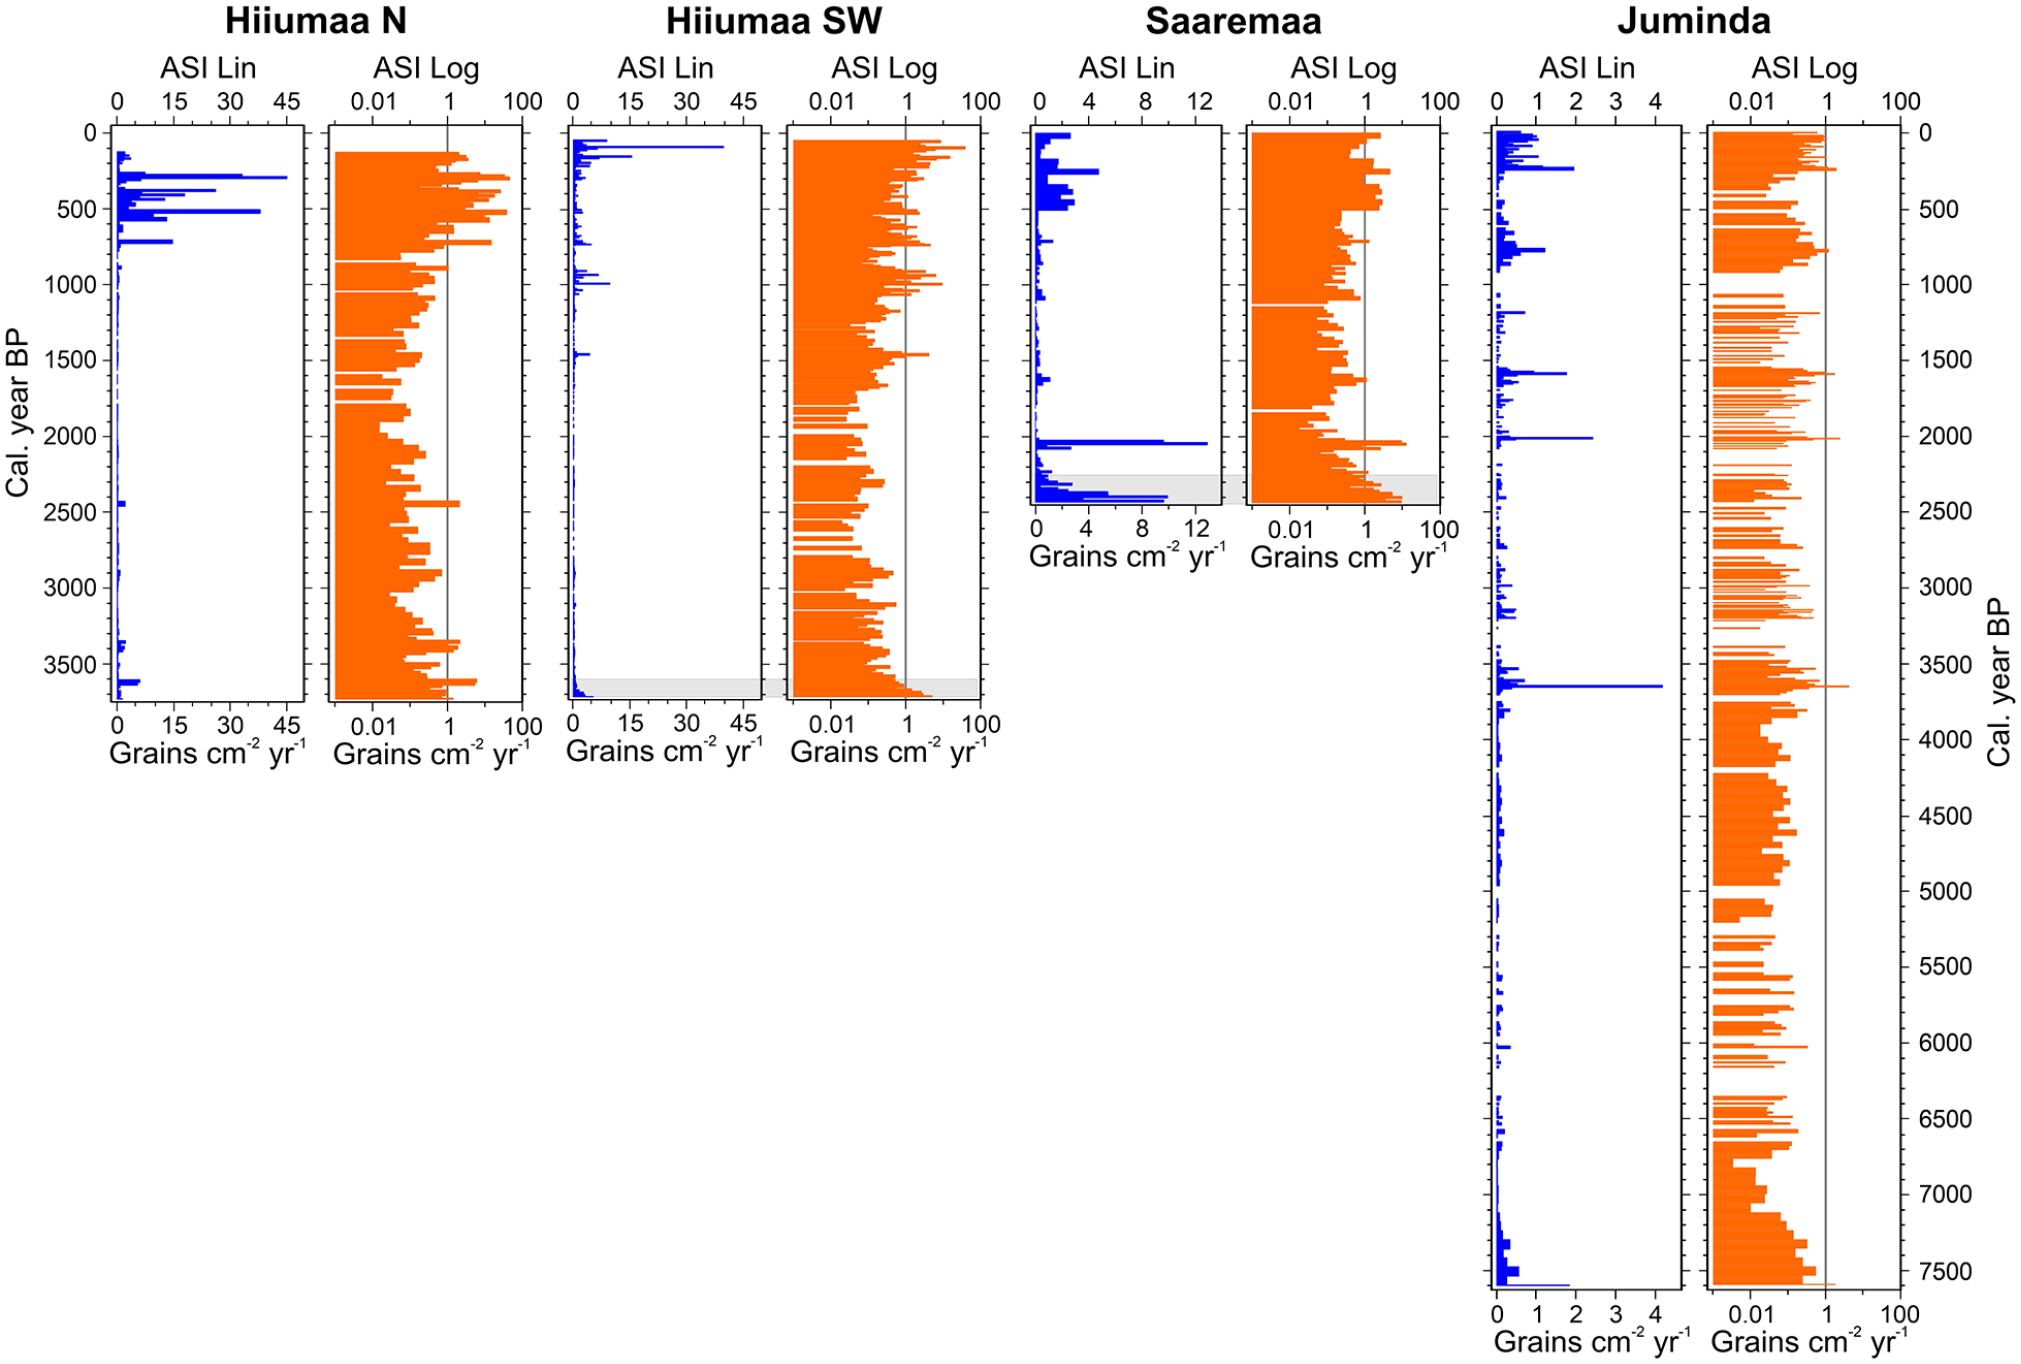
Aeolian sand influx (ASI; grains/cm2/yr) represented on linear scale (ASI Lin) and on logarithmic scale (ASI Log) to highlight lower values. Gray rectangles in Hiiumaa SW and Saaremaa graphs represent non-aeolian sand grains according to the K-S test.
Fine sand (<250 µm) dominates in the Hiiumaa SW peat deposit. The concentration of sand (Figure 4) is higher in the bottom layers (until 3500 cal yr BP) and has several lower peaks up to around the depth of 175 cm (1500 cal yr BP). After that higher concentrations occur more frequently: around the depths 135–115, 95, and the last 60 cm (ages respectively 1060–900, 740, and since 550 cal yr BP). Some layers with no grains can be found throughout the core but mainly around the depths between 250–230, 220–180, and 170–150 cm (ages respectively 2850–2450, 2220–1550, and 1400–1250 cal yr BP). The ASI has slightly higher values (up to 0.5 grains/cm2/yr) around 3500, 3100, 2900, 2300, and 1650 cal yr BP (depths respectively 290, 260, 250, 225, and 190 cm) (Figure 5). Afterward, in 1500 cal yr BP (177 cm), much higher ASI occurs. Since 1100 cal yr BP (from 140 cm), the ASI starts to increase, having only very short periods with low values (e.g. between 900 and 800 cal yr BP: 115–105 cm). The last 750 years (upper 95 cm) have relatively high ASI (2.3 grains/cm2/yr on average) with several peaks (maximum value of 39 grains/cm2/yr). The average ASI value in the Hiiumaa SW core is 0.6 grains/cm2/yr.
Fine sand (<250 µm) dominates in the Saaremaa peat deposit. The concentration of sand is higher in the bottom layers (until 2200 cal yr BP) and around the depths of 90, 70, 50, and in the last 20 cm (ages respectively 2050, 1640, 1160, and from 600 cal yr BP) (Figure 4). The ASI records start (2400–2000 cal yr BP: from the bottom up to 85 cm) with maximum values of up to 12.9 grains/cm2/yr and about 2.3 grains/cm2/yr on average (Figure 5). The K-S test (Figure 3) reveals that the grain-size distribution for the period before 2300 (from the bottom up to 108 cm), and especially before 2400 cal yr BP is different from the rest of the core. Also, the median grain size is much coarser (Figure 4). The ASI values are reliable starting from 2250 cal yr BP (105 cm). Afterward, the influx drops abruptly to less than 1 grain/cm2/yr with a peak around 1600 cal yr BP (70 cm). Since 1100 cal yr BP, high ASI peaks are more frequent: in 1100–1000 and 900–700 cal yr BP, and during the last 500 years (depths respectively 47–43, 37–25, and upper 15 cm). The average ASI value in the Saaremaa core is 0.9 grains/cm2/yr.
Fine sand (<250 µm) dominates in the Juminda peat deposit. The concentration of sand is higher in the bottom layers (until 3600 cal yr BP) and around the depths of 305, 160, 110, and above 60 cm (ages respectively 3660, 2010, and since 900 cal yr BP). Several layers with no grains are found throughout the core (Figure 4). The Juminda core has the lowest overall ASI values among the four studied cores: maximum of 4.2 and 0.1 grains/cm2/yr on average (Figure 5). The average ASI value is low also due to the high number of samples without counted grains (168 samples out of 445). At the bottom of the Juminda core, relatively high ASI values exist around 7500 (0.5 grains/cm2/yr; at depth 450 cm) and 7300 cal yr BP (0.3 grains/cm2/yr; at depth 445 cm). Afterward, the ASI is very low until 3650 cal yr BP (303 cm) with some minor ASI peaks around 6600, 6000, 4600, and 3800 cal yr BP (depths respectively 433, 392, 334, and 314 cm). Since 3650 cal yr BP, the ASI peaks occur around 3650, 3500, 3200–3100, 2000, 1750–1550, 1200, and 850–650 cal yr BP (depths respectively 303, 294, 266–259, 159, 130–106, 72, and 57–47 cm). The last 250 years (upper 30 cm) have relatively high ASI values (up to 1.9 and 0.6 grains/cm2/yr on average).
For better visualization and comparison of stormy periods, the smoothed (and presented on a logarithmic scale; Figure 6) ASI time series are used. By this, the stormy period is selected if higher ASI peaks are in the same time interval in two or more sites. As the Juminda sequence is the only one that covers more than the last 4000 years, the one curve-based selection is applied. In Figure 6, 12 stormy periods are distinguished: between 7500 and 7150, 6750–6500, 6150–5600, 4900–4350, 3800–3350, 3050–2850, 2600–2300, 2200–1950, 1750–1450, 1200–800, 950–700, and 650–100 cal yr BP.
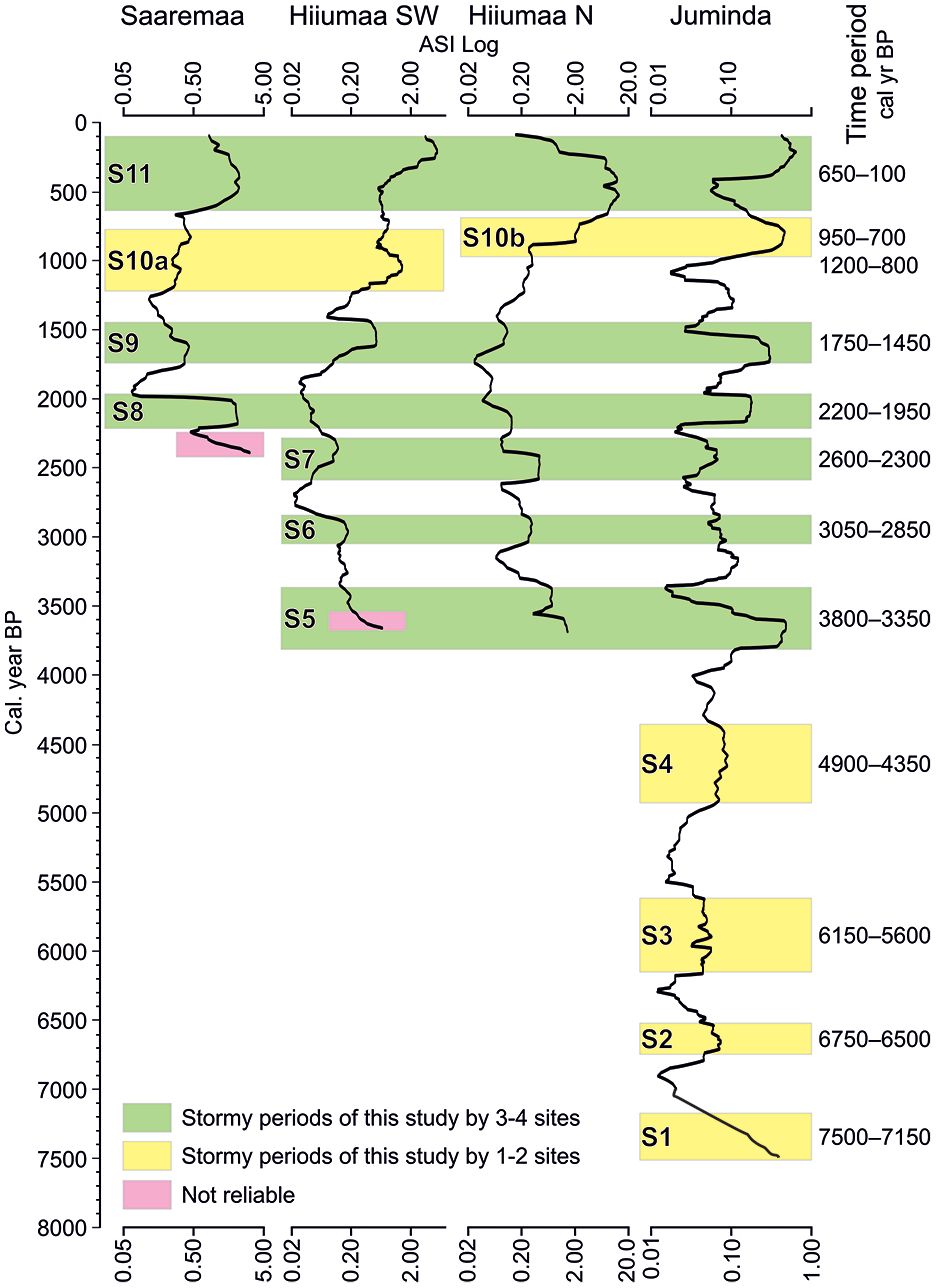
ASI time series of this study with a 200 (±100) year moving average on a logarithmic scale with visually distinguished stormy periods (S1–S11).
The ASI values in Hiiumaa N, Hiiumaa SW and Saaremaa cores have strong (>95% confidence level) positive correlations between each other (Table 2). The ASI in the Juminda core correlates well with Hiiumaa SW and Saaremaa. The correlation is weak and not significant between Hiiumaa N and Juminda cores.
Correlation matrix between the ASIs of four studied cores: Hiiumaa N, Hiiumaa SW, Saaremaa and Juminda. 50-Year interval of square root values of the ASI was used in correlations to minimize possible temporal discrepancies between the age-depth models of the cores and to smooth the differences between lower and higher ASI values. Correlation coefficient (r), P-value (p), and number of compared samples (N) are given.

Discussion
Although the reconstruction of past storminess based on the ASI records from peat deposits has been used for a couple of decades (e.g. Björck and Clemmensen, 2004; de Jong et al., 2006; Orme et al., 2016), there are no long-term data from the northeastern Baltic Sea region until this study. The pilot study by Vandel et al. (2019) covered the period from ~1400 to 2015 CE. The current study reconstructs past storminess over the last 7600 years based on the peaks in the ASI records (Figure 6). Our results are discussed in comparison with other studies dealing with the ASI records, storminess proxies from ridges, dune and other coastal formations. The general tendencies in storminess are also compared to reconstructed variations in the NAO index, Bond events, sea surface and air temperatures.
Concurrences in the Estonian ASI records
The reconstruction of storminess between 7600 and 4000 cal yr BP includes stormy periods S1–S4. However, they are solely based on the Juminda data (Figure 6). The ASI record at Juminda indicates higher storminess between 7500–7150 (S1), 6750–6500 (S2), 6150–5600 (S3), and 4900–4350 (S4) cal yr BP. Starting from approximately 3600 cal yr BP, higher ASI values are represented in three studied cores. Although minor site-to-site variations existed in the ASI records, we can suggest that stormy periods occurred between 3800–3350 (S5) and 3050–2850 (S6) cal yr BP. Our results indicate that storminess has risen since around 2500 years ago (since stormy period S7). The higher ASI values during the last millennium (S10 and S11) in all peat sequences suggest either higher storminess in the region or eased local sand transport mechanisms.
Even though there are several factors affecting the aeolian sand movement, we can see that stormy periods between each core occur usually in the same time frame (Figure 6). The Spearman’s rank-order correlation confirms that (Table 2). Even though the correlation of the ASI values between the cores of Hiiumaa N and Juminda sites are not significant, the ASI was higher during the same major periods in both cores: around 3600, 1600–1500 cal yr BP and during the last millennium.
The exponential distribution (along with sand grains count; Figure 4), the ASI values at four Estonian study sites varied between <0.01 and 45 grains/cm2/yr. About 77% of all individual ASI values are below 0.1, 88% fall below 1, and 99% below 10. Such a large spread across three-four orders of magnitude complicates the comparison with other storminess proxies. Therefore, the logarithmic presentation of ASI is justified (Figure 5).
The reason behind the large ASI variability is not fully clear. Possibly, as wind shear stress increases exponentially with wind speed, the impact of storm (gust) wind speeds can be vastly larger than that of average wind speeds. There is also a threshold for low wind speeds that cannot transport sand particles at all. Very coarse sand needs for saltation, and even more for the suspension, much larger wind speed than fine grained sand. According to Anderson et al. (2014) and Vilumaa et al. (2017), the area around Juminda site has coarser sand (fine to medium sand, in spots some gravel; partly cemented) than in Hiiumaa N (fine sand). This might be one of the reasons why Juminda core has lower ASI values. Also winds in Juminda are generally weaker than in Saaremaa and Hiiumaa. Hence, it would also imply wind gusts of higher magnitude in Hiiumaa N compared to Juminda in order to transport the coarser grains to the bog as Hiiumaa N peat sequence has higher grain size median (medium sand; Figure 4). As the ASI inputs in Hiiumaa SW and Saaremaa (based on our observations fine sand is on the beach) are not as high as compared to Hiiumaa N, the high ASI in Hiiumaa N is rather caused by some local geographical variance: close by sand availability, more open landscapes etc. The distance between Juminda Peninsula and the western islands (Saaremaa and Hiiumaa) is 200–250 km. The sites are differently exposed to storm tracks, at least within the past ~100 years (Suursaar et al., 2015). A study by Tõnisson et al. (2016) showed that the most extreme storms approaching from the SW have a significant effect on the coast of Saaremaa, but the magnitude of storms decreases eastward. The sites are open to different wind directions and the west Estonian archipelago is stormier than the northern coast of the mainland (Jaagus and Suursaar, 2013; Tarand et al., 2013). However, based on the correlations between the ASI and stormwind directions, Vandel et al. (2019) concluded that the role of certain wind directions on the ASI cannot be identified. Moreover, when a cyclone passes a specific site, the wind direction usually turns across compass rhumbs, and a wide range of wind directions are actually represented in the wind record. It is still remarkable that the general tendencies in the ASI records overlap, even though the storminess statistics are somewhat different (Jaagus and Suursaar, 2013) and the number of aeolian sand grains even differs manifold between the sites (Figures 4–6).
It is reasonable to assume that the changes in vegetation cover throughout the Holocene, at least to some extent, affects the mineral grain transport from the source area to the bogs. Over time, the vegetation changes along with land uplift, humidity conditions, etc. One should also keep in mind, the source of sand is not only beach but also nearby dunes, sandy ridges, and sand planes. Usually these get covered quite quickly with vegetation and after that the sand is unexposed. On the other hand, forest fires may make once buried sand available again for transport. This refers to some uncertainties in the ASI records, although resolvable to some degree by combining ASI with pollen and ash particle records.
The sand source condition also plays a role: is it dry, moist, or frozen. It is hard to mobilize sand from moist ground and even more from frozen ground. Frozen ground and snow cover between source and trap (bog) might have an important part in sand movement as well. Björck and Clemmensen (2004) suggested that the sand grains can more easily reach the bogs by niveo-aeolian processes during winter.
During the last millennium, possible effects of human impact on the ASI should be also considered. These can be related to the changes in the openness of the landscape and to land use (de Jong et al., 2006; Nielsen et al., 2024; Orme et al., 2015, 2016). Archeological evidence of human activity in Saaremaa and Hiiumaa are known from Meso- and Neolithic Periods (Jussila and Kriiska, 2004; Kriiska and Lõugas, 1999) suggesting inhabitants were already on these islands when the studied bogs started to develop. Although uplift-driven progradation has increased the distance between the beach sand sources and the recipient bogs, human influence on the environment has become greater over time. Clear-cutting and intense soil disturbances near the study areas may temporarily affect the ASI to the bogs (Kuoppamaa et al., 2009; Vandel et al., 2019). However, Vandel et al. (2019) argued that the changes in forest cover had no major effects on the ASI in the coastal, paludified areas over the last century. De Jong et al. (2006) also concluded that an increase in landscape openness indicators, such as grassland specific pollen counts, seemed not to have a clear correlation with the ASI.
Comparison with other Estonian and Latvian records
The analysis of near-cyclic occurrences of beach/foredune ridges and larger ridge sets on Tihu strandplain (near the Hiiumaa SW site of this study) revealed time intervals of enhanced storminess during 5400–4900, 4800–4700, 4600–4300, 4100–3800, 3700–3400, 3200–2900, 2700–2400, and 2200–1900 cal yr BP, and Little Ice Age (LIA) (Suursaar et al., 2022). Based on mineral grain proxy from coastal lake sediments in Latvia (Kalińska-Nartiša et al., 2018), three stormy periods occurred at 7300, 6600–6400, and 6200–6000 cal BP, and after that, stableless variable marine conditions dominated up to 4100 cal yr BP. Some of these above-named stormy periods match also with the timing of the coastal dune and swale formations around Estonian coast (Muru et al., 2018; Tõnisson et al., 2018; Vilumaa et al., 2016, 2017). Several stormy periods of our study fit with these periods rather well (Figure 7). Although the exact timings of stormy periods did not completely fit, there is a certain concurrence in the number of stormy periods (8 over the past 5500 years). However, the large variability and occurrence of numerous smaller peaks in the ASI records makes a detailed comparison with other records rather subjective. Some of the peaks fit but some are missing: for example, missing storms between 5000 and 5300 and around 4100 cal yr BP. One should also bear in mind that depending on technical details in coring, sampling or dating procedures, it is quite possible to get somewhat misplaced (say, even by ±150 years) stormy period estimates. Method-wise different possible error sources exist even if they are not communicated so.
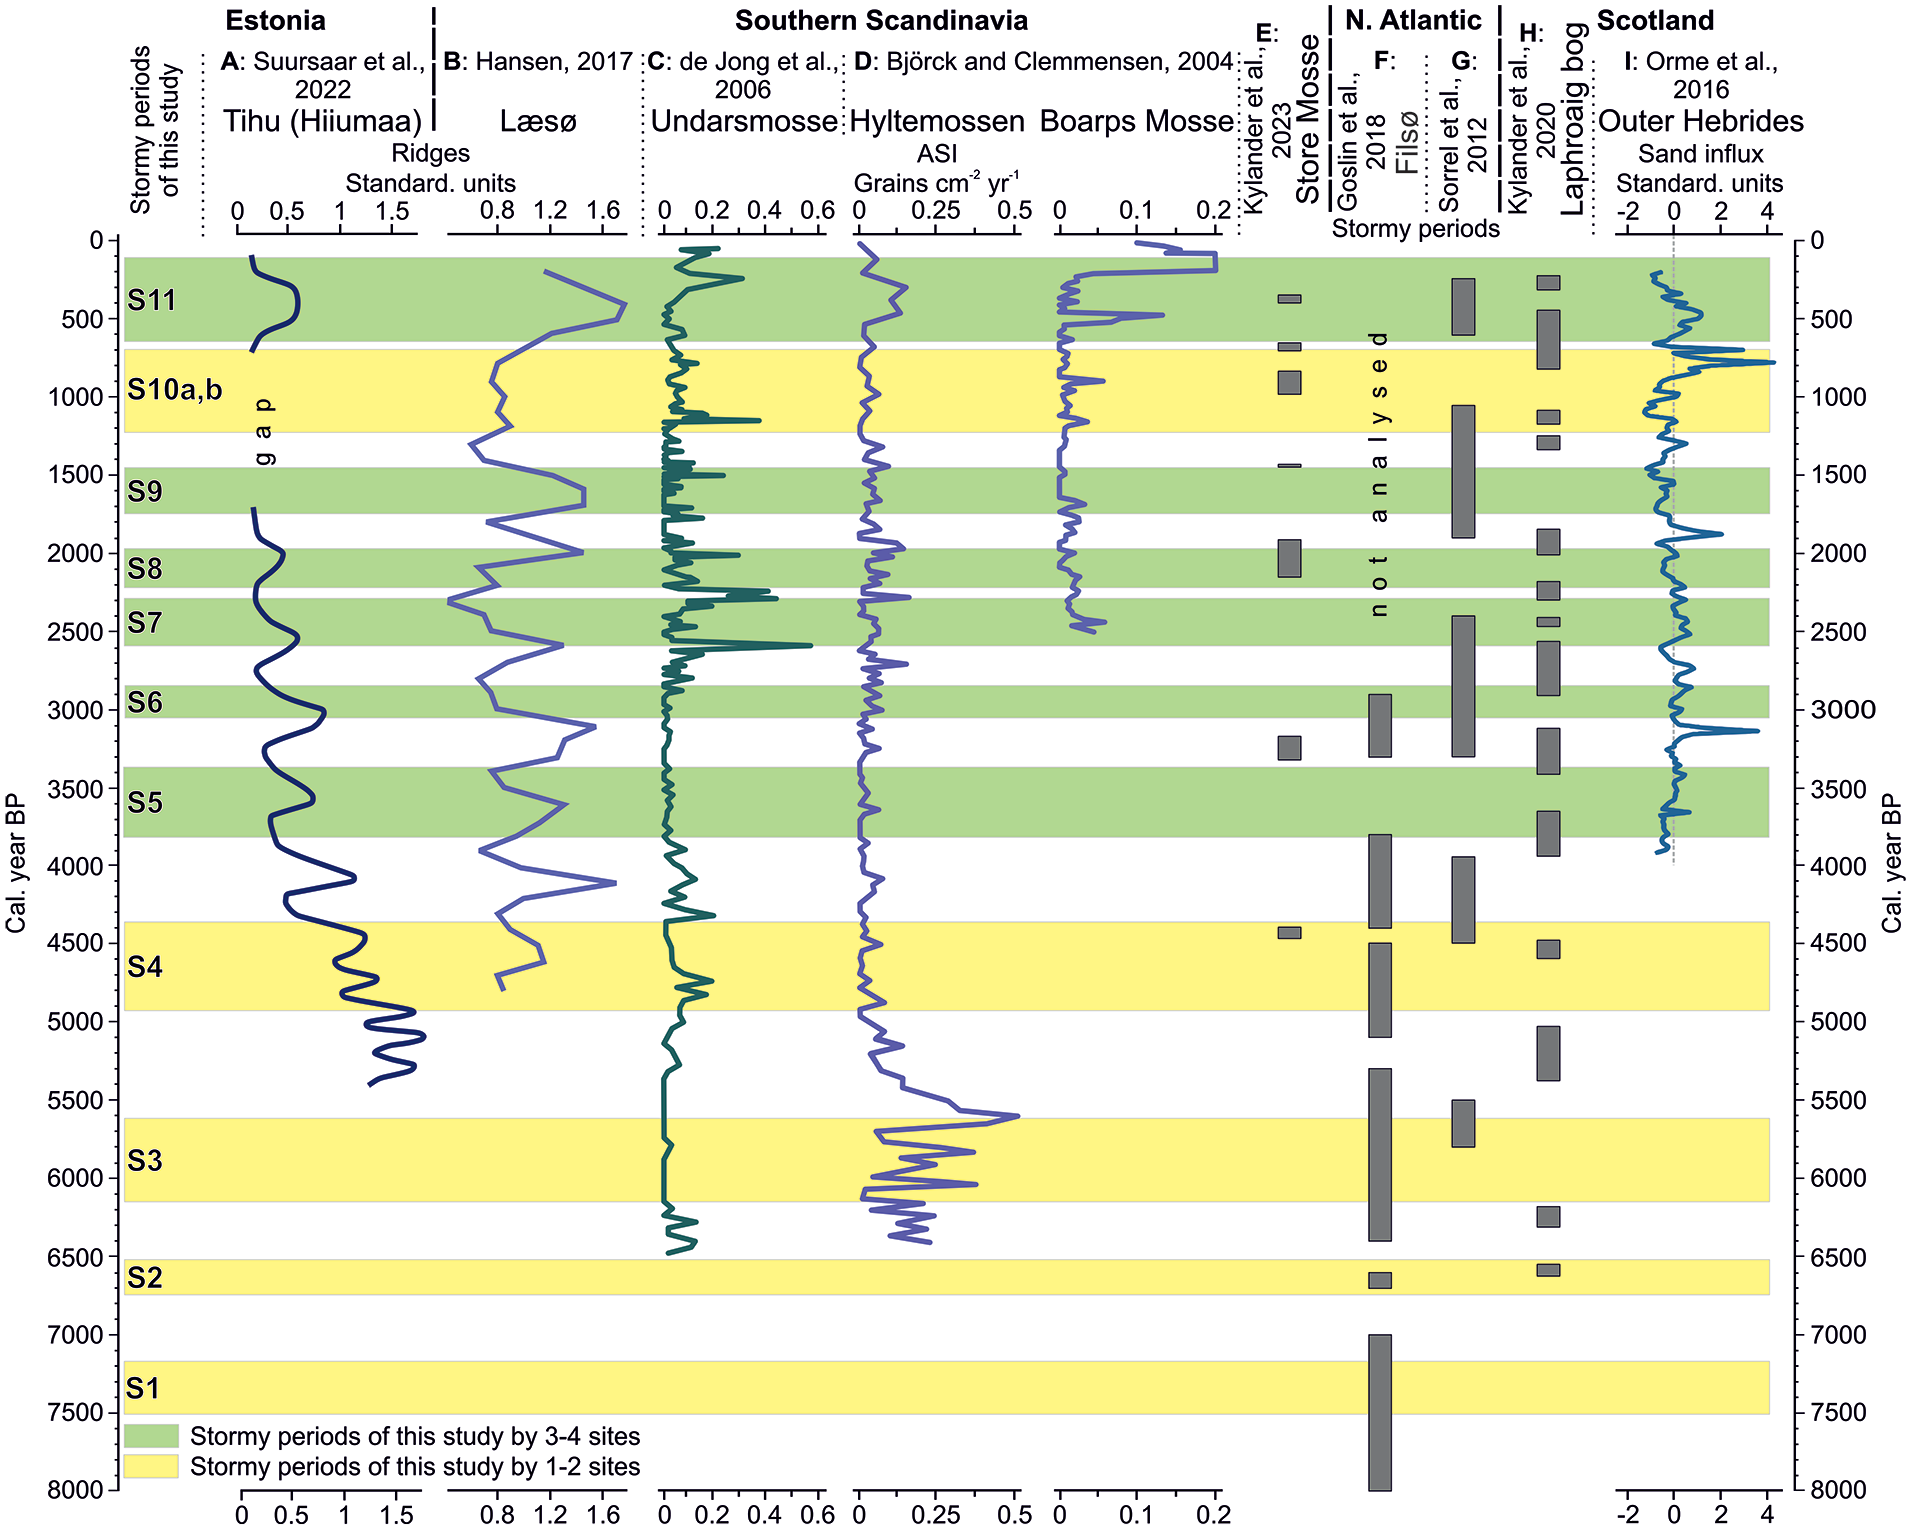
Comparison of stormy periods (S1–S11) with previous storminess studies by other authors: (a and b) formation of ridges related to storms in Estonia (Suursaar et al., 2022) and Denmark (Hansen, 2017). (c, d, f, and i) Stormy periods based on ASI records from Sweden (Björck and Clemmensen, 2004; de Jong et al., 2006), Denmark (Goslin et al., 2018), and Scotland (Orme et al., 2016). (e) Local stormy periods documented by mineralogical and elemental proxies from Sweden (Kylander et al., 2023). (g) Stormy periods with evidences from coastal sediments of France (Sorrel et al., 2012). (h) Stormy periods by the combination of ash content, grain size and elemental chemistry from Scotland (Kylander et al., 2020). The locations of these studies are shown in Figure 1.
Stormy periods between 3800–3350 (S5) and 3050–2850 (S6) cal yr BP are well supported by a study of beach/foredune ridges from the Tihu strandplain (Figure 7). Large ridges with extensive internal erosional layers have been documented for the same period in Ruhnu Island (Muru et al., 2018) situated ~70 km SE from the Saaremaa site and ~35 km from Latvia, and at Narva-Jõesuu in NE Estonia (Rosentau et al., 2013). Hence, there is some independent evidence of stormy periods around 3600 cal yr BP (S5) in Estonia.
Comparison with Northern Europe storminess records
According to the long term ASI storminess reconstructions several stormy periods between 7600 and 4000 cal yr BP (7500–7150 (S1), 6750–6500 (S2), 6150–5600 (S3), and 4900–4350 (S4) cal yr BP) are recognizable in Scandinavia (including Denmark). There are only one study by Goslin et al. (2018) reaching back as far as our findings, de Jong et al. (2006) have one record that dates back to 6500 cal yr BP, and Björck and Clemmensen (2004) have reliable values for ca. 5700 years (they are not certain about the earlier peaks). As Goslin et al. (2018) have identified higher storm activities for quite long time-windows in between 9700 and 8900, 8700–8400, 8200–7000, 6700–6600, 6400–5300, and 5100–4500 cal yr BP then we can see many concurrences between our findings (S1, S2, S3, S4; Figure 7). Björck and Clemmensen (2004) have identified stormy periods at 5700–5450 (partially our S3), 5200–5100, 4900 (our S4), 4550 (our S4), 4200–4100, and 3675 cal yr BP (our S5) where concurrence is lower compared to us. De Jong et al. (2006) have shown stormy periods around 5200, 4800 (our S4), and 4300–3800 cal yr BP. The study from northern Norway by Nielsen et al. (2016a) confirm stormy periods around 4800 (our S4) and 4250 cal yr BP. The stormy periods S4 match with the timing of the coastal dune and swale formations (around 5000, 4500 years ago; dated by OSL method) studied in Denmark (Clemmensen et al., 2009; Clemmensen and Murray, 2010). A stormy period S4, between 4900 and 4356 cal yr BP, is also supported by beach ridge based proxies by Hansen (2017) and Suursaar et al. (2022) (Figure 7).
For a geographically wider perspective we have some comparisons with storm records from Scotland and northwestern France. From Scotland island Islay Kylander et al. (2020) have used a combination of ash content, grain size and elemental chemistry to identify stormy periods from a coastal peat deposit (Laphroaig bog) that are recognizable around 6605 (our S2), 6290–6225, 5315–5085, around 4505 (our S4), 3900–3635 (our S5), 3310–3130, 2920–2380 (our S6 and S7), 2275–2190 (partially S8), 2005–1860 (partially S8), 1305–1090 (our S10a), 805–435 (our S10b and S11), and around 275 cal yr BP (our S11) (Figure 7). Sorrel et al. (2012) have used high-resolution seismic data from the Seine Estuary and Mont-Saint-Michel Bay sediments, complemented by dated storm deposits (thick, coarse sandy shell intervals) from vibrocores. They have documented stormy periods between 5800–5500 (our S3), 4500–3950 (partially our S4), 3300–2400 (our S6 and S7), 1900–1050 (our S9 and S10a) and 600–250 cal yr BP (our S11) (Figure 7). Several of these periods fit with our findings but concurrence is often rather speculative.
Our results indicate higher storminess since around 2500 cal yr BP (beginning of the stormy period S7). Björck and Clemmensen (2004) and de Jong et al. (2006) show an increasing storminess trend since 2800 cal yr BP (Figure 7), but the “trend” is still rather speculative. The series are not strictly homogeneous, as climatic conditions (temperature, humidity, snow and ice), vegetation, and the distance from the sea have changed over time. While eight ASI peaks can be found between 5600 and 2800 cal yr BP (ca. three peaks per millennium) in the Hyltemossen (Björck and Clemmensen, 2004), the number of the ASI peaks increases notably after that. There were 19 peaks since 2800 cal yr BP (ca. six/seven peaks per millennium) (Figure 7). De Jong et al. (2006) identified 10 peak groups since 3000 cal yr BP (ca. three peak groups per millennium) and only six peaks occurred between 6000 to 3000 cal yr BP (two peak groups per millennium). In our study, we do not identify and count individual distinctive ASI peaks, but rather look at the periods formed by smoothed logarithmic ASI data. Therefore, we don’t compare the number of storm events with the previous studies. The evidence for higher storminess after 2500 cal yr BP is rather a decrease in the length of gaps between the stormy periods. Stormy periods S7 (2600–2300 cal yr BP), S8 (2200–1950 cal yr BP), S9 (1750–1450 cal yr BP), S10a,b (1200–800 and 950–700 cal yr BP), and S11 (650–100 cal yr BP) almost consistently follow each other.
According to our results, storminess has been the highest since 1200 cal yrs BP (Figure 7). Several studies have shown that during the Medieval Climate Anomaly (around 1000–700 cal yr BP) (Orme et al., 2016; Trouet et al., 2012) and the Little Ice Age (15th to the 19th centuries; LIA) (Björck and Clemmensen, 2004; de Jong et al., 2006; Nielsen et al., 2024; Wheeler et al., 2010; Wilson et al., 2004), the climatic conditions have been stormier. The LIA markers are clearly visible in the Danish Island Læsø storminess proxy (Hansen, 2017; Figure 7), in the Bond (ice-raft) events (Bond et al., 2001) and also in the dune formation study (Tõnisson et al., 2020) along the Estonian coast, where more than 30 dune segments in total length of about 100 km exist with a gradual growth over most of the LIA.
Comparison with Northern Europe climate indicators
Available paleoclimate reconstructions have shown considerable variations in climatic background conditions throughout the Holocene (BACC, 2015; IPCC, 2021). The Bond events (Bond et al., 2001), as one of the climate fluctuation reconstruction for the European Atlantic coast, generally fits well (sometimes with just a 50–100 year difference) with our ASI peaks around 7300 (S1), 6700 (S2), 5900 (S3), 4600 (S4), 3400 (S5), 2900 (S6), 1600 (S9), and 500 cal yr BP (S11). Based on fossil-pollen records from lake sediments, Seppä and Poska (2004) have reconstructed Holocene annual mean temperatures in Estonia. Their data suggest up to a 1.5° higher mean temperature during the Mid-Holocene compared to Late-Holocene. Variations in the Norwegian Sea surface temperature (Calvo et al., 2002) roughly coincide with the results by Seppä and Poska (2004). The sea surface temperature started to decrease 6000 years ago and it was a degree lower on average during the last 3600 years, and even colder since 2500 cal yr BP. The Late-Holocene climate is known to be colder and more humid, especially in winter (Seppä and Birks, 2001; Seppä and Poska, 2004; Stansell et al., 2017). Based on sedimentary study from the North Atlantic, Andresen and Björck (2005) also found that additional cooling occurred after 3500 cal yr BP. There is probably a changing NAO-storminess relationship through the Holocene till the LIA (Orme et al., 2016). Since 2400 cal yr BP, the NAO+ phase dominated according to Olsen et al. (2012). It means that relatively stronger westerly winds carried more humid air masses to the Baltic Sea area and caused an increased winter snowfall and also solid snow cover. Thus, since ~2500 cal yr BP, the climate has been colder and conditions may have become more suitable for sand transport further inland into bogs, in general, as a result of niveo-aeolian process during winter.
The grain counts and the ASI values during the last millennium were generally higher than those in the previous millennia (Figures 4 and 5), suggesting either higher storminess in the region or eased local sand transport mechanisms. That could have occurred due to the gradual cooling of the climate (and enhanced niveo-aeolian transport in winters), especially during the LIA. The LIA, a stormier period, based on several studies, is already mentioned above and well summarized by Kylander et al. (2023). Based on our ASI values (Figure 5), the increased influx during the last 1000 years occurs. The last millennium is also the period with more intense land use that may cause more open landscapes and hence, better conditions for sand movement to the bogs. However, even if the anthropogenic impact may cause higher ASI levels, the increased frequency of the ASI peaks still reflects higher storm activity. Aside from the past centuries with higher anthropogenic influences, the ASI over the Mid- and Late-Holocene should still reflect changes in the past storminess (e.g. Björck and Clemmensen, 2004; de Jong et al., 2006; Orme et al., 2016). Separation of (broader) climatic, strictly storminess-related, human, and local environmental causes of aeolian sand deposition remains a challenge. However, an increasing pool of independent storminess reconstructions definitely contributes to a better understanding of the storminess-related climatic processes both in the past and near future.
Conclusions
ASI reconstructions were obtained at four raised peat bogs on the Estonian coast of the Baltic Sea. The coring sites have been exposed to winds from different directions (south, west, north) but were mainly affected by cyclonic activity, which mainly occurs along the (westerly) North Atlantic storm track. Nearby beaches and extensive raised strandplains with ridges provide sand to the bogs. As both the sand grain concentrations and ASI estimates vary considerably (by three orders of magnitude) along the sampled cores, a logarithmic presentation of the ASI curves was applied for comparison of the Estonian curves between themselves, and with storminess proxies from other North European locations.
The main results are as follows:
Though minor site-to-site variations exist, the ASI records from four Estonian peat cores are mostly consistent with each other. The periods of elevated storminess occur approximately 7500–7150, 6750–6500, 6150–5600, 4900–4350, 3800–3350, 3050–2850, 2600–2300, 2200–1950, and 1750–1450 cal yr BP and over the last 1200 years.
Our ASI results suggest a shift in climatic conditions around 2500 cal yr BP – since then stormy periods became more frequent.
The ASI values during the last millennium are generally higher than those in the previous millennia, suggesting either higher storminess in the region and/or more favorable transport mechanisms for local sand. The latter could have occurred due to the gradual cooling (and prevalence of niveo-aeolian transport mechanism in winter), especially during the LIA. Anthropogenic factors such as logging, agriculture and trampling could have also intensified over the last millennium, potentially increasing the areas of available sand for aeolian transport.
Footnotes
Acknowledgements
We are grateful to Agnes Anderson, Mihkel Kangur, Martin Küttim, Agáta Marzecová, Margus Pensa, Alar Rosentau and Jaanus Terasmaa for their help at fieldwork.
Author contribution(s)
Funding
The author(s) disclosed receipt of the following financial support for the research, authorship, and/or publication of this article: The study was supported by the Estonian Research Council grants IUT18-9 and PRG1471.