
Abstract
This research explores the vegetation compositional changes between the fifth and third millennium BC on the Karelian Isthmus (north-west Russia). Special emphasis is placed on studying the timing and magnitude of the impact of hunter-fisher-gatherers on the vegetation. First, we reconstruct the local vegetation around Lake Bolshoye Zavetnoye by using the Landscape Reconstruction Algorithm modelling. The application of different scenarios to the relevant source area of pollen is used to assess the local vegetation around Lake Bolshoye Zavetnoye (BZL) at specific distances from 500 to 3000 m. The regional vegetation reconstruction is assessed by using the REVEALS model. Second, we present new pollen and charcoal data from adjacent Lake Ikmenlampi (LI). Third, we calculate indices of vegetation change for BZL, LI and the region. We further explore the potential causes for these differences between the spatial scales and compare all these outcomes with local and regional archaeological data. The results show that foragers actively manipulated their environment. A shift towards more heliophilous conditions is shown by ca 4800 BC. Between 4000 and 3000 BC, an increase in archaeological material suggests intensive resource procurement and landscape management activities, particularly near settlements. Around the BZL site a local decrease in birch is observed from 4100 BC, coinciding with an increase in the rate of vegetation changes. Additionally, a decline in tree species (spruce, hazel, Alder) from 3500 to 3300 BC suggests human activities. The high fire frequency recorded between 4090 and 3150 BC further supports the presence of local human disturbances by the deliberate use of fire to create favourable living conditions. The results from the LI site go in the same direction with fluctuating abundances of spruce and the presence of pollen from Cannabis, Hordeum, Urtica and Plantago lanceolata from ca 4000 to 3600 BC, indicating the use of spruce-dominated forests and an early, incipient cultivation.
Keywords
Introduction
In the prehistory of Europe, the Neolithic is often described as an epoch-making period during which human societies underwent significant socio-cultural transformations, presumably launched by the introduction of productive livelihoods (cultivation and/or animal husbandry). From the point of view of north-east Europe, the concept of an agricultural Neolithic is not really appropriate for the area, which is characterized by boreal forests hardly suitable for large-scale farming. Unlike western Europe, the Neolithic in Finland and north-west Russia is traditionally connected with the adoption of pottery technology in the second half of the sixth millennium BC (Nordqvist, 2018; Pesonen, 2021; Tarasov et al., 2017). In this paper, the term Neolithic is used as a chronological label to refer broadly to the period between ca 5000 and 2000 BC. Subsistence continued to rely on hunting, fishing, and gathering (e.g. Seitsonen et al., 2017), but at the same time, this period is characterized by diverse technological, economic, and socio-political development that led to increasingly versatile forager societies (e.g. Herva et al., 2017; Nordqvist, 2024; Tarasov and Nordqvist, 2022). These populations influenced and altered their environment, yet the implications may still have been small and sporadic (e.g. Bishop et al., 2015; Piezonka et al., 2021; Poska et al., 2004). Conscious and unconscious human-plant interactions affected the vegetation dynamics, and in particular the deliberate manipulation of plant resources had an impact on the abundance and distribution of certain species (Alenius et al., 2017; Grøn, 2012; Innes et al., 2013; Smith, 2001; Warren et al., 2014; Wieckowska-Lüth et al., 2018). In addition, the sporadic occurrence of pollen from cultivated pollen types such as Hordeum and Cannabis, mostly dating to ca 4400–3200 BC in eastern Finland and the Karelian Isthmus, suggest that some incipient knowledge of cultivation had reached the area (Alenius et al., 2013, 2020).
The development of the Landscape Reconstruction Algorithm (LRA; Sugita, 2007a, 2007b) has offered new possibilities for interpreting pollen data in quantitative terms on both regional and local spatial scales. The LRA reduces biases caused by basin size, inter-taxonomic differences in pollen productivity, and pollen dispersal and deposition (Sugita et al., 2010). In northern Europe, Marquer et al. (2014) previously demonstrated that plant composition and abundance indicated by REVEALS-based vegetation estimates show a more extensive impact caused by Neolithic deforestation and agricultural activities than has been interpreted based on traditional untransformed pollen percentages (see also Hellman et al., 2009; Marquer et al., 2017; Sugita, 2007a). It was demonstrated that the LRA approach is critical for interpreting local vegetation changes based on pollen in various contexts, such as lowlands and mountain regions (e.g. Marquer et al., 2020a; O’Dwyer et al., 2021).
In eastern Finland, the LRA was previously used to study Neolithic land use around Lake Huhdasjärvi (Alenius et al., 2021). According to the results, changes in the vegetation composition were similar on both regional and local scales until ca 4000 BC. These changes were mainly driven by natural and climatic factors. In contrast, trends in vegetation dynamics started to differ between regional and local scales from ca 4000 BC onwards, which can be explained by local-scale land use that cannot be discerned at a regional scale when pollen is used as a proxy for vegetation changes.
Although local-scale land use altered the vegetation during the Neolithic, on a regional scale climate remained the dominant factor causing vegetation change for much of the Holocene. In fact, anthropogenic land use has become one of the primary drivers of regional vegetation change only during the last ca 2500 years in the Baltic region (Kuosmanen et al., 2016, 2018; Marquer et al., 2017; Reitalu et al., 2013). It is therefore critical to explore the potential causes for these differences between spatial scales. North-east Europe is an important region for discussing this spatial issue and can improve our understanding of the impact of forager land use strategies on the boreal ecosystem.
In this article, we focus on the long-term impact of hunter-fisher-gatherers on the vegetation of the Karelian Isthmus (north-west Russia) between the fifth and third millennium BC. Special emphasis is placed on studying the timing and magnitude of human influence, focussing on the manipulation of wood and other plant resources, as well as the general impact of land use on local and regional vegetation. About 400 archaeological sites known on the Karelian Isthmus testify to the intensive presence of hunter-fisher-gatherers in the area throughout the Mesolithic and Neolithic Stone Age (ca. 9000–2000 BC; Gerasimov, 2023; Gerasimov et al., 2003; Nordqvist et al., 2009; Seitsonen et al., 2016). The impact of forager land use on the Isthmus was previously studied from the sediment archives of Lake Bolshoye Zavetnoye (Juoksemajärvi) (BZL) using qualitative information, namely conventional pollen percentages and concentrations (grains/cm3) (Alenius et al., 2020). The results indicate increased openness in the landscape as a result of increased human activity and prolonged human occupation since the mid-fifth millennium BC, possibly reflecting changes in economy and socio-cultural transformations.
To gain a more comprehensive picture of hunter-fisher-gatherer land use and its impact on the Karelian Isthmus, we first reconstructed the local vegetation around BZL by using the LRA modelling scheme. In order to do this, the regional vegetation reconstruction (the first step in LRA modelling scheme) is first assessed by using the REVEALS model (Sugita, 2007a). Second, we present new high-resolution pollen and charcoal data from adjacent Lake Ikmenlampi (LI), situated about 6 km from BZL (Figures 1 and 2). Due to the large size of this lake during the study period, the local vegetation reconstruction using the LRA modelling scheme is not possible as the LRA modelling scheme can only be applied to small basins (<50 ha). Therefore, the results for Lake Ikmenlampi are presented only as conventional pollen percentages and concentrations. Third, we calculated indices of vegetation change for BZL, LI, and the region. We further compare all these outcomes with local and regional archaeological data. This research strategy aims at exploring the vegetation compositional changes between the fifth and third millennium BC and identifies the influence of anthropogenic land use on those changes at both regional and local spatial scales.
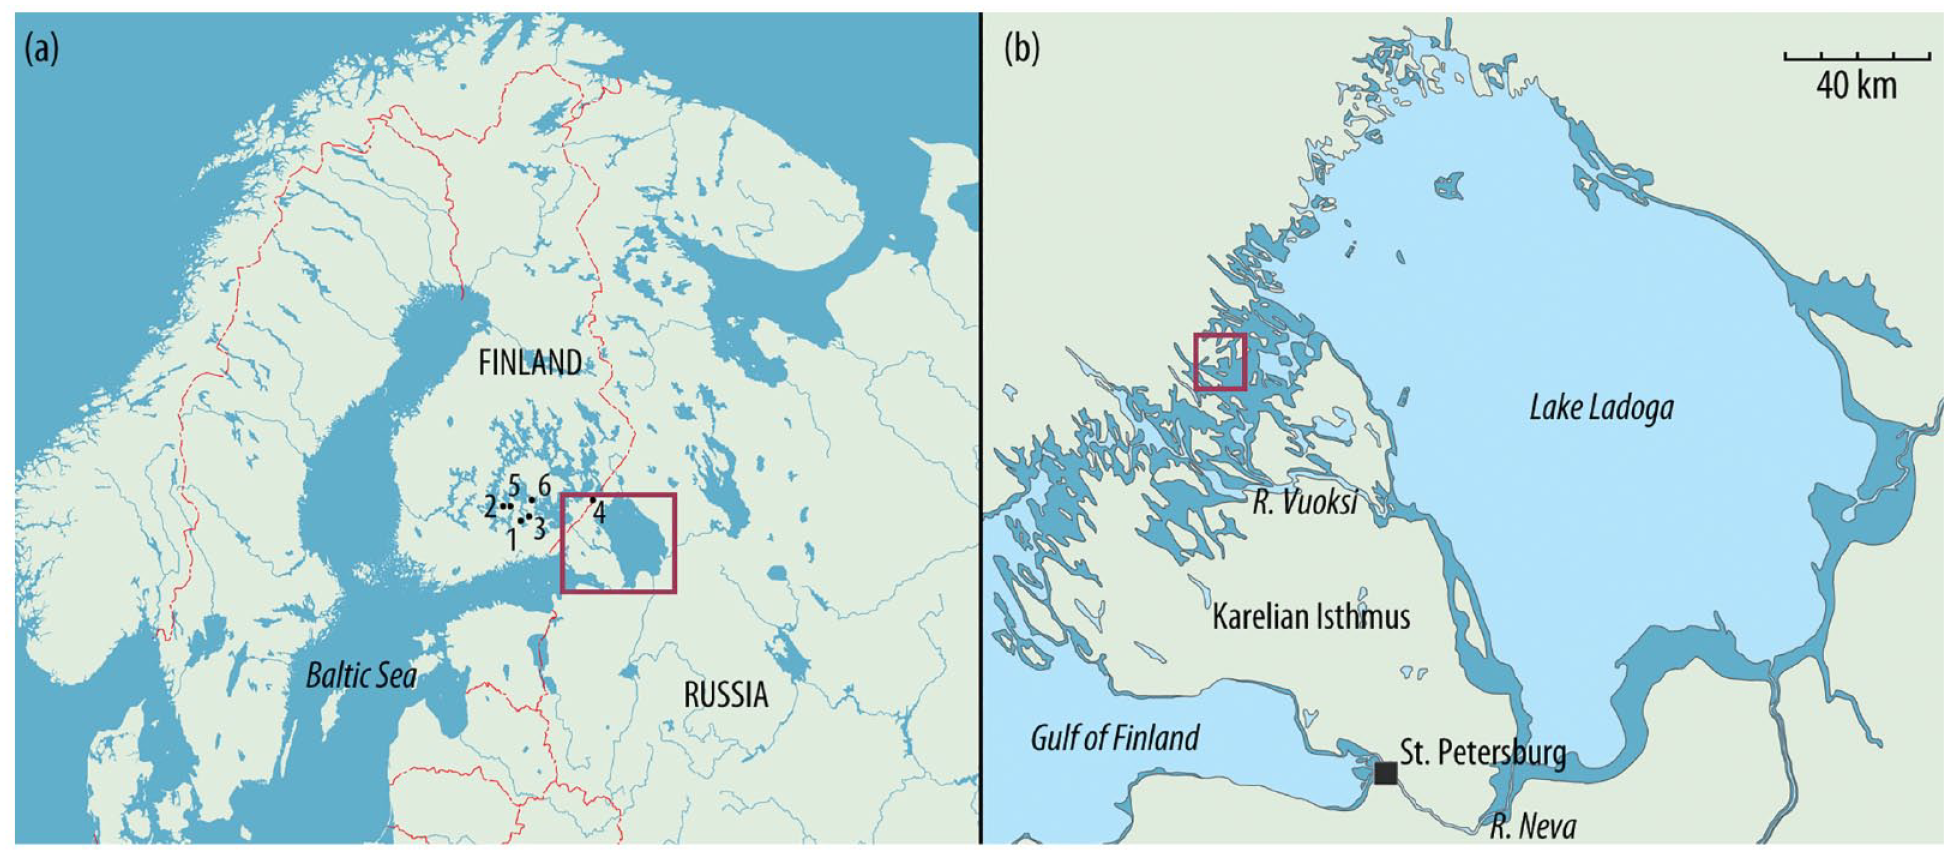
(a) Location of the study area in eastern Finland and on the Karelian Isthmus, Russia. The red rectangle shows the area of the detailed map (map to the right). Lakes used for REVEALS are shown: 1 – Huhdasjärvi (1, A and C); 2 – Kaakotinlampi; 3 – Katajajärvi; 4 – Kirkkolampi; 5 – Laihalampi; 6 – Orijärvi. (b) View of the Karelian Isthmus and Lake Ladoga. The maximum area covered by Ancient Lake Ladoga prior to the formation of the Neva outlet is shown in dark blue. The red rectangle corresponds to the location of Lakes Ikmenlampi and Bolshoye Zavetnoye (redrawn from Saarnisto and Grönlund, 1996; see also Figure 2).
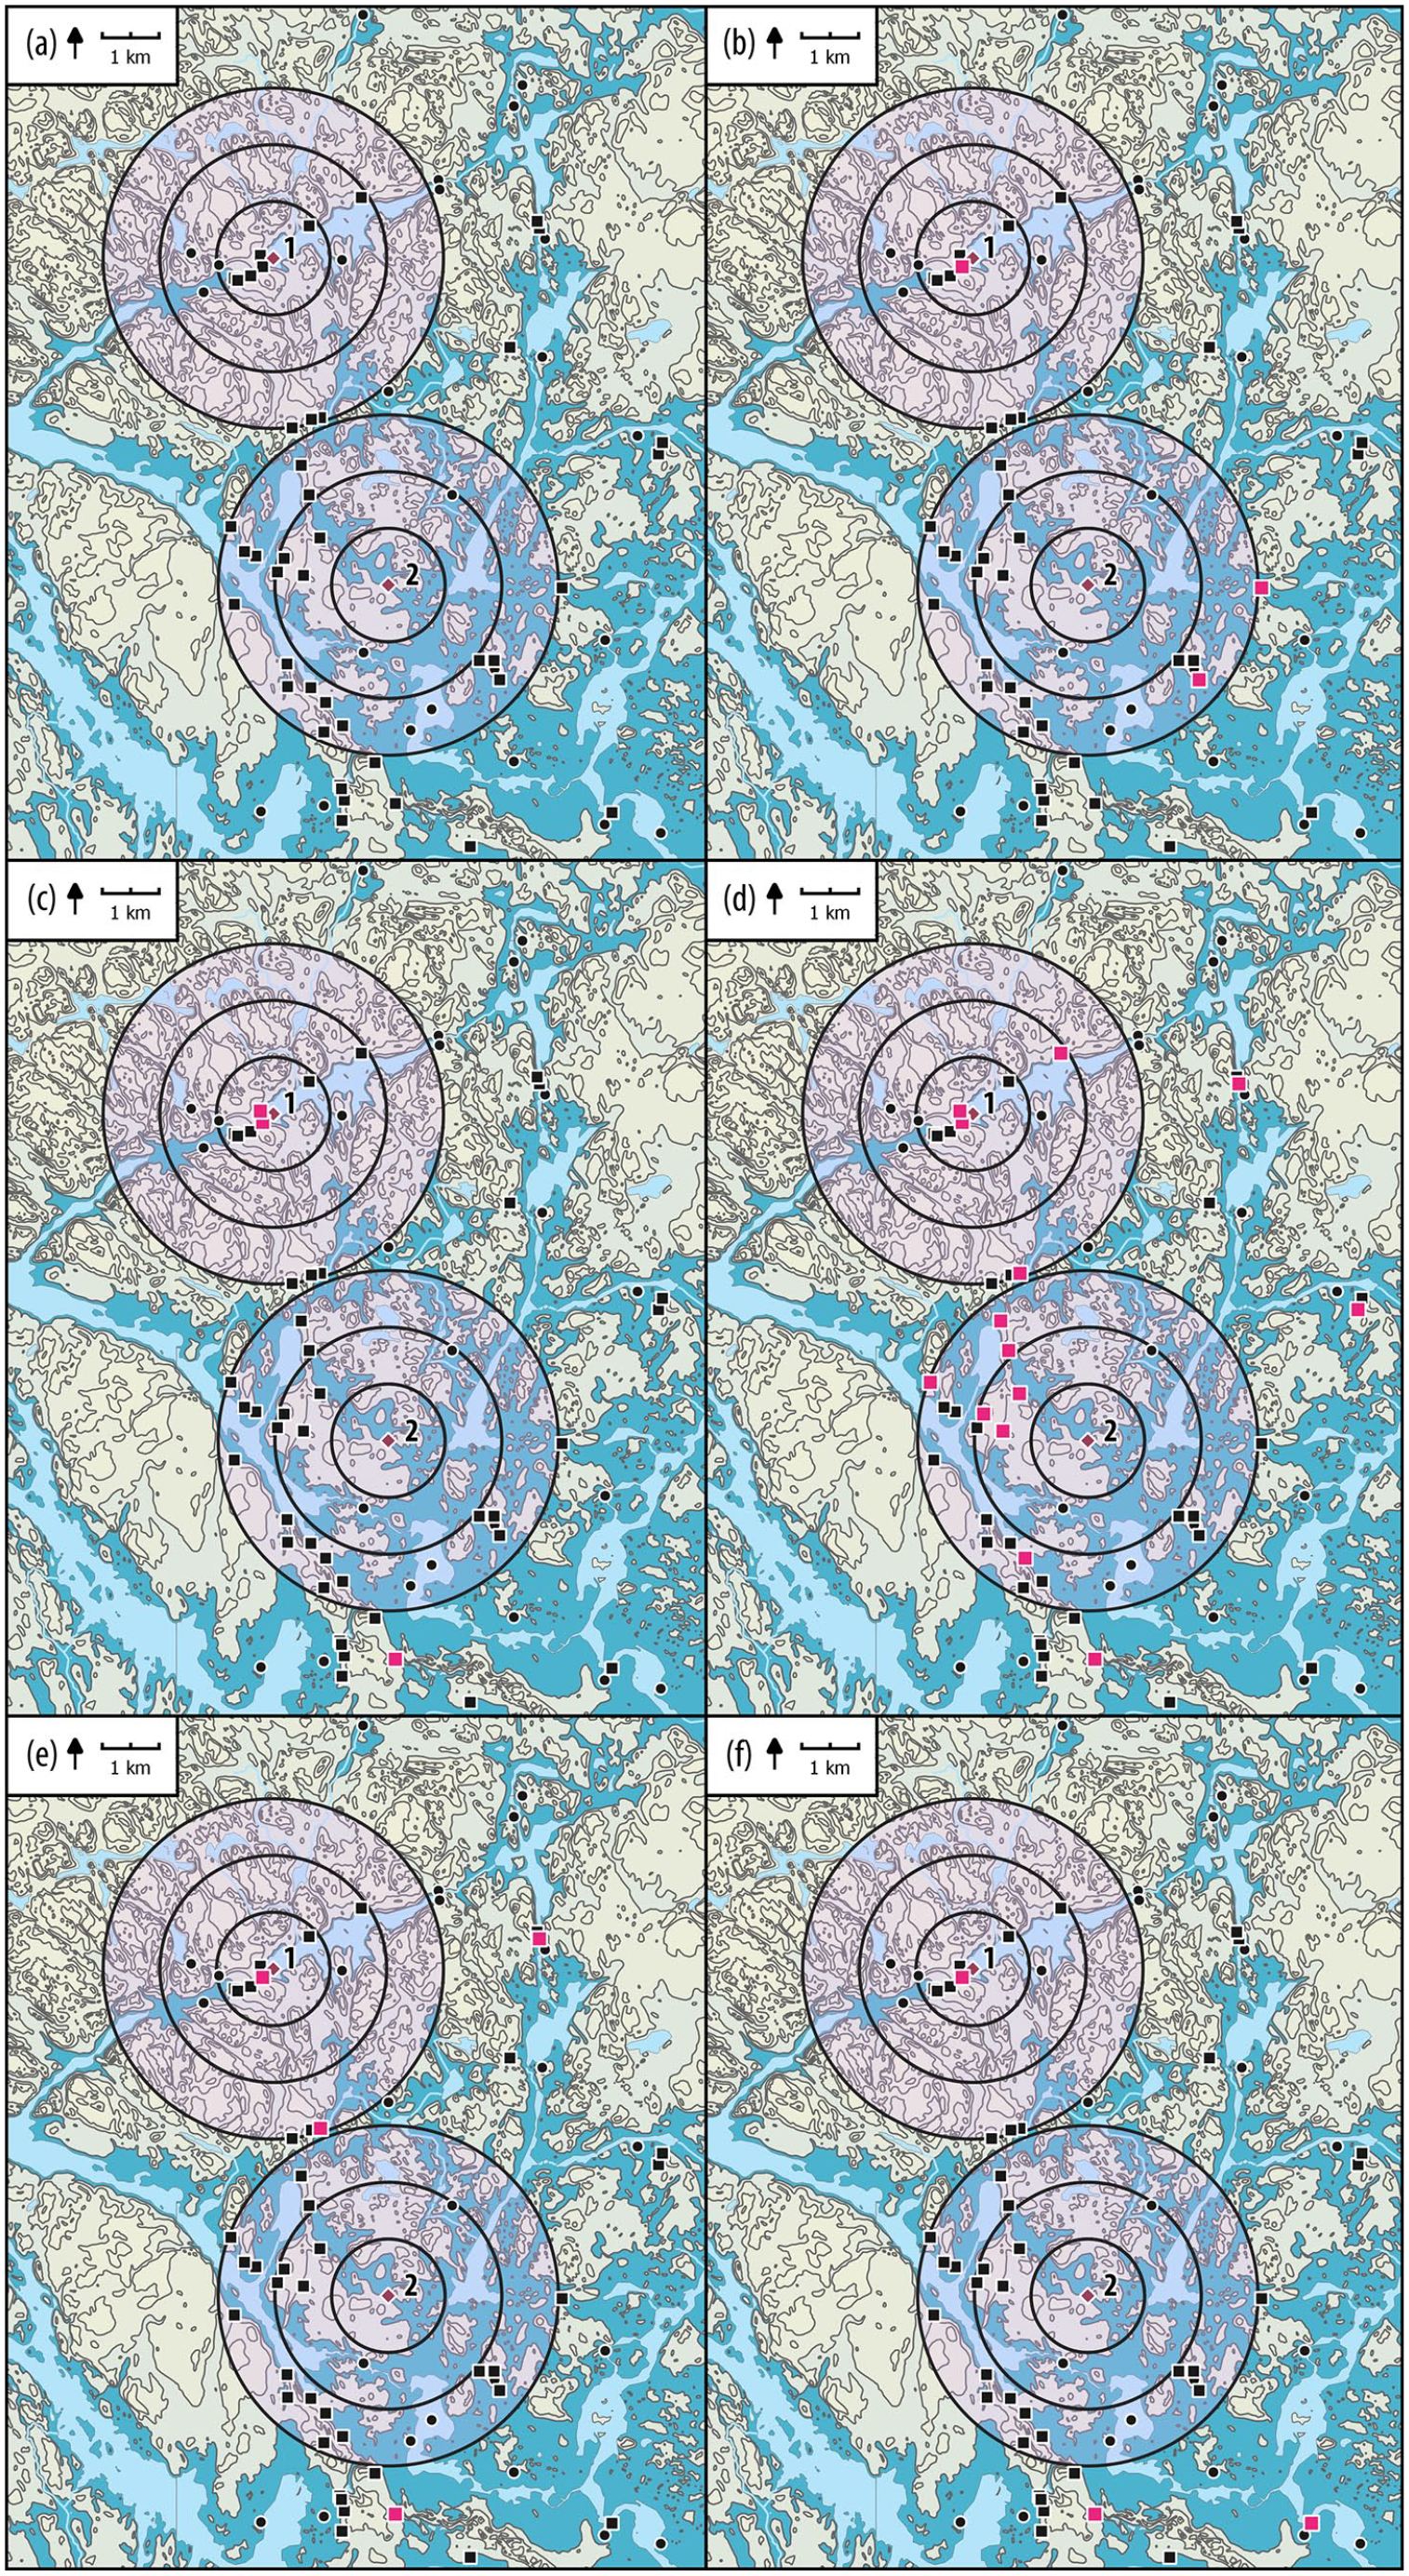
Archaeological finds around Lakes Bolshoye Zavetnoye (1) and Ikmenlampi (2). Modern waters are shown in light blue, darker blue approximates the situation during the Neolithic (20 m asl.). Stone Age settlement sites are marked with squares, and stray finds as dots (the active locations for each time period are marked in red). For the comparison with the three LOVE scenarios (1000, 2000 and 3000 m) corresponding to three fixed RSAPs for the LOVE runs, rings of incremental distances around Lake Bolshoye Zavetnoye and Lake Ikmenlampi, 1, 2 and 3 km, are shown (a) all Stone Age sites and finds; (b) sites and finds older than 5000 BC; (c) 5000–4000 BC; (d) 4000–3000 BC; (e) 3000–2000 BC; (f) 2000–1000 BC.
Study area and site descriptions
The study region spans an area from eastern Finland to the Karelian Isthmus, Russian Federation, between about 60° and 62°N (Figure 1). The southern boreal zone of this region is characterized by coniferous forests of Picea abies and Pinus sylvestris and deciduous trees, namely Betula pendula and B. pubescens, Populus tremula, Alnus incana and A. glutinosa (Alalammi, 1988). The mean annual temperature in the area is 3–4°C, the coldest month is January (between −8 and −9°C) and the warmest month is July (16–17°C). The mean annual precipitation is 600 mm (Alalammi, 1987; Subetto et al., 2002).
Lakes Ikmenlampi (LI) and Bolshoye Zavetnoye (BZL) are both situated on the Karelian Isthmus, approximately 120–125 km north of St Petersburg (Figure 1b). LI (60.960297°N, 29.696335°E) is currently about 1.34 ha in size with an elevation of approximately 14 m asl. It is located in a depression or valley oriented from north-west to south-east with inlet and outflow at the respective ends of the basin. Such linear landforms correspond to the NW–SE direction of the retreating Scandinavian Ice sheet and its meltwaters during the Last Glaciation and are common on the northern Karelian Isthmus, where they are presently occupied by lacustrine and fluvial systems. BZL (61.012920°N, 29.661893°E), situated 17.2 m asl, is about 1.2 km2 in size with a maximum depth of 8 m and an average depth of 4 m. The terrain has a relatively steep profile, especially around the lake basin, with a relief amplitude between ca 20 and 55 m. Archaeological studies on the shores of the lake have revealed traces of human activity at least from the Late Mesolithic to the Middle–Late Neolithic, the 7th–4th/third millennium BC (Halinen et al., 2008; Nordqvist and Lavento, 2008).
The environmental history of the Karelian Isthmus is closely linked to the water level fluctuations of Lake Ladoga. During the Neolithic, the water level of the northern Lake Ladoga Basin remained at 20–21 m asl., which is 15–16 m higher than today, and vast territories were submerged (Dolukhanov et al., 2009, 2010; Gerasimov and Kul’kova, 2003; Saarnisto, 2008; Saarnisto and Grönlund, 1996). The region of the sampled lakes was situated in the northern part of a waterway connecting Lake Ladoga and the Baltic Basin, in an area characterized by an archipelago and long fjords extending deep inland (Figure 1b). LI was part of a wider north-west–south-east-oriented elongated bay, while BZL, located in a deep valley, was close to its present shape, but remained connected with Ancient Lake Ladoga during the Neolithic (Figure 2). The formation of a new outlet, the river Neva, to the southern coast of Lake Ladoga between 1460 and 1300 BC led to a rapid change in the water level of the Ladoga Basin. The initial drop was even more than 10 m, after which the water level gradually sank to the present level (Dolukhanov et al., 2009; Saarnisto, 2008; Saarnisto and Grönlund, 1996). On the Isthmus, this meant that several lakes now became isolated, including LI and BZL.
The shores of Ancient Lake Ladoga and the labyrinthine water route cutting through the Karelian Isthmus created favourable conditions for Stone Age foragers. Based on current knowledge, the area around and between BZL and LI was utilized from at least the seventh to the third millennium BC, and also later (Alenius et al., 2020; Halinen and Mökkönen, 2009; Nordqvist and Lavento, 2008; see also Figure 2 and below). Nevertheless, the archaeological data from the area is incomplete, and the known sites provide snapshots of a few site types of different ages located in different environmental zones (Halinen and Mökkönen, 2009).
Materials and methods
Fieldwork and laboratory work
At BZL, the sediment cores were taken from a bay (about 27 ha in size) at the south-western end of BZL, next to the vast Stone Age site of Bolshoye Zavetnoye 3–4, at a spot where the water depth was 3.80 m. The age-depth model, which is based on nine AMS dates of the core samples, suggests a continuous sedimentary archive from about 7540 BC to 1811 BC with an average deposition rate of 0.22 mm/year. (Figure 2; see Alenius et al., 2020 for further description of the site and age-depth model). All pollen data (presented as conventional pollen percentages and concentrations) are published in Alenius et al. (2020).
At LI, the sedimentary cores have been collected in the central part of the lake at a water depth of 3.2 m from the ice surface; a Russian-type peat corer has been used for the coring. In total, a 6.2 -m-long sediment record has been retrieved. The sediment consists of a clay gyttja that turns to homogenous brown and dark brown gyttja in the upper part of the core, and corresponds to seven sedimentary cores that partly overlap: core 1 (8.47–9.47 m), core 2 (3.24–4.20 m), core 3 (4.10–5.10 m), core 4 (5.00–6.00 m), core 5 (5.90–6.90 m), core 6 (6.80–7.80 m) and core 7 (7.70–8.70 m). The sediment sequence was dated by means of 11 accelerator mass spectrometry (AMS) dates obtained from 1 -cm-thick bulk sediment samples. The age-depth model was created with OxCal using the deposition model P Sequence (Bronk-Ramsey, 2008). Sediment subsamples of 1 cm3 were taken at a resolution of 1 cm for pollen and charcoal particle analysis (e.g. Bennett and Willis, 2001; Whitlock and Larsen, 2001). Subsamples for pollen analysis were prepared following standard procedures using glycerine as a mounting medium (e.g. Berglund and Ralska-Jasiewiczowa, 1986). No acetolysis treatment was used. Lycopodium spores (Stockmarr, 1971) were added for the calculation of the pollen and charcoal particle concentrations. At least 700 arboreal pollen grains (AP) were counted from each sample. The samples were counted at every centimetre from the part that covers the period ca 5000–2000 BC. The identification of pollen and spores was based on identification keys published by Erdtman et al. (1961), Fægri and Iversen (1989), Moore et al. (1991), Reille (1992, 1995) and Beug (2004). Pollen percentages and pollen concentrations (grains/cm3) were calculated. Pollen percentages were calculated from the total sum of terrestrial pollen grains (P): P = AP + NAP; AP corresponds to arboreal pollen and NAP to non-arboreal pollen. The percentages of aquatic pollen and spores were also calculated from the sums P + aquatic pollen and P + spores. The charcoal particles >10 μm (measured along the longest axis) were counted on pollen slides and divided into two size classes: 10–30 and >30 µm (Tolonen, 1986). Charcoal results were expressed as microcharcoal concentration (i.e. number of fragments/cm3).
The landscape reconstruction algorithm (LRA)
The LRA approach (Sugita, 2007b) aims at reducing biases in inter-taxonomic differences in pollen production, dispersal and deposition mechanisms. This approach consists of two submodels. The first submodel is REVEALS, which reconstructs the plant cover at a regional scale for a radius of ca 50–100 km around a large lake (sizes > 50 ha) or a mix of several small lakes and/or bogs (size < 50 ha; Marquer et al., 2014, 2017; Trondman et al., 2015, 2016). REVEALS estimates correspond to the regional background of pollen that is used to run the second submodel, LOVE. The LOVE model provides estimates of local plant cover in terms of distance-weighted abundance of plant taxa within the relevant source area of pollen (RSAP; see Sugita, 2007b). The RSAP corresponds to the spatial resolution of the LOVE estimates.
The LRA was applied for a selection of taxa for which the RPPs (relative pollen productivity estimates) and the fall speeds of pollen (m/s) are available; RPPs and the fall speeds of pollen are critical parameters for running the LRA. Twenty-three pollen types are considered in the present study. We used RPPs (and their standard errors) and fall speeds of pollen estimates from the LANDCLIM standard 2 dataset (Mazier et al., 2012) that has been largely used in the framework of the LANDCLIM project (e.g. Marquer et al., 2017; Trondman et al., 2015). Note that a new set of RPPs (Serge et al., 2023) has been recently published and it was not available at the time that the present study was performed. However, we do not expect the results to differ dramatically as only minor changes have been made, and the major improvement was the addition of RPPs from the Mediterranean taxa. Information about RPPs and the fall speed of pollen are provided in ESM 1.
The higher the pollen counts, the smaller the error estimates of the LRA will be Sugita (2007a, 2007b). We therefore grouped the pollen counts of successive stratigraphic samples per time window. In our case, a good compromise for maximizing both the temporal resolution and the reliability of the LRA estimates is a time window of 100 years. By using this time interval, the minimum pollen counts are 625 and 754 for BZL and LI, respectively; the mean pollen counts are 2277 for BZL and 9144 for LI. For the REVEALS runs, we used the same pollen sites as those published in Alenius et al. (2020) with the addition of Huhdasjärvi A, Huhdasjärvi C, and Katajajärvi; the REVEALS settings are the same as in Alenius et al. (2020). Additional information about sites and REVEALS runs can be found in Figure 1 and Table 1. These REVEALS estimates are then used as inputs in the LOVE model. For the LOVE model, a pollen record from BZL is used to estimate the local vegetation around this site. The LOVE model can be applied using a single pollen record, but the RSAP cannot be calculated based on a single site. We therefore use six different fixed RSAPs for the LOVE runs as potential scenarios: 500, 1000, 1500, 2000, 2500 and 3000 m. Note that an RSAP of 1400 m has been considered in Alenius et al. (2020). O’Dwyer et al. (2021) have a range of RSAPs between 555 and 2715 m for a basin size greater than 10 ha situated in southern Sweden, and Poska et al. (2011) show that RSAPs of small lakes in Estonia are about 1500–2000 m. A principal components analysis (PCA) has been performed to explore the differences in the use of different RSAPs for Lake Bolshoye Zavetnoye LOVE reconstructions; the LOVE estimates have been previously transformed using a square-root transformation to stabilize variances and the calculations are implemented using CANOCO 5 for Windows (Lepš and Šmilauer, 2014). The same parameters (e.g. Zmax, wind speed and so on) as those used by Marquer et al. (2014, 2017, 2020a) and Trondman et al. (2015, 2016), as examples, have been used to run the LRA models. The dispersal model used for all runs is a Gaussian Plume model; see Marquer et al. (2020b) for the pros and cons of using this dispersal modelling scheme. Version v6.2.4 of the LRA models has been used in this study. Because the basin size of the LI is unknown for the study period (see previous section), no pollen-based modelling approaches have been used for this site, and the discussion only considers untransformed pollen data.
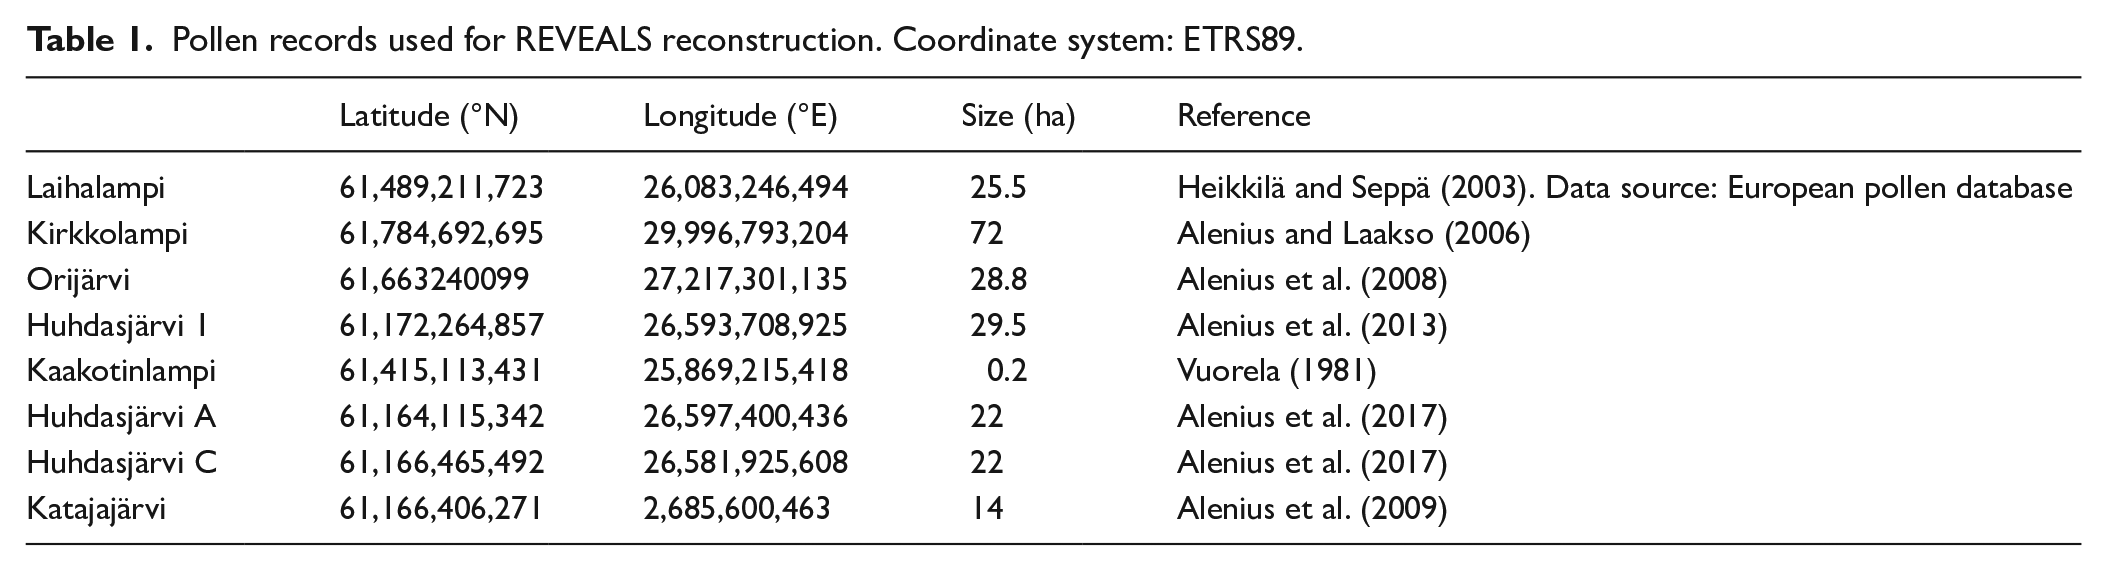
Pollen records used for REVEALS reconstruction. Coordinate system: ETRS89.
Indices of vegetation compositional change
Indices of vegetation compositional change have been calculated based on untransformed pollen data for BZL and LI and on LOVE estimates for BZL. These indices were also calculated for the regional vegetation, REVEALS and untransformed data. Note that using untransformed pollen data to calculate vegetation composition indices provides an assessment of vegetation change based on a larger number of pollen types than using the LRA estimates. The number of taxa considered by the LRA is restricted to the availability of input data, for example, RPPs and the fall speed of pollen. The pros and cons of using plant composition indices based on different sources of data have been discussed elsewhere (e.g. Marquer et al., 2014). In this study, we calculated (1) the rate of compositional change (Jacobson and Grimm, 1986), (2) turnover (cf. Birks and Birks, 2008; Vellend, 2001), (3) evenness (equitability) index (Magurran, 2004) and (4) palynological richness (Birks and Line, 1992). For methodological details about (1), (2) and (3), see Marquer et al. (2014, 2017). Considering the calculation of the palynological richness, the sample size has to be standardized for comparing different samples to each other. This must be done because the number of pollen types increases with sampling effort and a comparison should be based on the same sample size. The calculation of palynological richness has been performed by using the rarefaction analysis and the function Rarefy in the vegan package (Oksanen, 2017).
CONISS analyses
In order to identify periods of similar vegetation composition, a stratigraphically constrained cluster analysis (CONISS; Grimm, 1987) is used based on the pollen count data for LI and all pollen-based modelling outcomes.
Archaeological data
Archaeological data consist of stray finds collected by laypersons and sites located during archaeological fieldwork (see Halinen et al., 2008; Halinen and Mökkönen, 2009; Lavento et al., 2001; Nordqvist and Lavento, 2008). To compare the archaeological data with the LOVE scenarios (i.e. different fixed RSAPs for the LOVE runs), Stone Age material has been grouped by rings of incremental distances around BZL and LI (1, 2 and 3 km), including nearly 30 Stone Age settlement sites and stray finds (mainly ground stone tools) (Table 2 and Figure 2). Settlement sites are a diverse group of monuments, ranging from small temporary and short-lived camping places and activity loci to spatially extensive settlement sites (base camps) with stationary housing structures (e.g. semi-subterranean pithouses) that may have been used for longer periods of time, recurrently, or re-visited even over several centuries or millennia. The impact the different sites had on their environment and vegetation was dependent on the duration and intensity of use, population size, season of use, and activities performed on the site, including building and maintenance of structures (see also Wacnik et al., 2020; Wieckowska-Lüth et al., 2018). Stray finds add a layer of general human presence to the area, even if their dating and other details are often approximate. Uncertain chronology also applies to many sites that have not been excavated, and only 11 settlements can be securely dated to the Neolithic (some with multiple habitation phases) based on finds and/or radiocarbon dates: the sites in the BZL area broadly cover the entire period, but around LI the datable settlements belong to the fourth millennium BC.
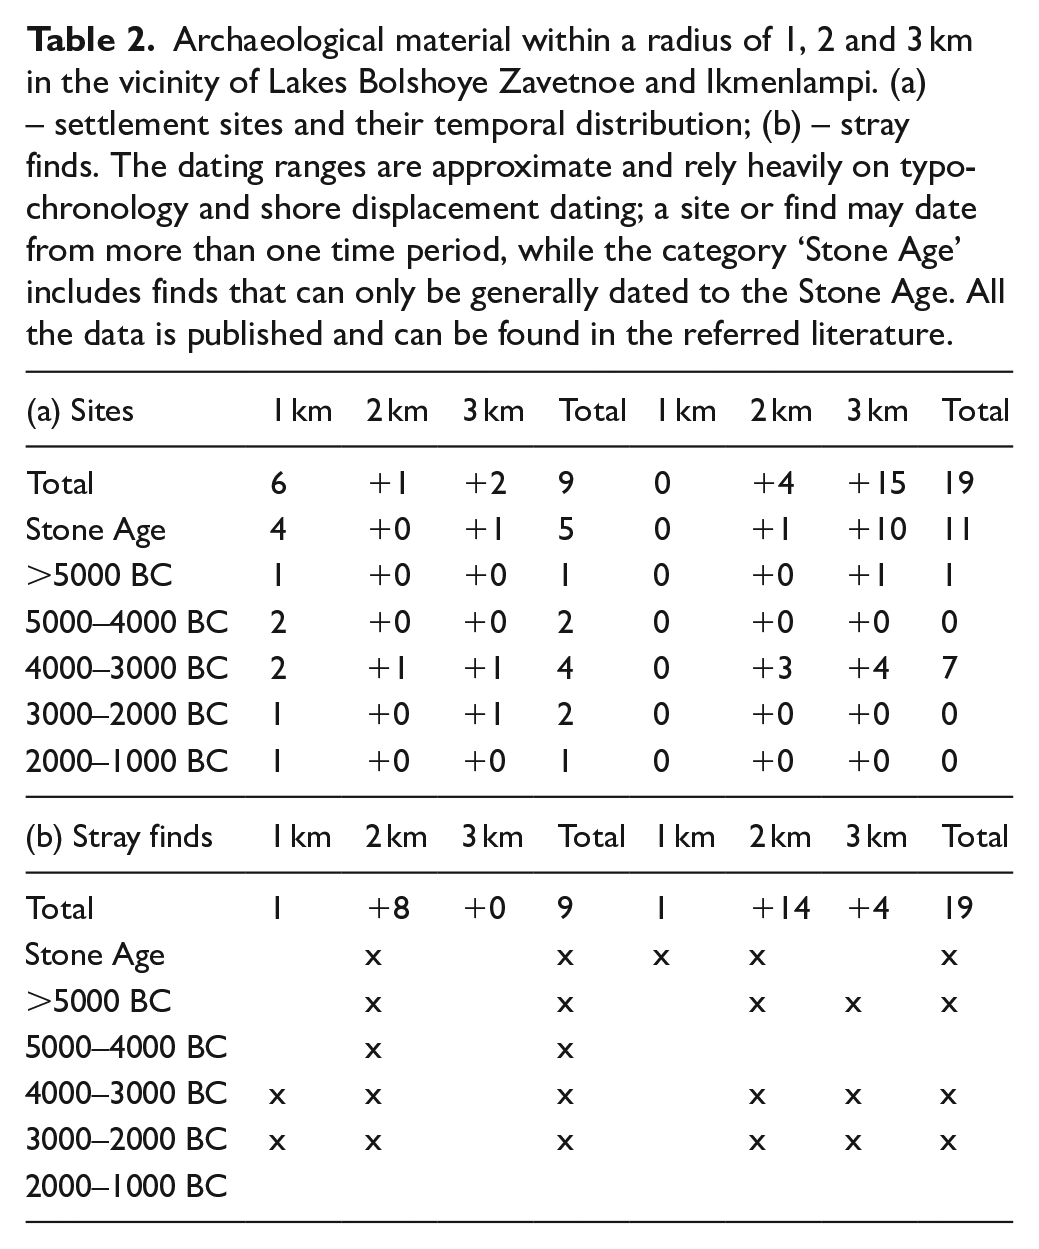
Archaeological material within a radius of 1, 2 and 3 km in the vicinity of Lakes Bolshoye Zavetnoe and Ikmenlampi. (a) – settlement sites and their temporal distribution; (b) – stray finds. The dating ranges are approximate and rely heavily on typo-chronology and shore displacement dating; a site or find may date from more than one time period, while the category ‘Stone Age’ includes finds that can only be generally dated to the Stone Age. All the data is published and can be found in the referred literature.
Results
Lake Ikmenlampi (LI)
Chronology
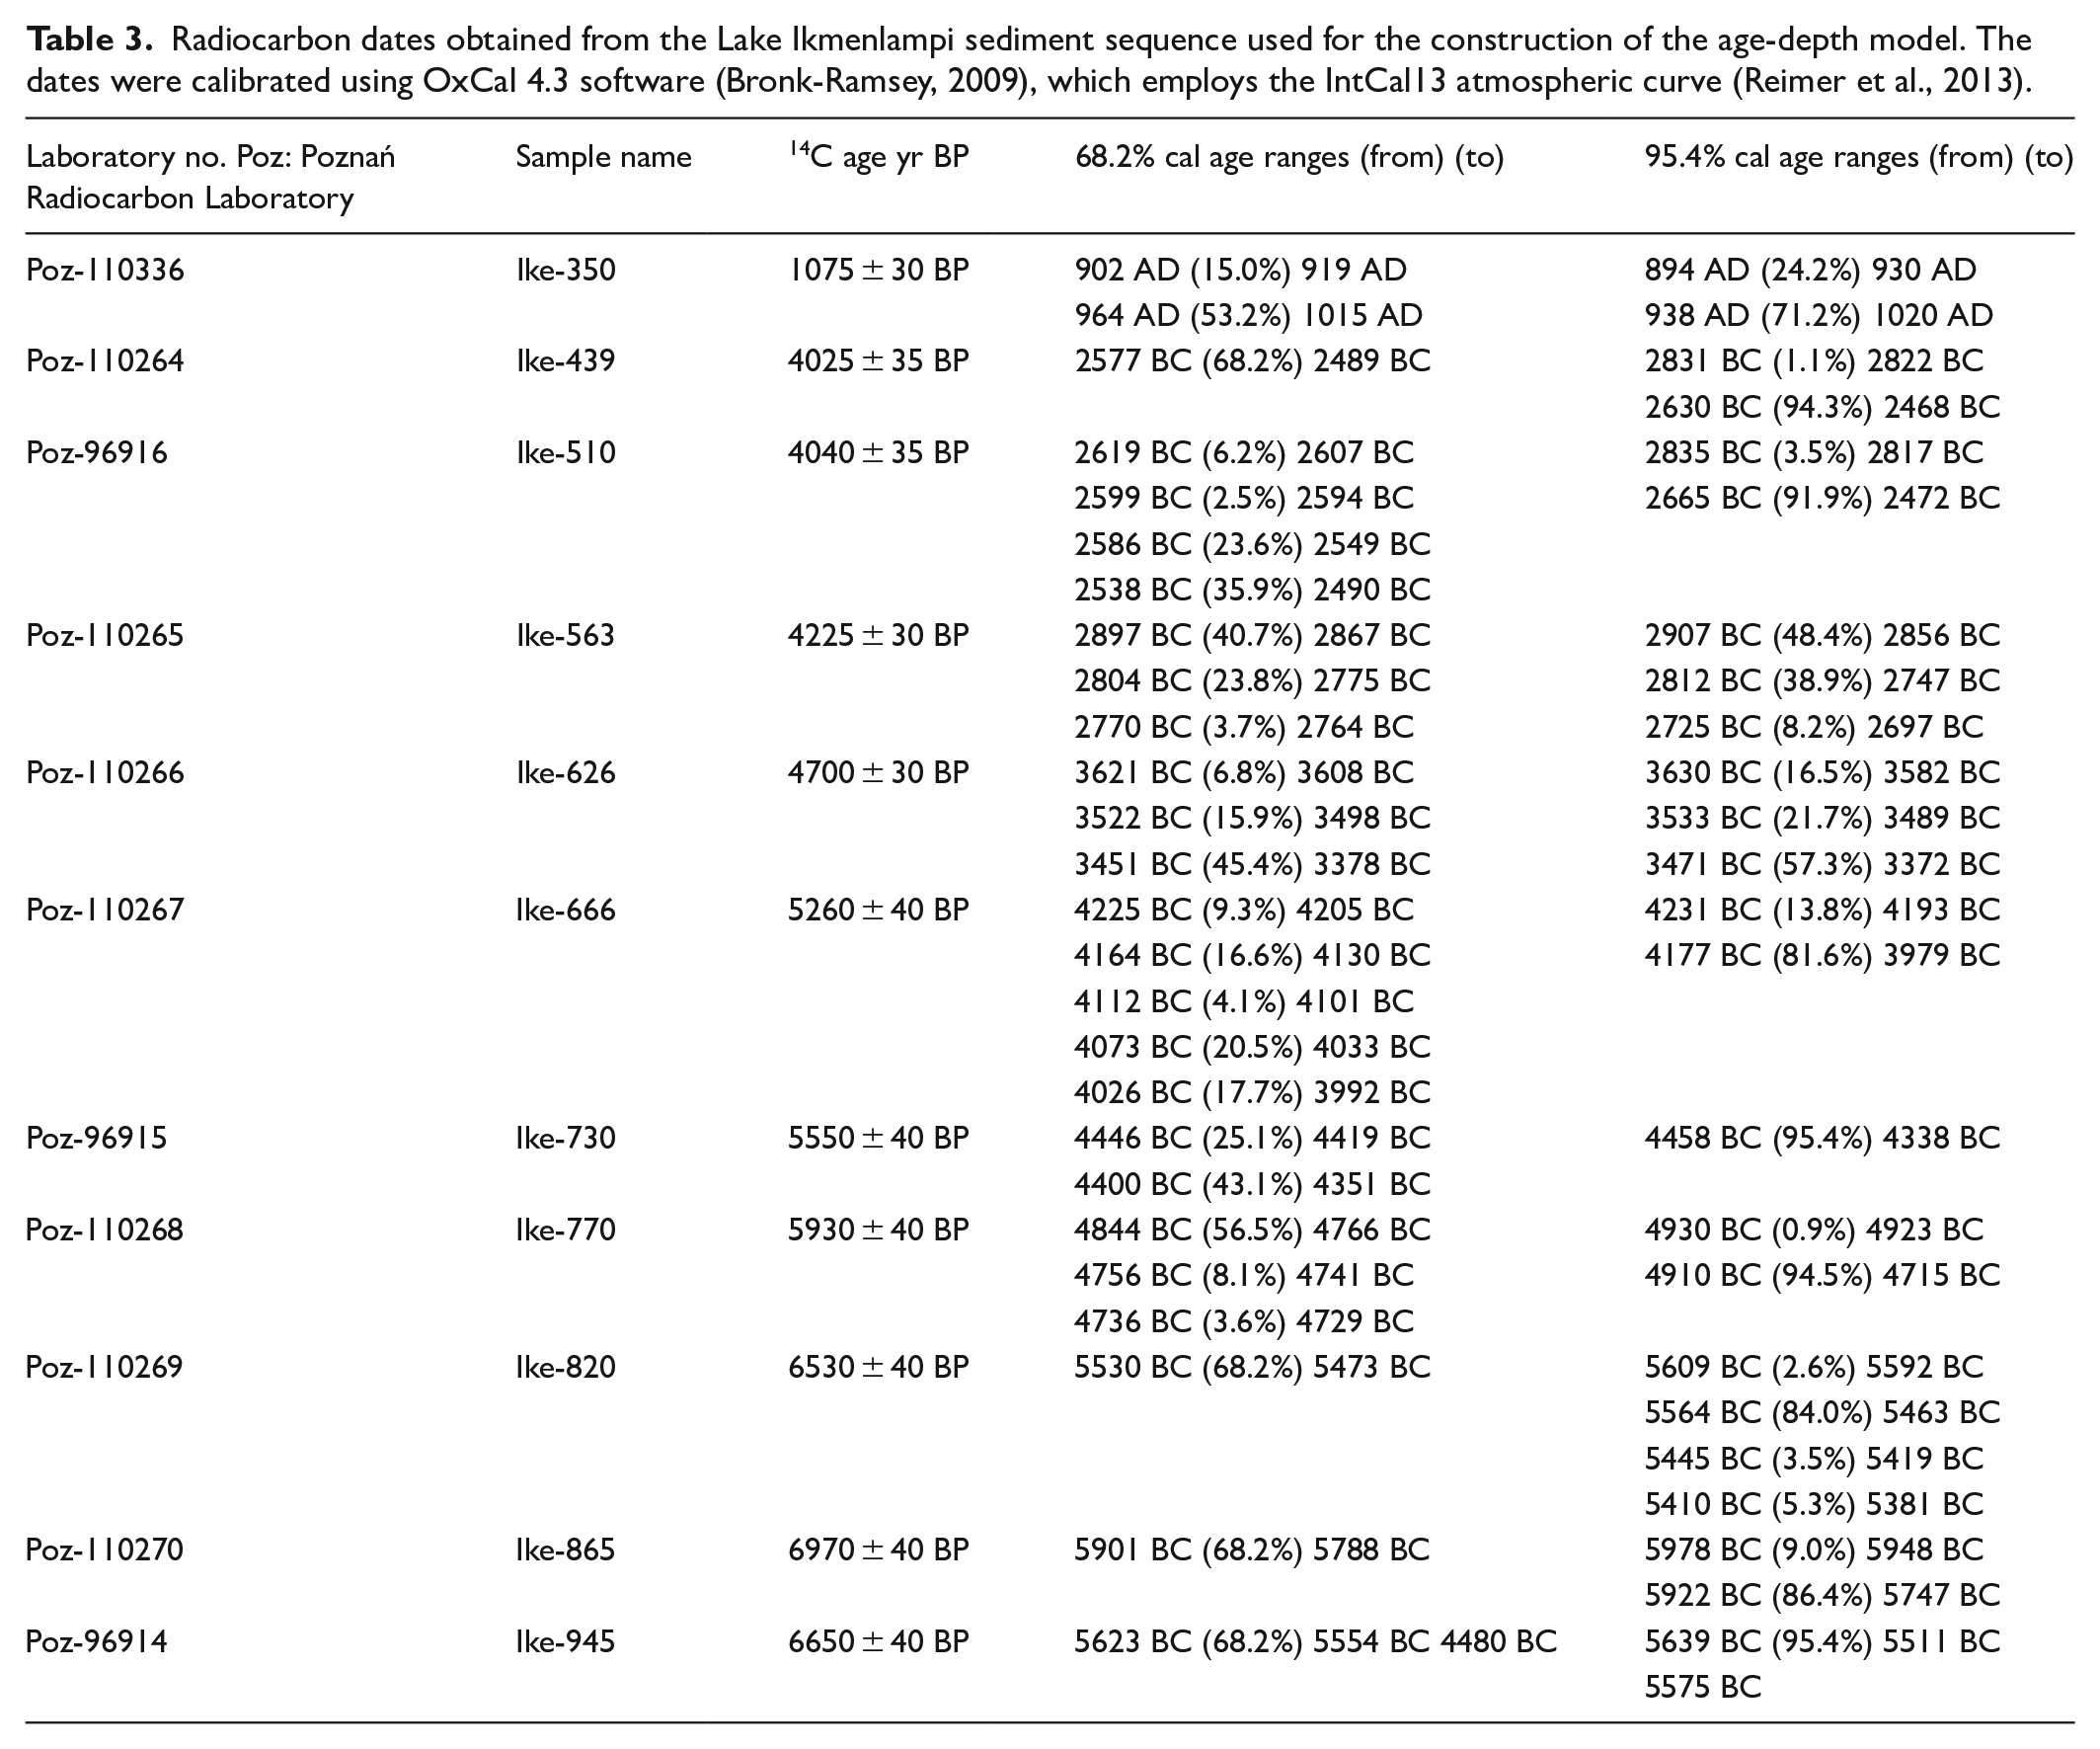
The age-depth model is based on 11 AMS dates (Table 3). The age-depth model (Figure 3) suggests an average deposition rate of 1.2 mm/year between about 4745 BC (761 cm) and 1955 BC (428 cm).
Radiocarbon dates obtained from the Lake Ikmenlampi sediment sequence used for the construction of the age-depth model. The dates were calibrated using OxCal 4.3 software (Bronk-Ramsey, 2009), which employs the IntCal13 atmospheric curve (Reimer et al., 2013).
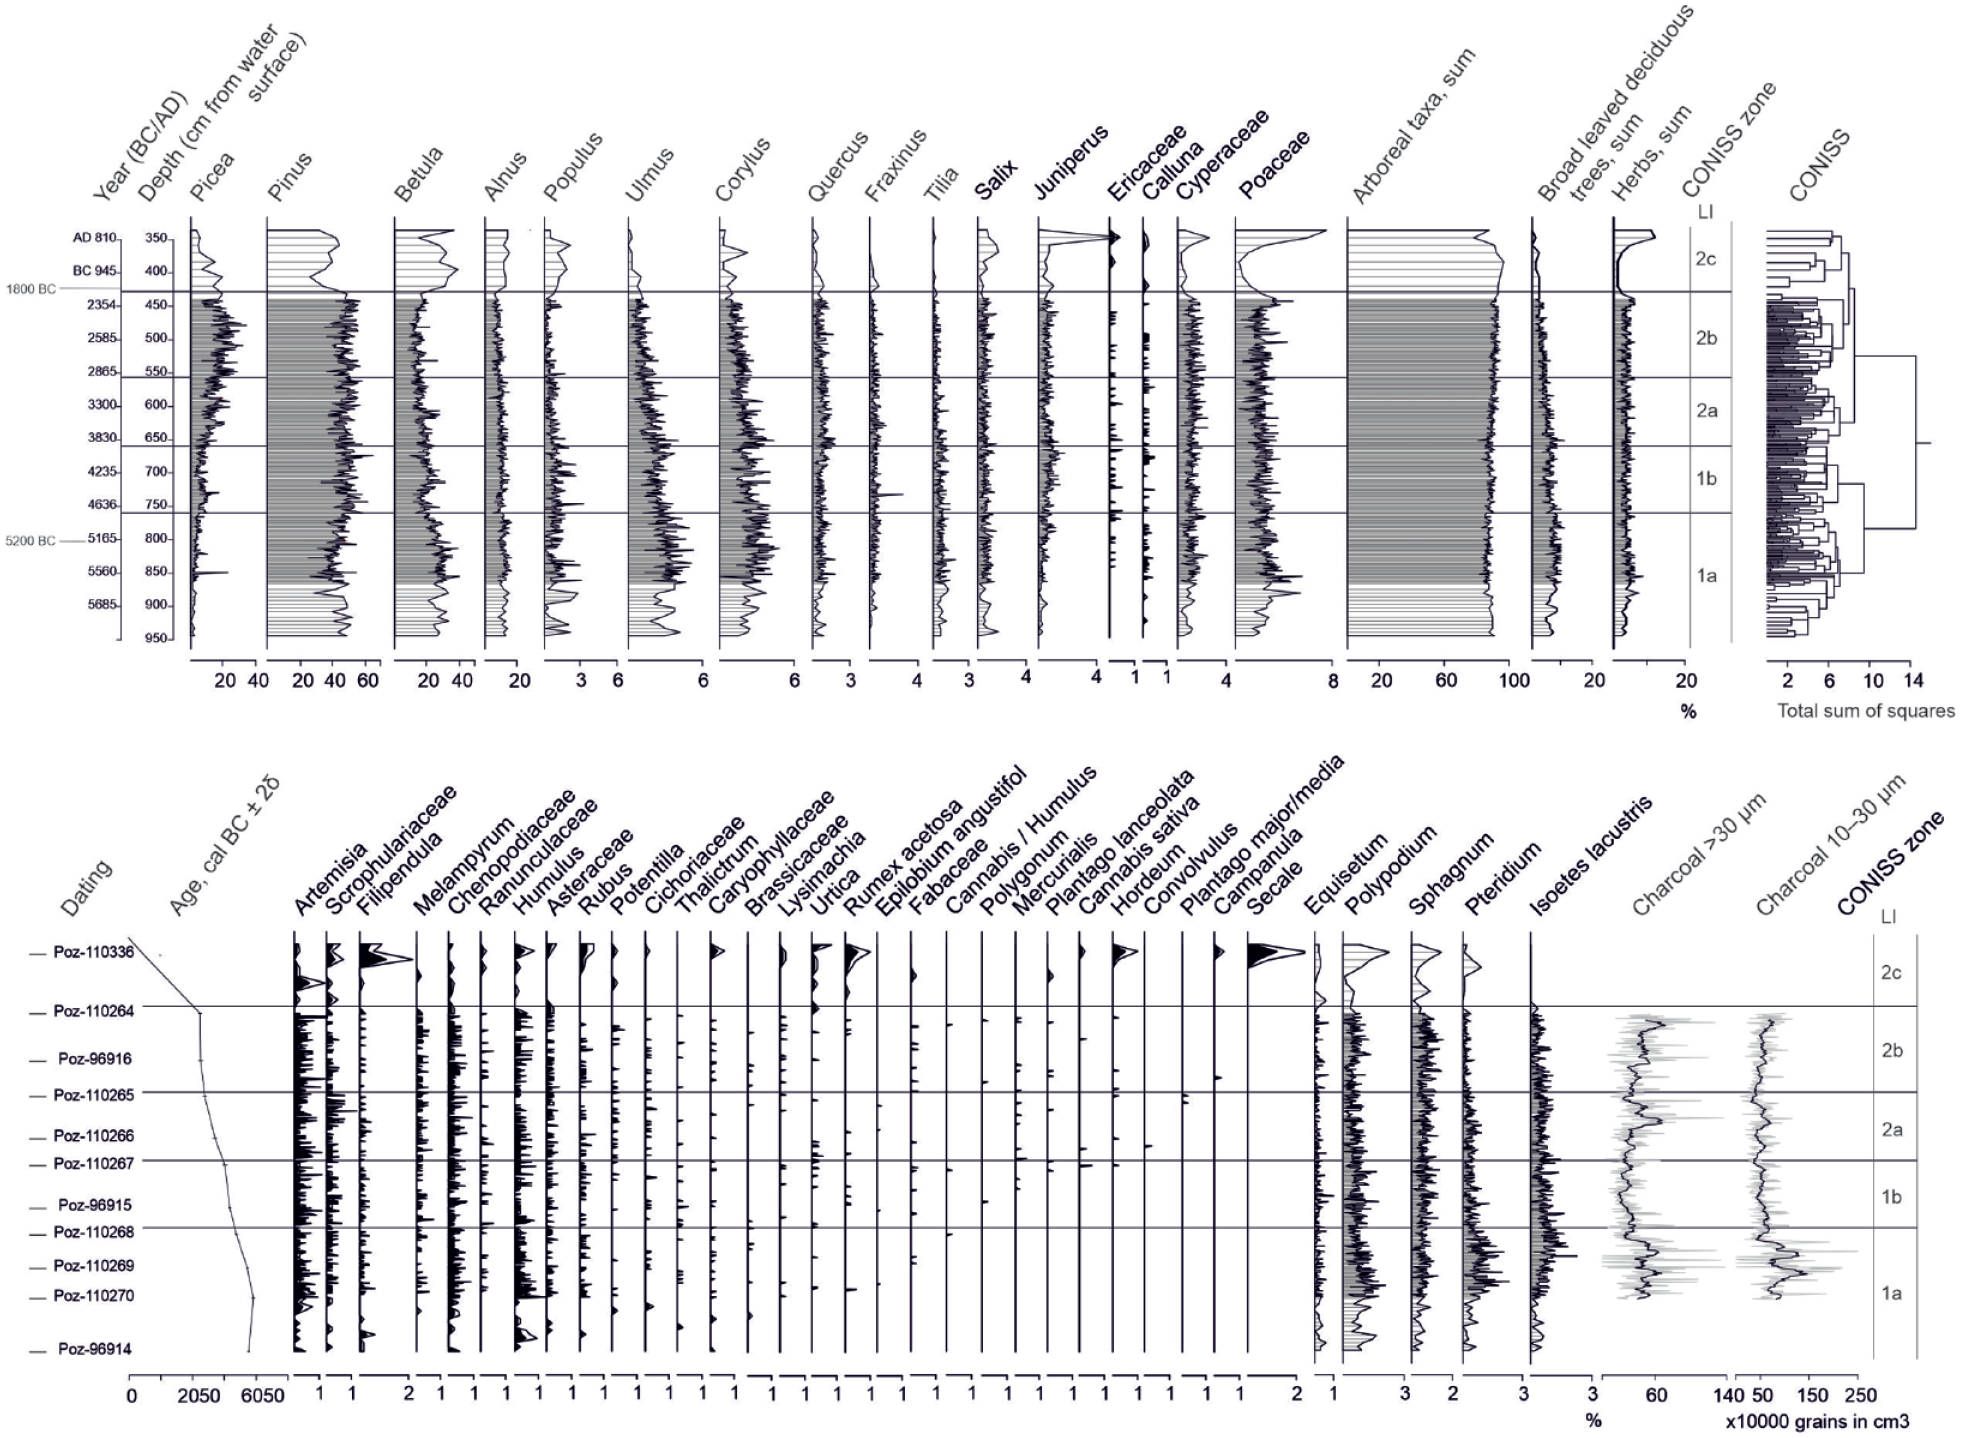
Lake Ikmenlampi: Age-depth model (see Table 3), pollen percentages (untransformed pollen data), charcoal concentrations and CONISS zones. The age-depth model was created with OxCal using the deposition model P Sequence (Bronk-Ramsey, 2008).
Pollen percentages and charcoal concentrations
According to the CONISS analysis, five zones of similar vegetation composition (LI 1a–b, 2a–c) were identified from LI pollen data (Figure 3). Zone Ik 1a (5735–4745 BC) corresponds to the highest percentages of deciduous trees (Betula, Alnus, Populus, Ulmus, and Corylus, in particular). Grass pollen has high values, although to a lesser extent than deciduous trees. The percentages of spores are also high compared to the later periods. Zone Ik 1b (4745–3925 BC) is characterized by the rise of Picea and Pinus percentages and the decrease of deciduous trees, grasses, and spores. The first indicators of human presence are also observed (e.g. Plantago, Cannabis, Hordeum). Zones Ik 2a–b (390–1955 BC) correspond to the strong and gradual increase of Picea and the recurrence of land use indicators. The last zone, Ik 2c (1955 BC–AD 785), does not correspond to the study period and is therefore not discussed here. All the pollen percentage results are shown in Figure 3 and detailed in Table 4. For pollen concentrations, see ESM 2. The concentration of charcoal particles (Figure 3) is high in zone Ik 1a, decreases in zone Ik 1b, then gradually rises during the periods covered by zones Ik 2a–b. The charcoal concentrations of both large and small particles show similar trends, although the increase in zone Ik 2b is not as obvious for the small particles.
General descriptions of the dominant pollen types of the pollen assemblage zones (PAZ) based on Coniss -zonation at Lake Ikmenlampi (LI) sediment core. Selected principal anthropogenic pollen types (Behre, 1981) are shown. Anthropochores, species not belonging to the native flora are shown in bold type.
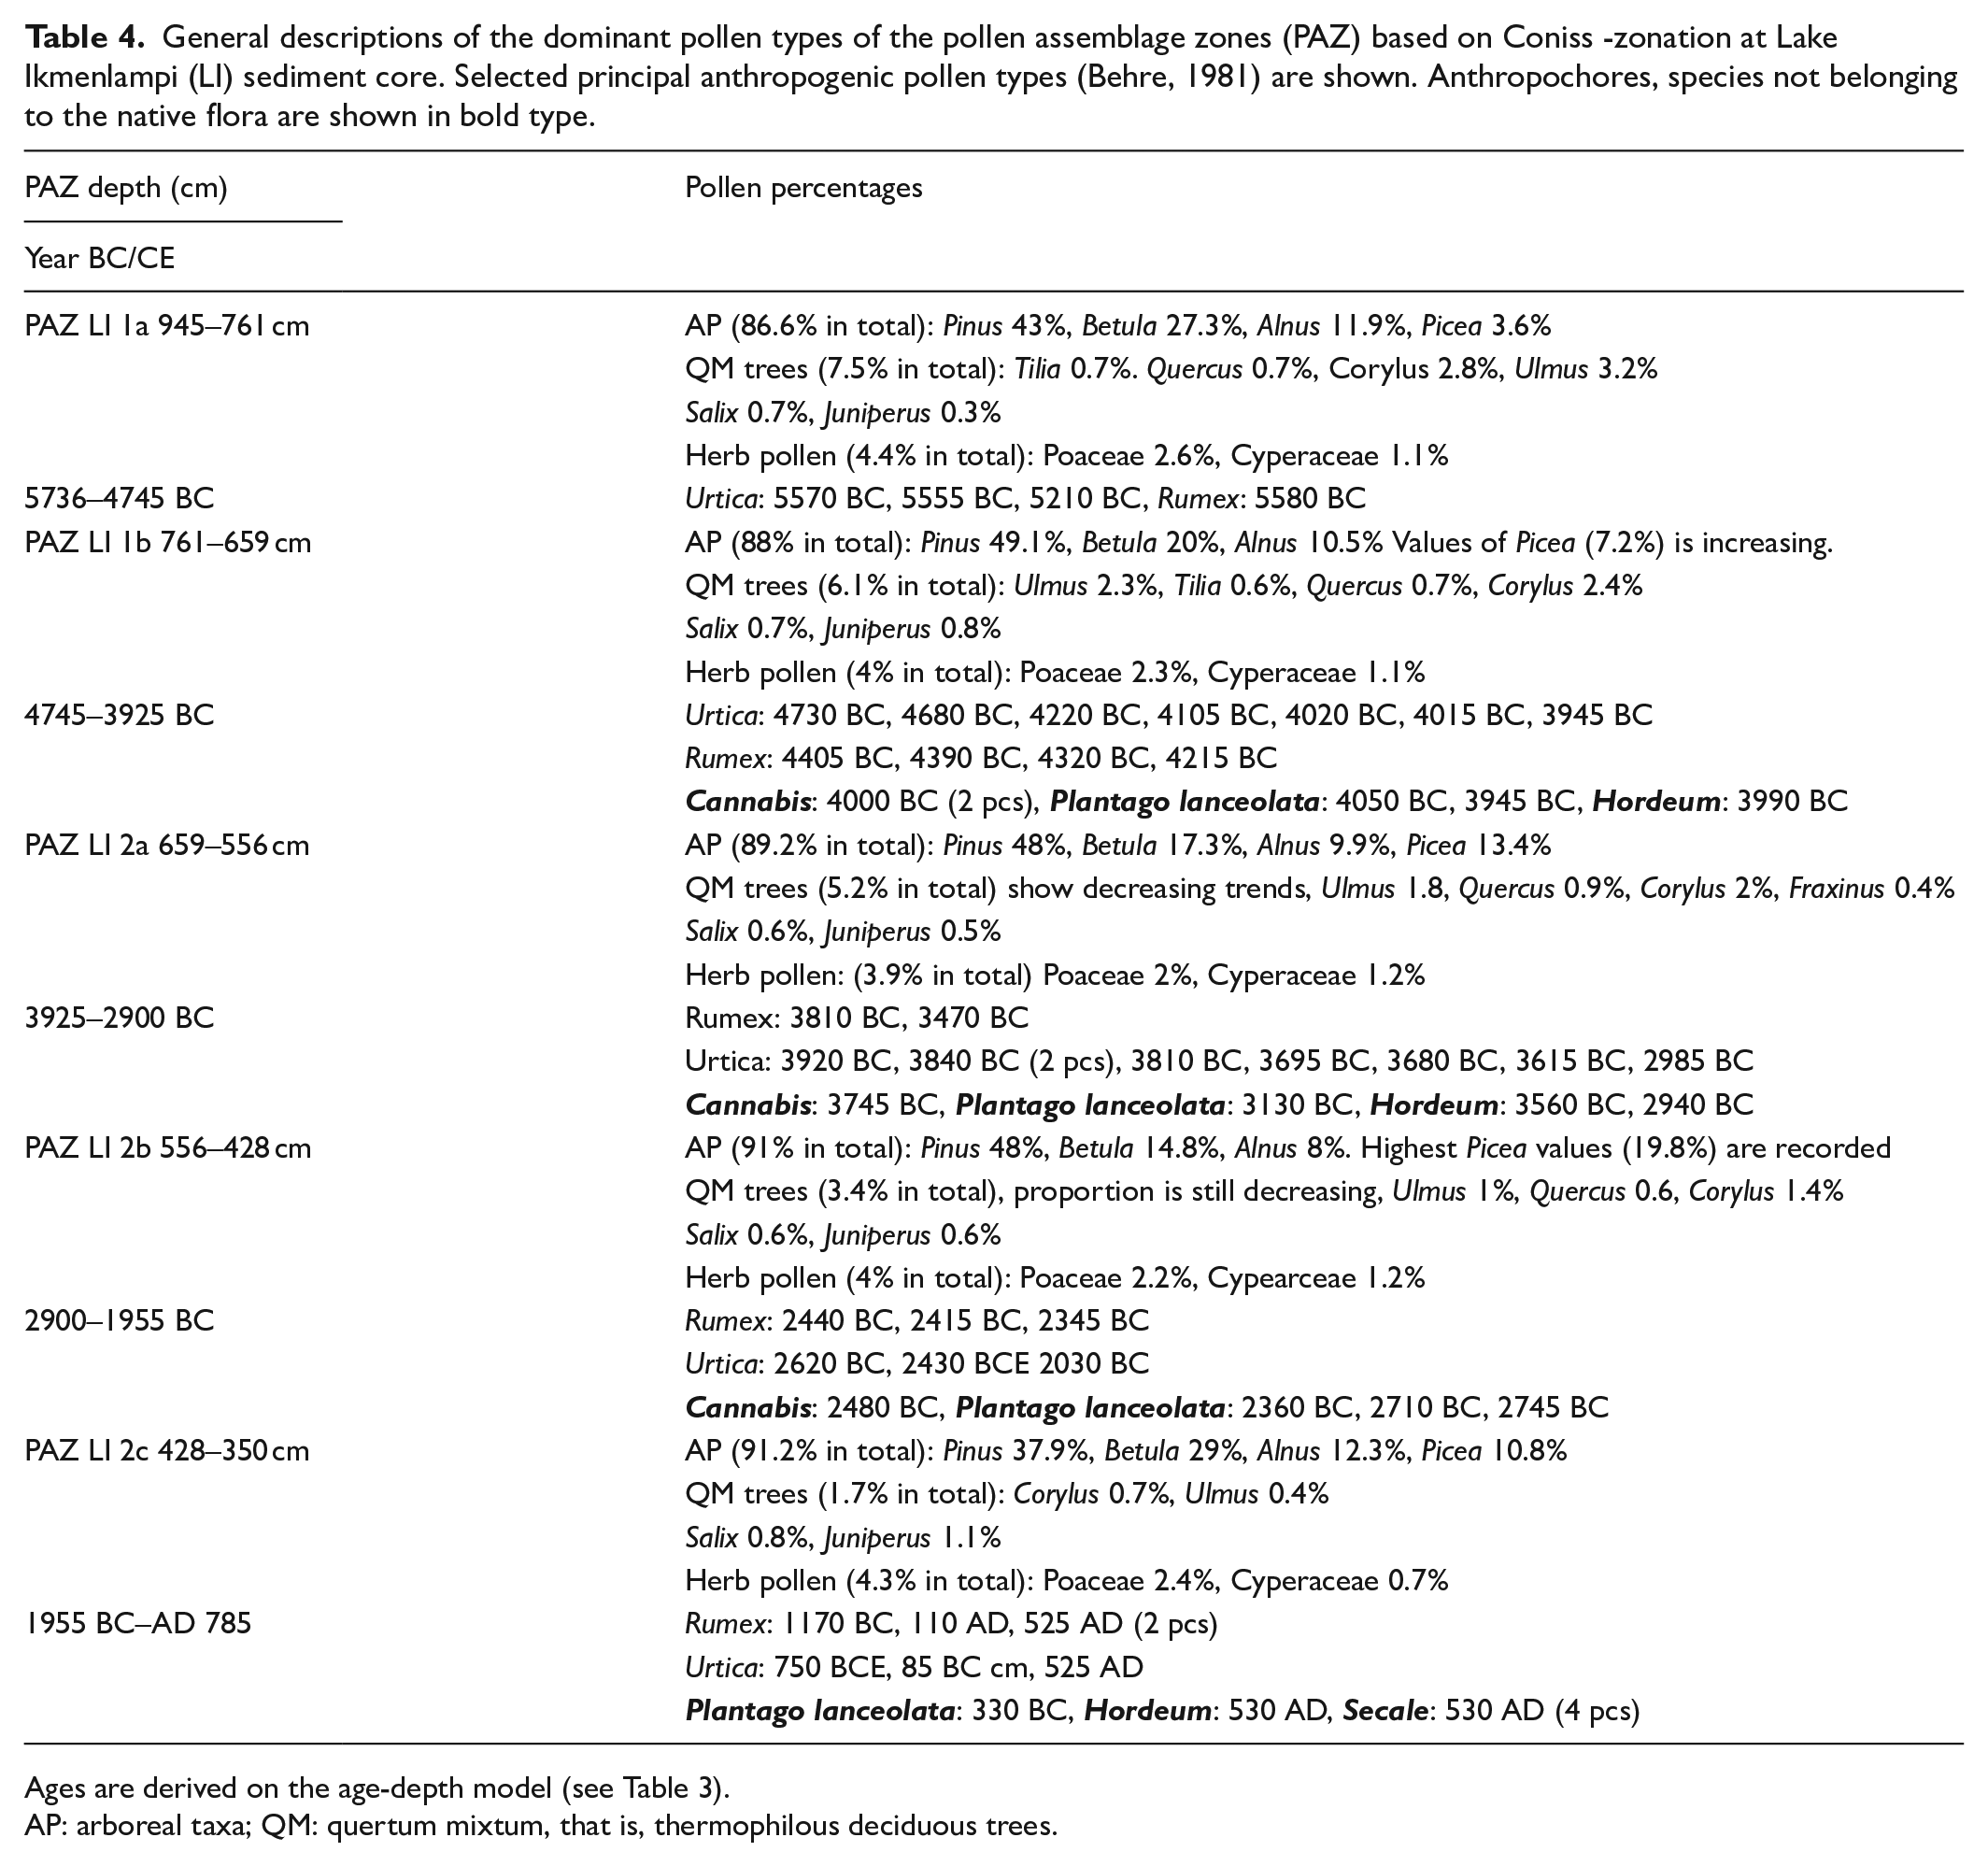
Ages are derived on the age-depth model (see Table 3).
AP: arboreal taxa; QM: quertum mixtum, that is, thermophilous deciduous trees.
REVEALS and LOVE estimates
The application of the CONISS analysis to the REVEALS outcomes reveals four major zones, R1–R4 (Figure 4). R1 (6050–5200 BC), like LI 1a, corresponds to the highest percentages of deciduous trees. R2 (5200–4100 BC) shows a further rise of deciduous trees, in particular for Tilia, Quercus, and Fraxinus. In R3 (4100–2800 BC), Picea and Juniperus increase and most of the deciduous trees decrease. R4 (2800–1750 BC) corresponds to a further rise in Picea. The detailed results of each CONISS zone are described in Table 5.
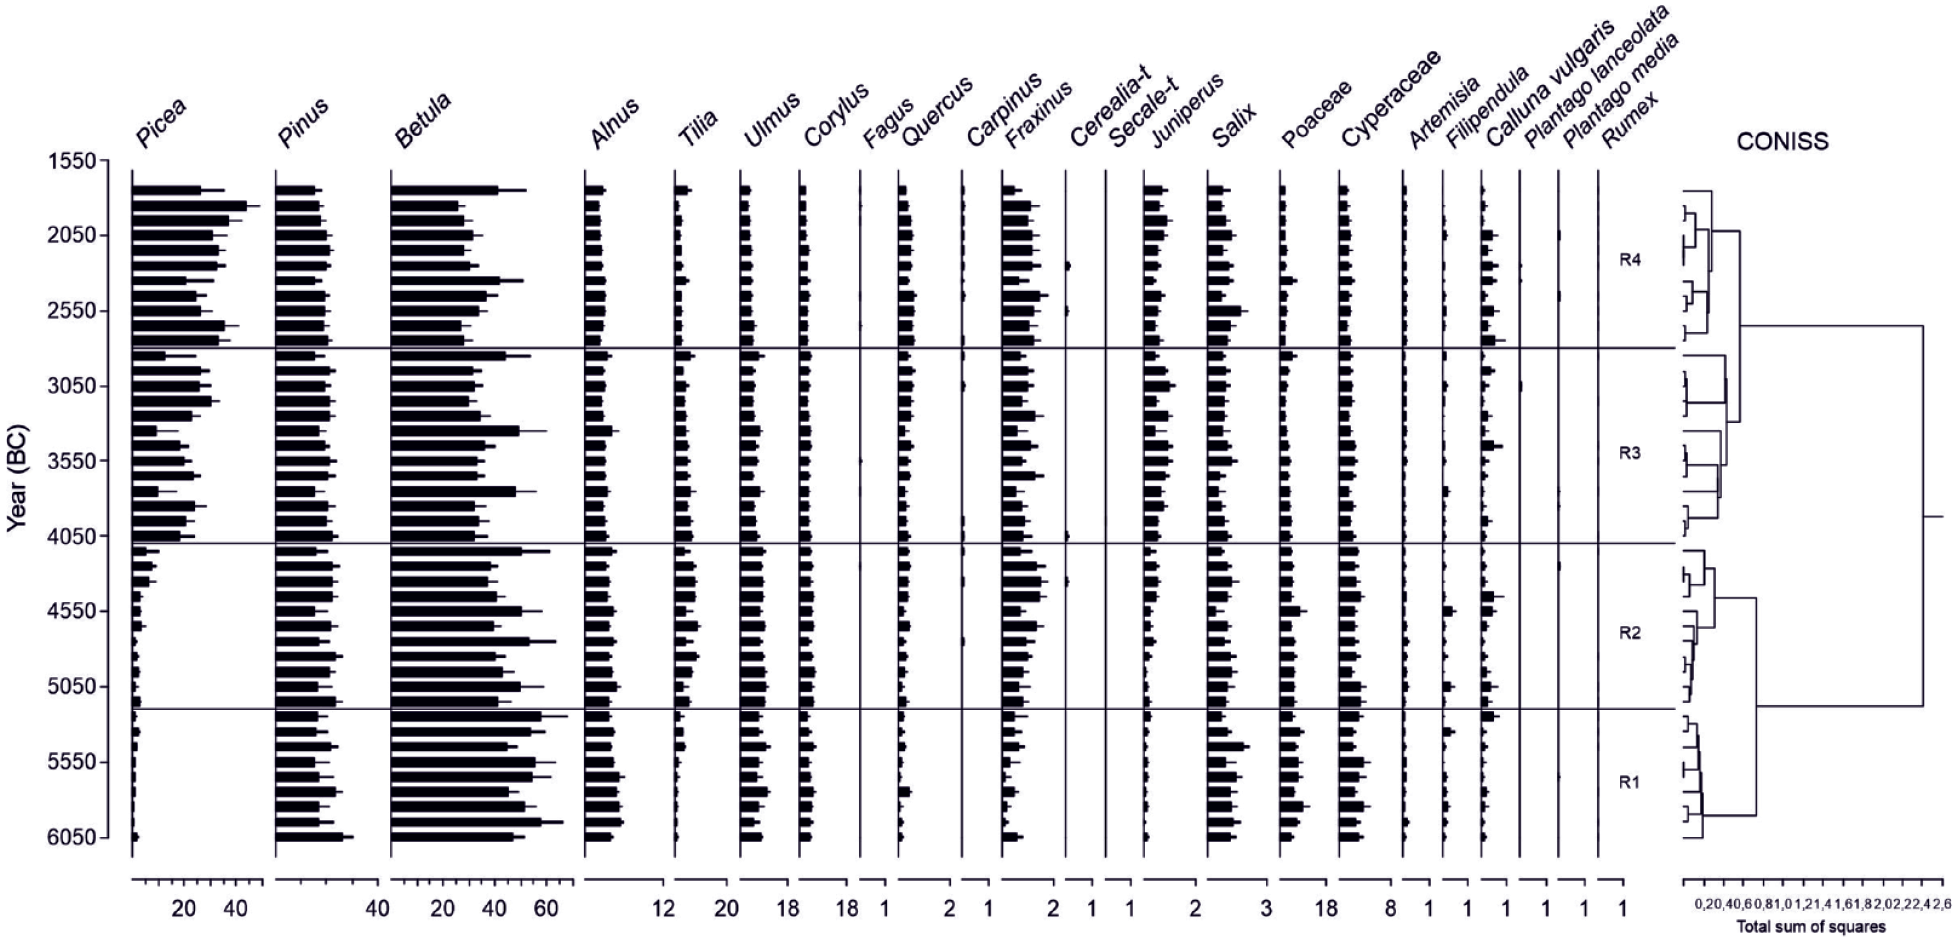
General descriptions of each CONISS zone for the REVEALS and LOVE reconstructions for the RSAP 2000 m.
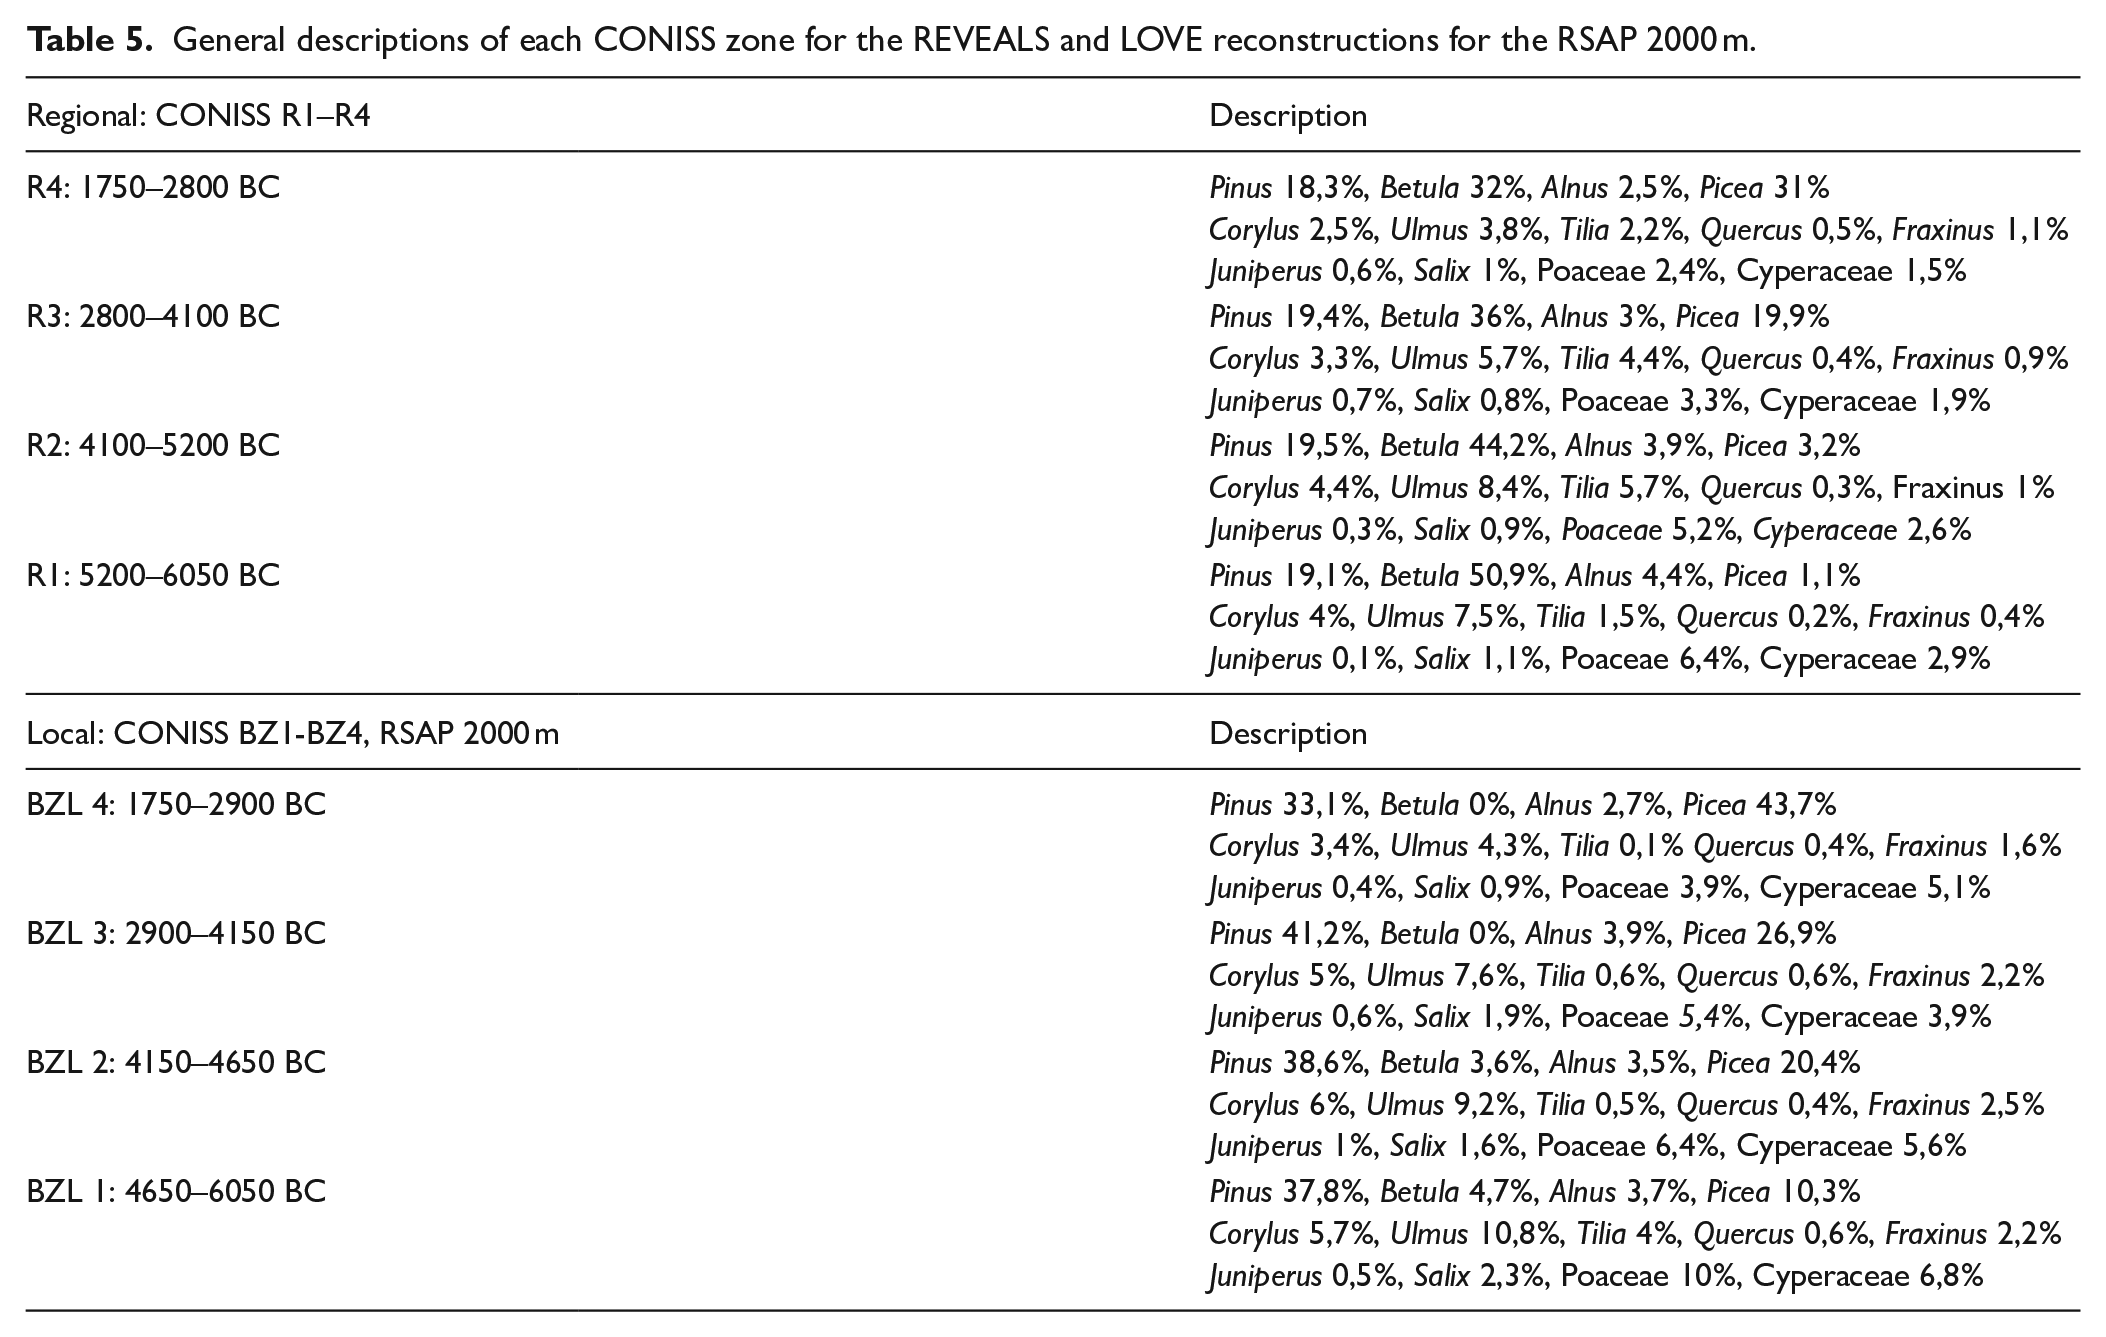
Considering the LOVE estimates for BZL, six different scenarios (i.e. different RSAPs) have been tested. In three scenarios (1000, 2000 and 3000 m), Pinus has the strongest influence in the LOVE reconstructions. Picea has strong influence in the LOVE reconstructions of the late part of the Neolithic, while Tilia and Ulmus have the most influence in the early part of the Neolithic. Betula is absent in RSAP 500 m, and the influence of Betula increases with the RSAPs. The LOVE reconstructions for the RSAP 500, 1000, 1500 and 3000 m scenarios are given in ESM 3. In the core paper, we only show the results for the RSAP 2000 m scenario (Figure 5 and Table 5). This scenario is selected because it is intermediate within the range of all RSAP scenarios.
Local plant abundance around Lake Bolshoye Zavetnoye estimated by the LOVE model with their standard errors. These results are from the LOVE runs using a RSAP of 2 km. The results for other RSAPs are given in ESM 3.
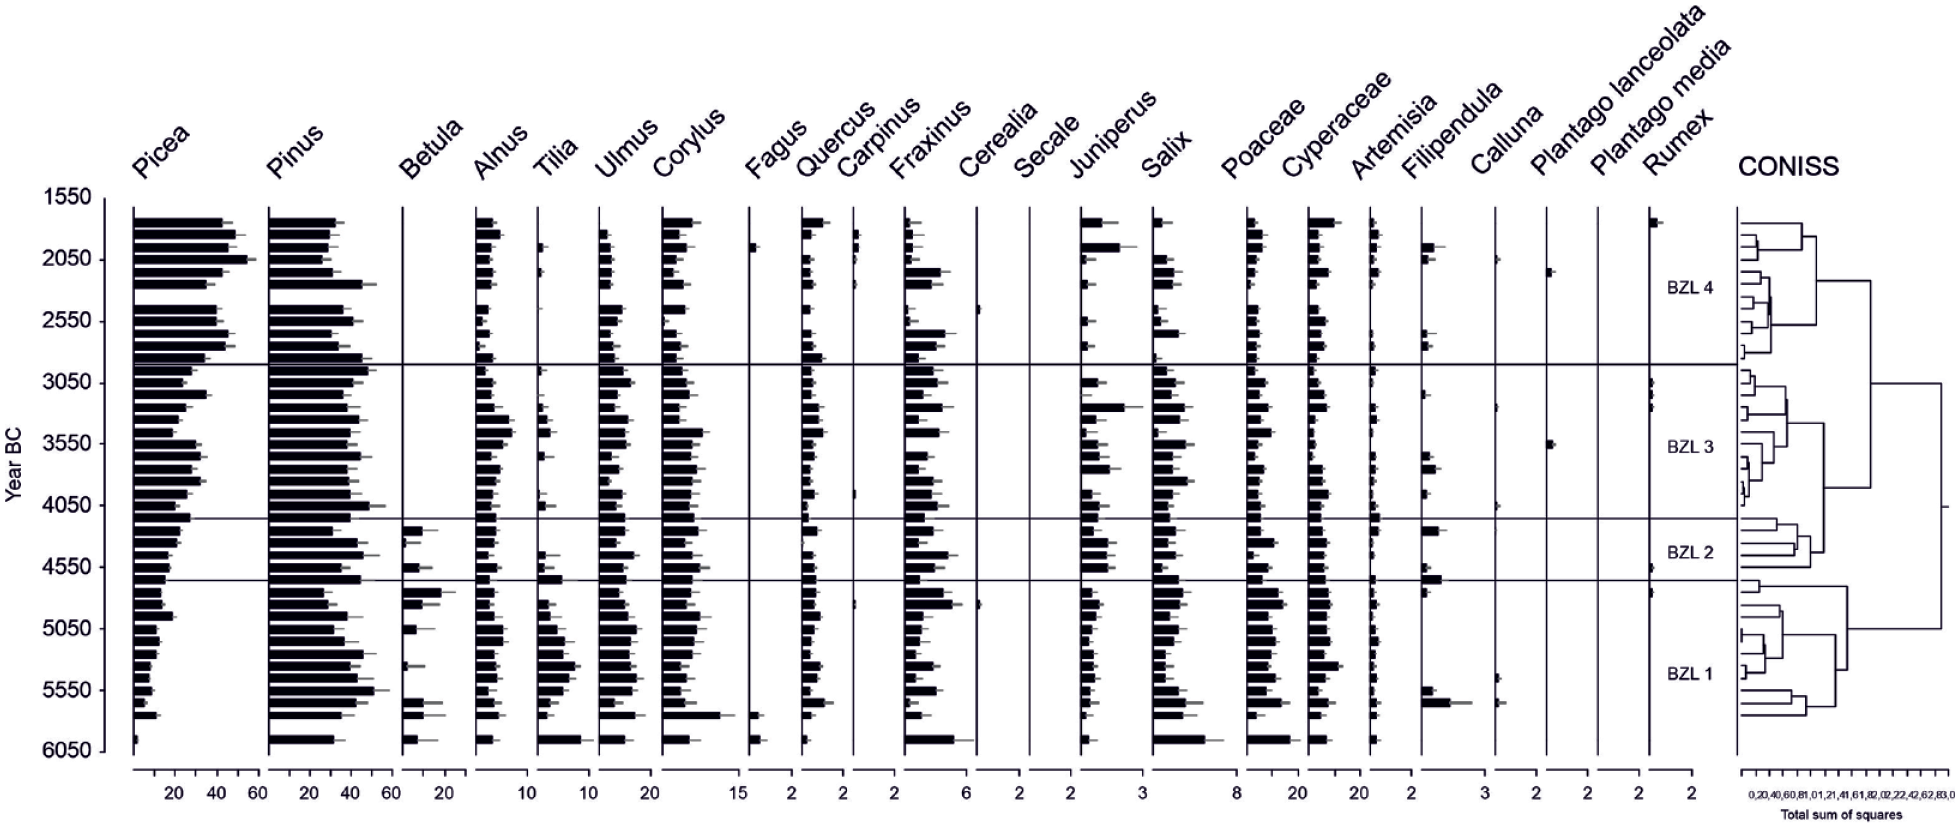
The application of the CONISS analysis to the LOVE outcomes for an RSAP of a 2000-m-radius around BZL reveals four CONISS zones, BZL 1–4. The major differences between the LOVE estimates for BZL and the REVEALS estimates are:
• higher abundances of Picea and Pinus for BZL than in the region.
• earlier abundances of Picea for BZL than in the region.
• Betula is present in low abundances in BZL, and completely absent in BZL 3 and 4.
• earlier presence of Tilia for BZL than in the region, and scarcity in BZL 2, 3 and 4.
• the reduction of deciduous trees from BZL 4 is generally greater at the local scale than the regional scale.
Indices of vegetation compositional change
RV evenness (Figure 6) increased from 6050 BC to 4250 BC, did not change much until 3450 BC, then gradually decreased through the last part of the study period. In comparison, LV evenness for BZL increased until 5050 BC, then decreased. The pattern is similar for all the RSAP scenarios. The RV rate of change was low until 4250 BC, increased until 2750 BC, and then decreased again. The rate of change for BZL (based on LOVE estimates) is higher than at the regional scale, in particular at 5750–5650 BC, 4650–4250 BC, 3550 BC, 2650–2550 BC and 1750 BC. The pattern is similar for all the RSAP scenarios, although quantitative differences can be observed. RV and LV turnover show similar general trends.
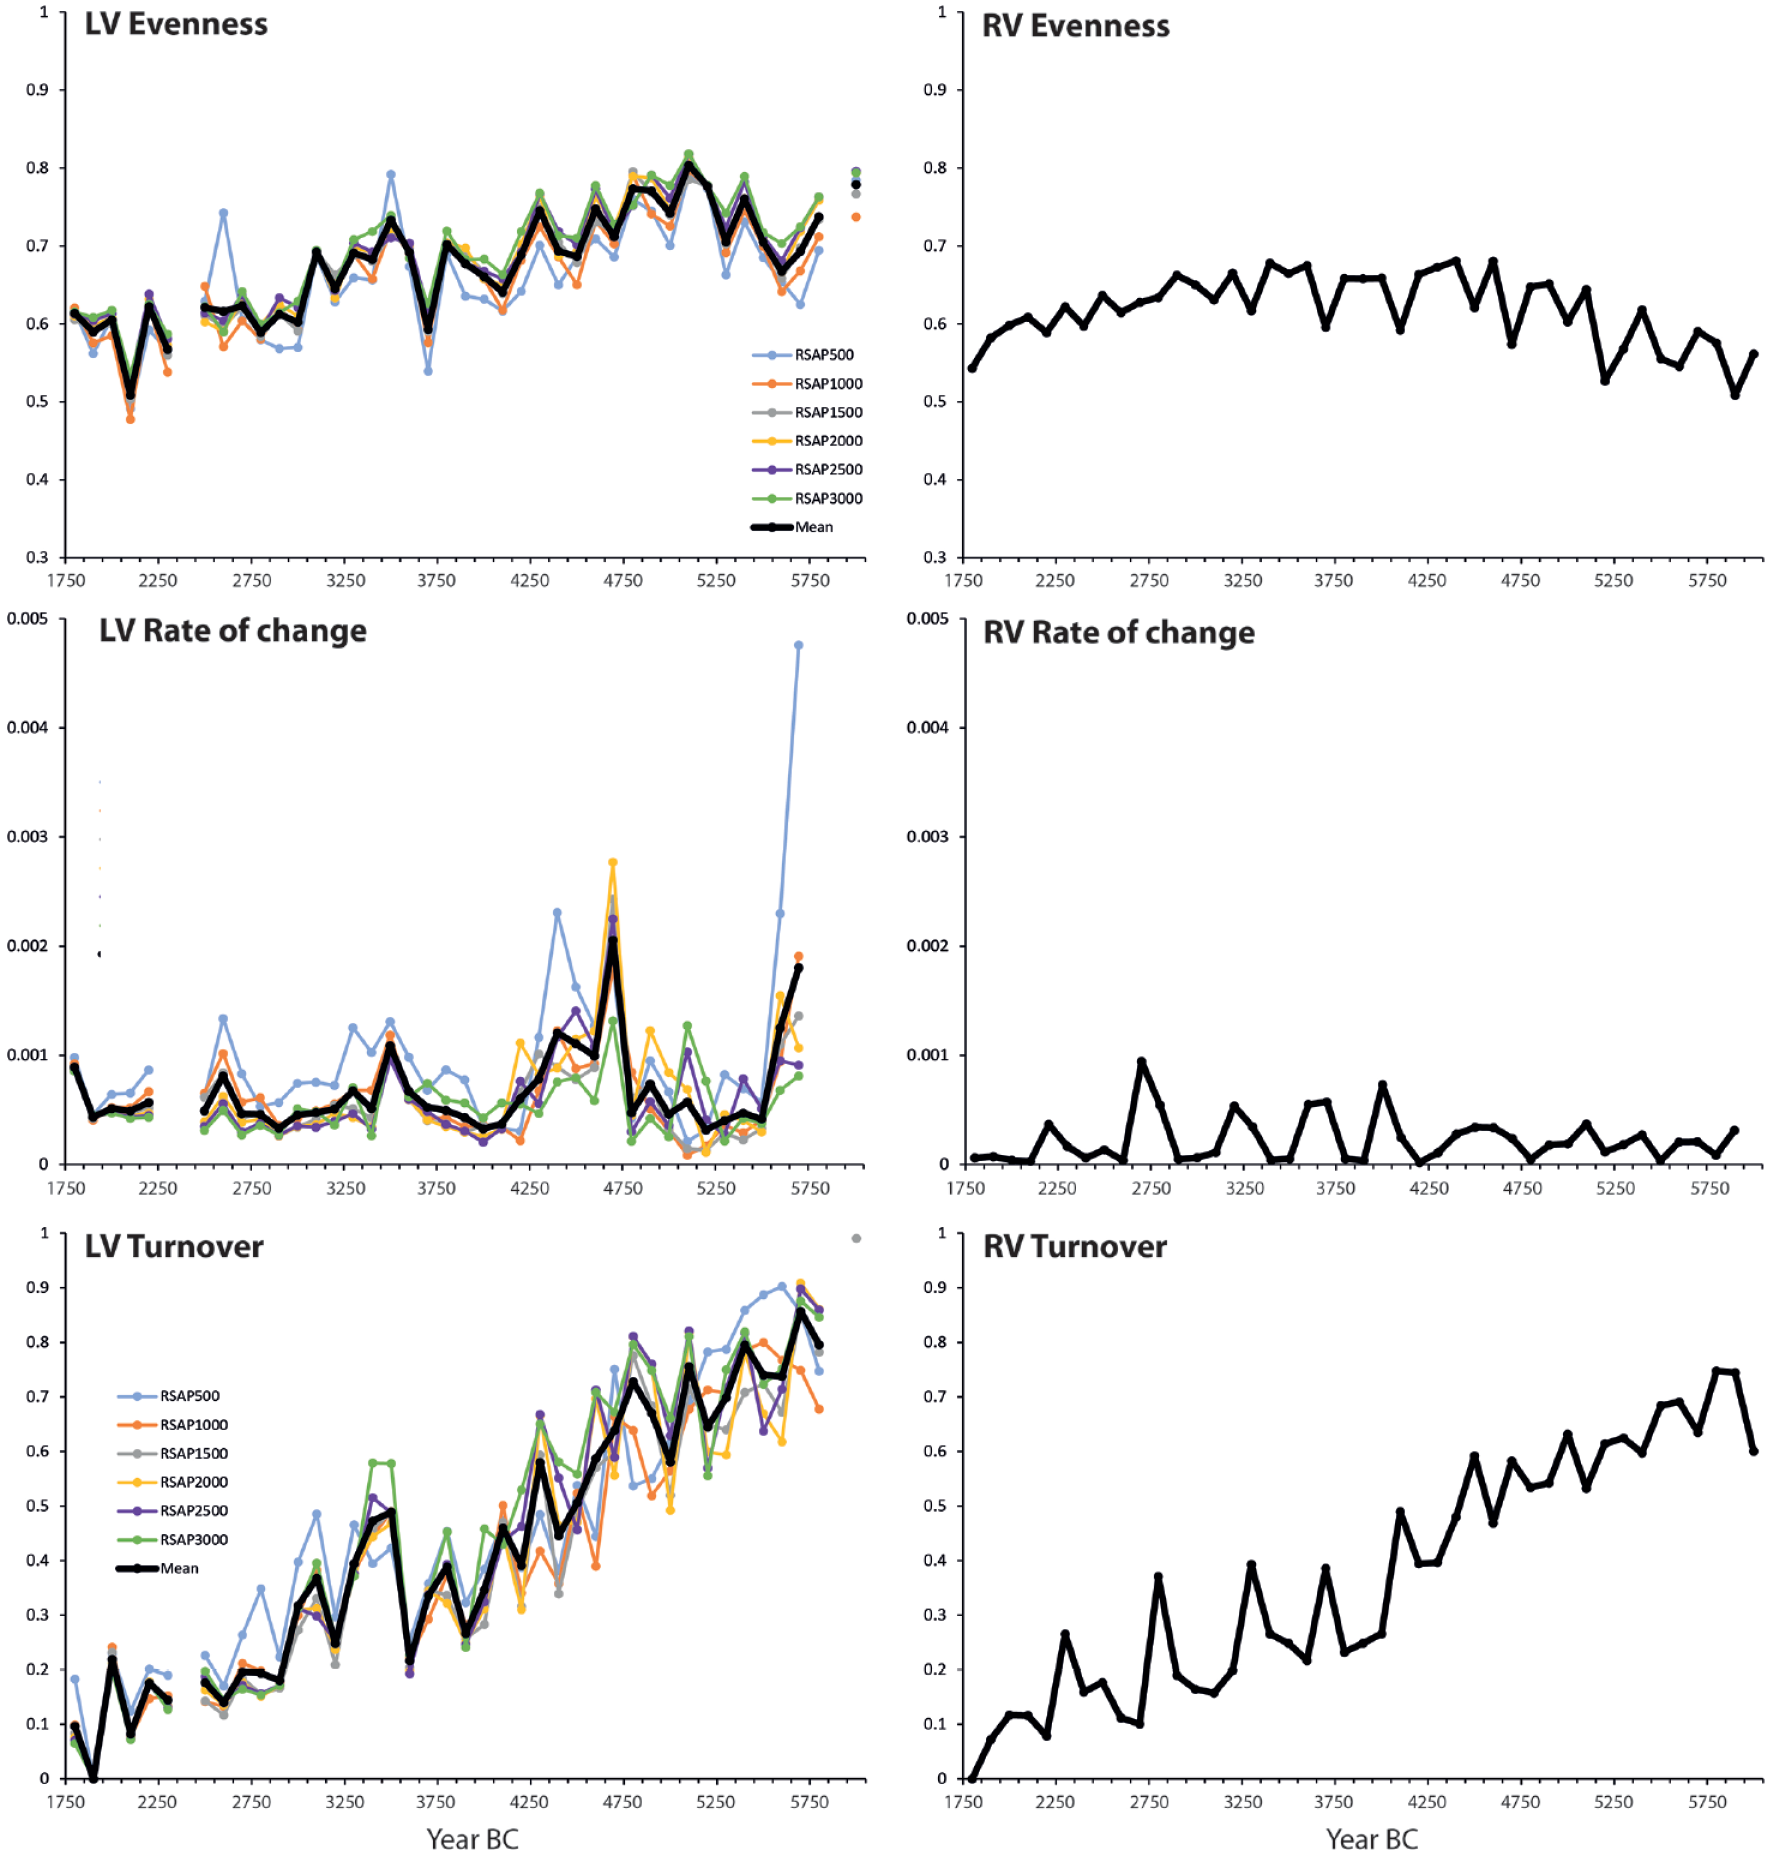
Indices of vegetation compositional change for the local vegetation around Lake Bolshoye Zavetnoye (LV; based on LOVE estimates) and the region (RV; based on REVEALS estimates). The LOVE results for different RSAPs and the mean of all RSAPs are shown.
Evenness estimates based on untransformed pollen data (PP) do not differ much between BZL and LI records and the regional scale (ESM 4). PP rate of change increased from 4750 BC for both BZL and LI records. At the regional scale, PP rate of change varied a lot until 4050 BC and then increased. Note that the rate of change is higher based on regional estimates than for BZL and LI. PP turnover is similar for both BZL and the regional estimates. PP turnover for the LI record reached a low value already at 3250 BC, whereas similar values were reached after 2050 BC for both BZL and the regional estimates. Palynological richness increased through the Neolithic at a regional scale. The trend is regular at Ikmenlampi. In contrast, palynological richness for BZL decreased between 4050 and 2450 BC, then increased between 2250 and 1750 BC.
Archaeological data
The spatial and chronological distribution of archaeological sites at the local and regional scales around BZL and LI are illustrated in Figures 2 and 8 (see also Table 2). The highest number of sites correspond to the period 4000–3000 BC at both scales. This time corresponds to a period of high intensity and density of population on the whole Karelian Isthmus (Nordqvist and Lavento, 2008; Seitsonen et al., 2016) and is also characterized by an exceptionally high volume of material culture that is easily recognizable and datable (see Nordqvist, 2018). More sites are found within a 3-km-radius from LI than BZL, which reflects their location in different environmental zones (generally, for a water-bound settlement, the availability of a suitable shoreline is a prerequisite for habitation). The settlement pattern underwent changes in the early fourth millennium, and most large settlement sites, including numerous housepits, clustered in the inner archipelago where LI is situated. BZL, on the other hand, is located in the zone of fjord-like bays and inland lakes, where larger sites and settlement clusters are less common, BZL itself being an exception (Halinen and Mökkönen, 2009; Mökkönen, 2009).
For the period 3000–2000 BC, only a few sites are found within a 3 km radius of BZL, and none are present in the area of LI. This reflects the general situation on the Isthmus, where traces of habitation become scarcer in the third millennium BC. There were no sites in the LI area in the period 5000–4000 BC either. During this time settlements were usually located closer to the mainland and not in the archipelago (Mökkönen, 2009): this is evidenced by the few sites in the BZL area that are older than 4000 BC. Thus, even if the current data is insufficiently dated, they suggest a continuous or recurrent human presence throughout the Neolithic period within a 3 km radius of BZL, while settlements were present specifically during the period 4000–3000 BC around LI – still, both older and younger settlements are known just beyond the 3 km radius in this area as well.
Discussion
Local versus regional plant composition
The REVEALS reconstructions provide an overview of the regional vegetation of the Karelian Isthmus. The LOVE estimates provide an assessment of the local vegetation around BZL at specific distances from 500 to 3000 m (Figure 7). The divergences between the regional and local vegetation provide a good basis for interpreting the impact of local-scale land use on the vegetation around BZL during the Neolithic. Furthermore, untransformed pollen data from LI are also used to obtain additional information on vegetation changes at local and/or regional scales; the spatial representativeness of pollen assemblages cannot be assessed if no modelling approaches are applied. The use of different scenarios for the RSAPs provides information about how the choice of the RSAP could influence the results. Not many changes are observed when the vegetation composition indices are calculated. However, the selection of the RSAP matters for quantitatively assessing the plant abundances at a local scale, in particular for Betula during the early part of the Neolithic. Considering previous studies carried out in Scandinavia, an RSAP comprised between 2000 and 3000 m would be the most realistic for BZL (e.g. Cui et al., 2014; Fredh et al., 2019; Hellman et al., 2009; Hjelle et al., 2015; Hjelle and Sugita, 2012; Mazier et al., 2015; Nielsen and Sugita, 2005; O’Dwyer et al., 2021). In the following, local (BZL 1–4) results are discussed for RSAP 2000 m.
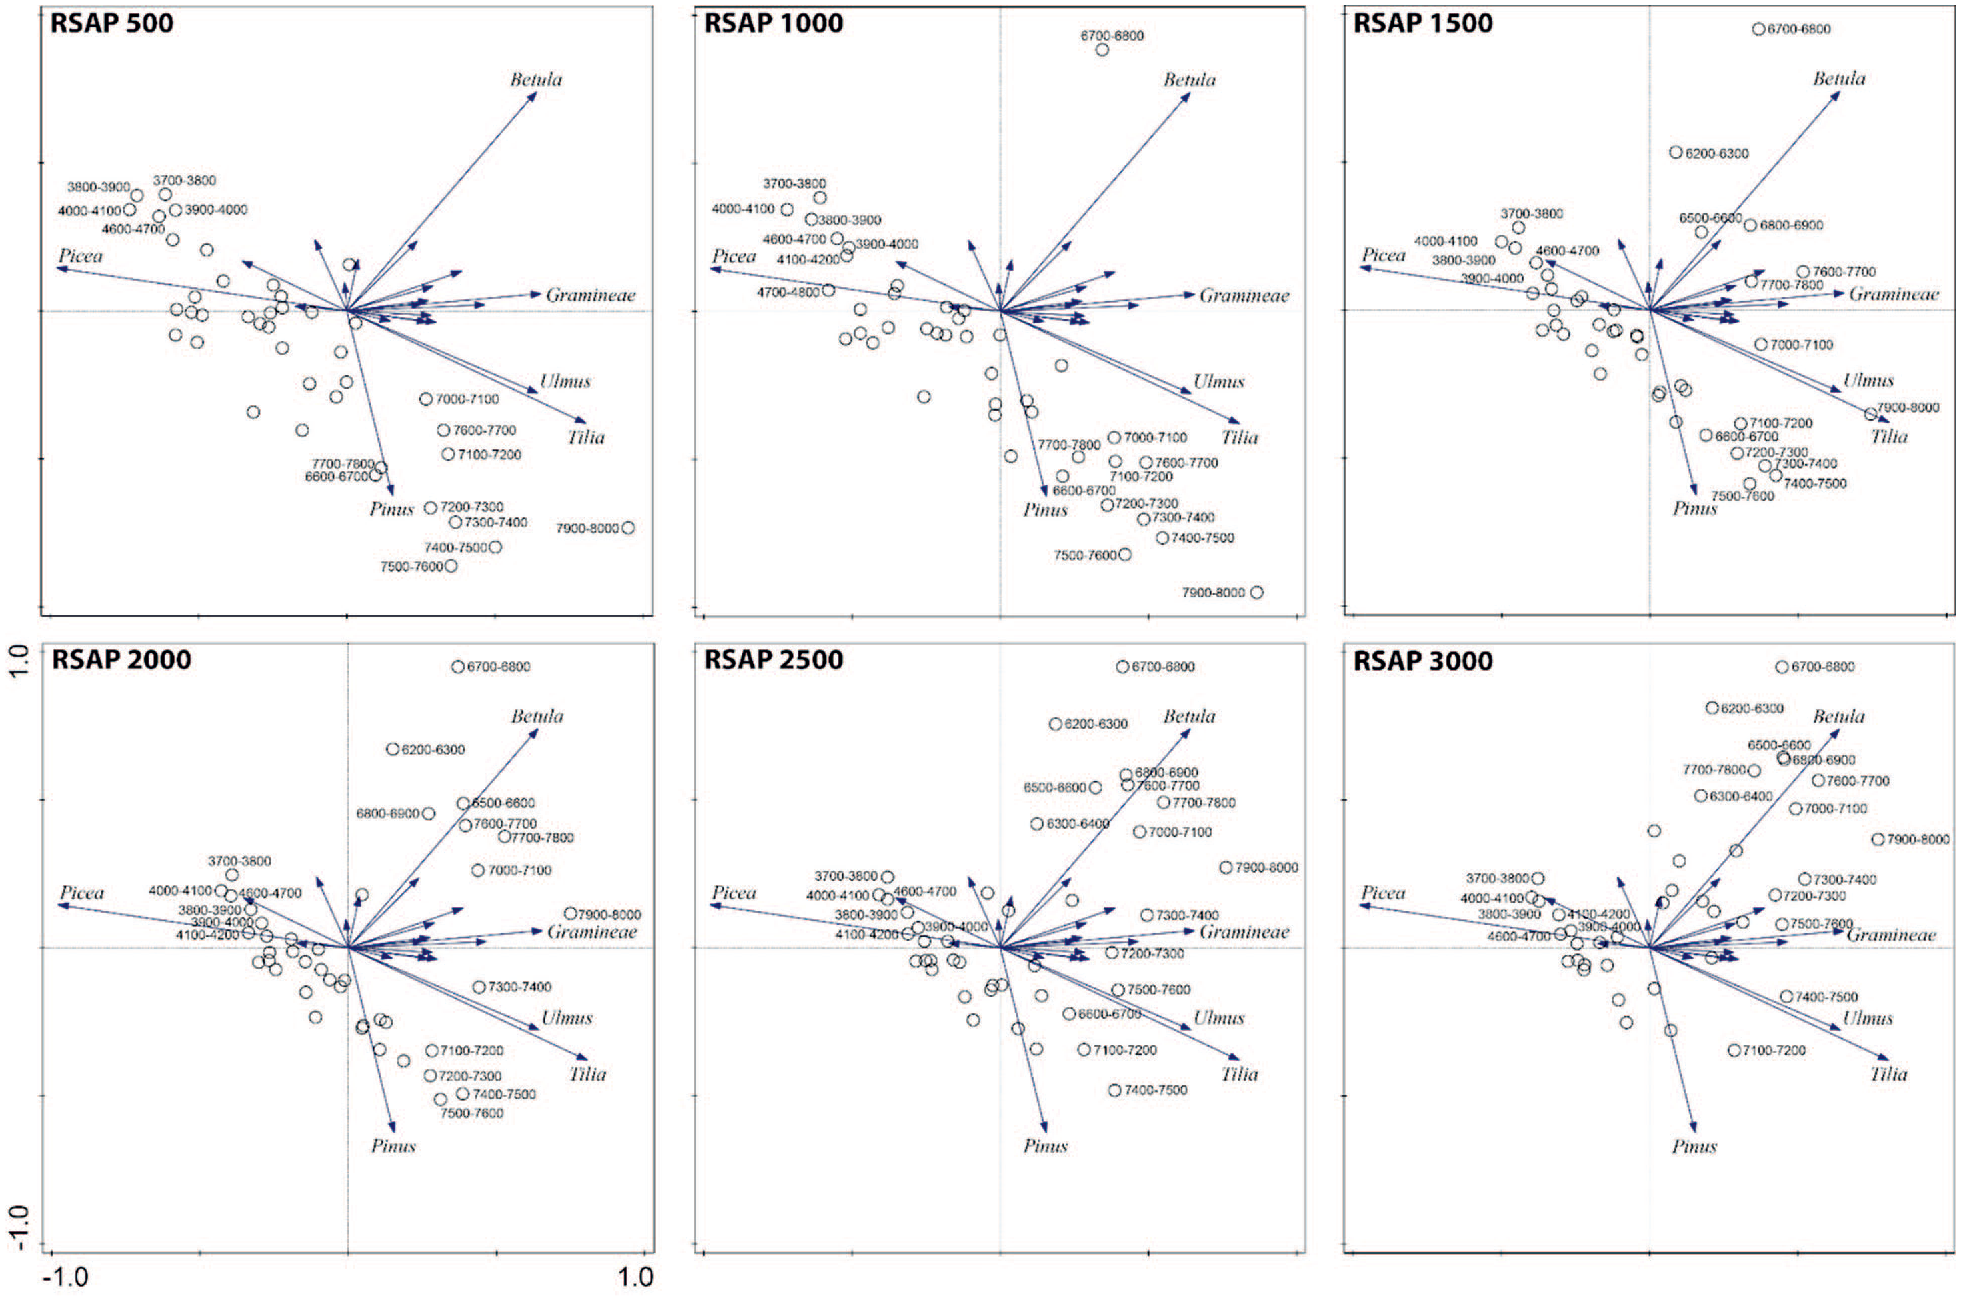
Principal components analyses (PCAs) used to characterize the differences in the use of different RSAPs for Lake Bolshoye Zavetnoye LOVE reconstructions. All the calculations are implemented using CANOCO 5 for Windows (Lepš and Šmilauer, 2014). The LOVE estimates have been previously transformed using a square-root transformation to stabilize variances.
The four major CONISS zones agree closely between the regional (R1–4) and local (BZL 1–4) zones. The limit between R3/R2 and BZL 3/BZL 2 (4100/4140 BC) are contemporaries for both regional and local reconstructions. The main differences between local and regional vegetation at those times concern the proportions of Pinus, Betula, and Tilia. Pinus is locally (41%) more abundant than regionally (19%). Locally, Betula is present at levels of only 4.7%–3.6% in BZL 1 and 2 (absent in BZL 3 and 4), while regionally Betula is present at levels of 32%–60% throughout the study period, suggesting that the local growing conditions were more suitable for Pinus than Betula. Regarding Tilia, it is more abundant regionally than locally. Our reconstructions also record an earlier presence of Tilia for BZL than in the region. From 4100 BC onwards, Picea is more abundant at the local (27%–44%) than the regional scale (20%–31%), and its abundance is recorded earlier for BZL than in the region. The plausible difference for the Picea values is the Holocene spread of Picea abies in Fennoscandia and adjacent areas (Giesecke and Bennett, 2004): Picea populations began to expand from the east and reached higher population densities in the Lake Ladoga area earlier than in eastern Finland, where the data for the REVEALS analysis is collected.
The proportion of regional thermophilous deciduous trees is the highest (19.8%) in zone R2, dating to 5200–4100 BC. This relates to the Holocene Thermal Maximum (HTM) that is characterized in Fennoscandia by high summer temperatures and low relative humidity. Around 4000 BC, the mean temperature (jja) anomaly was ca +0.7 compared to 0.5 ka (Hammarlund et al., 2003; Heikkilä et al., 2010; Ojala et al., 2008; Salonen et al., 2014). A similar trend is observed at the local scale, but the reduction of Tilia after the HTM is recorded to a lesser extent at the regional scale than the local scale. Locally, Tilia is, in fact, present only sporadically and in small proportions from 4800 BC onwards. With respect to other species, in the local vegetation for BZL 2 (4650–4150 BC), there is an increase in Juniperus and a decline in Poaceae and Salix, while in the regional vegetation, such sharp changes are not visible. In addition, in contrast to regional values, a sharp decrease in local Pinus values, concurrent with an increase in local Poaceae values, dates to 4900–4700 BC. The possible causes of these differences between the regional and local patterns of change may be related to local human activities on the Karelian Isthmus and are discussed in the section focussing on the potential human impact.
The beginnings of the third zones (R3 and BZL 3) closely agree between the regional and BZL vegetation reconstructions, that is, 4100 BC in the region and 4150 BC for BZL. At the regional scale, the proportion of QM trees decreases from the beginning of zone R3. These changes are evidently connected to the overall cooling after the HTM, which results in the southward retreat of thermophilous tree taxa at a continental scale (Giesecke and Bennett, 2004; Seppä et al., 2009). Another dominating element in the pollen data is the increase in Picea proportions from the beginning of R3. Indeed, a significant change in the Fennoscandian ecosystem is related to the spread of Picea after ca 4000 BC. The expansion of spruce across Fennoscandia led to a gradual transformation of the ecosystem where the species-rich mixed forests were replaced with more homogeneous ‘modern’ boreal forests dominated by Picea, Pinus, and Betula. The REVEALS reconstructions clearly show this succession.
The local vegetation reconstructions for BZL (BZL 3), however, deviate from the regional reconstructions (R3) in some respects. Firstly, there is a local decrease in Betula abundances to zero, while regionally there is only a small decline. Secondly, Picea is more abundant locally than in the region, and its presence is recorded earlier than in the region (see our discussion above). Third, Tilia is present only sporadically and in low proportions, while regionally Tilia is steadily present at ca 4.4%. In addition, in contrast to regional values, a sudden drop in Cyperaceae in 3700 BC, Picea in 3500 BC, Corylus in 3400 BC, and Alnus in 3300 BC is recorded (see below).
The zonation between the two uppermost zones differs only by about 100 years between the region and BZL. Regionally, the fourth zone (R4) dates to 2800–1750 BC, and locally (BZL 4) it dates to 2900–1750 BC. The most profound difference between local and regional vegetation is the decrease in Pinus from 41% (BZL 3) to 33% (BZL4), while in the regional reconstruction there is only a minor decrease from 19.4% (R3) to 18.3% (R4). The difference between the beginning of these zones is likely due to local land use that becomes visible 100 years earlier locally than in the region.
Differences are observed between the regional and local patterns of vegetation compositional change (i.e. indices of vegetation compositional change) when the LRA modelling frameworks are applied. The timing of the decrease in evenness differs between the region and BZL; the early decrease in evenness at the local scale is mainly related to the spread of Picea around BZL earlier than in the region. The rate of change is lower in the region than locally. In particular, we record an acceleration in vegetation compositional changes between 4650 and 4250 BC (local spread of Picea and local decrease of Betula), then at ca 3550 BC (short reduction of Picea and increase of deciduous trees at a local scale), 2650–2550 BC (further local rise of Picea abundance), and 1750 BC (increase in land use). The trends of the vegetation turnover indices are similar between BZL and the region.
Human impact in the BZL-LI area
In this section we aim to discuss potential human influence as an explanation for the differences between the local and regional patterns (see previous section). For this purpose, archaeological data are compared with our results, and we include LI and charcoal data from BZL in the discussion to obtain additional insights in terms of vegetation changes on the Karelian Isthmus.
In the LOVE analysis from BZL, in contrast to the regional reconstruction, there is a short drop in Pinus and increase in Poaceae between 4900 and 4700 BC, followed by a very pronounced decrease in Tilia from 4800 BC onwards. Dating to 4650–4150 BC, an increase in Juniperus and decline in Salix and Poaceae, is recorded. In addition, the rate of change is higher than at the regional scale between 4650 and 4250 BC. All this may be indicative of local land use, utilizing Pinus and Tilia, and a slight change in vegetation into open heliophilous conditions where species such as Juniperus and Poaceae grow more abundantly. There was no profound fire activity at the time. Thus, the reduction of these tree species is likely due to their actual use by humans rather than the burning of forests. Other pollen evidence that further supports the presence of humans around BZL from ca 4900 BC onwards includes the occurrence of a Hordeum type dating to 4880 BC and the nearly concurrent Rumex dating to 4800 and 4600 BC. The human impact on vegetation could further result in a decrease in the local vegetation evenness that is recorded earlier in BZL than at the regional scale. Furthermore, the palynological richness at the local BZL scale is at its lowest until about 2750 BC (end of BZL 3).
The archaeological material supports the observations regarding the anthropogenic impact made at BZL. After the settlement documented in the seventh millennium BC (Halinen et al., 2008), human presence is again evidenced by finds of the so-called Sperrings 1 Ware at the western end of the lake (Figure 8). This pottery type is generally dated to 5200–4400 BC (Nordqvist, 2018; Pesonen, 2021; Tarasov et al., 2017) and connects well with the onset of anthropogenic impact on the area from 4900 to 4700 BC onwards. Finds that can be associated with the later part of the millennium, however, are very scarce and consist only of a few unclear fragments of Sperrings 2 and Pit Comb Ware from the area of the lake basin. Although the introduction of pottery did not mark an abrupt change in lifeways, many processes visible in the fifth millennium BC reflect the transformations of local societies, including the use of the environment (see Herva et al., 2017; Nordqvist and Kriiska, 2018).
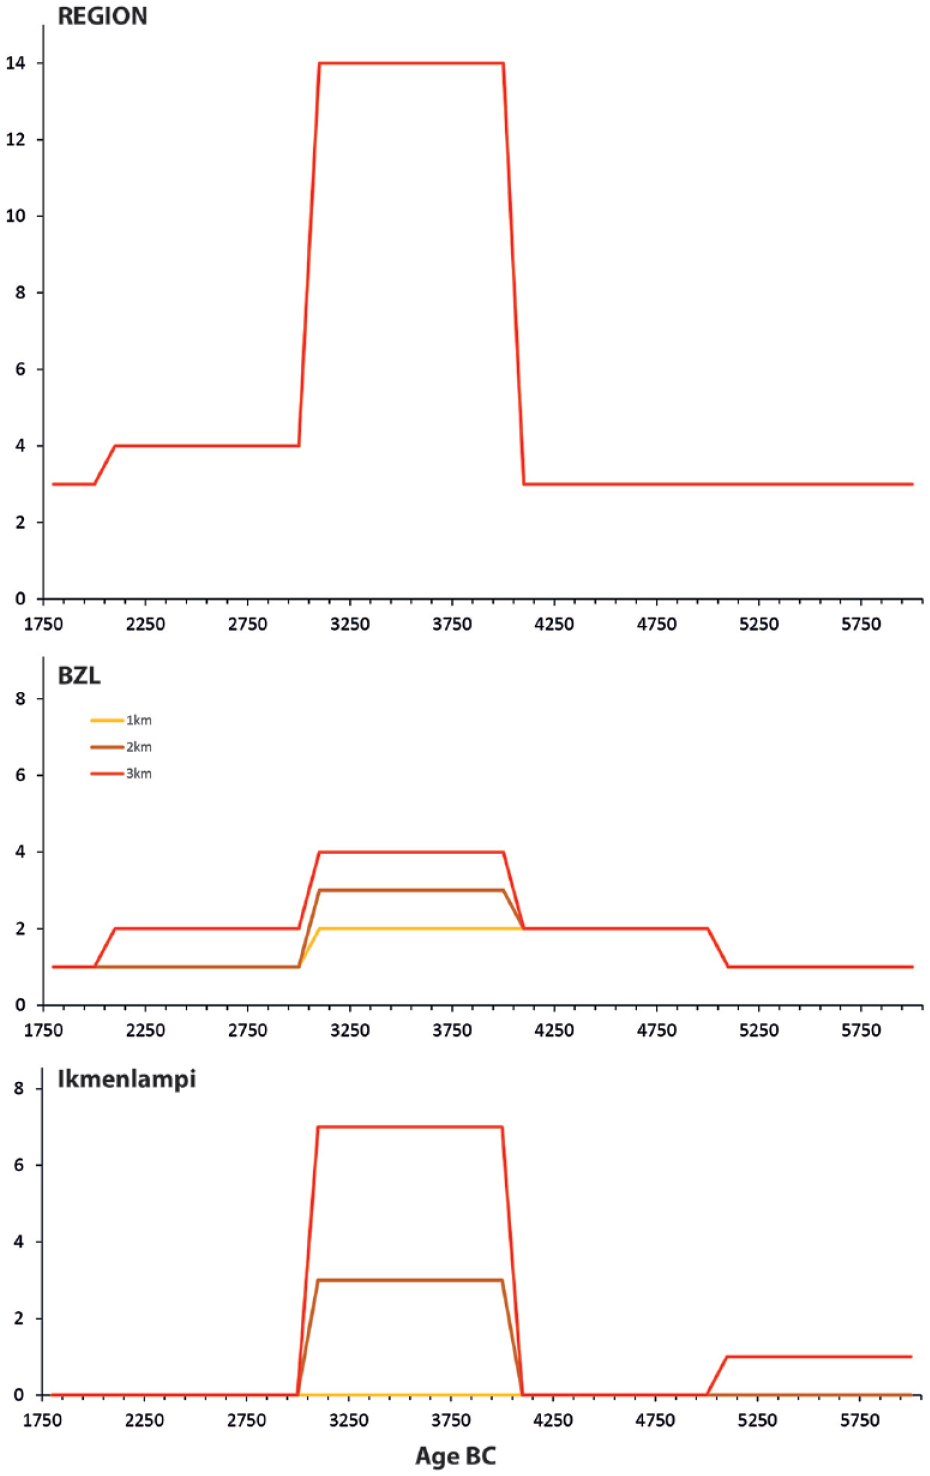
The chronological distribution of the sums of archaeological sites (generalized to the millennium precision) at the local scales (Lake Bolshoye Zavetnoye and Lake Ikmenlampi) and regional scale (all sites present on the map presented in Figure 2). Sums of the sites present within a radius of 1, 2 and 3 km from Lake Bolshoye Zavetnoye and Lake Ikmenlampi are shown (for data, see Table 2).
As for the earliest signals of human presence, a similar story is observed for LI, where human impact becomes visible through LI 1b, between 4750 and 3930 BC. Based on untransformed pollen data, the rate of change increased from 4750 BC not only in LI but also in BZL records. The dominant element also in this data is an increase in Juniperus and a decrease in thermophilous trees, Ulmus, Corylus and Quercus, throughout the zone, and even a clear decline in Betula and Alnus in the first half of the zone. However, unlike in BZL, in the LI data these early signals of human presence practically predate most archaeology known within a radius of 3 km. The lack of archaeological data may suggest that sites of this age have not been discovered in the LI area or that the actual settlements were situated further away, and the surroundings of LI were used for their resources by the mobile foragers.
In the BZL–LI area, the greatest amount of archaeological material corresponds to the fourth millennium BC and particularly to its first half. This period of highly intensive human activities on the whole Karelian Isthmus is clearly seen in the pollen data from both BZL and LI. The rate of vegetation change around BZL increased between 4150 BC and 3550 BC, and from 4100 BC onwards, regional and local pollen data in BZL deviated in many respects. Most notable local changes are the decrease in Betula abundances to zero in BZL. In addition, in contrast to regional values, a sudden drop in Picea in 3500 BC, Corylus in 3400 BC and Alnus in 3300 BC is recorded. In contrast to regional values (after a very pronounced decrease from 4800 BC) Tilia continues to be present locally only sporadically and in low proportions. The local drops in these tree species (especially Tilia) are very sudden, and no such sharp fluctuations can be seen in the regional data, where the steady decrease of deciduous trees is present after HTM, but with no such sharp drops. In addition to drops in tree species, a period of high fire frequency is recorded between 4090 and 3150 BC in the BZL data. All this suggests that the local decrease of these tree species, together with an increased, concurrent phase of fire frequency, most likely results to some extent from forest management, that is, the intentional burning of forests, rather than the natural decrease of deciduous trees after the thermal maximum. It seems reasonable to assume that living conditions in BZL were promoted through the creation of favourable biotopes by using fire (see also Mellars, 1976; Zvelebil, 1994). It is also possible that to some extent, the local decrease of tree species could be related to the use of wood for other purposes than making fire.
Archaeological material related to the Typical Comb Ware context, predominant in 3900–3500 BC (see Nordqvist, 2018; Pesonen, 2021), is numerous around BZL. It is known in different parts of the lake basin and its environs and includes large settlement sites with possible pithouses. Material associated with the second half of the millennium is scarcer, but also includes a settlement site with a pithouse belonging to the Pöljä Ware context (dated 3400–2500 BC; Nordqvist and Mökkönen, 2021; Pesonen, 2021) to the south of the lake basin. There are also 14C dates from a settlement context on the BZL shore (Halinen et al., 2008), but no archaeological material can be matched with them.
In the LI pollen data, the beginning of LI 2a dates to 3930 BC and is characterized by strongly fluctuating Picea values indicating the use of spruce-dominated forests. Several pollen grains originating from domesticated species, namely Cannabis and Hordeum, were identified sporadically between ca 4000 BC and 2480 BC (see Table 4, pollen Ikmenlampi, for details). In addition, clusters of Urtica pollen dating to between 4020 and 3615 BC and Plantago lanceolata, found between 4050 and 2745 BC, indicate the presence of grazing animals and more or less nitrogen-rich communities (Behre, 1981). It can be argued that the big settlements of the fourth millennium BC produced an environment and sufficient human and other waste suitable for nitrophilous plant species to thrive (see also Wieckowska-Lüth et al., 2018). As with Cannabis and Hordeum, Plantago lanceolata does not belong to the natural vegetation and is a good indicator of human land use (Behre, 1981; Hjelle et al., 2006). The charcoal data suggests an intensive period of fire use from ca 3350 BC until 3020 BC.
Indeed, the archaeological material found within a 3 km radius of LI is the richest during this time. Most of the material belongs to Typical Comb Ware and consists of several settlements, many with numerous pithouses. In the LI area, pithouses are also reported from the context of Late Comb Ware (ca. 3600–3200 BC; Nordqvist, 2018; Pesonen, 2021), but other material from this period is rare. Pithouses are semi-subterranean dwellings, the construction of which peaked in the fourth and third millennia BC, and they are considered to represent more stationary or (semi)sedentary habitation (Mökkönen, 2011; Pesonen, 2002). Such settlements also have a greater impact on the environment, which is reflected in the pollen data. It is worth noting that the proportions of Juniperus decreased already from 3930 BC onwards. The reason behind this remains unclear, but the drop is synchronous with the documented peak of human presence in the area. Nevertheless, the appearance of Typical Comb Ware in south-eastern Finland and the Karelian Isthmus can be associated with population movements and migration (Mökkönen et al., 2017), and one can propose that this introduced not only a new material culture, but also new ways of living and using the environment. Still, the lifestyle remained that of foragers. Osteological data shows that aquatic resources (fish and seals) formed the basis of protein intake throughout the Mesolithic and Neolithic, supplemented by mammals (particularly elk and beaver) and birds (Seitsonen et al., 2017); Naturally, these data do not provide information about the plant component of the diet and no macrofossil studies have been conducted.
Both in BZL and LI pollen data, there is a major PAZ horizon limit dating to 2900 BC (beginning of the BZL 4 and LI 2b), while regionally, the fourth zone limit (R4) dates to 2800 BC. The rate of change for BZL (based on LOVE estimates) is higher than at the regional scale in 1750 BC. In contrast to regional values, Pinus values in BZL drop from 2900 BC, and in LI pollen data, sporadic occurrences of Rumex, Urtica, Cannabis and Plantago lanceolata and an intense phase of fire frequency starting from 2600 BC suggest the continuation of land use. Archaeological material corresponding to these changes is scant and (possibly) includes the above-mentioned habitation related to Pöljä Ware. In addition, there are a number of 14C dates obtained from a settlement context excavated at BZL, but again, there are basically no material finds that can be connected with these dates (Halinen et al., 2008; Seitsonen et al., 2012). In general, the ca 2900 BC PAZ limit overlaps the beginning of the incoming, animal-herding Corded Ware culture, the expansion of which affected the socio-cultural environment of the foragers also on the Karelian Isthmus (Nordqvist, 2016). However, no Corded Ware finds are known in the immediate vicinity of the sampled lake basins. All in all, the situation in LI as well as in BZL reflects the situation that is common on the Karelian Isthmus and in the Finnish inland: archaeological data become scarce and even disappear around and after the middle of the third millennium BC, and this situation may prevail for centuries. What these find-poor areas and periods have in common is that palaeoecological data often still indicate human presence (see Alenius et al., 2020; Nordqvist et al., 2022).
In prehistoric times, plant materials were vital to everyday activities, and the pollen data from BZL and LI showed many instances of the use of deciduous trees (Tilia, Betula, Ulmus, Corylus, Quercus, Alnus and Salix) and other plants. Trees and plants not only provided the settings for human actions, but also a large part of the food, the main source of fuel (cooking, heating), and various raw materials for the construction of dwellings and means of transportation (e.g. boats), as well as the production of a multitude of other items (tools and other artefacts, hunting facilities, basketry, cordage, etc.). Organic artefacts, often found in waterlogged wetland conditions in central Europe, the Baltic States, and central Russia show that a variety of tree species were exploited for different purposes and their different parts (wood, bark, leaves, roots) and properties – hardness or softness, woodworking and splitting properties, strength and elasticity, water resistance and durability – were utilized accordingly. Tilia, Betula, Ulmus, Corylus, Quercus, Alnus and Salix are commonly present in European archaeological materials and are used to make various artefacts, handles, and shafts, but also as building wood (Bērziņš, 2008; Lozovskaya and Lozovski, 2016; Taylor et al., 2018; Wacnik et al., 2020). Unfortunately, the preservation conditions in north-eastern Europe, including the Karelian Isthmus, are generally unfavourable for organic materials, and therefore the discussion of uses of various wood species remains speculative here.
The trees also have different firewood qualities, but the intensity of their use cannot be assessed at the moment, as charcoal finds have not been identified to species. Some tree species, such as Betula, Tilia and Salix, were also used to obtain bark and bast for bindings and cordage, which were used, for example, in fishing and hunting gear (Bērziņš, 2008; Miettinen et al., 2008; Wacnik et al., 2020). Apart from Corylus and also processed Quercus, these trees had no major nutritional value, even if some of them do have edible inner bark or bast, nuts, fruits or saps (Bērziņš, 2008; Vanhanen and Pesonen, 2016).
In north-east Europe, conifers may have been used more widely than further south, where deciduous species dominate (Lozovskaya and Lozovski, 2016; Oshibkina, 1997; Zhilin, 2004; also Piezonka et al., 2021). Of the coniferous trees, the results from BZL and LI data demonstrate the use and clearing of Pinus and Picea. In northern Europe, Pinus was primarily used as building wood for a variety of constructions, including fishing laths, fences, and cages and other fishing-related items (e.g. bark floats) (Bērziņš, 2008; Koivisto and Nurminen, 2015; Lozovski and Lozovskaya, 2016; Wacnik et al., 2020). In addition, roots could have been procured for different purposes (binding, basketry), even if the dietary and other uses of conifers would have been limited (resins, needles).
Conclusions
Research demonstrates the diversity of land use practices among hunting, fishing, and gathering societies in the boreal ecosystem between the fifth and third millennium BC. At the same time, since population size – in addition to the actual land use patterns – has a strong influence on the scale of change, forager impacts remained local. By dissociating the regional and local backgrounds of pollen, the LRA provided an assessment of local changes in vegetation around BZL. The use of LOVE estimates at distances from 500 to 3000 m show that the selection of the RSAP matters in order to quantitatively assess the plant abundances at a local scale.
The results show that foragers were not only passive users of the environment, but actively manipulated it. In LI and BZL records, increase in the rate of change, decrease in tree species, and increase in Juniperus from already ca 4800 BC onwards indicate a slight change in vegetation into open heliophilous conditions. The greatest amount of archaeological material corresponds to ca 4000–3000 BC, and this is clearly reflected in the pollen data from both BZL and LI from 4000 to 4100 BC onwards. Resource procurement and landscape management, especially around large settlement sites, have strongly impacted the surrounding territory, opening the landscape and promoting plants that benefit from the environments created by humans. In BZL, this is reflected by a clear local decrease in Betula from 4100 BC and an increase in the rate of vegetation change between 4150 BC and 3550 BC. In addition, Picea, Corylus, and Alnus decreased from 3500 to 3300 BC onwards. Overall, a decrease in tree species simultaneous with a period of high fire frequency (between 4090 and 3150 BC) indicates that living conditions around BZL were promoted through the creation of favourable biotopes by using fire. To some extent, the local decrease of the tree species mentioned above could also be related to the use of wood for different purposes. In the LI data, fluctuating Picea values and pollen originating from Cannabis, Hordeum, Urtica and Plantago lanceolata (mainly dating between ca 4000 BC and 3600) point to the use of spruce-dominated forests and the presence of footpaths, more or less nitrogen-rich communities, and an incipient knowledge of cultivation. These activities also affected areas further away from settlement sites, even if such land use has low archaeological visibility.
Supplemental Material
sj-docx-1-hol-10.1177_09596836241254492 – Supplemental material for Exploring local and regional vegetation compositional changes during the Neolithic (5th–3rd millennium BC): A case study on the forager impact on vegetation in north-east Europe
Supplemental material, sj-docx-1-hol-10.1177_09596836241254492 for Exploring local and regional vegetation compositional changes during the Neolithic (5th–3rd millennium BC): A case study on the forager impact on vegetation in north-east Europe by Teija Helena Alenius, Laurent Marquer and Kerkko Nordqvist in The Holocene
Supplemental Material
sj-docx-2-hol-10.1177_09596836241254492 – Supplemental material for Exploring local and regional vegetation compositional changes during the Neolithic (5th–3rd millennium BC): A case study on the forager impact on vegetation in north-east Europe
Supplemental material, sj-docx-2-hol-10.1177_09596836241254492 for Exploring local and regional vegetation compositional changes during the Neolithic (5th–3rd millennium BC): A case study on the forager impact on vegetation in north-east Europe by Teija Helena Alenius, Laurent Marquer and Kerkko Nordqvist in The Holocene
Supplemental Material
sj-docx-3-hol-10.1177_09596836241254492 – Supplemental material for Exploring local and regional vegetation compositional changes during the Neolithic (5th–3rd millennium BC): A case study on the forager impact on vegetation in north-east Europe
Supplemental material, sj-docx-3-hol-10.1177_09596836241254492 for Exploring local and regional vegetation compositional changes during the Neolithic (5th–3rd millennium BC): A case study on the forager impact on vegetation in north-east Europe by Teija Helena Alenius, Laurent Marquer and Kerkko Nordqvist in The Holocene
Supplemental Material
sj-docx-4-hol-10.1177_09596836241254492 – Supplemental material for Exploring local and regional vegetation compositional changes during the Neolithic (5th–3rd millennium BC): A case study on the forager impact on vegetation in north-east Europe
Supplemental material, sj-docx-4-hol-10.1177_09596836241254492 for Exploring local and regional vegetation compositional changes during the Neolithic (5th–3rd millennium BC): A case study on the forager impact on vegetation in north-east Europe by Teija Helena Alenius, Laurent Marquer and Kerkko Nordqvist in The Holocene
Footnotes
Acknowledgements
We thank D. Kuznetsov, A. Ludikova, D. Gerasimov and T. Sapelko for their assistance during fieldwork on the Karelian Isthmus and T. Sapelko for helping to extract sediment subsamples from the Lake Ikmenlampi sediment core. Sarianne Silvonen is acknowledged for revising the English language.
Author contributions
Funding
The author(s) disclosed receipt of the following financial support for the research, authorship, and/or publication of this article: The study was supported by the Turku Institute for Advanced Studies (TIAS) and the Academy of Finland through the Academy Research Fellow project ‘Land use, cultivation and animal husbandry during the Neolithic in North-Eastern Europe between c. 6000 and 1000 BC’ (Project 274851).
Supplemental material
Supplemental material for this article is available online.
References
Supplementary Material
Please find the following supplemental material available below.
For Open Access articles published under a Creative Commons License, all supplemental material carries the same license as the article it is associated with.
For non-Open Access articles published, all supplemental material carries a non-exclusive license, and permission requests for re-use of supplemental material or any part of supplemental material shall be sent directly to the copyright owner as specified in the copyright notice associated with the article.