
Abstract
The North Sea region boasted one of the world’s most important fisheries for many centuries. Climate directly and indirectly influences the development and survival of many important pelagic fish in the North Sea ecosystem. One indirect influence is the food availability in the form of phyto- and zooplankton abundance, which is strongly controlled by environmental factors. One of these environmental factors is local sea surface temperatures. A negative correlation between zooplankton abundance and sea surface temperature is well established for the epeiric sea on the European continental shelf. Continuous temporal observations of North Sea zooplankton production only exist since 1958. Therefore we developed a Historical Plankton Index (HPI) from 800 CE onwards to extend our record of temperature-driven zooplankton abundance in the North Sea over a multi-centennial time scale. For this we used the North Atlantic temperature reconstructions and associations between zooplankton abundance and contemporary sea surface temperatures established applying a General Additive Modelling (GAM) approach. We then examined the association between the HPI and historical landings from the Dutch commercial herring fishery in the 17th century to test the utility of our HPI. We examine the potential influence of food availability (in terms of zooplankton abundance) on the fishery, the evolution of which is often only considered in terms of human influences such as conflict, fishing gear and demand for fish as a commodity. We find that under certain conditions the HPI can explain 20% of the variability in Dutch herring landings. This highlights the importance of developing long-term and large-scale indices of natural marine ecosystem dynamics to understand the historical fortunes of the commercial fishing industry. The results are directly relevant to the United Nations’ sustainable development goal 14 – life below water.
Keywords
Introduction
The global abundance of exploited fish has steadily declined since commercial fishing started in the mid 1800s CE (hereafter all references to dates assume years CE), affecting trophodynamics and community structures throughout marine ecosystems (Jackson et al., 2001; Pauly et al., 1998). Changes in fish stocks have also more recently been noted as coinciding with rapid, climate-induced changes in marine ecosystems (Alheit, 2009; Beaugrand, 2009), and it increasingly appears that climatically induced marine environmental fluctuations play a key role in driving fisheries (Pauly, 2003). Thus, for example, many studies have identified the North Atlantic Oscillation (NAO; Hurrell et al., 2003) as having a strong effect on fisheries-relevant physical and biological environments (Báez et al., 2021; Brander, 2005; Delworth et al., 2016; Fromentin and Planque, 1996; Greene and Pershing, 2000; Hernández et al., 2020; Hurrell and Deser, 2009). Considerable attention is also now being paid to the likely impacts of ongoing and projected anthropogenic climate change on marine environments and dependent fisheries.
In the North Sea, the abundance of fish stocks is affected by temperature both directly through effects on fish distribution and recruitment (Drinkwater, 2005; Rindorf and Lewy, 2006) and indirectly through effects that temperature has on the distribution and abundance of their main food source – the zooplankton (Beaugrand et al., 2003). It is therefore critical for effective fisheries management, to further our understanding of the role of temperatures on zooplankton, and hence on fish stocks, and in related efforts to identify how climatically and anthropogenically driven ecosystem variability may interact.
In this context, the investigation of historical fisheries and the influence of climatically driven ecological variability is a crucial piece of the overall picture (Brander, 2010; Graham and Harrod, 2009; Höffle et al., 2018; Holm et al., 2019; Izzo et al., 2016; MacKenzie et al., 2012; Olsen et al., 2011). Questions concerning the respective roles of economic and environmental pressures in the longer-term multi-centennial history of fisheries would have been considered unknowable until recently (Holm et al., 2019; McCann et al., 2018; Pont et al., 2015). Yet, marine environmental history and historical ecology have both advanced in terms of methodologies and evidentiary bases in the last two decades, and their interdisciplinary cooperation offers a clearer picture for future fisheries by looking through an improved historical lens.
Plankton as indicators of change
Plankton form the base of many marine pelagic food webs. At the lowest level, phytoplankton harness sunlight and turn inorganic matter into organic substances allowing them to grow. They are grazed upon by zooplankton such as copepods, the primary consumers of such pelagic systems in temperate shelf-seas (Benedetti et al., 2021; Brierley, 2017). All higher trophic levels of marine pelagic food webs ultimately depend upon these diverse primary and secondary producers (de Vargas et al., 2015), which consequently play a fundamental role in marine ecosystem functioning (Falkowski et al., 2004; Marshak and Link, 2021; Tett et al., 2013)). Occupying the base of marine food webs, exhibiting short lifespans, and being finely adapted to the physico-chemical characteristics of their environment (Friedland et al., 2012; Margalef, 1978), also renders plankton essential indicators of ecosystem change such as nutrient enrichment, changes in sea temperature or turbidity (Hays et al., 2005). Therefore, observational time-series of phyto- and zooplankton abundance and species composition are increasingly used to assess the status of the marine environment (Bedford et al., 2020; McQuatters-Gollop et al., 2017; Scherer et al., 2016) and to further our understanding of the structure and functioning of marine pelagic food webs (Beaugrand and Kirby, 2018). Both are highly relevant to the United Nations’ sustainable development goal 14 Life below Water which aims to achieve the conservation and sustainable use of the oceans, seas and marine resources.
Estimating ocean productivity
Substantial efforts have been made to estimate annual global ocean productivity (e.g. Iverson, 1990; Ryther, 1969) and primary production on local scales (Gowen and Bloomfield, 1996). More recently, global marine primary production was estimated to be between 44 and 67 petagrams (Pg) or 44 and 67 billion metric tonnes, representing approx. 30–45% of annual carbon biomass (Westberry et al., 2008). The decreasing amount of annual carbon biomass has been demonstrated to constrain fisheries catches at global and regional scales (Chassot et al., 2010). Local studies of primary production have been undertaken for critical southern North Sea fishery regions of the Marsdiep (Cadée and Hegeman, 2002) and Oosterschelde estuaries (Smaal et al., 2013). Most estimates of marine primary or secondary production are, however, commonly limited to short time-series (e.g. Behrenfeld and Falkowski, 1997; Capuzzo et al., 2018; Carr et al., 2006; Field et al., 1998; Tilstone et al., 2015), seldom covering more than the most recent decades due to the labour intensive, time-consuming and expensive measurements and methods involved (Steemann Nielsen, 1952; Williams et al., 1979). Hence, researchers have also relied on proxy-based models to estimate primary and secondary production in the form of chlorophyll, phytoplankton biomass, zooplankton abundance and ocean colour (increasingly obtained via satellite remote sensing, Ma et al., 2014; McClain et al., 2004; Platt and Sathyendranath, 1993). Other efforts to estimate ocean productivity are based on analyses of sediment cores and ice cores from the last 10 millennia to reconstruct changes in major upwelling systems and ocean currents known to impact plankton abundance (Addison et al., 2018). Pitois et al. (2012) show a decline of primary production in the North Sea during the Industrial Era, suggesting a cascading effect of climate variability on plankton due to changing hydrographic features. Capuzzo et al. (2018) identified sea surface warming and the reduction of anthropogenic nutrients (from riverine nutrient input) as likely drivers of an observed decline of primary production in the North Sea over the last 25 years. Other authors predict changes in the hydrological cycle and runoff (Wells et al., 2020; Yang et al., 2021)
Regional differences in zooplankton abundance result in part from the seasonal patterns of phytoplankton production and hydrodynamic conditions (Backhaus et al., 1994; Dickey-Collas et al., 1996a; Fromentin and Planque, 1996; Gowen et al., 1998a). For certain North Atlantic regions, such as the North East and the North West coastal shelves, changes in ocean circulation are thought to drive much of the inter-annual to inter-decadal fluctuations in the abundance of the zooplankton Calanus finmarchicus (Greene and Pershing, 2000), a copepod that is considered the main food source for many commercial fish populations here, in particular the Atlantic cod (Gadus morhua) (Beaugrand et al., 2003; Provan et al., 2009). For the North Sea region, however, sea surface temperature (SST) variability is the major factor controlling zooplankton abundance, due to its influence on water column stability, with reduced sea surface temperatures associated with lesser stratification and consequently increased nutrient availability in the pelagic zone by allowing greater mixing between upper and lower (nutrient richer) levels (Atkinson et al., 2015; Beaugrand and Kirby, 2010; Capuzzo et al., 2018; Greene and Pershing, 2000; Olsen et al., 2011).
The Plankton Index
One frequently used proxy for North Sea zooplankton abundance is the Plankton Index (PI), derived from data collected by the Continuous Plankton Recorder survey (CPR) which is a long-term biological monitoring programme giving systematic spatial coverage of North Sea plankton (zoo- and phytoplankton) since 1958. It aims to relate spatio-temporal changes in plankton distribution to ecosystem changes. It thereby also provides information concerning the scale and nature of processes affecting fish stocks (Brander et al., 2003). Moreover, the CPR method has proven valuable in revealing other water column changes, such as the significant increase in ocean plastics since records began (Ostle et al., 2019).
The PI, first developed by Beaugrand et al. (2003) and later extended by Beaugrand and Kirby (2010), provides a valuable metric for North Sea zooplankton abundance through time. The index considers zooplankton and is, to date, the longest uninterrupted ocean productivity index available having been widely used to investigate changes in zooplankton abundance and its effects on higher trophic levels (Beaugrand and Reid, 2012; Olsen et al., 2011). Beaugrand et al. (2003) and Beaugrand and Kirby (2010) have demonstrated a negative association between sea surface temperature and zooplankton abundance in the North Sea over the last 50 years. They further showed a strong correlation between decreasing zooplankton abundance and decreasing fish stocks, particularly cod (Gadus morhua), consistent with the well-established association between zooplankton and many pelagic and demersal fish species abundances in the North Sea literature (e.g. Beaugrand and Kirby, 2010; Edwards et al., 2002; Hardy, 1956; Vallina et al., 2014). Herring, for example, feed on phytoplankton (diatoms and dinoflagellates; Denis et al., 2014; Hardy, 1924; Hjort, 1914) as well as small zooplankton (copepod nauplii and copepodites) (Checkley, 1982; Munk, 1992) in their larval stages. As they mature, they start to consume zooplankton, most commonly copepod species. These include Calanus finmarchicus (which constitutes the majority of North Sea zooplankton biomass (Broms et al., 2012)) and Temora longicaudata, as well as Euphausiids and Pseudocalanus species (Last, 2006). The North Sea herring fishery was of considerable commercial value up to the 1970s, and with the life-cycle of herring predicated on zooplankton abundance, an extended PI holds considerable potential to help determine how much of the often dramatic variations in herring catch volumes observed over the past several centuries was driven by natural or anthropogenic pressures (Poulsen, 2008; van Bochove, 2004).
Climate indicators
Considerable progress has been made over the last two decades in reconstructing past climatic conditions, drawing variously on palaeoclimatic proxies (or natural archives) including tree-rings, ice-cores, speleothems, corals and sclerochronology, as well as written records (Bradley, 2013; BráZdil et al., 2005), revealing large-scale and long-term climatic variability in past centuries. Importantly, there has also been an increasing focus on reconstructing palaeoceanographic conditions such as sea surface temperatures that are critical controls on ocean productivity (e.g. Cunningham et al., 2013; Greene and Pershing, 2000; Mann et al., 2009).
The UK Met Office Hadley Centre holds highly resolved instrumental measurements of sea surface temperatures for the North Sea taken from boats and ships since 1870 (Rayner et al., 2003), as well as data received through the Global Telecommunications System (GTS) from 1982 onwards. These data helped identify persistent natural thermohaline circulation cycles (Knight et al., 2005), to inform projections of sea surface temperatures over the 21st century (Alexander et al., 2018), and were used for high-frequency analysis of warming of northern European seas since instrumental records began (MacKenzie and Schiedek, 2007).
Most recently, palaeoceanographic reconstructions of the Atlantic Multidecadal Variability (AMV) have been developed (Wang et al., 2017) to provide insights into sea surface temperature variation over large spatial scales for the last 1200 year to assess the respective roles of natural and anthropogenic forcing. The AMV presents North Atlantic temperature variability for the extended summer season (May to September) on inter-annual to inter-decadal scales from 800 to 2010. Embedded within the AMV behaviour is the influence of external forcing, including volcanic eruptions and variations in solar radiation, as well as modes of internal variability (not least the Atlantic Multidecadal Oscillation (AMO; Mann et al., 2009), though the discrete existence of this mode is now contested (Mann et al., 2021)). The AMV employs 46 annually resolved terrestrial proxies from the circum-North Atlantic–Arctic region, eastern North America and Europe. These include, importantly, temperature-sensitive tree-ring data bordering the North Sea domain (e.g. from Scandinavia). Wang et al. (2017) apply a nested principal component regression (PCR) to produce the AMV reconstruction, validated using one-half of the instrumental AMV index as calibration intervals and the other half of the instrumental data as verification intervals in a sliding window calibration – verification approach, as well as model-based pseudo-proxy experiments.
Historical fish data
As suggested earlier, an extended PI holds considerable potential for understanding historical variations in herring catch volumes in the North Sea with the life-cycle of herring strongly predicated on zooplankton abundance.
The herring fishery provided a source of wealth and nutritional stability for the countries bordering the North Sea for centuries and was the most valuable fishery in the region until the 1970s (Pitcher and Lam, 2015; Poulsen, 2008). However, herring catch volumes in the North Sea are known to have varied markedly over past decades and centuries. This volatility, the physical and human drivers of which are not fully understood, brought significant economic impacts (Alheit and Hagen, 1997; Corten, 1999; Holm et al., 2022a; Sahrhage and Lundbeck, 1992; Utterström, 1959). Because of the value of the fishery, strict management structures were put in place by some of the nations that most heavily exploited it, not least the Dutch fishing fleet, which generated abundant documentation that has allowed the reconstruction of long-term historical Dutch herring landings back to the early 17th century (Poulsen, 2008; van Bochove, 2004). This dataset has been used by many scholars (e.g. Atmore et al., 2022; Degroot, 2018; Holm et al., 2019, 2022b; Pitcher and Lam, 2015; Thurstan, 2022). It was also used in this research to investigate how much of the variation in historical herring landings can be associated with the observed variation in our Historical Plankton Index. In doing so, we note that catch volumes are influenced by variables additional to underlying herring abundance (e.g. fishing technology, fishing effort), and with herring abundance itself influenced by factors other than zooplankton abundance. These can include competing (antagonistic) influences, such as direct temperature effects in which colder waters may defer larval to juvenile herring growth (Sswat et al., 2018).
Aims
Our chief aim is to develop and highlight the potential utility of a Historical Plankton Index (HPI) as a measure of zooplankton abundance for the Greater North Sea on a multi-centennial time-scale that experienced considerable sea surface temperature variability (Moffa-Sánchez et al., 2019) relevant to zooplankton abundance, including the medieval warm period (approx.. 950–1250), the little ice age (approx. 1300–1850) and the onset of the industrial revolution (since approx. 1750s). To offer this long-term annual reconstruction of North Sea zooplankton abundance, we capitalise upon the ongoing advances in palaeoceanographic reconstruction by using the AMV by Wang et al. (2017), available back to 800. Constructing a HPI over this time-span can provide insights into the temperature-driven temporal variability of food supply for higher trophic level species in the North Sea on interannual to multi-decadal scales. We thus make the first use of such a reconstruction to examine the contribution of temperature-driven zooplankton abundance to the high variability observed in early modern North Sea Dutch herring landings (something i.e. still not fully completely understood (Poulsen, 2008; van Bochove, 2004)). Holm et al. (2024) have, moreover, highlighted a persistent failure to fully integrate the history of variations in marine resource availability and use into our understanding of human history. Our HPI can also, therefore, complement efforts to incorporate measures of regional terrestrial primary productivity or agri-culturally relevant growing degree day modelling (e.g. Crawford et al., 2023; van Dijk et al., 2023) into studies of historical societal development and response to sudden climatic variability.
A fundamental assumption underpinning the development of the HPI is that: (1) A meaningful prediction (i.e. reconstruction) of historic zooplankton abundance can be made based upon the modelled association between available long-term SST series and the North Sea PI data for their period of overlap (i.e. starting in 1958 with the CPR data underlying the PI (Beaugrand et al., 2003)); (2) The well-known negative association between zooplankton abundance and sea surface temperatures (SST) in the North Sea (e.g. see Atkinson et al., 2015; Greene and Pershing, 2000; Olsen et al., 2011) is sufficiently strong and persistent in direction (if not completely invariant) through time to allow this meaningful prediction of historic zooplankton abundance. Necessarily, our approach also assumes that values of the modern PI accurately reflect zooplankton abundance in the North Sea, that is, biomass production and with that ocean productivity.
Methods
Study region
The North Sea, presently defined as subarea IV by the International Council for the Exploration of the Sea (ICES), is a temperate shelf sea and part of the wider north-west European shelf with a total area of 575,000 km2. It is a semi-enclosed basin with a general counter-clockwise circulation, primarily open to the Atlantic in the north. Water from the Atlantic provides the dominant input (Otto et al., 1990; Winther and Johannessen, 2006; Figure 1), although there is an inflow through the English Channel carrying saline water from the Celtic sea and some inflow from the Baltic Sea via the Skagerrak that has a significantly smaller salinity influence on the southern North Sea (Otto et al., 1990; Winther and Johannessen, 2006). The primarily shallow features of the southern North Sea (≈40 m depth) (Figure 1) and the sandy to muddy seabed provide excellent habitats, nursing grounds as well as spawning grounds for many fish populations such as the commercially valuable cod (Gadus morhua), plaice (Pleuronectes platessa) and herring (Clupea harengus) which were also historically of great importance.
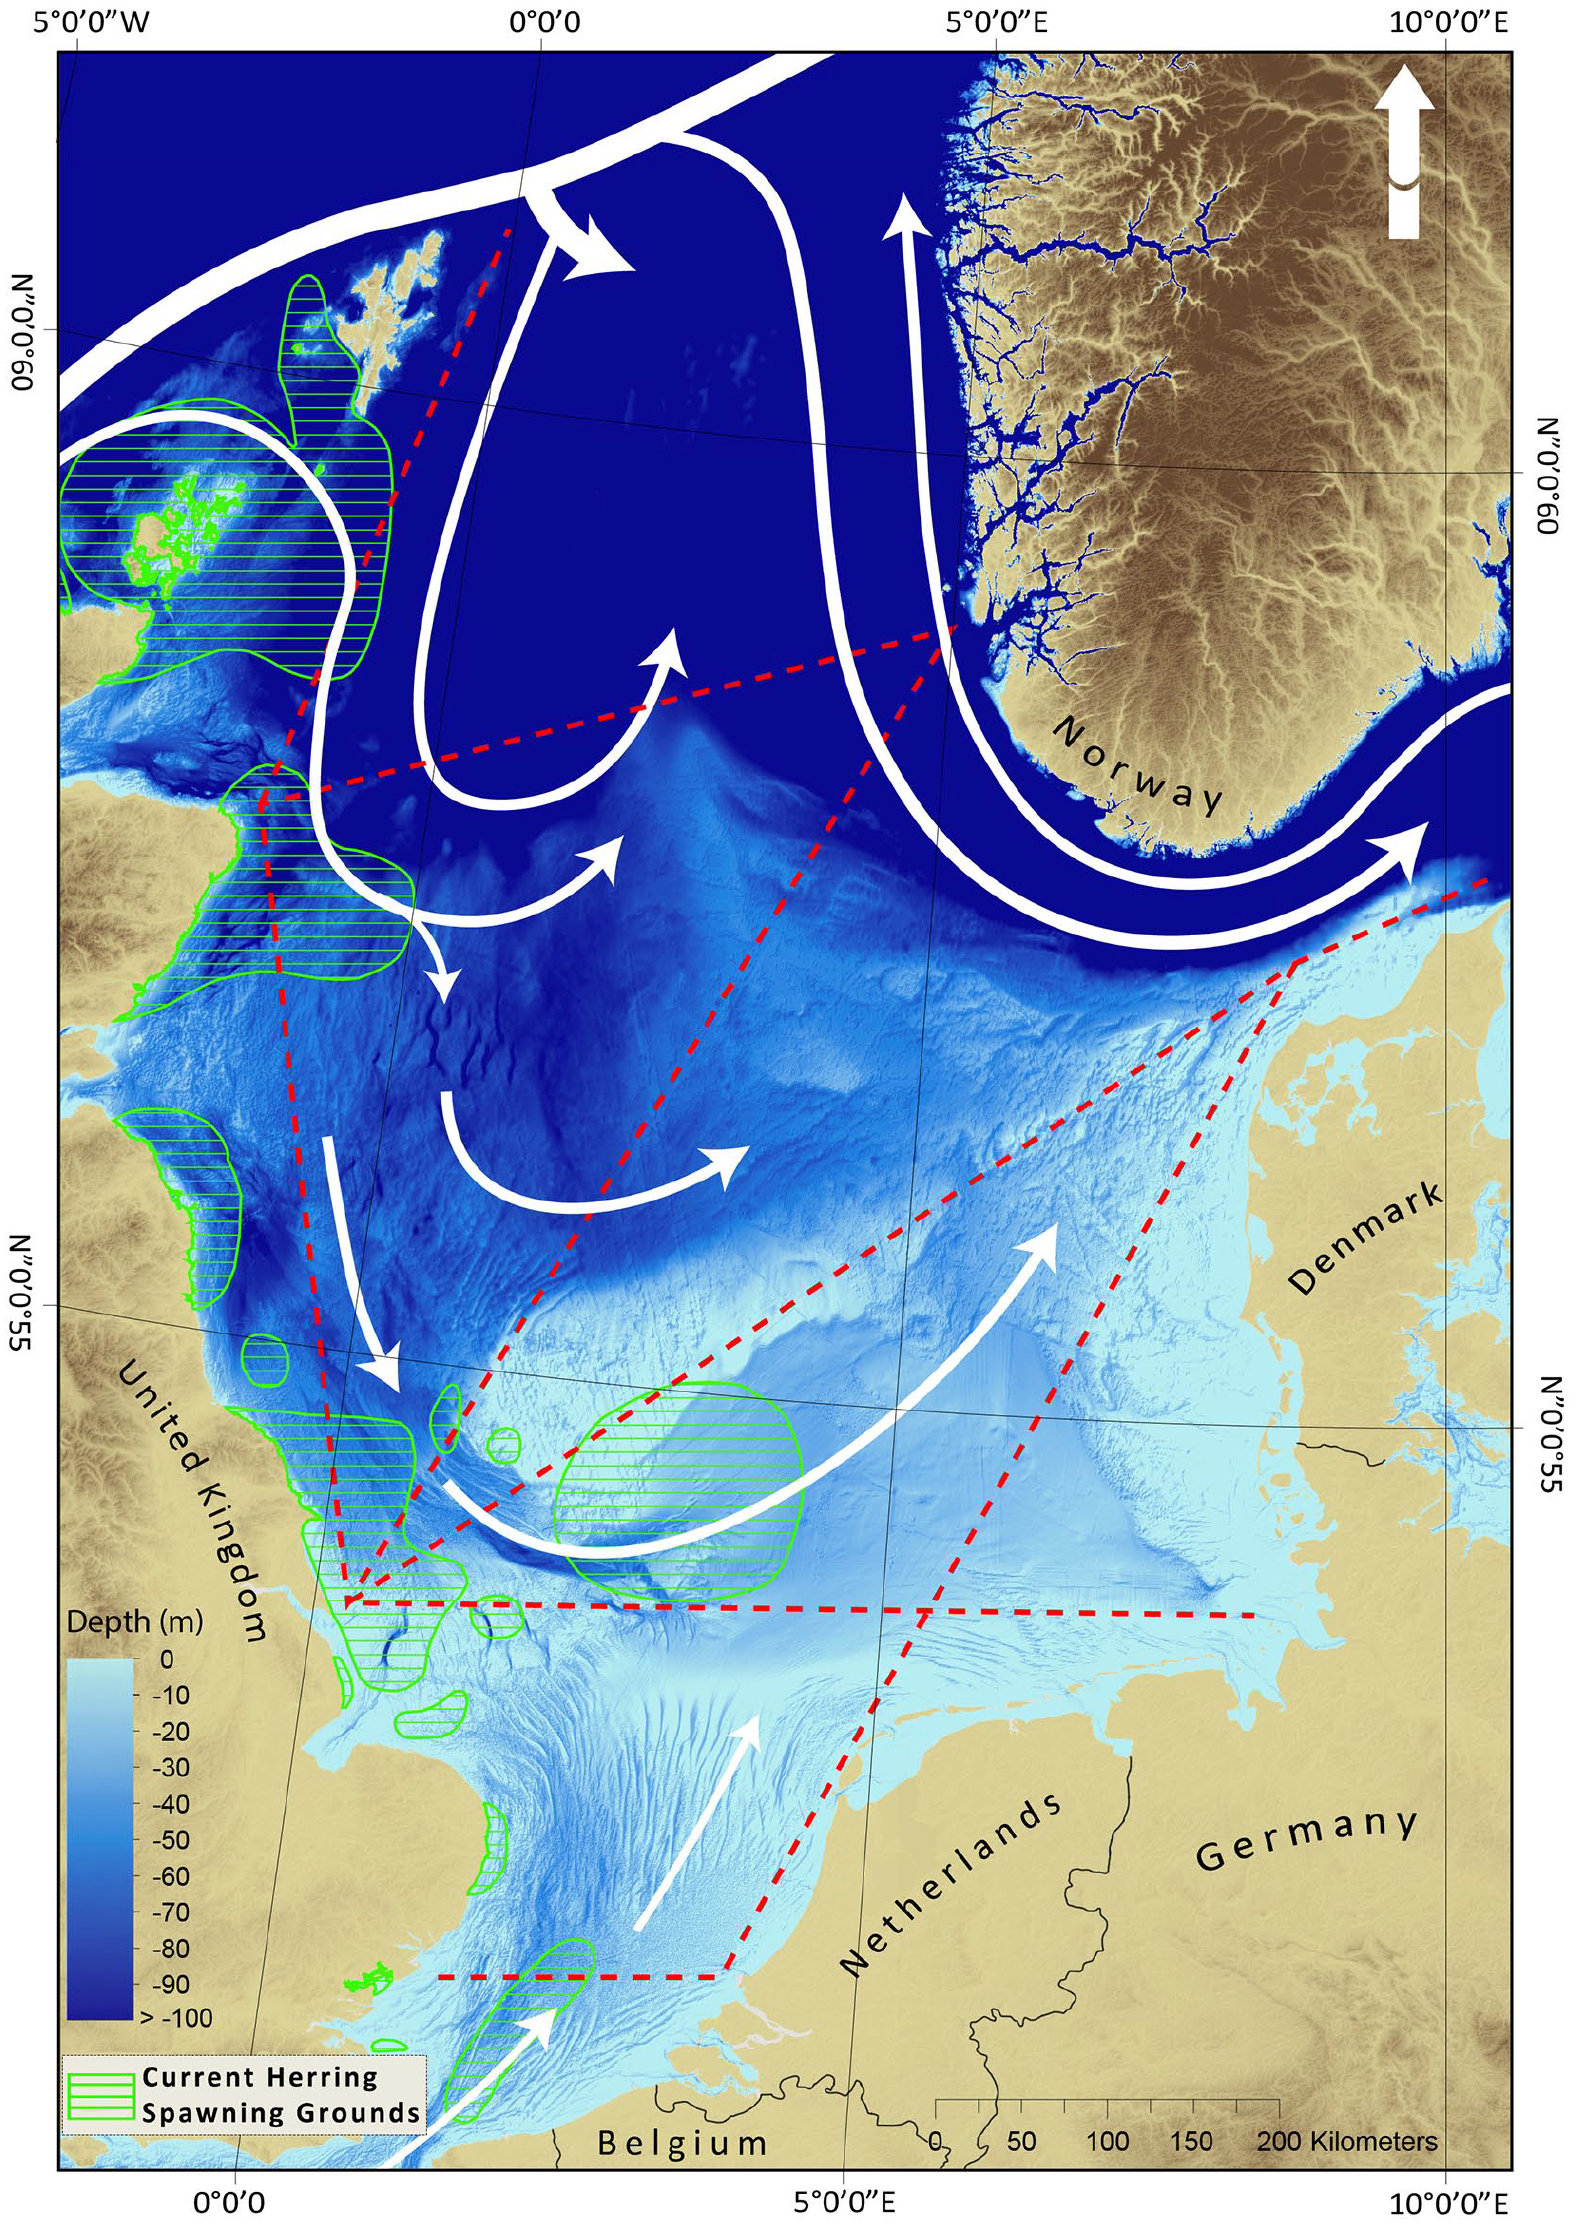
Overview of the study area – the present day North Sea a temperate semi-enclosed shelf sea flanked by the western European countries of Denmark, Germany, Nederland, Belgium, France, England and Norway in the north. White arrows indicate the main currents and general water flow through the North Sea, of which Atlantic water provides the main source. The dotted red lines indicate the CPR routes for plankton collection between 1958 and 2007 (SAHFOS, now operated by the Marine Biological Association, Plymouth), providing the data for the Plankton Index as a proxy for ocean productivity. Green grids illustrate current herring spawning grounds (updated from source data by Coull et al., 1998).
The Historical Plankton Index
The development of our HPI was based on the Plankton Index (Beaugrand et al., 2003; Beaugrand and Kirby, 2010), which itself is based on monthly mean data retrieved from Continuous Plankton Recorder (CPR https://www.cprsurvey.org/). This survey was formerly run by the Sir Alister Hardy Foundation for Ocean Science, SAHFOS and is now operated by the Marine Biological Association). Phyto- and zooplankton samples are collected at a depth of 10 m in the pelagic zone using ships of opportunity that traverse commercial shipping lanes. Annual data from the Plankton Index are available for 1958–2007 (Beaugrand and Kirby, 2010) which makes it one of the longest running plankton time-series globally and the most geographically extensive marine monitoring programme in the world. Formally, the PI represents the first principal component of the abundance of notable zooplankton species (Calanus finmarchicus, Calanus helgolandicus, Euphausiids, Pseudocalanus spp.), the total calanoid copepod biomass and the mean size of female calanoid copepods as recorded by the CPR (Beaugrand and Kirby, 2010). The PI is mainly driven by the mean size of copepods, which in turn is primarily determined by the relative abundance of C. finmarchicus (Beaugrand et al., 2003) which is a dominant copepod in the spring assemblage and makes the majority of its biomass in the North Sea (Broms et al., 2012).
Choosing sea surface temperature indices and reconstructions
To assess the feasibility of extending the PI through the use of historical sea surface temperature indices and reconstructions, we examined the character and strength of their correlation (Pearson coefficient) with instrumentally measured, high frequency sea surface temperature of the present day. Standard normal probability and residuals tests were also performed to see if the data were normally distributed. Climate indices were chosen for examination based on their resolution, length of coverage and relevance to the North Sea domain, as well as their correlation with the PI for the period of its availability, 1958–2007 (Figure 2; Section 3.1). The index ultimately chosen for use in creating the HPI was the HadlSST1 sea surface temperature data from the UK Met Hadley data Centre, which allows a reconstruction of ocean productivity in the North Sea back to 1870 (Section 3.1). For this, we extracted and averaged the annual SST data for the area of interest (via a polygon spanning 62°N–4°E, 60°N–4°W, 51°N–1°E, 53°N–8°E, encompassing the North Sea region as defined by ICES).
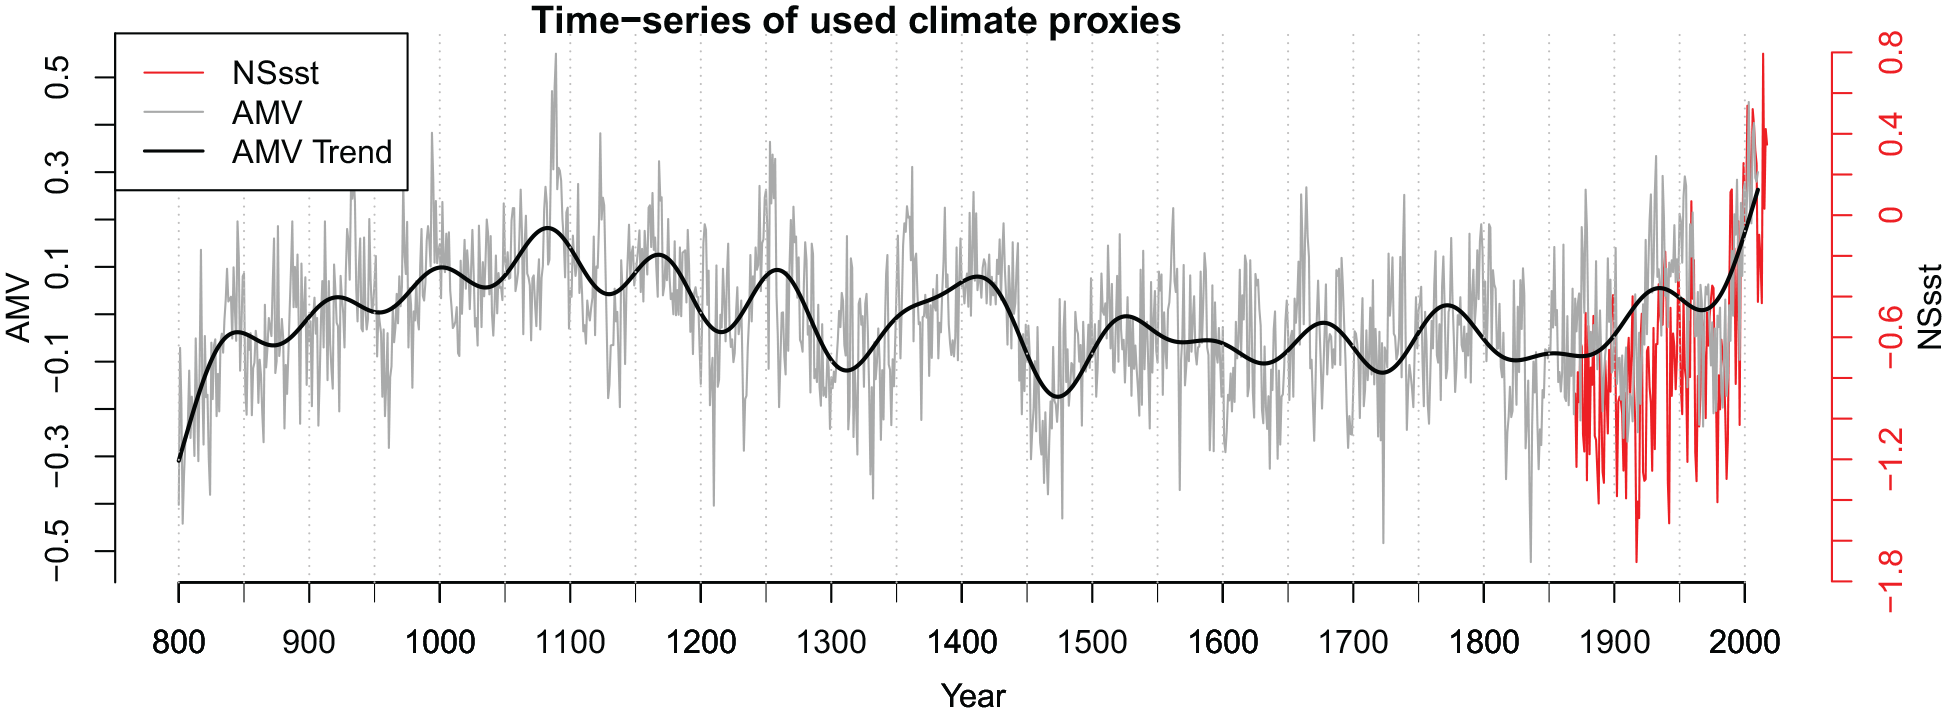
Time-series of the temperature indices HadlSST1 SST (North Sea sea surface temperature, secondary axis on the right, 1870–present) and AMV (Atlantic Multidecadal Variation) (800–2010). The AMV trend displays a moving average of 10 years.
While the HadlSST1 SST dataset is particularly relevant in representing direct sea surface temperature measurements of our study area, it is limited in its temporal span when compared to a growing number of annually-resolved proxy-based palaeoceanographic reconstructions of relevance to the North Sea. Therefore, we also chose of those available, the Wang et al. (2017) AMV reconstruction as it is a robust index that captures high and medium- to low-frequency sea surface temperature variability relevant to the North Sea for the past 12 centuries (Section 3.1). Other prominent sea surface temperature reconstructions, including those of Moberg et al. (2005) and Cunningham et al. (2013), were found to have weaker or inverse correlations with the PI and were therefore not considered further (see S1.1).
Developing the HPI
To extend the PI back to 1870 and 800, respectively, we employed a generalised additive modelling (GAM) approach. The GAM allows for linear and non-linear responses to be fitted and assessed, the latter with maximum degrees of freedom (number of knots) set to four. To further allow for potentially delayed or multi-year influences of sea surface temperature upon plankton abundance, our modelling also tested up to 3 lag years (along with the original (i.e. non-lagged) annual values) in a regular forward selection procedure in which the best model was chosen based on the improvement in the adjusted
Historical herring landings data
Historical Dutch herring data
The historical herring landings data examined in our study originate from the Historical Dutch herring landings series (1600–1795) (Poulsen, 2008; van Bochove, 2004).
To assess the applicability of our HPI, we focused on landings data for the northern Dutch ports of Enkhuizen, Delfshaven and Schiedam from 1600 to 1664. All three were very active ports with extensive volumes of fish landed in the first half of the 17th century and comparatively unconstrained by conflict (war and privateering). While the Flemish and Zeeland fisheries suffered during the Thirty Years War, the northern Dutch ports did well (van Vliet, 2003).
For the analysis of the association between the HPI and historical Dutch herring landings data we tested both the Pearson and Spearman rho correlation coefficients for completeness. Furthermore, prior to developing the historical plankton index, we investigated and reported one-tailed p-values because we expected a positive correlation between zooplankton abundance and herring landings (i.e. the hypothesised correlation is direction-specific), in line with the literature (e.g. Beaugrand and Kirby, 2010; Edwards et al., 2002; Hardy, 1956).
Normalisation and detrending of data
First, the historical plankton index (HPI) was compared to (via correlation analyses) the above-described historical Dutch herring landings series for three key ports between 1600 and 1664 in units of metric tonnes, as compiled and processed by van Bochove (2004). However, these original ‘untreated’ landings data exhibit longer-term (multi-decadal) trends that may be at least part-driven by anthropogenic and other influences (e.g. the changing socioeconomic importance and/or the siltation of the ports in question (van Bochove, 2004)) that may obscure underlying associations between zooplankton abundance and annual landings. We thus repeated our correlation analysis on landings data that had these longer-term trends controlled for. This was undertaken by modelling these trends by fitting a cubic spline, and then subtracting this spline from the data. The cubic spline allows for a certain amount of curvature on the visualisation of the data and is a standard method to be used in these scenarios (Chuang et al., 2011; Wongsai et al., 2017) We then normalised the resulting detrended data by setting each annual value relative to the mean and standard deviation of the 10 years immediately preceding. This treatment allowed us to better isolate any existing associations in the higher-frequency (e.g. relative interannual) variability of the landings against that of the HPI. Then the correlations between the HPI and landings data were reassessed. As with the correlations with the untreated data, we report one-tailed p values for the results.
Statistical analysis
All statistical analyses were performed in R Studio 1.3 (GAM approach), PAST3.20 (historical data) and MS Excel (preliminary correlation analysis). The visualisation of most data was carried out in R and MS Excel. ArcGIS was employed to create the North Sea map in Figure 1 using DEM data from EUEnvironment (accessed 20 Nov 2018 https://land.copernicus.eu/imagery-in-situ/eu-dem/eu-dem-v1.1) and bathymetric data from EMODnet (accessed 23 Nov 2018 http://www.emodnet-bathymetry.eu/).
The data supporting the manuscript are additionally published in the repository Ocean Biodiversity Information System (OBIS).
Results
The Historical Plankton Index
Association between SSTs and zooplankton
We begin by confirming the inverse (negative) association between zooplankton abundance and sea surface temperatures in the North Sea by overlaying the PI time series (1958–2007) on both selected sea surface temperature time series, the Hadley SST (NS sst) index and AMV reconstruction (Figure 3). Visual inspection suggests (also being confirmed by statistical analysis below) that the inverse association indeed exists for both SST time-series against the PI, with it being most pronounced for the PI relative to the Hadley NS sst index (Figure 3). A marked transition in the late 1980s/early 1990s to warmer temperatures can, for example, be seen to coincide with a notable decrease in PI values (Figure 3).
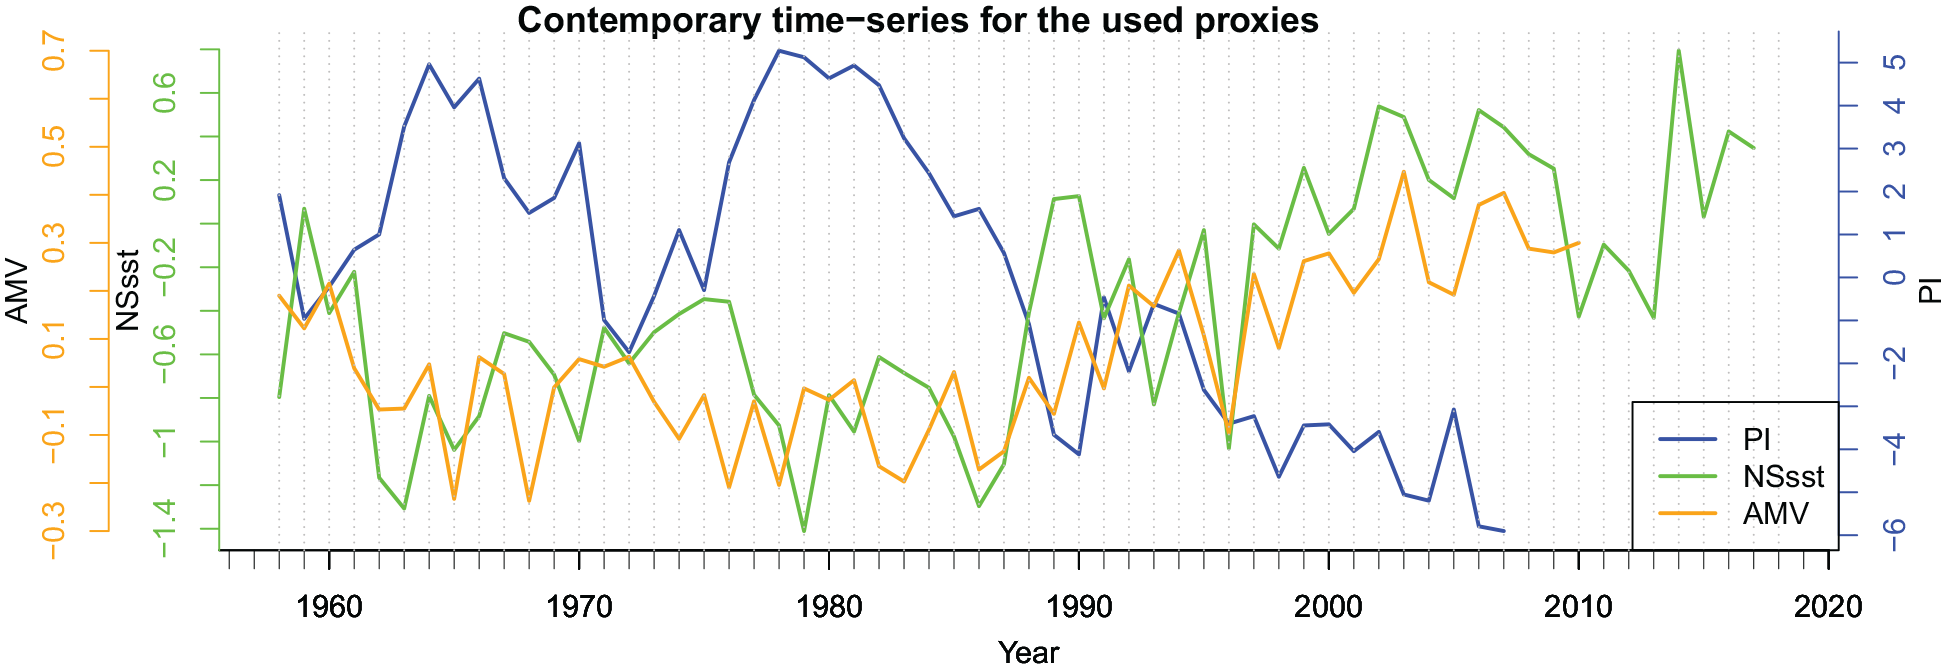
Time-series of the Plankton Index (PI, secondary axis to the right) and the sea surface temperature indices, HadlSST1 SST (NS sst), AMV for the contemporary time period 1958–2017.
To more formally characterise the above-described associations, we employ Pearson correlation analysis, which confirms (Figure 4a and b) a strongly negative and statistically significant association between the PI and both the Hadley NS sst and the AMV datasets. Thus, for the PI and NS sst we observe R = −0.80 with a one-tailed p of <0.01, while for the PI and AMV we observe R = −0.68 with a one-tailed p of <0.01. Plankton abundance in a given year is also known to be potentially influenced by SSTs not only in the same year, but by SSTs in preceding years 1 and 2 (lag1 and lag2). For the PI and NS sst we thus observe R = −0.72 (p < 0.01) and R = −0.56 (p < 0.01) at lag1 and lag2, respectively, while for the PI and AMV we observe R = −0.66 (p < 0.01) and R = −0.6 (p < 0.01) at lag1 and lag2, respectively. Detrended cross-correlation analyses therefore suggest that SSTs in the 2 years (lag2) immediately preceding may also meaningfully influence zooplankton abundance. We use this finding to inform our approach to the reconstruction of historical plankton abundance. In sum, these results suggest that it was feasible to build a predictive model that can be used to extend the PI by capitalising upon the long-time spans covered by the NS sst and AMV data, that is, back to 1879 and 800 CE, respectively.
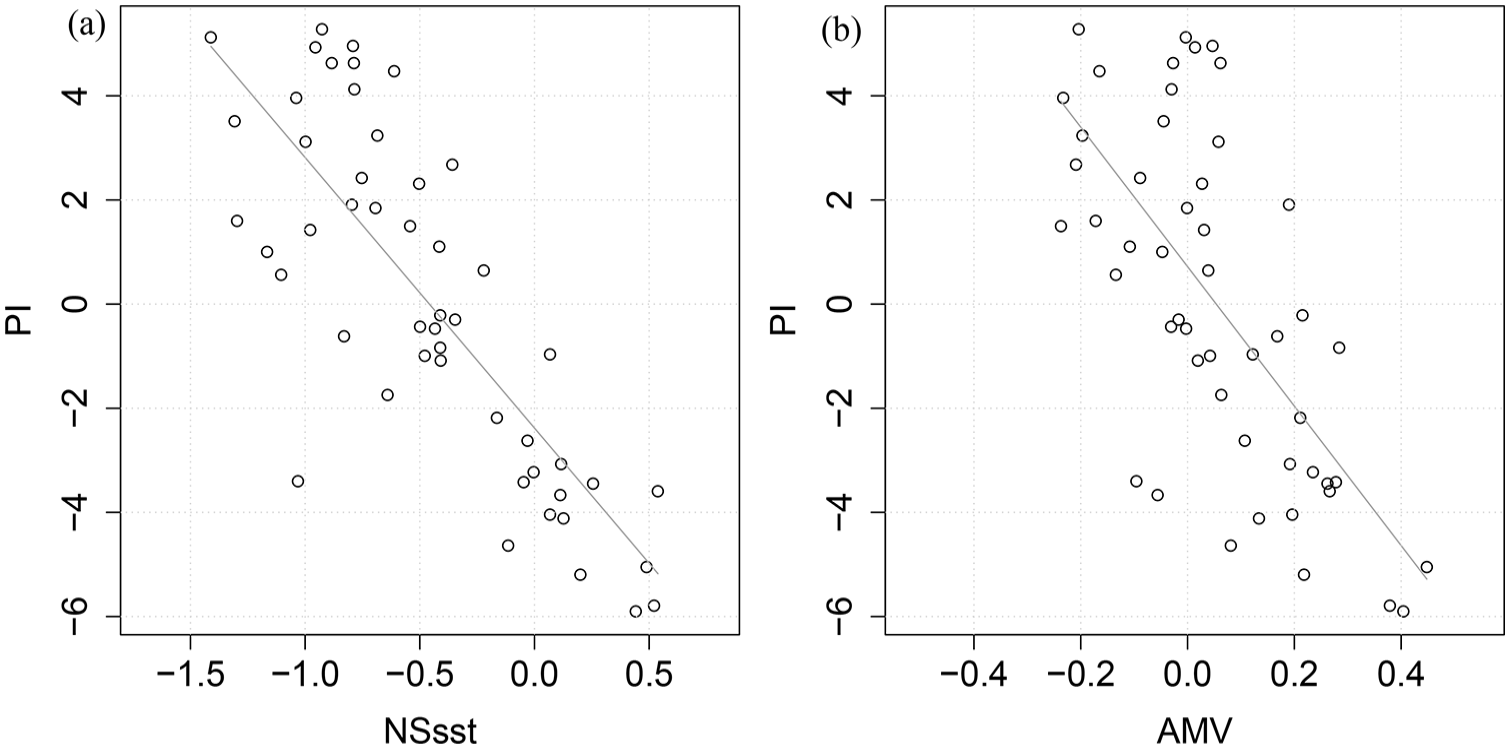
Scatter plots and correlation of the Plankton Index and the (a) North Sea sea surface temperature (NS sst) – R = −0.8 p < 0.01 (b) the Atlantic Multidecadal Variability (AMV) – R = −0.68 p < 0.01 for the time period 1958–2007.
Reconstructing the plankton index
Our Generalised Additive Modelling found that the AMV holds the greatest explanatory power for the PI when adopting a linear model dependent upon lag1 and lag2 (adjusted
Calibration and verification
An inherent uncertainty in applying models to create these reconstructions is the extent to which the association between the PI and both temperature series can be assumed to remain stable and stationary over time. Here, the particular concern is the stationarity of the modelled associations between the PI and Hadley NS sst index and the PI and AMV reconstruction beyond their (1958–2007) overlap periods. If the pre-1958 association differs substantially from the modelled association (e.g. in strength, statistical significance and even sign) then the accuracy of the reconstructed PI values are impacted. One approach to assessing stationarity is the application of a calibration-verification period. Here, this entailed dividing the 50 year overlap period into a 25-year calibration period (i.e. 1983–2007) and 25-year verification period (i.e. 1958–1982). Modelling of the association between the PI and SST data was restricted to the calibration period, and all values pre-1983 were reconstructed. This has the benefit of allowing the comparison (and hence assessment of the accuracy) of the reconstruction values with the actual PI values for the verification period (1958–1982). The investigation showed a consistent direction in the correlation, but it was very weak, because (1) a lot of the correlation between the Hadley and the plankton data is driven by multi-annual (e.g. decadal) variability in each series and (2) relatedly, splitting the rather short overlap period between the Plankton Index and the AMV series, meant for too small a sample size to offer a full reconstruction that we can be confident in. Therefore, the full overlap period was used to captured as many of these decadal scale changes in both time series as possible.
And so, to achieve the best predictive models, we thus employed the full 50-year overlap period (Figure 5), and caution that stationarity cannot be assumed to fully hold during the entire reconstruction period. This is borne out by applying the above-outlined calibration-verification period approach in an exploratory manner, in which we again apply our GAM approach to reconstruct PI values for 1958–1982 based upon a temporally restricted modelling of the PI and AMV association from 1983 to 2007 only. Correlation of this temporally restricted PI reconstruction against actual PI values for the 1958–1982 verification period returns a positive and statistically significant association of moderate strength (Pearson R = 0.597, one-tailed p = 0.001). By comparison, the actual HPI_AMV reconstructed using the full 1958–2007 overlap period returns a stronger R of 0.658 (one-tailed p = 0.0002) against actual PI values for the 1958–1982 validation period. Given that the HPI_AMV includes the verification period in its modelling, it is unsurprising that it would achieve a higher correlation, but the fact that the restricted PI reconstruction has a broadly comparable strength of association suggests (though cannot confirm) that the HPI_AMV will maintain some useful predictive utility into the deeper past.
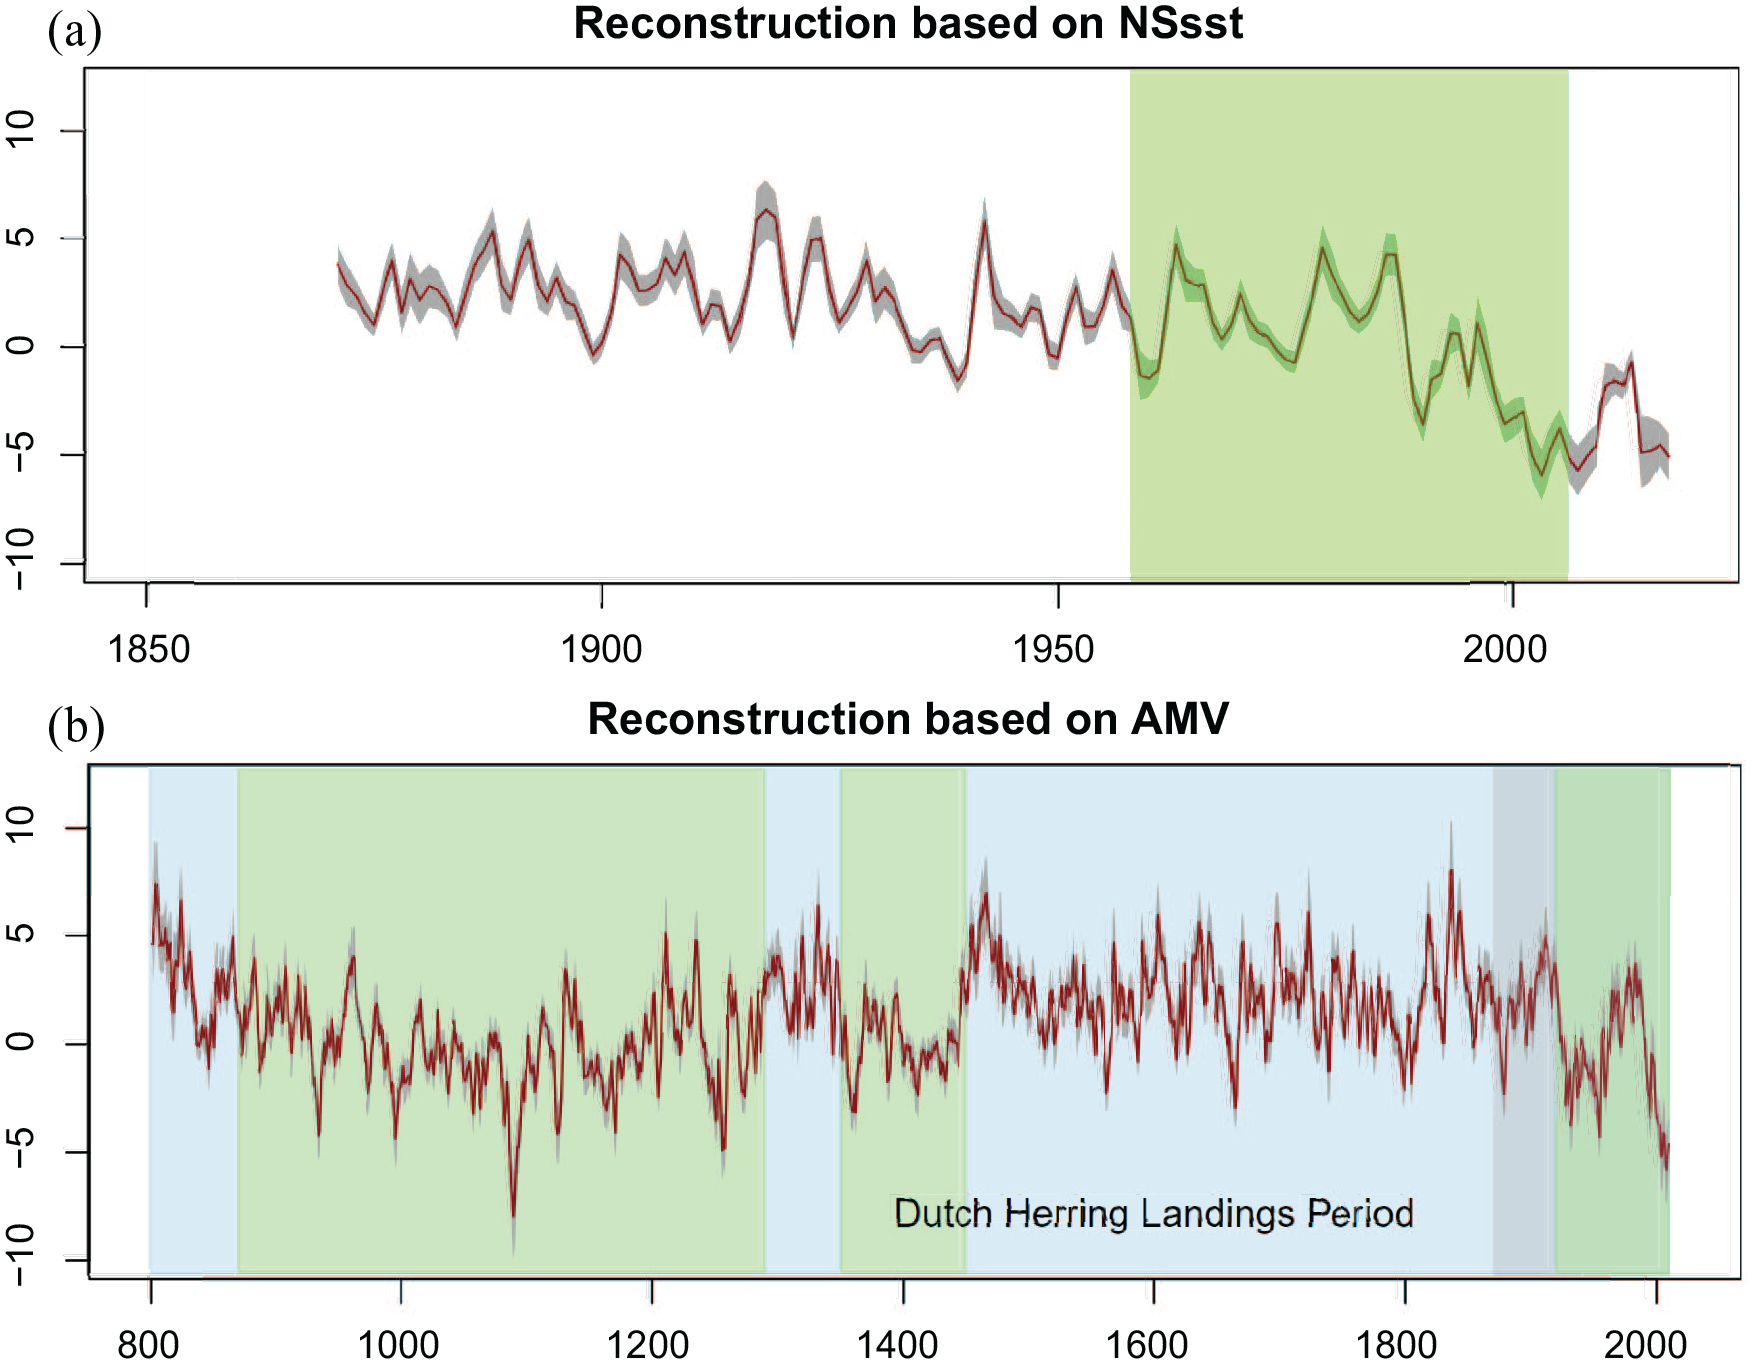
The Historical Plankton Index. (a) HPI_NSsst 1870–2017 based on the NS sst data 1870–2017, the light green shading indicates the period of the PI data which the index is based on (1958–2006). (b) HPI_AMV 800–2010 based on the AMV data 800–2010 CE; the light grey shading indicates the range covered by the HPI_NSsst index (1870–2006) while the light green and blue shadings highlight the different periods discussed in 4.3. The dark grey shaded area around the red line in both plots indicates the standard error while the red line represents the mean value of each reconstruction. Both reconstructions consist of annual data. The period of the ‘Dutch herring landings’ covers the time span 1600–1664 discussed in 3.2. Y-axes are expressed in z-score units which measure the distance between a data point and the mean using standard deviation.
Major features of the Historical Plankton Index time-series
Because each HPI time-series is constructed via the modelled negative linear association between the PI and our chosen temperature series, zooplankton abundances are predicted to decline during periods of warmer SSTs and vice versa. Major movements in the HPI_AMV can, for example, be seen to coincide with many well-known climatic phases, often characterised as part of the Medieval Warm Period (Medieval Climatic Anomaly) and Little Ice Age (Section 4.3). Notably elevated HPI_AMV values can be observed (Figure 5) in the 1460s (values between 5.69–6.94) in the decade following two major climate-cooling volcanic explosive eruptions (PAGES 2k Consortium, 2013; Sigl et al., 2015), while a low in reconstructed abundance is observed for a decade from the late 1650 (HPI values are between twice and 10-times lower than in the 1460s), with the 1650s and 1660s known to have experienced multiple years of severe summer drought across North-western Europe (Cook et al., 2015) and represented a brief recovery in an otherwise notably cool period for Europe (PAGES 2k Consortium, 2013). This low in zooplankton abundance also occurred during the period for which reliable historical Dutch herring landings are available, and we investigate these further in Section 3.2. A notable recent trend is a sharp decline in zooplankton abundance since the 1980s, visible in both HPI reconstructions and the modern PI data (Figures 3 and 5), also further considered in Section 3.2. In addition to decadal and broader-scale trends, the reconstructions identify notable individual years, with the highest peak for the HPI_AMV in 1836 and 1837 with 7.99 and 8.01, respectively, while the lowest values are given for 1087 to 1090 with −6.03 to −7.97.
Zooplankton productivity and commercial herring fishery
As noted in the introduction, lower trophic level fish species that feed directly on plankton are correlated positively in abundance with higher values of the contemporary Plankton Index (Beaugrand and Kirby, 2010). In this section we assess whether our HPI can offer any notable explanatory power regarding historical herring catch variations, considering that catch volumes are influenced by many variables additional to underlying herring abundance (e.g. fishing technology, conflict), and that herring abundance is itself influenced by factors other than plankton abundance. For this assessment we compare reconstructed plankton abundance (using the HPI_AMV) and North Sea catch volumes over a multi-decadal time-span during the early seventeenth centuries (1600–1664) using the Dutch landings time-series (Poulsen, 2008; van Bochove, 2004).
Enkhuizen data
Enkhuizen was the most productive port for the early modern Dutch herring fishery. The port’s landing values reflect this, being triple (48,124 metric tonnes) those of the next most important port, Delfshaven (max. 15,001 metric tonnes) and more than five times that of Schiedam’s landings (max. 9003 metric tonnes; van Bochove, 2004). Landings into Enkhuizen were, however, notably variable from the early 1600s up to the early 1620s. The overall second highest peak (of 46,841 metric tonnes) was thus seen in 1602 followed by one of the lowest troughs in 1605 (with 20,901 metric tonnes), while the highest peak in 1619 (with 48,124 metric tonnes) was followed by comparatively modest landings only 3 years later in 1622 (with 17,507 metric tonnes). The complex interplay of environmental and human drivers underlying these varying catches means that absolute year to year correspondences between the landings and HPI should not be expected. Thus, while the bumper landings of 1602 also exhibit a high HPI value (of 5.03), the much reduced catch of 1605 co-occurred with a still comparatively high (if still lower) HPI of 4.55. The peak catch of 1619, moreover, occurred in a year of low reconstructed plankton abundance (HPI of 0.83), with the low catch year of 1622 having a low HPI (0.84). Similarly, while the HPI displayed the highest zooplankton abundance in 1603 (HPI 5.97), with another high peak in 1636, landings for Enkhuizen in both years were not at their maximum (though certainly not inconsiderable, with 34,175 metric tonnes in 1603 and 34,175 metric tonnes in 1636, respectively (Figure 6, top panel)).
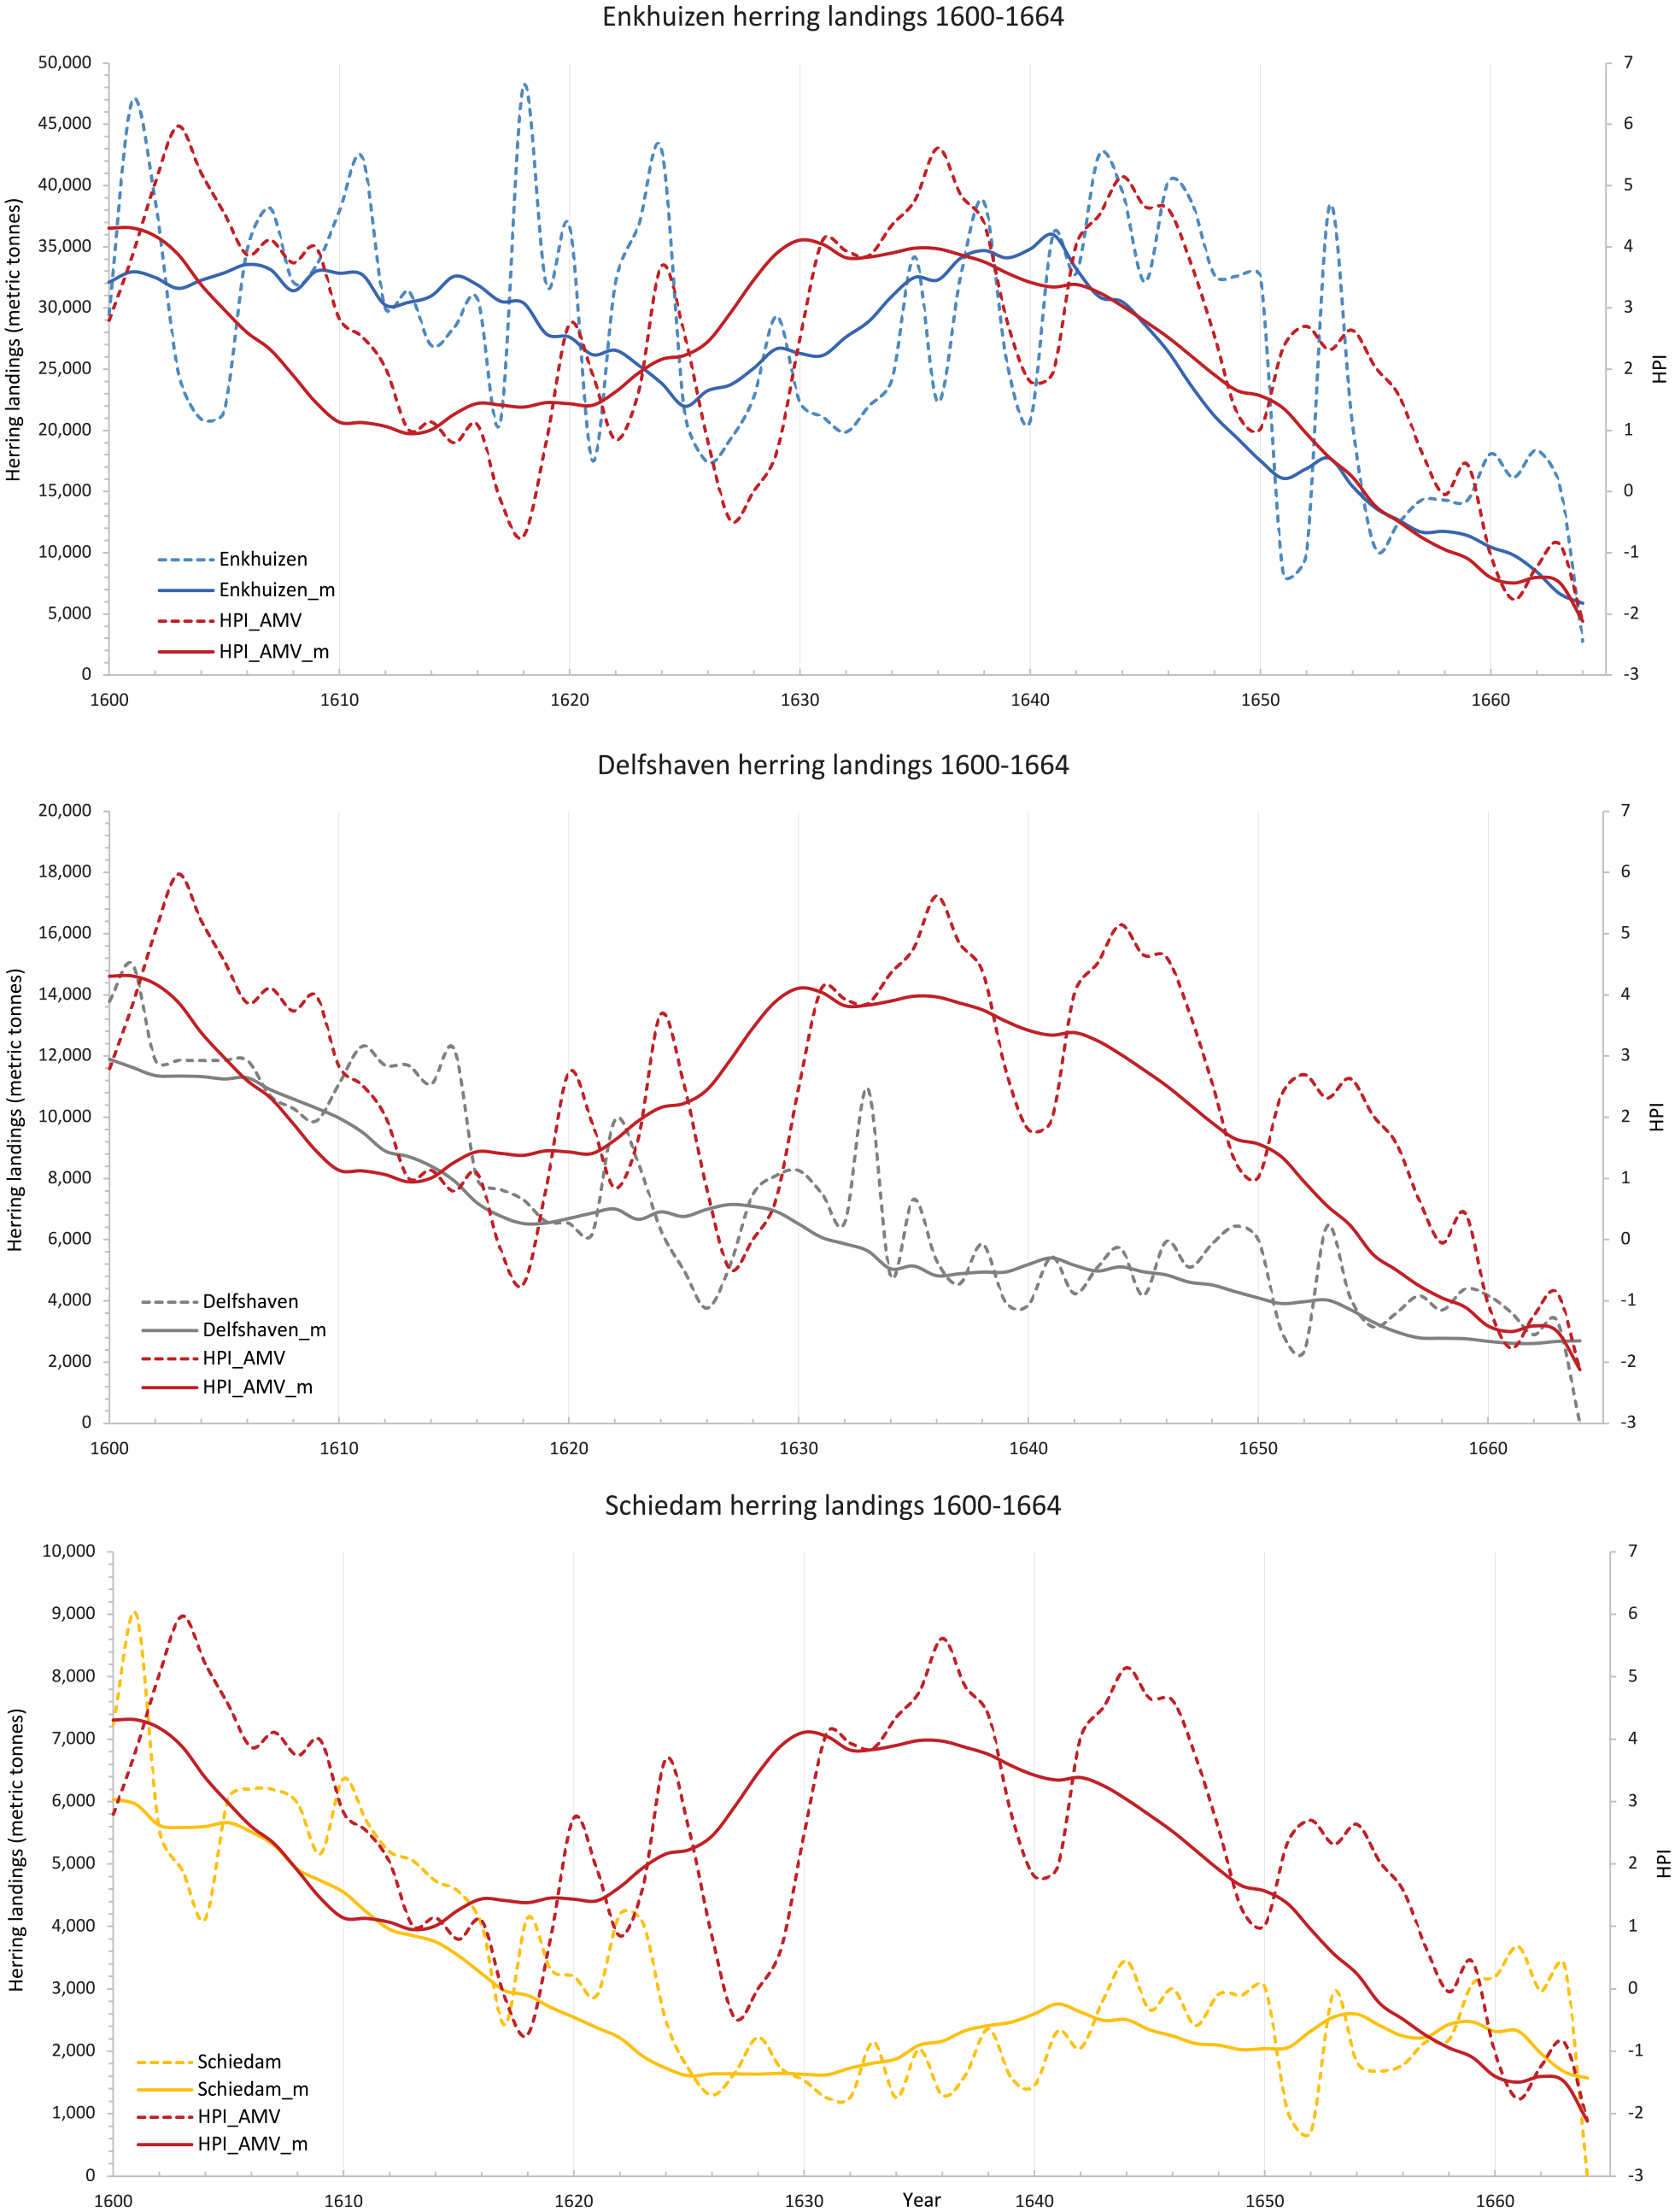
Dutch herring landings from Enkhuizen, Schiedam and Delfshaven port during 1600–1664 CE in relation to the HPI modelled based on the AMV (secondary axis on the right). The dashed lines are the treated annual landings data for each of the fisheries and the modelled historical plankton index data based on the relationship between the Plankton Index and the AMV covering the period between 1958 and 2007. The solid lines for each reconstruction as well as the landings data are generated by a centred moving average of 10 years.
A statistical comparison of Enkhuizen landings and the HPI across the 1600–1664 period as a whole returns a positive and highly statistically significant correlation, with a Pearson R of 0.45 (one-tailed p < 0.001; see Table 1). A Spearman rank correlation returns comparable results (R = 0.49, one-tailed p < 0.001; see Table 1). Pearson is commonly used where data are normally distributed. Spearman rank correlation was used here in addition, to cover scenarios when data might not have been normally distributed. Using both correlations and having similar values returned, we do not need to be concerned with the distribution of the data. Visually, the herring landings at Enkhuizen are often observed to follow the HPI on both interannual and interdecadal timeframes, though with some departures in the scale of the observed covariation and more rarely in the direction of trends (Figure 6). For example, a low seen in the HPI in 1627 (−0.48) is consistent with the reduced landings of the late 1620s and early 1630s, whereas the highest reconstructed abundance (HPI = 5.62) in 1636 is not associated with higher landings. The decline of the HPI towards the 1650s is, however, followed by falling landings, though with some apparent lag into the 1660s. Then, however, while the HPI experiences another increase from the 1650s onwards, the landings into Enkhuizen port continue to drop (in a process that may reflect the decline in economic importance of this port, as much as any actual change in herring abundance, van Vliet, 2003). The difficulty in separating longer-term anthropogenic from natural influences on herring catch, as well as an interest in determining whether the HPI can also explain shorter inter-annual variability in herring catch, led us to detrend and normalise it (discussed in Section 2.3.2; see also S1.6.2-1.6.4 for a comparison between the original and ‘treated’ data). Repeating our analyses between the herrings landings and the HPI with detrended and normalised data, we find more moderate but still highly statistically significant positive correlations of R = 0.34 (Pearson; one-tailed p = 0.006) and R = 0.37 (Spearman; one-tailed p = 0.002) between the treated Enkhuizen landings series and the HPI, also detrended and normalised for parity.
Overview of the Dutch herring landings for 1600–1664 correlated with the Historical Plankton Index based on the Atlantic Multidecadal Variability (AMV) for treated and untreated landings data.
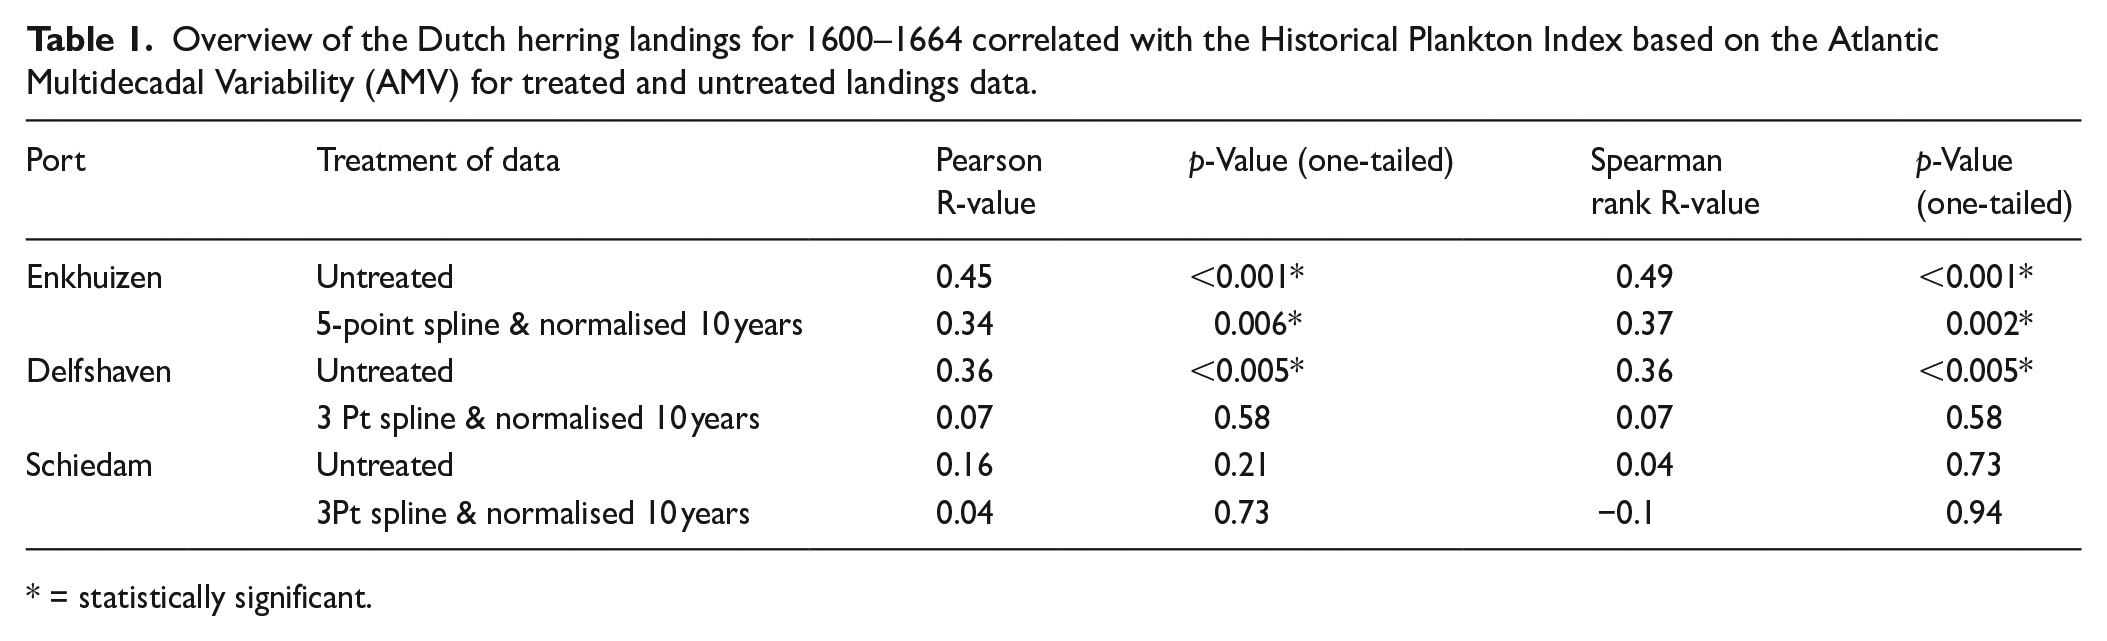
* = statistically significant.
Delfshaven data
Delfshaven displayed commonalities with Enkhuizen, both in the long-term downward trend of herring landings and in years of particular note (Figure 6 middle panel). For example, the highest herring landings in Delfshaven were recorded as 15,001 metric tonnes in 1602, corresponding with the highest landings brought into Schiedam (9003 m) and the second-highest landings into Enkhuizen (46,841 m) in this same year. Notably, this year also exhibited one of the higher HPI_AMV values (5.03) for the period. Delfshaven’s long-term trend of decreasing herring landings is more pronounced (and sustained) than that in Enkhuizen. But this is not always mirrored in the HPI_AMV, with departures in the 1620s and later 1650s/early 1660s when the HPI_AMV instead trends upward. Nonetheless, comparing these landings to the HPI_AMV for the period 1660-64 returned R values of 0.36 for both the Pearson and Spearman rank correlation coefficients, respectively, with highly statistical significance at p < 0.005, one-tailed (Table 1). Detrending and normalising the Delfshaven landings data produces different results to the ones seen for Enkhuizen, with strongly reduced R values of 0.07 for both Pearson and Spearman rank coefficients, respectively and no statistical significance (one-tailed p = 0.21 and p = 0.58, respectively), suggesting that the original statistically significant correlation is driven mainly by the longer-term (lower frequency) covariance between the HPI_AMV and Delfshaven landings.
Schiedam data
The Schiedam data complicate the picture further. When the untreated data are analysed the correlation is weak (Pearson R = 0.16 and Spearman rank R = 0.04, respectively) and unsurprisingly not significant (p = 0.21 and p = 0.73, respectively). Visualising the data (Figure 6) shows that the Schiedam landings and the HPI_AMV do not follow the same long-term trend: the HPI_AMV experiences, for example, its most significant low in 1661, while herring landings slightly increase in this year. For both HPI peak years 1603 and 1636 Schiedam port landings were only moderate with 5545 metric tonnes and 2032 metric tonnes, respectively. Repeating our analyses on the treated (detrended and normalised data) did not reveal any convincing correlation with the HPI_AMV (Pearson and Spearman rank R = 0.04 and −0.1 with one-tailed p = 0.73 and p = 0.94, respectively; see Table 1) and therefore did not contribute to confirming the positive correlation between high zooplankton abundance and high herring landings in a meaningful way.
For details on the treatment and further analysis of the Dutch herring landings data as well as cross-correlations between the HPI and each port’s herring landings data, see S.1.6.
Discussion
The speed at which the biosphere will respond to global warming remains a major uncertainty (Beaugrand et al., 2009; Strack et al., 2022). Some studies have shown that the marine environment tends to respond more rapidly than terrestrial systems due to the short life-span of the phytoplanktonic base of the marine, pelagic food-web (e.g. Beaugrand, 2009; Edwards and Richardson, 2004; Lenoir et al., 2020; Perry et al., 2005). It has also been argued that sea surface temperature warming might ultimately in some locations have as great an impact as overfishing (Beaugrand, 2014; Beaugrand and Kirby, 2018). Therefore, there is a need to disentangle environmental forces and direct human influences to understand the drivers of the marine ecosystem in a changing climate in order to support a holistic management of fisheries for present and future scenarios.
With the historical plankton index (HPI), we offer a proxy for the long- and short-term variability in marine productivity for the North Sea and demonstrate its significance as an ecological control on the availability of marine food for human consumption through time. The HPI was reconstructed based on the relationship between a contemporary plankton index (Beaugrand and Kirby, 2010) and two prominent sea surface temperature time-series: the AMV (Wang et al., 2017) and Hadley NS sst index (Rayner et al., 2003). Already our results reveal zooplankton abundance as an important, and now for the first time quantifiable, driver of early modern North Sea herring fisheries taking the example of the Dutch fleet that dominated in the 17th century. At the same time, the HPI provides an ecological variable to inform future analysis of historical change in marine species abundance, also relevant for Sustainable Development Goal 14 (Life below water), especially targets 14.2 (sustainably manage and protect marine and coastal ecosystems) and 14.4 (regulated harvesting and ending overfishing).
Climate indicators
Two prominent climate indicators were used for the development of the HPI – the UK Hadley Met Centre dataset HadISST for the North Sea domain, comprising instrumental sea surface temperature measurements back to 1870 (Rayner et al., 2003), and the annually resolved Atlantic Multidecadal Variability (AMV) reconstruction of Wang et al. (2017) back to 800. The foundation for the development of the HPI was the well-established influence of climate variability on the marine biological environment (e.g. Brander, 2005; Fromentin and Planque, 1996), with sea surface temperatures known to drive inter-annual variability in the abundance of zooplankton communities (Beaugrand et al., 2003). This especially includes the population size of large oceanic arctic copepod Calanus finmarchicus (Greene et al., 2003; Greene and Pershing, 2000) that dominates the zooplankton biomass and secondary production in many North Atlantic shelf ecosystems: the North Sea, North East Atlantic and Gulf of Maine/Scotian Shelf regions (Greene et al., 2003).
The association between sea surface temperature and zooplankton is clearly evident between the Hadley North Sea surface temperature data-series (Rayner et al., 2003) and the plankton index (PI) (Beaugrand and Kirby, 2010), allowing us to develop a historical plankton index (HPI) back to 1870. Given the strength of the Hadley NSsst and PI association of R = −0.80 and its convincing linear character, the resulting HPI_NSsst reconstruction is to be preferred for use back to 1870 over the reconstruction based on the AMV. However, to reconstruct a longer period and to investigate the relationship between the Dutch herring fisheries (Poulsen, 2008; Van Bochove, 2004) and the HPI in the 17th century, we additionally employed the annually resolved Atlantic Multidecadal Variability (AMV) reconstruction of Wang et al. (2017) back to 800 (with R = −0.68). The AMV has the advantage of a multi-centennial time-span that captures both higher (interannual to decadal) and lower (multidecadal and greater) frequency sea surface temperature changes as driven by both internal variability (such as the Atlantic Multidecadal Oscillation, AMO, though see Mann et al. (2021 for scepticism regarding the existence of this oscillation) and external forcing (such as explosive volcanism). The North East Atlantic provides the relevant source water for the North Sea (Figure 1) (Hill, 1973; Otto et al., 1990) and its large-scale variability is often mirrored in the waters of the North Sea (Hill, 1973; Huthnance, 1991), influencing plankton growth on a larger scale (Braarud et al., 1953; Cleve, 1899). We thus observed that the AMV correlated statistically significant with the PI to offer an additional longer-period reconstruction. The weaker correlation of the AMV with the PI compared to the correlation between the Hadley NSsst and the PI can possibly be explained by the 47 source indices from the broader North West Atlantic region that the AMV is based on.
We offer the HPI_AMV for its potential in examining ecological contributions to major changes in human consumption of fish with a North Sea provenance in the deeper past, such as the ‘marine event horizon’ seen in zooarchaeological evidence for the dramatic increase in North Sea fish consumption in England c.1000 CE (Barrett et al., 2004). North Sea productivity reconstructions based upon dedicated North Sea temperature reconstructions (or directly from temperature-relevant proxies) are an attractive prospect to inform us of the historical fisheries and species distribution in the North Sea.
The Historical Plankton Index compared to herring landings
A positive association between zooplankton abundance and the populations of many pelagic fish species is well established in the literature (e.g. Beaugrand and Reid, 2012; Capuzzo et al., 2018; Edwards et al., 2002; Hardy, 1956; Olsen et al., 2011; Vallina et al., 2014,). We investigated whether our reconstructed HPI-AMV explained any meaningful proportion of the variable annual landing values of the famed Dutch fishing fleet that dominated the North Sea herring fishery of the 17th century (Poulsen, 2008; van Bochove, 2004).
Historical herring landings
Examination of Dutch landings from 1600 to 1664 identified several statistically significant positive associations with (reconstructed) zooplankton abundance, consistent with expectations of herring-plankton dependencies from the published literature (see earlier references), but not without the complexities of trying to identify and separate the natural dynamics from the anthropogenic activities.
The chosen period was a time of relative peace (excepting considerable activity by Dunkerque pirates, van Vliet, 2003) and growth in the northern part of the Netherlands, chosen for this reason to provide perhaps the best opportunity of observing the influence of reconstructed zooplankton abundance on documented herring landings, with more minimal complications from warfare that often disrupted fishing (Beare et al., 2010; Holm, 2012). The results of our analyses show that some 20.3% of the variance in annual herring landings in Enkhuizen between 1600 and 1664 is ‘explained’ by (or shared with) the variance in zooplankton abundance. This leaves a substantial 80% unexplained. Much of the observed landings variability may be obscured by anthropogenic influences. Especially for Enkhuizen landings certainly cannot be considered a perfect proxy for herring abundance even though it was not till after the Second Anglo-Dutch War (starting 1664) that the fishing industry went into heavy decline (Poulsen, 2008; van Bochove, 2004). Other human activities may have influenced the fishing industry during the investigated period. They may have been short lived like piracy (with dozens of fishing vessels captured in some years in the period (Sicking and van Vliet, 2009; van Vliet, 2003)), or competition from fishers landing catch at other ports (not only Dutch, but Swedish, Danish, English, etc. (van Bochove, 2004)), or more permanent impacts like the potential changes in relative demand for herring when acting as a potential substitute for varying food supplies from terrestrial agriculture impacted by conflict, weather, crop and animal pests and diseases (Poulsen, 2008; van Bochove, 2004). The Dutch fishing fleet was also faced by natural hazards, not least the great storms for which the North Sea is notorious (e.g. Fagan, 2018; Lamb and Frydendahl, 1991). All of these factors could explain parts of the unknown variability of the herring landings.
Moreover, the HPI_AMV nominally reconstructs only that proportion, even if sizable, of historical zooplankton variability associated with sea surface temperatures (with the Wang et al. (2017) AMV reconstruction itself capturing only that proportion of sea surface temperatures for the North Sea reflected in its proxies). And while our results can potentially explain 20% of the variance of herring landings due their food supply (zooplankton), there are other natural influences on both zooplankton and herring abundance that were not accounted for in this investigation and which may operate individually and in potential synergy (Benedetti et al., 2021; Ratnarajah et al., 2023), including ocean current changes and varying nutrient availability from coastal run-off influenced by trends in storminess and precipitation over land plus anthropogenic factors such as farming and deforestation that may alter rates of streamflow, erosion and sediment transport downstream (e.g. Groß et al., 2022; Lefebure et al., 2013).
It is also important to note that sea surface temperature variability influences herring populations both directly and indirectly, and these influences may be antagonistic (Sswat et al., 2018). The indirect sea surface temperature influence on herring abundance via zooplankton abundance is well established and generally held to be a strong control due to its influence on water column stability (Atkinson et al., 2015; Beaugrand and Kirby, 2010; Olsen et al., 2011), with colder temperatures promoting increased zooplankton abundance that supports greater herring populations. This is consistent with the observed positive association between the HPI_AMV and Enkhuizen landings. The timing of herring spawning is, however, also temperature dependent (Berenbeim and Sigaev, 1977; Messieh, 1978; Ware and Henriksen, 1978) and can act in an antagonistic manner to the zooplankton-mediated temperature effect. Thus, colder temperatures can reduce herring abundance by delaying spawning and reducing the survival of larval herring (Lambert, 1987). The competing effects of temperature variability on herring abundance may reduce the explanatory power of the HPI_AMV regarding historical catch variability, relative to a reconstruction that might be based upon a broader range of influences on zooplankton abundance such as multifactorial modelling which, to our knowledge, does not yet exist. Given the range of such additional potential influences, the observed explanatory power of the HPI_AMV is arguably even more notable.
Results from the ports of Delfshaven and Schiedam are more ambiguous than the results from Enkhuizen. Both reassuringly exhibit the expected positive association, if more weakly, especially in the case of Schiedam landings (which is not significance). Taking the results from all three ports together, however, the evidence supports the contention that the famously variable landings (Poulsen, 2008; van Bochove, 2004; van Vliet, 2003) of the 17th century Dutch herring fleet were partly (namely up to 20%) influenced by natural variations in herring abundance as associated with temperature-driven zooplankton abundance changes. But in specifically considering the weaker associations between the HPI_AMV and landings at Delfshaven and Schiedam, it is notable that both ports hosted 3 and 5 times smaller landing volumes than Enkhuizen, respectively. It is worth mentioning that Schiedam, with the weakest observed association, also had the smallest landing volumes. We may therefore posit that anthropogenic influences more readily dominated their observed variability (i.e. catch volumes returned to these ports may have sometimes been below a sufficient sample to clearly capture a signal of variations in herring abundance). A comparable challenge in using modern catch data as a measure of actual fish stocks are discussed by Hilborn and Walters (1992) and Poulsen and Holm (2007), with the essence of the problem being that proportionality between catch rate and stock abundance cannot always be assumed.
Further work and investigations
To more fully assess the relative contribution of natural ocean productivity to the fortunes of the early modern Dutch herring fishery, aggregate landings from multiple ports may better reflect (in being more potentially limited by) variations in herring abundance. Taking landings over a more extended period may provide more statistical power. While the enforcement of strict regulations concerning fishing gear and vessels over the seventeenth and eighteenth centuries largely precludes variability driven by technological change (Poulsen, 2008; van Bochove, 2004), formally modelling other anthropogenic influences will be important. This can exploit measures of piracy impacts (e.g. Sicking and van Vliet, 2009; van Vliet, 2003), the timing and intensity of warfare (e.g. Miller and Bakar, 2023; Poulsen, 2008) and variations in terrestrial agricultural yields, food prices and the climatic variability influencing these (e.g. Allen and Unger, 2019; Charpentier Ljungqvist et al., 2023; Esper et al., 2017). Also valuable will be the development of a historical plankton index based upon temperature-sensitive proxies more exclusively relevant to the North Sea than those employed in the Wang et al. (2017) AMV reconstruction. Non-temperature-related changes in zooplankton abundance as, for example, driven by terrestrial nutrient run-off variability might also be variously modelled using evidence for inter-related changes in settlement, land-cover, storminess and streamflow (e.g. Bunzel et al., 2021; Johansson et al., 2020; Lamb and Frydendahl, 1991; Yang et al., 2020).
Regime shifts and historical representativeness of the PI
It is challenging to establish prevailing conditions in the North Sea during the investigated time-period as detailed observations on physico-chemical parameters, phyto- and zooplankton composition and other phenology studies are increasingly scarce before the mid-20th century. However, contemporary studies show that the North Sea has undergone regime shifts (Beaugrand, 2004; Reid et al., 1998, 2001a; Weijerman et al., 2005) in recent times. One such happened in 1987/88 (Reid et al., 1998), an observed change in zooplankton community structure and organism phenology (Alvarez-Fernandez et al., 2012; Beaugrand, 2004; Beaugrand and Reid, 2003; Reid et al., 2001a) coincided with a pronounced change in gadoid fish recruitment (Beaugrand, 2004). The cause was thought to relate to changes in large-scale hydro-meteorological forcing with increasing sea surface temperature, large-scale salinity anomaly (Dickson et al., 1988) and change in wind intensity (Beukema, 1990) and direction at the end of the 1970s in the west European basin. This then changed the location of an oceanic biogeographical boundary along the European continental shelf (Beaugrand, 2004). It is likely that regime shifts have happened in the deeper history of the North Sea and with it a change in zooplankton phenology. If so, the composition of zooplankton species included in the contemporary PI may vary in how well it reflects the zooplankton community structure that dominated at different times in the historical North Sea, similarly making the HPI of variable potential relevance. Future work may include different zooplankton species compositions for a historical plankton index. Other methods, for example, to reconstruct Atlantic herring recruitment in the North Sea for the past 455 years were applied by Estrella-Martinez et al. (2019) who used the σ13C signal from annual shell increments of the ocean quahog Arctica islandica, which are directly influenced by the abundance of phytoplankton.
HPI and the longer-term development of North Sea fisheries
The HPI reconstruction based on the AMV through time (800–1958, Figure 5) provides an opportunity to recalibrate explanations of changes in fish catch revealed by historical and archaeological data. In general, we assume that the North Sea fisheries will have benefitted from periods of high ocean productivity. However, other demographic and socio-economic factors may have prevented fishers from reaping the benefits or experiencing the decline. The full implications of the HPI for societal development, including a formal correlation analysis, must be pursued in dialogue between marine scientists, climatologists, archaeologists and historians. Here we restrain ourselves to making some preliminary observations for potential future lines of investigation. For ease of reference we have identified broad periods of positive and negative ocean productivity potential.
- 800–870: Strongly positive (HPI_AMV median: 3.19). Historians and archaeologists have demonstrated that North Sea fisheries at the time were largely restricted to riverine environments (Barrett et al., 2004; Hoffmann, 1996). There will, therefore, have been little opportunity to benefit from heightened marine productivity. However, Viking Age archaeology does indicate that this may have been a time of increased cod fishing (Star et al., 2017).
- 871–1290: Negative (HPI_AMV median: −0.22), with particularly low levels 1291–1300 and 1331–1340. Archaeologists have identified increased nearshore herring fisheries in the North Sea from around 1050 and increased offshore demersal fisheries in the 13th century (Barrett, 2019). The fishery seems to have expanded unencumbered by comparatively lower zooplankton production.
- 1291–1350: Strongly positive (HPI_AMV median: 2.98). This was a period of considerable societal stress with the onset of more frequent harvest failures and famines and the start of large-scale reorganisations in northern hemispheric atmospheric circulations (e.g. Campbell, 2016; Campbell and Ludlow, 2020). It was also a period of marked increase in marine fisheries with substantial evidence of exploitation of deep-sea species (Orton et al., 2014). Increased marine resources would have helped sustain a human population in need of supplementary food, especially along the coasts.
- 1351–1450: Slightly Negative (HPI_AMV median: −0.08). This was a period of demographic disaster (Black Death) which reduced the European population by 30–60%. The decline of plankton production was a potential additional environmental challenge, but may not have had much impact on fisheries relative to the likelihood of the industry contracting anyway because of the loss of lives.
- 1451–1920: Positive (HPI_AMV median: 2.20). The North Sea fisheries experienced sustained growth for almost half a millennium (Holm et al., 2019). In the first three centuries, 1451–1750, the Flemish and Dutch herring fisheries dominated landings. It should be noted that the HPI_AMV median reached a high of 3.50 in the half century 1451–1500 when the Flemish North Sea fishery took off. The expansion of commercial fisheries will likely have benefitted from strong marine productivity in the decades of 1591–1610, 1631–1650, 1691–1710, 1721–1730 and 1741–1760. In the second half of the 18th century, the Dutch herring fishery was much reduced, and it is conceivable that the relatively low HPI_AMV values of the time may have contributed. After half a century of low productivity, the HPI_AMV shot up again in 1831–1850, 1861–1870, and 1901–1920. By this time, the North Sea herring fishery was dominated by English and Scottish efforts. The 19th century was a period of dramatic increase of the North Sea fishery with an almost exponential increase of herring landings, eventually leading to the collapse of the herring stocks just before the First World War. Between 1831 and 1850 the HPI_AMV was exceptionally positive (median 4.45) and likely will have increased marine productivity
- 1921–2010: Negative to strongly negative (HPI median: −0.72). The 20th century was a period of dramatically increased fishing power and repeated crashes of fish stocks, eventually leading to strong management intervention. Negative plankton production will have exacerbated these problems.
These broad-brush observations are presented only as pointers of the potential usefulness of the HPI. As historical evidence of past fishing effort is increasingly becoming available through archival and archaeological research the HPI will be a critical tool for modelling the complicated interactions of ecology and economics.
Work is currently conducted where the HPI based on the Hadley temperature dataset is compared with cod landings data from more recent times (1870 to present).
Conclusion and outlook
This paper presents two Historical Plankton Indices as a step towards assessing long-term changes in marine food availability, as influenced by past climatic and related sea surface temperature variability. It also examines whether and to what degree the natural dynamics of ocean productivity can explain the variability of past commercial fisheries. We demonstrate that up to 70% of the variability of 20th century zooplankton abundance can be linked to variations in sea surface temperature in the North Sea, thus holding strong predictive power to develop a Historical Plankton Index as a proxy for past ocean productivity. Our results indicate that up to 20% of the variability of the commercial Dutch herring fishery between 1600 and 1664 can possibly be linked to variations in zooplankton abundance (as reconstructed in the HPI_AMV).
While further work is certainly merited to determine the relative role of anthropogenic and other natural influences, the high statistical significance observed between the HPI_AMV and (particularly) Enkhuizen landings makes it clear that this reconstruction can aid in understanding what proportion of the economically crucial historical North Sea herring landings may have been influenced by natural ecosystem variations, and therefore how much was driven by human factors. Further work could include the extension of the landings data period for the historical Dutch herring fishery or the investigation of other historical commercially important North Sea fisheries such as the cod fishery. Beyond the 17th century, the implications of these findings are significant for understanding human exploitation of the North Sea and the bottom-up climatic-ecological influences on this history more broadly across the past 1200 years. Our HPI indices may provide a useful tool to the OceansPast community to capture and understand the impact of the ocean’s natural dynamics on its resources in past times and may contribute to the knowledge of contemporary researchers in fisheries management in achieving the United Nations’ sustainable development goal 14 - life below water targets 14.2 (sustainably manage and protect marine and coastal ecosystems) and 14.4 (regulated harvesting and ending overfishing).
Supplemental Material
sj-pdf-1-hol-10.1177_09596836241236332 – Supplemental material for A Historical Plankton Index: Zooplankton abundance in the North Sea since 800 CE
Supplemental material, sj-pdf-1-hol-10.1177_09596836241236332 for A Historical Plankton Index: Zooplankton abundance in the North Sea since 800 CE by Cordula Scherer, Francis Ludlow, Al Matthews, Patrick Hayes, Riina Klais and Poul Holm in The Holocene
Research Data
sj-xlsx-2-hol-10.1177_09596836241236332 – Research Data for A Historical Plankton Index: Zooplankton abundance in the North Sea since 800 CE
Research Data, sj-xlsx-2-hol-10.1177_09596836241236332 for A Historical Plankton Index: Zooplankton abundance in the North Sea since 800 CE by Cordula Scherer, Francis Ludlow, Al Matthews, Patrick Hayes, Riina Klais and Poul Holm in The Holocene
Footnotes
Acknowledgements
The authors would like to extend their gratitude to Gregory Beaugrand who provided the data for the Plankton Index. A special thanks to Charles Travis for initial discussions about this paper, John Nicholls who tailored the North Sea SST to the required polygon, and Ruth Kelly for her assistance in manipulating the North Sea Hadley temperature data. This paper also benefitted from discussion facilitated by the PAGES funded Volcanic Impacts on Climate and Society (VICS) working group. The authors would like to extend their most sincere thanks to Fredrik Charpentier Ljungqvist who gave useful and constructive feedback on the modelling of the plankton – AMV relationship and the paper overall. The authors are most grateful to the reviewers for their detailed and insightful comments which improved the manuscript.
Author contributions
Conceptualisation: CS, FL, PH, RK
Data curation: CS, AM, PHa
Formal analysis: CS, FL, AM, RK
Funding: PH, FL
Investigation: CS, RK
Methodology: FL, AM, RK
Supervision: PH, FL
Visualisation: AM, CS, PHa
Writing: CS, FL, AM, PH
All authors read the paper and provided intellectual input.
Funding
The author(s) disclosed receipt of the following financial support for the research, authorship, and/or publication of this article: This work was supported by the European Research Council Advanced Grant (grant number 669461 for the NorFish project) and European Research Council Synergy Award (grant number 951649 for the 4-OCEANS project) under the European Union’s Horizon 2020 research and innovation programme.
Supplemental material
Supplemental material for this article is available online.
References
Supplementary Material
Please find the following supplemental material available below.
For Open Access articles published under a Creative Commons License, all supplemental material carries the same license as the article it is associated with.
For non-Open Access articles published, all supplemental material carries a non-exclusive license, and permission requests for re-use of supplemental material or any part of supplemental material shall be sent directly to the copyright owner as specified in the copyright notice associated with the article.