
Abstract
Drought has been hypothesized to be the main agrometeorological threat facing farmers in Scania (southern Sweden) before the 20th century. However, drought is a little-studied phenomenon in Scandinavian historiography. This article attempts to establish a chronology of extreme agricultural droughts, as well as their impacts on crop harvests and grain prices across Scania during the years 1614–1914, using a combination of statistical methods. Drought years significantly reduced crop harvests in nearly all analyzed samples. However, winter crops appeared more resilient when considering the years following a drought, as these crops experienced a large and significant rebound effect. Spring and fodder crops suffered losses in drought years and did not exhibit any clear rebound in subsequent years. For some spring crops, like barley, harvest losses showed signs of persistence into the years following a drought. There were significant increases in grain prices during drought years. Farms more specialized in grain production suffered similar losses as more diversified farms but were able to recover losses to a greater extent in the year following a drought, thus appearing to have been less vulnerable to droughts than more diversified farms, especially if they were able to capitalize on the grain price hikes that occurred during most drought years. Even though droughts remain one of the most prominent threats to agriculture in the region, the vulnerability to drought in winter rye and winter wheat appears to have been reduced throughout Scania in the late 19th and early 20th centuries.
Keywords
Introduction
Scania is located in southernmost Sweden and was one of the first regions in Scandinavia to which agriculture spread around 4000 BC (Welinder, 2011). Since then, it has remained a core agricultural region in the Kingdoms of Denmark (until 1658) and Sweden (from 1658) in terms of its productive capacity (Bohman, 2010; Olsson and Svensson, 2010). Scania’s climate is mild and its growing season is the longest in present day Sweden, with spring frosts usually ending between April 1 and May 15, depending on the locality, and autumn frosts normally not appearing before the middle of November (Skoglund, 2022). Furthermore, the region is less prone to the type of late-spring and early-summer droughts common to areas in east-central and southeastern Sweden (Swedish Meteorological and Hydrological Institute (SMHI), 2017). In spite of this, summer droughtshave constituted a real risk for Scanian farmers historically as well as today. The summer drought of 2018, for example, caused large harvest losses across Scania (SCB, 2018). Other historical droughts remain prominent in popular memory, like the one in 1868 (Curran et al., 2016; Västerbro, 2018).
In recent years, there has been a resurgence in studies on the impact from climate change and variability on society, not least through the relationships between temperature, precipitation, and grain yields and prices (Esper et al., 2017; Ljungqvist et al., 2022; White et al., 2018). Previous research for Scania has shown that the most apparent linear climatic signals in harvests are a positive one with precipitation (i.e. more rain being associated with larger harvests) and a negative one with temperature (i.e. warmer temperatures being associated with lower harvests) during the summer, suggesting a sensitivity to drought (Skoglund, 2022). Furthermore, it has been suggested that droughts became a mounting threat during and after the 18th century, especially in southern Sweden (Edvinsson et al., 2009; Utterström, 1957). At the same time, most of the land improvements during that period involved draining arable or reclaimed land, most notably through ditching, which raised productivity but presumably changed the relative risk of droughts at the same time (Linné, 1751; Nyström, 2019; Pribyl and Cornes, 2020a). This raises some important and previously unaddressed to questions regarding the impact of droughts contra the benefits of increasing land productivity during this transformative period. The fact that it remains unclear in what years Scania actually experienced drought prior to the 20th century, excepting some notorious years such as 1826 and 1868, highlights the limitations of the current state of research (Nyström, 2019). Previous research on droughts has mainly been concerned with establishing national level chronologies of present-day Sweden, even though droughts were often limited to regional or sub-regional levels (Leijonhufvud and Retsö, 2021). This article constructs the first consistent chronology of droughts for Scania in the pre-20th-century period back to 1614, mainly using precipitation data and hydroclimate reconstructions, and compare these sources with temperature data and documentary sources. Furthermore, this article estimates the specific effects of drought on crop harvests in different farming systems across Scania, as well as on grain prices in the region. Finally, while previous research on climate-agriculture relationships in Sweden prior to the 20th century has mainly looked at regional or categorical aggregates, this study considers farm-level relationships (Edvinsson et al., 2009; Skoglund, 2022).
This paper is organized as follows. First, I discuss the impact and prevalence of droughts in northern Europe, based on previous research. Second, I outline and critically discuss the sources and methods to be employed in this study. Next, I define summer droughts in the context of early modern and modern agrarian Scania, establishing a chronology of the most severe summer droughts in that region between ca 1600 and 1920. Then, I analyze the data and estimate the impact of these droughts on grain production in different farming systems in Scania, as well as on grain prices, mainly relying on Superposed Epoch Analysis (SEA). In the analysis, farms are aggregated using two methods. The first method simply relies on sorting farms by geographical characteristics or by administrative units, while the second method relies on agrometeorological relationships for each farm using correlation analysis and K-means clustering. Finally, I discuss the results in relation to previous research, followed by a conclusion of the article as a whole.
Background
The frequency and impact of droughts on pre-industrial agriculture in northern Europe is an under-studied subject. As Pribyl (2020) notes, much more effort has been focused on studying the effects of cold conditions or excessive wetness (see also Ljungqvist et al., 2021). This is in many cases justifiable, considering the evidence that the main agrometeorological risks for large parts of northern Europe like Finland or northern Scotland have historically been too-cold growing seasons and autumn frosts (Holopainen et al., 2012; Huhtamaa and Helama, 2017a; Martin et al., 2023; Parry, 1978; Parry and Carter, 1985). Nonetheless, extreme drought could still pose a risk to agriculture in northern Europe. Solantie (2012) argued that recurring droughts in the 1850s caused peaks in mortality in the province of Uusimaa, southern Finland. Huhtamaa (2018) has also noted how drought caused regular harvest losses in southern Finland before the 20th century, at least on a local level.
Pribyl and Cornes (2020a, 2020b), Pribyl (2020), and Stone (2014) have surveyed historical droughts in medieval and early modern England and found that the most extreme droughts threatened to turn into widespread harvest failures, but less extreme droughts still posed a threat to spring crops, like barley and oats. Wheat was sensitive to excessive wetness but more resilient in the face of droughts, allowing English farmers to hedge against both wet and dry years by growing both more drought-resilient wheat as well as spring barley and oats that were more resilient to wetter conditions. Notably, farmers in Scania mainly grew (spring) barley, winter rye, and to a lesser extent oats, and did not begun to cultivate wheat too any significant degree before the late 19th or early 20th century. Potatoes increased in historical importance as a complement to grains throughout the 19th century, especially in that century’s latter half (Bohman, 2010).
Droughts and their impact on harvests
Although the impact of droughts on agriculture in southern Sweden has often been hypothesized to be historically significant, current knowledge about the actual prevalence of droughts is sparse. Recently, Leijonhufvud and Retsö (2021) constructed a (national) drought index for Sweden based on documentary evidence. However, the coverage of the index is inconsistent and intermittent at a regional level. For example, only 5 years of droughts are specified for Scania in the period 1400–1800 CE. Given that precipitation is the primary determinant of summer droughts in Sweden, and that precipitation exhibits low levels of spatial correlation, national-level drought chronologies should only be applied very carefully to regional or local levels (Büntgen et al., 2011; Ljungqvist et al., 2016, 2019). Edvinsson et al. (2009) documented the dominant meteorological patterns of summers during harvest failure years in southern Sweden during the early modern period, listing drought on 13 occasions since 1658 (seven occasions since 1700). Utterström (1957) observed large drought-related harvest losses on 29 occasions during the years 1721–1870, based on a variety of documentary evidence. Both lists offer only a partial picture of the prevalence of droughts, since documentary material only described attribute conditions like drought or excessive cold occasionally. In this article, a regional drought chronology is established using mainly regionally-based instrumental precipitation measurements, complemented with documentary evidence.
Cereals and other crops need a certain amount of moisture in the soil in order complete their life cycle. A lack of soil moisture hampers crop growth, increase susceptibility to crop disease and in extreme cases leads to the withering or destruction of the crop (Johansson, 1972; Kottmann et al., 2016). From a farmer’s perspective, even cases of hampered growth were often enough to cause serious economic or subsistence concerns (Pribyl and Cornes, 2020b).
Except in the spring and early summer season, most areas of present-day Sweden, including Scania, experience relatively moist conditions. Excessive wetness, like most meteorological extremes, can be ruinous for crop growth. Farmers in the region have strived to cultivate cereals on well-drained soils while relying on the regular natural irrigation that occurs throughout the growing season, and thus achieve a balance between dryness and wetness in a rain-fed agricultural system (Fogelfors, 2015). Given inherent climatic variability, some years will be too dry and some too wet (de Toro et al., 2015). Contemporaries often described these years as våtår (wet-years) and torrår or torkår (drought-years) (Hielmberg, 1743b, 1743c). Some cereals were supposedly better adapted to wetter conditions, like oats and barley, whereas winter rye was often seen as more resistant to drought, at least during the late spring and early summer (Leino, 2017, see also Pribyl and Cornes, 2020b). At the local level, excessive wetness or dryness could have widely different outcomes for different plots, meadows and types of vegetation (Hielmberg, 1743a, 1743b, 1743c; Almgren, 1717).
In terms of overall grain production, the dominant view is that the main agrometeorological constraint in the southern third of Sweden was a lack of precipitation, at least after the cold 17th century (Edvinsson et al., 2009; Skoglund, 2022; Utterström, 1957). After the excessive cold and large-scale harvest failures of the 1690s, Utterström (1957) hypothesized, drought became the main threat to agriculture in southern Sweden (Dribe et al., 2017a; Myrdal, 2011 make similar arguments). Edvinsson et al. (2009) analyzed the linear climatic impacts on harvests of specific grains in Sweden in aggregate during the period (1803–1955), and found that oats were overall more sensitive to precipitation patterns in the summer than barley. Holopainen et al. (2012) analyzed the effect of temperature on grain yields and prices in 19th century Sweden, finding that wheat was particularly sensitive to growing season temperature, whereas for all crops taken together the climatic signal was weaker. A limiting factor with both these examples is that they considered Sweden as a whole, where the positive (i.e. warmer growing season temperatures = larger harvests) relationship between summer temperatures and harvests in northern (roughly the northern two-thirds) Sweden is mixed in together with the inverse negative relationship (i.e. warmer summer temperatures = lower harvests) in southern Sweden. Considering these disparate types of agro-climatic regions in aggregate instead of separately will naturally blur potential climatic signals. Nonetheless, Holopainen et al. (2012) did find a statistically significant positive relationship between grain prices and mean July temperatures (i.e. warmer July temperatures = higher grain prices), possibly indicating a drought signal. Skoglund (2022) estimated linear relationships between grain production and climate variability in Scania during the period 1702–1911 and found negative correlation between harvests and summer temperatures (warmer summers = smaller harvests) and a positive correlation with summer precipitation (wetter summers = larger harvest), and thus argued that drought was the most apparent risk facing farmers during the period. There was a slight variation between different types of grains but only in terms of the temporal distribution of the climatic sensitivity across the growing season. For example, oats were more sensitive to early summer precipitation and barley to precipitation later in the summer. A general limitation of these studies is that they relied on linear estimations of relationships between time-series and did not isolate the specific impact of droughts. Thus, it remains unclear to what extent drought constituted a historically significant agrometeorological risk for farmers in southern Sweden before the 20th century (Edvinsson et al., 2009; Holopainen et al., 2012; Skoglund, 2022). Given that agriculture-climate relationships are not strictly linear, it can be expected that extreme meteorological events have outsized effects on harvests (Brás et al., 2021; Dell et al., 2014).
Very little research has been conducted on the quantitative impact of droughts (or climate impacts overall) on hay or fodder production, and partly because the available sources are much scarcer for that sector of the agrarian economy, partly because of historiographical and administrative-political biases (Mayshar et al., 2022; Scott, 2017; Turner et al., 2001; Westin, 2006). In the mixed farming systems of Scania, the cultivation of crops was mutually dependent on the rearing of livestock (Bohman, 2010). Thus, it seems highly relevant to estimate the impact of drought on fodder production as well. Utterström (1955) and Michaelowa (2001) both stipulated that colder conditions were more detrimental for livestock than for crops in northern and northwestern Europe. Pribyl and Cornes (2020a, 2020b) and Pribyl (2020) have shown that hay production in England was severely impacted by droughts. While the available data is more limited in extent, this study will consider the impact of drought on fodder production in the last five decades of the study period, ca 1860–1910.
This study builds on previous research by statistically assessing the agrometeorological risk of drought for crop and fodder harvests, as well as on regional grain prices. Climate-agricultural relationships are estimated at the farm-level, in contrast with previous research that has mainly focused on regional harvest estimates (Edvinsson et al., 2009; Skoglund, 2022). Farm-level data is then aggregated using both clustering and historical categorizations, and administrative units in the later study period (ca 1810–1910). Following aggregation, the specific impact of drought is estimated by Superposed Epoch Analysis (see Rao et al., 2019). Furthermore, a more comprehensive set of harvest and harvest-related data is employed compared with previous research, which allows a comparison between different types of indicators as well more robust comparisons over time.
Sources and methods
Climate data
The following types of climate data are employed in this article: instrumental precipitation and temperature data, and hydroclimatic reconstructions. Some of the earliest instrumental meteorological data from Sweden are from the city of Lund, located in the fertile Lunda plains in southwestern Scania. Lund instrumental precipitation data (henceforth LIPD) are available from late 1747, with a gap between 1751 and 1752 and for the summer of 1806 (SMHI, 2023). Early instrumental precipitation measurements are usually considered more unreliable compared with temperature or air pressure, despite rarely having been subject to testing in published studies. Precipitation exhibits much lower decorrelation decay length compared with temperature (Ljungqvist et al., 2016). This makes it difficult to test the homogeneity of precipitation data using cross-sectional station data, which is fundamental to most standard homogenization tests (Ribeiro et al., 2016). Moberg et al. (2003) discussed the problem of undercatch in early instrumental precipitation data in other Swedish cities, notably Stockholm and Uppsala, finding the problem to be smaller during the summer months. There is also the possibility that the series contains other types of inhomogeneities related to, for example, changes in instruments or observer(s) (Bärring et al., 1999).
Skoglund (2022) employed the LIPD from the period 1748 to 1865 as well as from a later period 1865 to 1911. No clear divergences in the relationship between instrumental precipitation data and grain harvests over time or in cross-comparison with other climate data like a homogenized temperature series from Lund were found, which indicates the LIPD’s reliability in covering year-to-year variations relevant for agricultural production. Considering the extended summer months of MJJA in the LIPD, minimum precipitation values appear stationary over time (Figure 1). Minimum precipitation values for May appear to experience a structural shift after the 1850s, with no years experiencing <10 mm of precipitation (and only 1 year with <15 mm), whereas in the two previous 50-year periods <10 mm precipitation events occurred three (1750–1799) and eight (1800–1849) times, respectively. In the 50-year period 1900–1949, such events occurred four times. It does not appear likely that this shift was due to a change in measurement praxis, given that no comparable shifts are evident for the following months (June, July, or August). It appears that this represents an actual climatic shift. This was adjusted for in the drought chronology below (see Section 4.1). Considering that the main purpose of this article is to estimate droughts by using minimum or lower-end precipitation values, other adjustments to the precipitation data were not deemed necessary (Ribeiro et al., 2016).
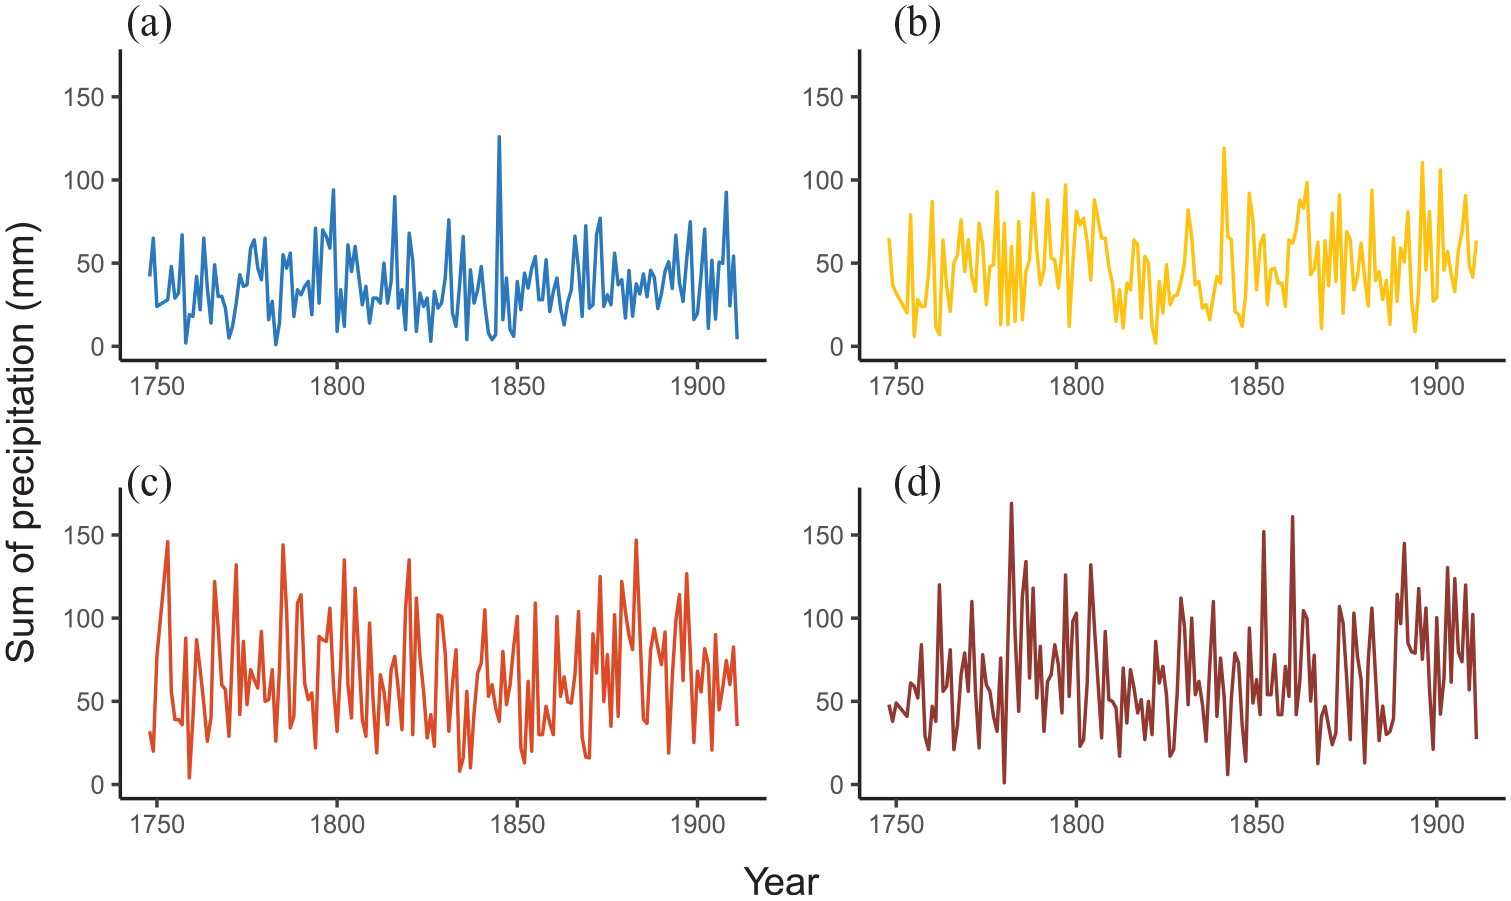
Monthly precipitation sums (mm) in Lund during the month of May, June, July and August between 1748 and 1911. (a) May. (b) June. (c) July. (d) August.
Temperature measurements in Lund also began in 1747, with longer gaps between 1751 and 1752 and 1821 and 1833. Measurement data in the form of pentad averages between 1753 and 1870 were published by Tidblom (1876), and subsequently homogenized by Skoglund (2022). The latter also contains a reconstruction of monthly mean temperatures in Lund going back to 1701, based on a network of stations across northern and northwestern Europe. Further information on the homogenized Lund temperature series can be found in the appendix of Skoglund (2022). For the period after 1870, monthly means of instrumental temperatures from Lund are used.
This article also employs two tree-ring based hydroclimatic reconstructions, a summer Standard Precipitation and Evapotranspiration Index (SPEI) for the early summer months (May through July) covering the last millenium from Seftigen et al. (2017), and a MJJ precipitation reconstruction from Seftigen et al. (2020) extending back to 1798 CE. Skoglund (2022) utilized these reconstructions and found that they both showed consistent and statistically significant positive associations with grain production in Scania. They are also used to cluster farms based on their climate-grain production relationships (see Section 4.1). This latter task adds on previous research by estimating farm-level harvest-climate relationships (Skoglund, 2022).
Since most research on historical droughts in Sweden to date has relied on documentary evidence, and because this type of material can help to fill gaps arising from utilizing a definition of droughts using only meteorological indicators in a heterogeneous climatic context (see Section 4.3), this article will also employ documentary evidence. This will partly be based on primary material from Tabellverket, an early historical predecessor of the government agency Statistics Sweden (Sw. Statistiska centralbyrån) (Castenbrandt, 2012). Tabellverket compiled statistics on mortality and population by sending out forms to parishes across Sweden, starting in 1749 and ending in 1859. In these “mortality-forms” (Sw. mortalitetstabeller, henceforth “Tabellverket forms” or just “forms”), respondents were asked to fill in information regarding extraordinary natural or social events in their respective administrative region during the year (Tabellverket, 1749). Albeit in an unsystematic manner, respondents occasionally describe extreme weather events like floods or droughts in these forms (Jacobsson, 2020).
Agricultural data
Historical database of Scanian agriculture (HDSA)
The HDSA consists of micro-level (i.e. farm-level) agricultural data from Scania, mainly based on tithes during the period 1702–1881 (Olsson and Svensson, 2017). Grain production data is available until 1865. The HDSA has been utilized in a number of studies on Scanian agriculture (Bergenfeldt et al., 2013; Bohman, 2010, 2017a, 2017b; Dribe et al., 2017b; Nyström, 2019; Olsson and Svensson, 2010; Skoglund, 2022). Tithes values in the database were converted to threshed hectoliters using the threshing correction coefficients in Olsson and Svensson (2017). Grain-specific series were converted to rye/barley-equivalents following coefficients used by Nyström (2019), and then summed to obtain total grain production series. Aggregated series are based on mean annual values of farm grain series at the given level (see Section 4.1). These data, from the farm level as well as the aggregated samples, were detrended and normalized using normalized yield anomalies or, here, normalized production anomalies (NPA), following Beillouin et al. (2020) and Skoglund (2022). The output NPA variable has the benefit of being readily interpretable, showing the proportion of deviation from the trend, where a NPA value of −0.2 can be interpreted as a 20% reduction in harvest compared to the norm.
The HDSA also contains qualitative data for each farm, denoting for example whether the farm was enclosed, or what type of farming district it belonged to. Farming district type is a historical categorization of farming areas based on land cover typologies with a long historiographical tradition that was also made by contemporaries to some extent (Campbell, 1928). Similar categorizations of types of farming district can be found for other areas of Europe, such as England (Overtun, 1996). Three types of farming districts have been discussed in relation to Scania (as well as most of Sweden), namely: plain districts (dominated by arable plains), intermediate districts (semi-open lands covered by brushwood vegetation), and forest districts (dominated by forested land cover) (Bohman, 2010). The type of farming district has been seen as important in determining the composition of production and subsistence strategies at the farm level, as well as risk-levels in grain production (Dahl, 1942; Dribe et al., 2017b; Nyström, 2019).
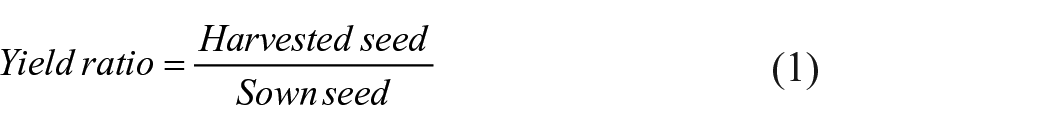
Yield ratios and fodder production
After 1865, there are official statistics (BiSOS) covering crop (by volume) and fodder production (by weight), from which yield ratios can be deduced for the counties of Malmöhus and Kristianstad (the two counties of Scania that existed during the study period) (SCB, 2009). Yield ratios (Sw. korntal) was the most common measure of harvest yields in Early Modern Europe and are based on the ratio between the amount of seed sown and the harvested seed, see equation (1) below (van Bath, 1963).
The BiSOS data have previously been used to estimate the relationship between climate variability and grain production in the region, showing consistent results with other types of data (Skoglund, 2022). It has been pointed out that the BiSOS statistics underestimate total output and increase in reliability over time (Hallberg et al., 2022). Even though the former issue might affect year-to-year variations, that potential risk appears negligible in previous research (Holopainen et al., 2012). The latter issue is partly remedied by using average yield ratios across the entire county, where individual distortions can be expected to cancel themselves out. Furthermore, as already noted, the climate signal in the BiSOS statistics is consistent with other types of data (Skoglund, 2022). There are some particular issues concerning data from Malmöhus and Kristianstad. For Malmöhus, no data was collected in 1867, and the reported data was instead interpolated from previous years and from Kristianstad. The harvests in both counties were generally deemed average that year, although harvests of winter grains and legumes were quite below average. Data on fodder production is missing or incomplete for several parishes in Kristianstad in 1866–1867, and instead an average of 1865–1867 was used as the first data-points in the fodder production series for the county (SCB, 2009).
Edvinsson (2013) collected harvest reports containing yield ratios for different crops compiled by county governors across Sweden that cover the period after 1818 for Scania. The yield ratios collected by Edvinsson have been shown to be consistent with yield ratios from BiSOS in terms of the climate signals and are employed here to cover the period before 1865 (Skoglund, 2023, in press). The so-called priest statistics (Sw. präststatistiken) contain yield ratios from parishes across Sweden between the years 1802 and 1820. Previous research has criticized the priest-statistics for being generally unreliable, heavily underestimating output, and being very rough in year-to-year variations (Hallberg et al., 2022). Priest statistics were collected and aggregated at the county level; however, they showed poor correspondence with other available harvest data (tithes, yield ratios, and subjective harvest assessments) and were thus not employed here.
Combining yield ratios from Edvinsson (2013) with BiSOS data makes it possible to estimate the impact of droughts on yield ratios in the two counties of Scania between 1818 and 1911 and on fodder production between 1865 and 1911. In order to include the drought years of 1818 and 1819 (see below) in the analysis, the years 1815–1817 were filled using the mean of the closest 10 values. When there were few missing values (<5) in a crop yield ratio series, these were filled using linear interpolation from the most closely related crop (e.g. barley substituted by oats, winter wheat by winter rye). Almost all series of yield ratios exhibit clear positive trends over time, and thus required detrending. For consistency, yield ratios were detrended using the same approach as with the tithe harvest data.
Grain prices, 1616–1914
This study employs series of barley, rye and oat prices constructed by Mats Olsson (unpublished), based on a combination of sources and publications, including Bengtsson and Dribe (1997), SMHI, (2017), Jörberg (1972), and Tomner (1964). Data from these various sources were converted to standardized prices per hectoliter and then combined into continuous series for barley, rye, and oat prices, respectively. The constructed series exhibit a clear positive trend over time, but also increasing variation over time, making simple linear detrending inappropriate. Series were therefore detrended using the same method as with the harvest data, which includes both detrending and normalization of data.
All the employed source in the present study are listed in Table 1 below.
Summary of sources employed in the study.
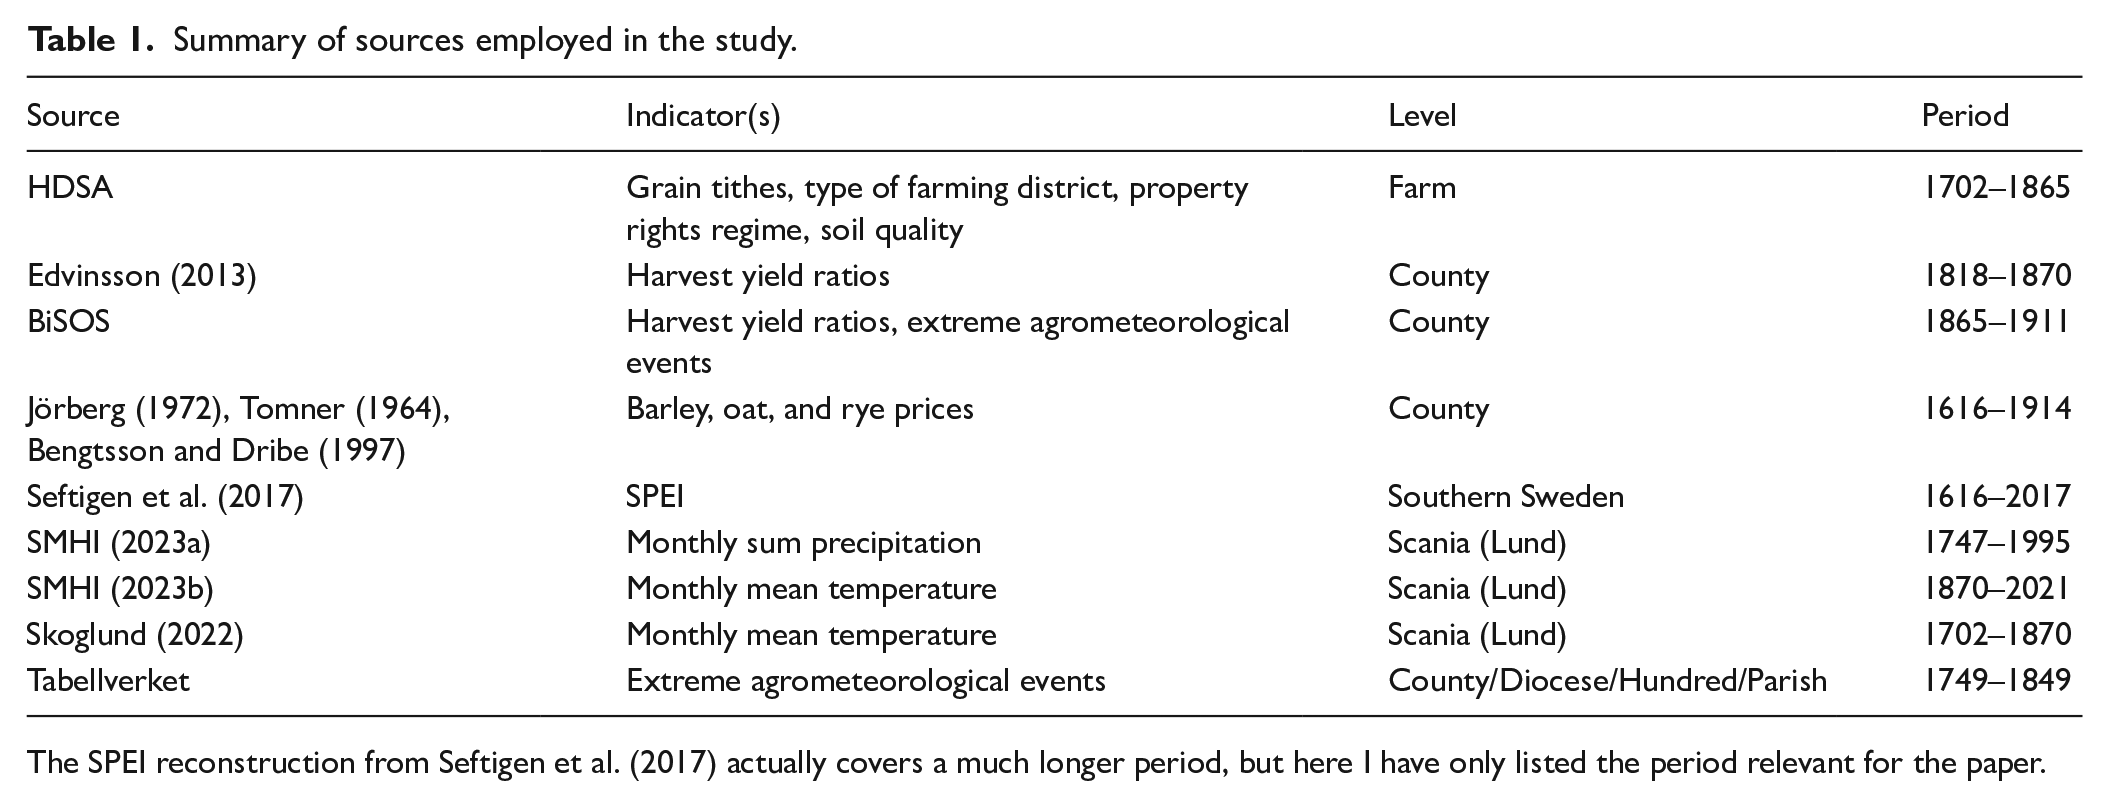
The SPEI reconstruction from Seftigen et al. (2017) actually covers a much longer period, but here I have only listed the period relevant for the paper.
Clustering of farms
One of the most striking facets of the HDSA is that it contains micro-level data; that is, observations based on specific farms or households (Olsson and Svensson, 2017). Micro-level data vastly increases the amount of available information, particularly when compared with regional aggregates, while also increasing the complexity in management, analysis and interpretation of the data. Most research to date has thus relied on a priori categories to analyze the data, for example by aggregating the data according to property rights regimes or natural-geographic categories (Bohman, 2010; Nyström, 2019). Current literature has little to say on whether these types of categorizations are useful when studying the relationship between climate and agricultural production. There is some evidence of farms in the plains districts or enclosed farms being slightly more risk-taking, but it remains unclear how this played out in relation to the specific risk of drought (Nyström, 2019).
Farm-level relationships can also be analyzed using panel-based regressions which accounts for individual-effects (Olsson and Svensson, 2010). However, panel-based regressions work less well on unbalanced data and in cases where there is a large omitted-variable bias leading to the model being underspecified (Hsiang, 2016). Skoglund (2022) used clustering to sort the data in the HDSA based on grain harvest output over time. Here clustering is instead made directly based on climate-harvest relationships at the farm level. The benefit of clustering is that it is based on actually observed differences in the given parameters, while some of the main drawbacks are the difficulty in objectively determining the number of clusters as well as how to describe and interpret clusters in a manner that is historically relevant. The latter issue is partly resolved here by also incorporating historical categorizations, enabling a comparison with the cluster-based analysis, as well as by describing each cluster in terms of its institutional and geographical make-up.
Prior to clustering, NPA of total grain production in rye equivalents are estimated for all farms with more than 60 years of observations (Beillouin et al., 2020). Converting different grains to rye/barley-equivalents accounts for the differences in their long-term valuation (Olsson and Svensson, 2010). Each production series was then correlated with detrended monthly climate indicators of temperature and precipitation as well as two summer hydroclimate reconstructions (MJJpr, SPEI), to obtain a correlation matrix based on ca 11,000 correlations. Three farms with insufficient observations after 1797 were removed. Subsequently, clustering was performed using K-means clustering, based on the similarities in the matrix. Three clusters were determined to be optimal using the NbClust package in R, which uses 30 different indices to find the optimal number of clusters (Charrad et al., 2014).
Superposed epoch analysis
Superposed epoch analysis (SEA) is a useful method based on compositing in order to illustrate the isolated impacts of a pre-determined set of events on some variable on interest. It had been widely used in dendroclimatology to estimate the impact of volcanic eruptions or forest fires on series of tree-rings (Esper et al., 2015; Pinto et al., 2020; Seftigen et al., 2017). Other fruitful avenues of application have been to estimate the impact of extreme weather events on agricultural yields and of plague outbreaks on building activity (Brás et al., 2021; Ljungqvist et al., 2018). Here, 7-year windows of harvests or grain prices were calculated, centered on the year of a drought. When there are consecutive drought years, these years were substituted by their mean with the event year set as the last drought year and the prior years removed (results from the inclusion of all event years are shown in Supplemental Material A, Figure S6, available online). After setting these parameter conditions, the mean deviations in harvests or prices during drought years in all composite sets were obtained. Statistical significance was calculated using a modified double bootstrap procedure proposed by Rao et al. (2019), performing 10,000 iterations for each procedure and using a significance level of p < 0.05 (Rao et al., 2019). This procedure was repeated for the harvest output or yields for different crops in each sample, as well as for each time series of grain prices. Drought years are defined in the following section.
Characterizing the drought history of Scania, 1600–1910
Periods of extreme wetness or drought are usually defined as deviations from average conditions surpassing a given threshold limit. It is either implied or estimated that these extreme events go beyond what the current infrastructure, in this case the arable soils and the cultivated vegetation, can handle and thus can possibly be harmful to society.
In agrometeorological research in Sweden and the larger Baltic area, (agricultural) drought definitions usually are based on precipitation or the number of rainless days (dry spells) based on certain voluminous or temporal thresholds (see Table 2). The temporal thresholds are almost always less than 60 days and often set at around 30 days. The volume threshold is often set in terms of mm per m2, where 1 mm of precipitation corresponds to 1 l in volume, at less than 40 or 20 mm of precipitation during 30 days or more. Such events have caused large crop losses in the Post-War period in Scania, such as in 1975, 1992, 2006, 2008, and most notably 2018 (de Toro et al., 2015).
Agrometeorological definitions of dry periods for the southern Baltic region.
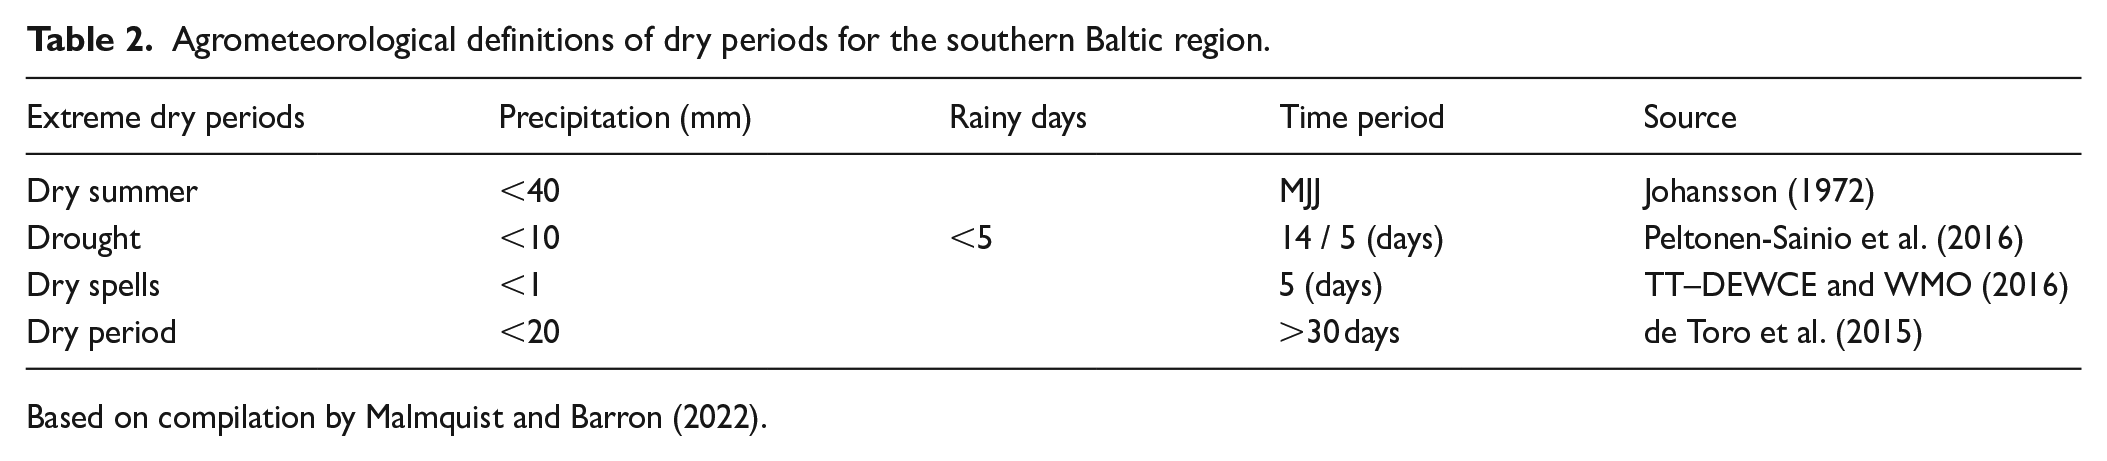
Based on compilation by Malmquist and Barron (2022).
Instrumental evidence of drought
Previous research has shown that June and July where the most crucial months for Scanian agriculture regarding sensitivity to temperature and precipitation, followed by May and to a limited extent August (Skoglund, 2022). August, particularly the latter half, as well as September, constituted the main harvest season when excess precipitation rather than drought would have been the main agrometeorological risk. Considering the combined factors in this agrarian and climatological context, two definitions are used to estimate summer droughts. Firstly, I estimate summer precipitation droughts, droughtP, as years with ⩽40% of long-term average precipitation during May and June or June and July (see Figure 2).
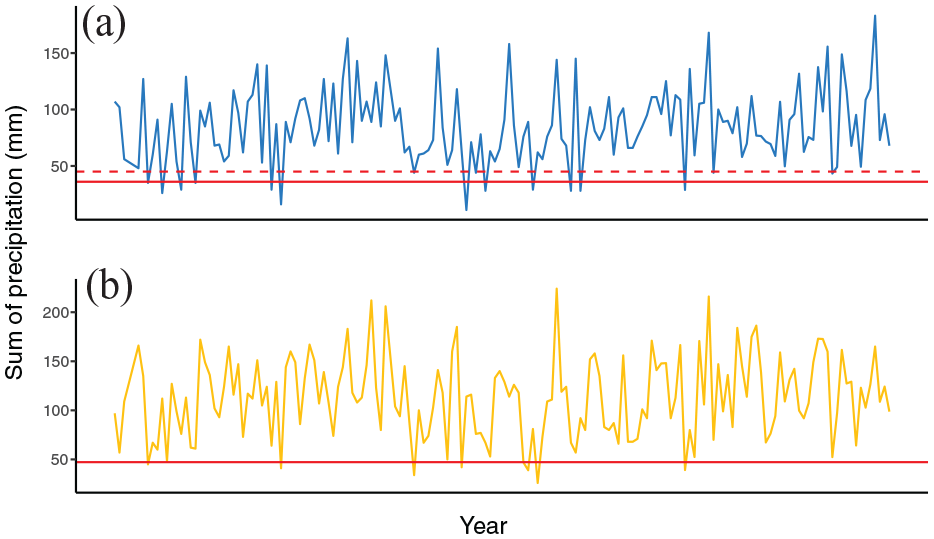
May–June and June–July precipitation sums (mm) in Lund between 1748 and 1911 with the droughtP threshold marked with a solid red line. The dashed red line represents the more tolerant May–June droughtP threshold used for the period after 1870. (a) MJ. (b) JJ.
Given that there is an apparent structural shift in minimum May precipitation values after 1860, a more tolerant definition of ⩽50% of long-term average precipitation during May and June was applied for that period. Figure 2 shows the years of droughtP using these thresholds between 1748 and 1911 and monthly precipitation sums as well as descriptive statistics of the precipitation time-series are listed in Table 3.
Monthly precipitation (sums, in mm) during drought (droughtP) years in Scania, 1748–1911.
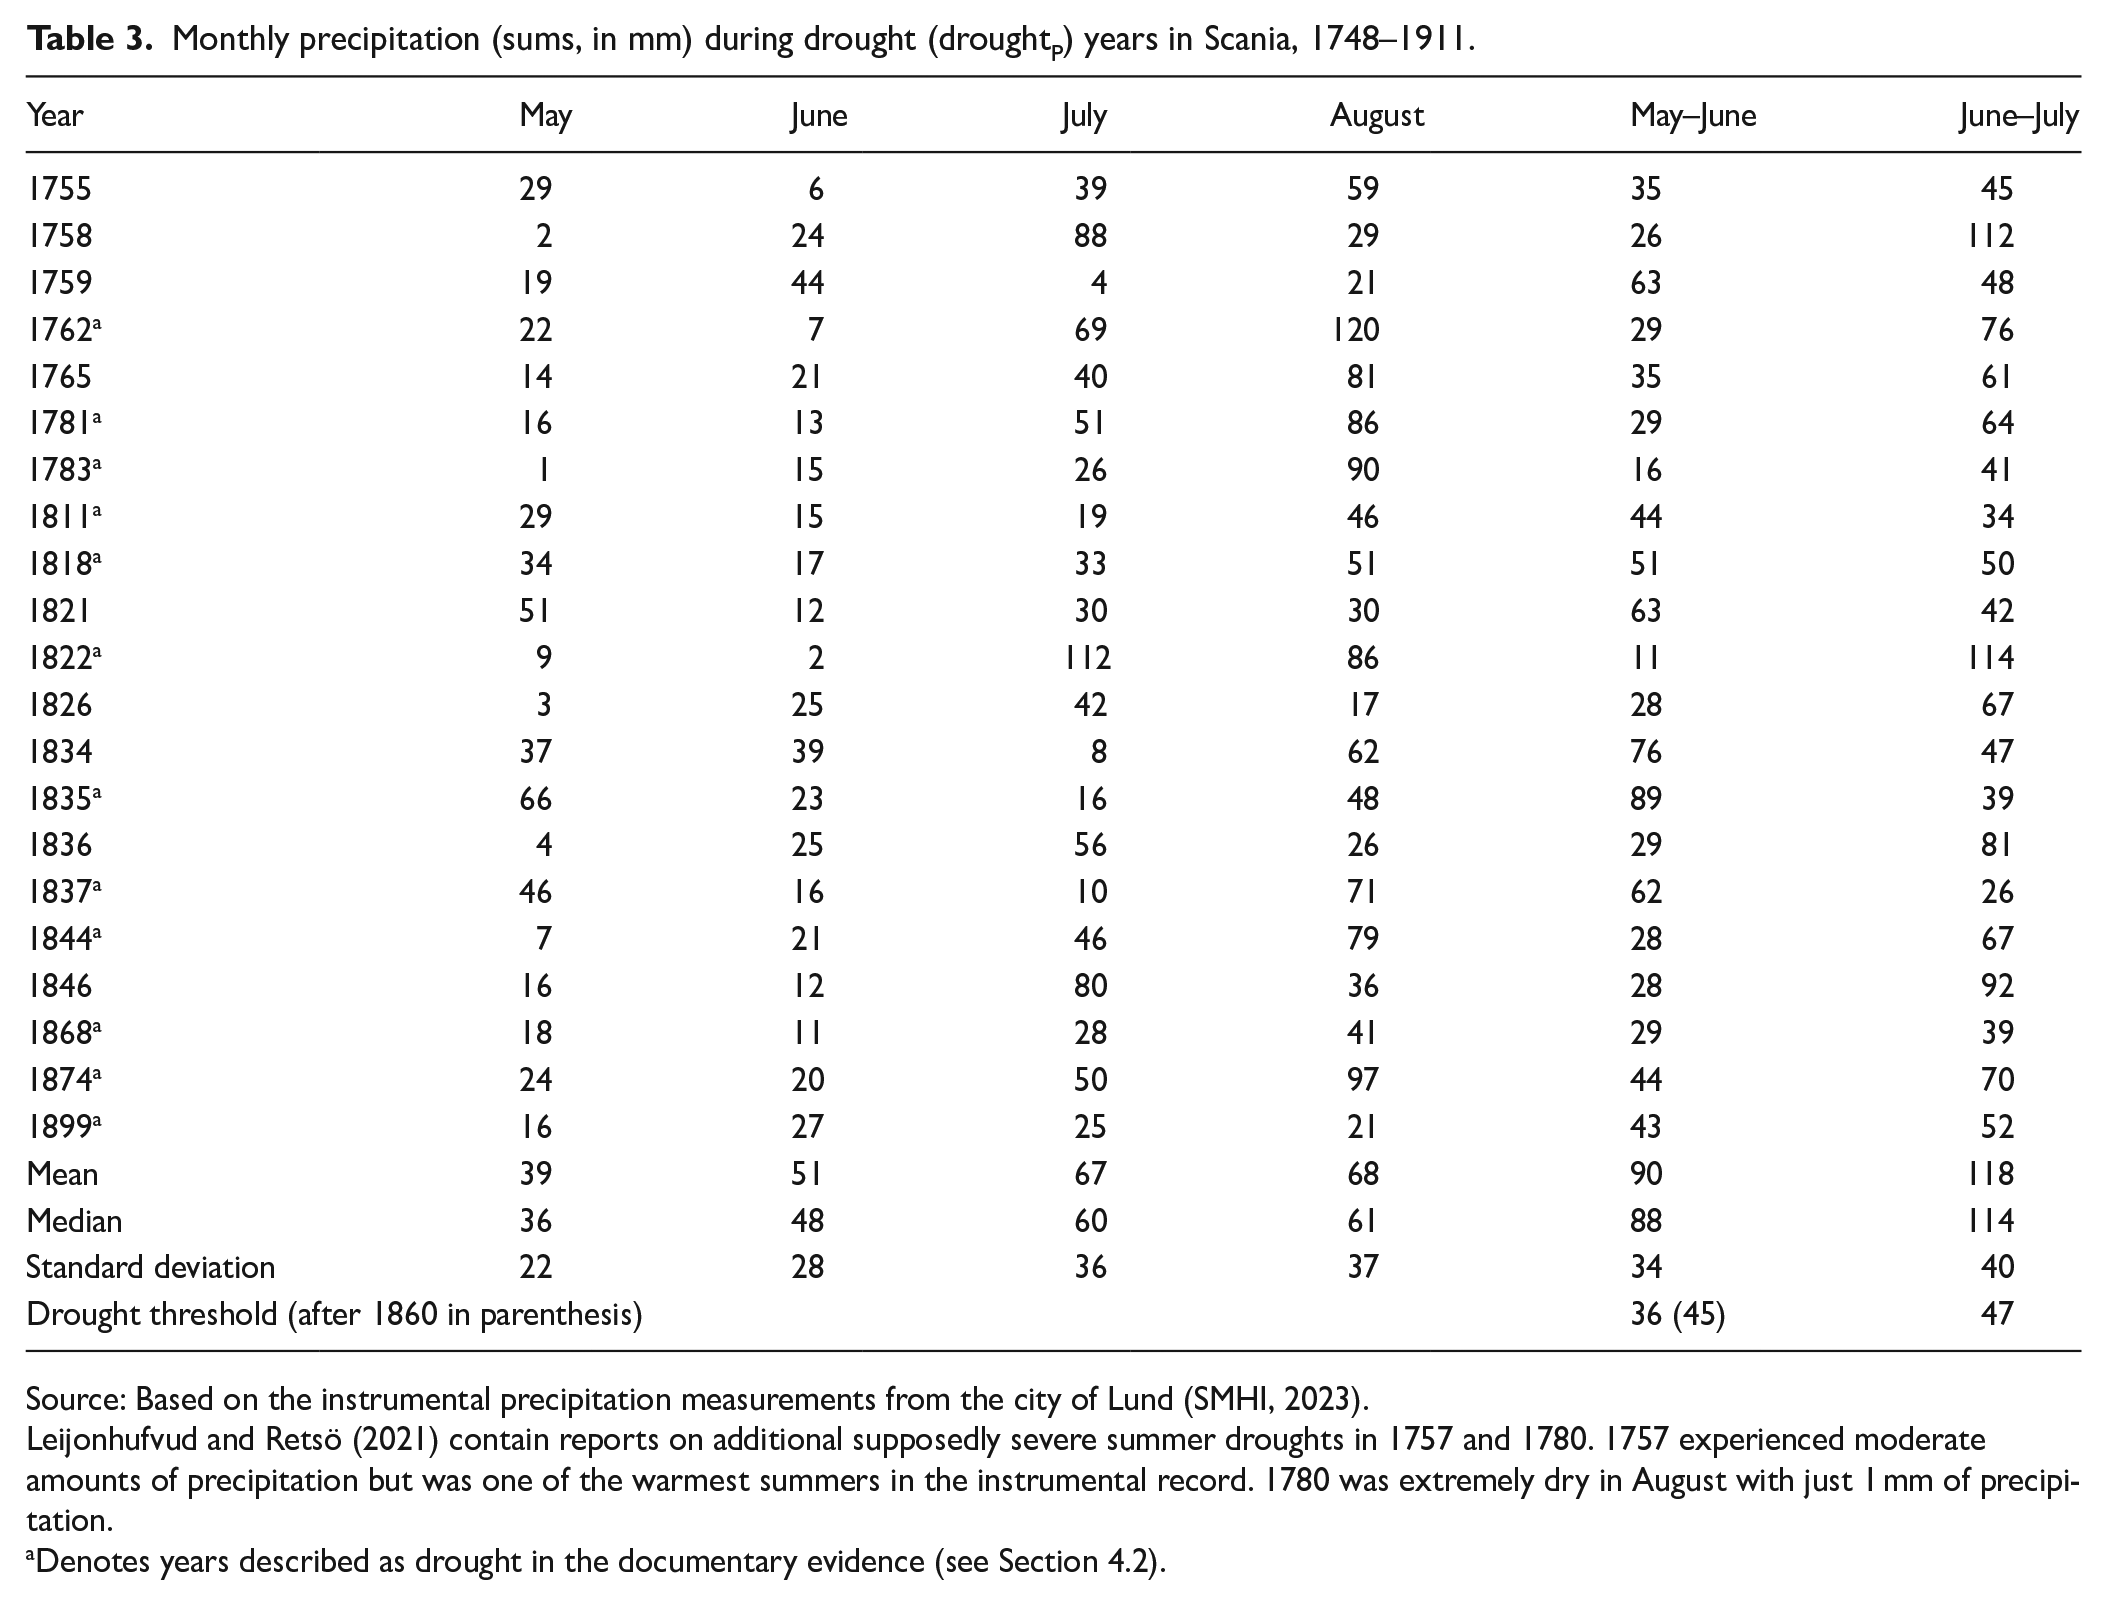
Source: Based on the instrumental precipitation measurements from the city of Lund (SMHI, 2023).
Leijonhufvud and Retsö (2021) contain reports on additional supposedly severe summer droughts in 1757 and 1780. 1757 experienced moderate amounts of precipitation but was one of the warmest summers in the instrumental record. 1780 was extremely dry in August with just 1 mm of precipitation.
Denotes years described as drought in the documentary evidence (see Section 4.2).
Secondly, I estimate an adjusted drought chronology where documentary evidence from the yearly forms sent out by Tabellverket (1749–1859) is incorporated and leads to a droughtPadj chronology (see next section). In order to cover the 17th century, I use values below the 10th percentile of SPEI (during 1610–1920) as a proxy for droughtPadj years, adding the years 1667, 1669, 1670, 1677, 1679, 1690, 1693, and 1726 to the droughtPadj chronology. Due to the Scanian War (1675–1679), the years 1677 and 1679 were removed from the chronology.
Documentary evidence of drought
In the yearly forms sent out until 1859 by Tabellverket there are occasional notations on the weather during the year, especially as it concerns its effects on harvests. The reporting is not systematic, given that weather notations occur under the miscellaneous category of “Extraordinary natural or supra-natural events,” and there is obviously is room for contingency and ambiguity in terms of what can be considered extraordinary. Between 1802 and 1824, this category temporarily disappears from the forms, but some respondents continued to note such events in the summary tables listing harvests and overall mortality statistics.
Only some of the droughtP years appear in these forms, even when considering a broader area of southern Sweden, including Halland, Gothenburg diocese, to the west and Blekinge, Kalmar, and the islands of Öland and Gotland to the east. DroughtP years with no evidence of drought in Tabellverket are: 1755, 1758, 1759, 1765, 1835, 1837, and 1844 (1758, 1759, and 1837 are all mentioned as drought years by Utterström, 1957). Tabellverket is used to add and not exclude years from the adjusted drought chronology (henceforth droughtPadj). The last 3 years, 1868, 1874, and 1899 in the droughtP chronology are outside the Tabellverket period (1749–1859). In the years 1868 and 1874, drought in Scania is reported in the BiSOS statistics; however, for 1899 drought is only reported other counties in southern Sweden; for example, in the neighboring county of Halland. Table 4 lists all the reports of drought from Tabellverket.
Qualitative evidence of drought in Tabellverket (1749–1859).
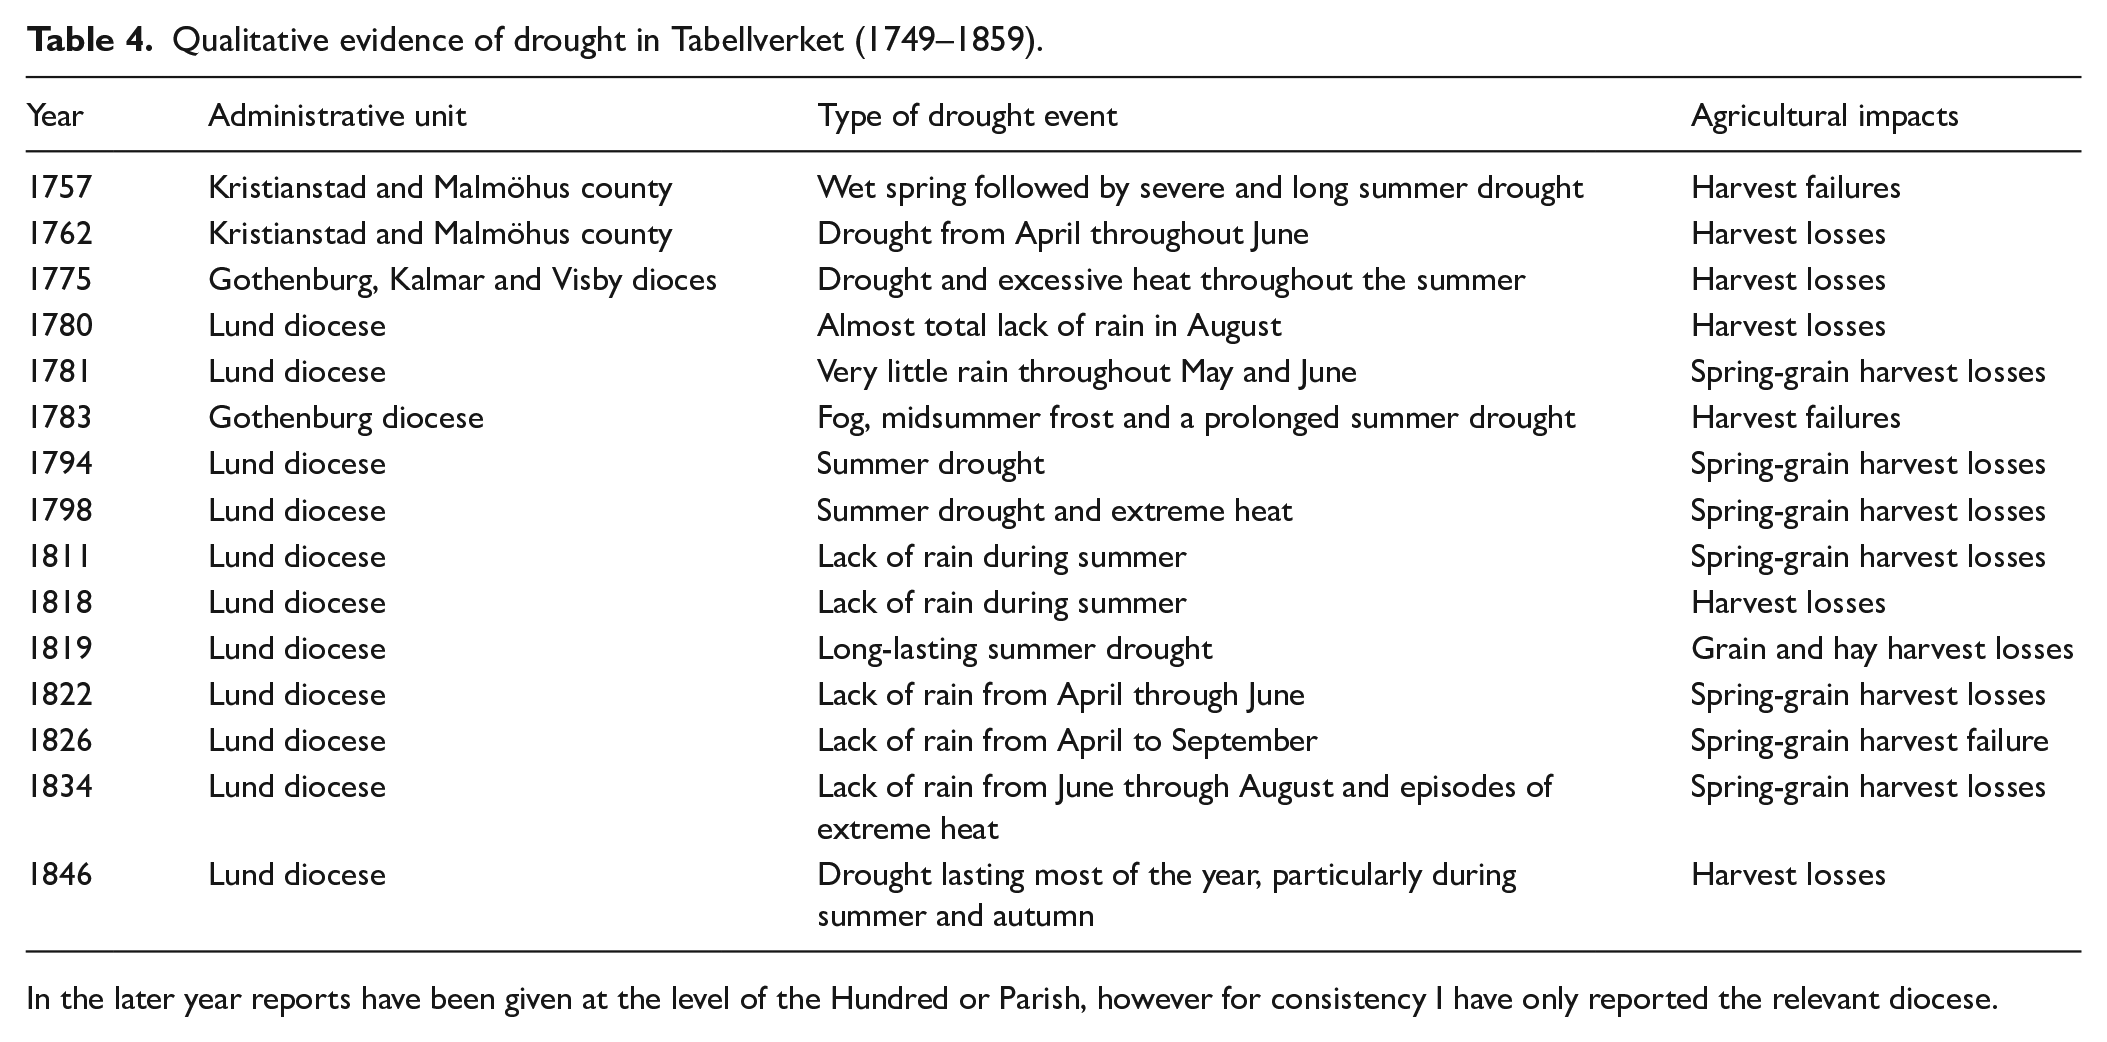
In the later year reports have been given at the level of the Hundred or Parish, however for consistency I have only reported the relevant diocese.
There is no report of a drought from the diocese of Lund in 1783, even though it was an extremely unusual year by all accounts (Edwards et al., 2022). 1783 had one of the warmest and driest summers in the instrumental record in Lund, and it exhibits one of the lowest SPEI-values during the study period. It thus appears to have been one of the worst summer droughts in Scania for more than 250 years, surpassed only by the recent drought of 2018. Tithe records attest to large-scale crop losses compared to previous and subsequent years (Nyström, 2019; Olsson and Svensson, 2010).
There are also no reports of a summer drought in 1821 in the forms, even though the instrumental measurements indicate perilously low amounts of rain. However, temperatures were very low so the drought might have been mitigated by a lower degree of temperature-induced evapotranspiration.
Interestingly, these comparatively unsystematic reports of summer droughts mostly associate them with losses and damages to the spring crops, particularly barley, whereas rye is often reported as faring better during years of drought. Given that all the extra drought years identified in the Tabellverket forms could be linked to at least one summer month of extremely low precipitation, and that they were mainly reported as droughts, they are added to the droughtPadj chronology as events similar to those in the original droughtP chronology.
Regarding the period before the middle of the 18th century, there is only limited documentary evidence. There appears to have been a multi-year drought in the late 1720s (beginning in 1725 and not ending until 1728 in some areas). In documentary sources, this drought peaked in 1727 in Scania (SPEI-values peak in 1726, see Seftigen et al., 2017; Utterström, 1957). In order to account for this drought in the analysis, the year 1727 was added to the droughtpadj chronology.
Estimating the impact of summer droughts
Clustering harvest-climate relationships
Most indices considered by the NbClust function determined that three clusters were optimal, followed by two clusters (Charrad et al., 2014). Thus, three clusters were chosen for the following analysis. The resulting three clusters are roughly equal in size, representing 143, 144, and 150 farms, respectively. They also cover similar periods, 1711–1865 (cluster 2 and 3) and 1711–1857 (cluster 1). All or most clusters are represented in all parishes, except in Brandstad parish which is only represented in Cluster 2. Cluster 2 is dominated by intermediate districts farms, while Cluster 3 is more evenly distributed across the various types of farming districts. Finally, Cluster 1 is dominated by farms in the forest districts; see Table 5 below. Clusters 1 and 3 have the largest share of peasant-owned farms (Sw. skattebönder) and crown-owned farms (Sw. kronobönder), whereas Cluster 2 has the largest share of manorial farms (Sw. frälsebönder). As can be seen in Figure 3, soil quality differs between the clusters, with Cluster 1 having the largest share of low quality soils (sixth to eighth grade) and the smallest share of the high quality soils (first to third grade). Cluster 3 has the largest share of high quality soils and the smallest share of low quality soils, while Cluster 2 lies somewhere between Clusters 1 and 3 in terms of soil quality.
Distribution of farms in each cluster according to historical categorizations.
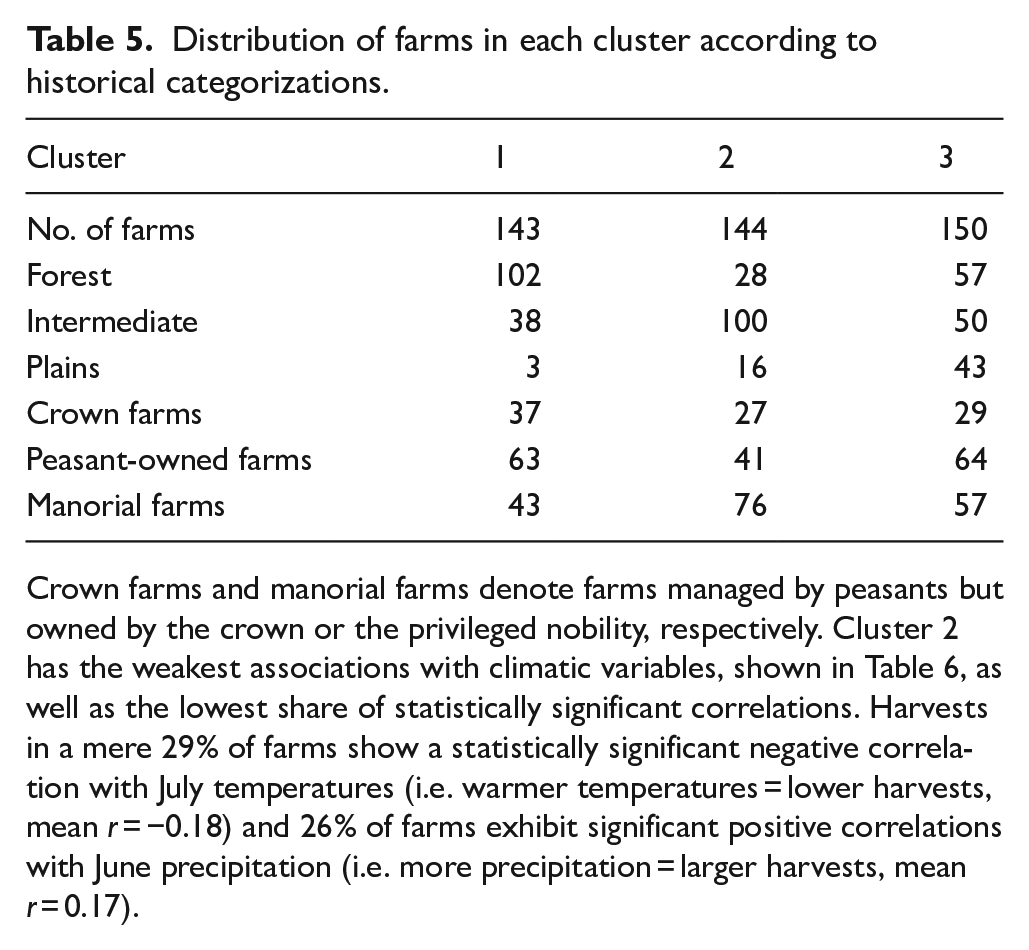
Crown farms and manorial farms denote farms managed by peasants but owned by the crown or the privileged nobility, respectively. Cluster 2 has the weakest associations with climatic variables, shown in Table 6, as well as the lowest share of statistically significant correlations. Harvests in a mere 29% of farms show a statistically significant negative correlation with July temperatures (i.e. warmer temperatures = lower harvests, mean r = −0.18) and 26% of farms exhibit significant positive correlations with June precipitation (i.e. more precipitation = larger harvests, mean r = 0.17).
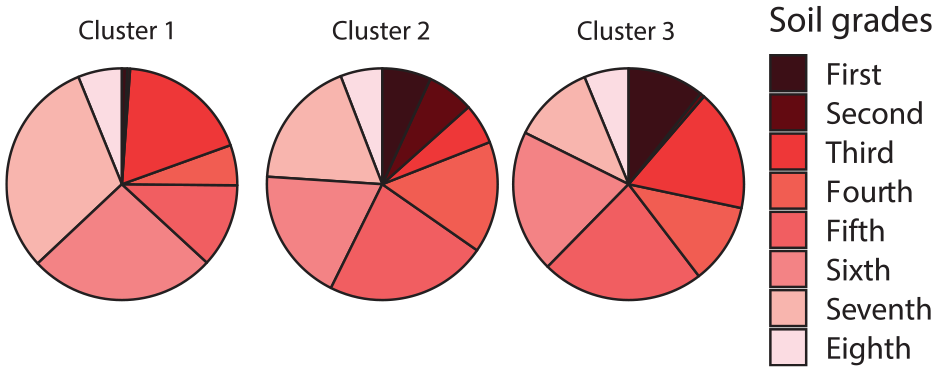
Mean proportions of different soil grades in the three clusters.
The clearest climate signals overall are obtained in Cluster 1, where harvests in 95% of the farms, for example, show a statistically significant negative relationship with July temperatures (warmer temperatures = lower harvests, mean r = −0.40) and 82% display significant positive relationships with July precipitation (more rain = larger harvests, mean r = 0.35). Furthermore, Cluster 1 also exhibits statistically significant negative correlations with spring temperature and precipitation as well as a weak positive correlations with (lagged) early autumn temperature indicators, largely absent in the other clusters. Twenty-six percent of farms in Cluster 3 have a statistically significant negative relationship between total grain production and precipitation in January (more rain = lower harvests, r = −0.18).
Overall, the months of June and July have the strongest and most consistent relationship with grain production across all clusters, followed by April, May, March, and, to a lesser extent, the (lagged) autumn months. Precipitation shows negative associations with grain production in January, March, and April (more rain = lower harvests), followed by a shift to positive correlations in the summer months of May, June, and July (more rain = larger harvests), where the relationship is stronger in the summer months compared to the winter and spring months. Temperatures are negatively associated with grain production across the spring (Cluster 1) and summer (all clusters) seasons (warmer springs and summers = lower harvests). Autumn temperatures in the previous year show positive associations with grain harvests in Cluster 1 (warmer autumns = larger harvests in the subsequent year). Hydroclimate indicators show positive associations with total grain production, mainly in Clusters 1 and 3 (wetter summer conditions = larger harvests).
Mean grain production per farm follows similar trends in each clusters, with a notable drop in the second half of the 1750s, roughly coinciding with a series of drought years. This period is followed by a stable or slightly positive trend, with a slight downturn around the drought year of 1826, see Figure 4. The mid 1830s then sees a temporary downward trend overlapping with the consecutive drought years 1834–1837.
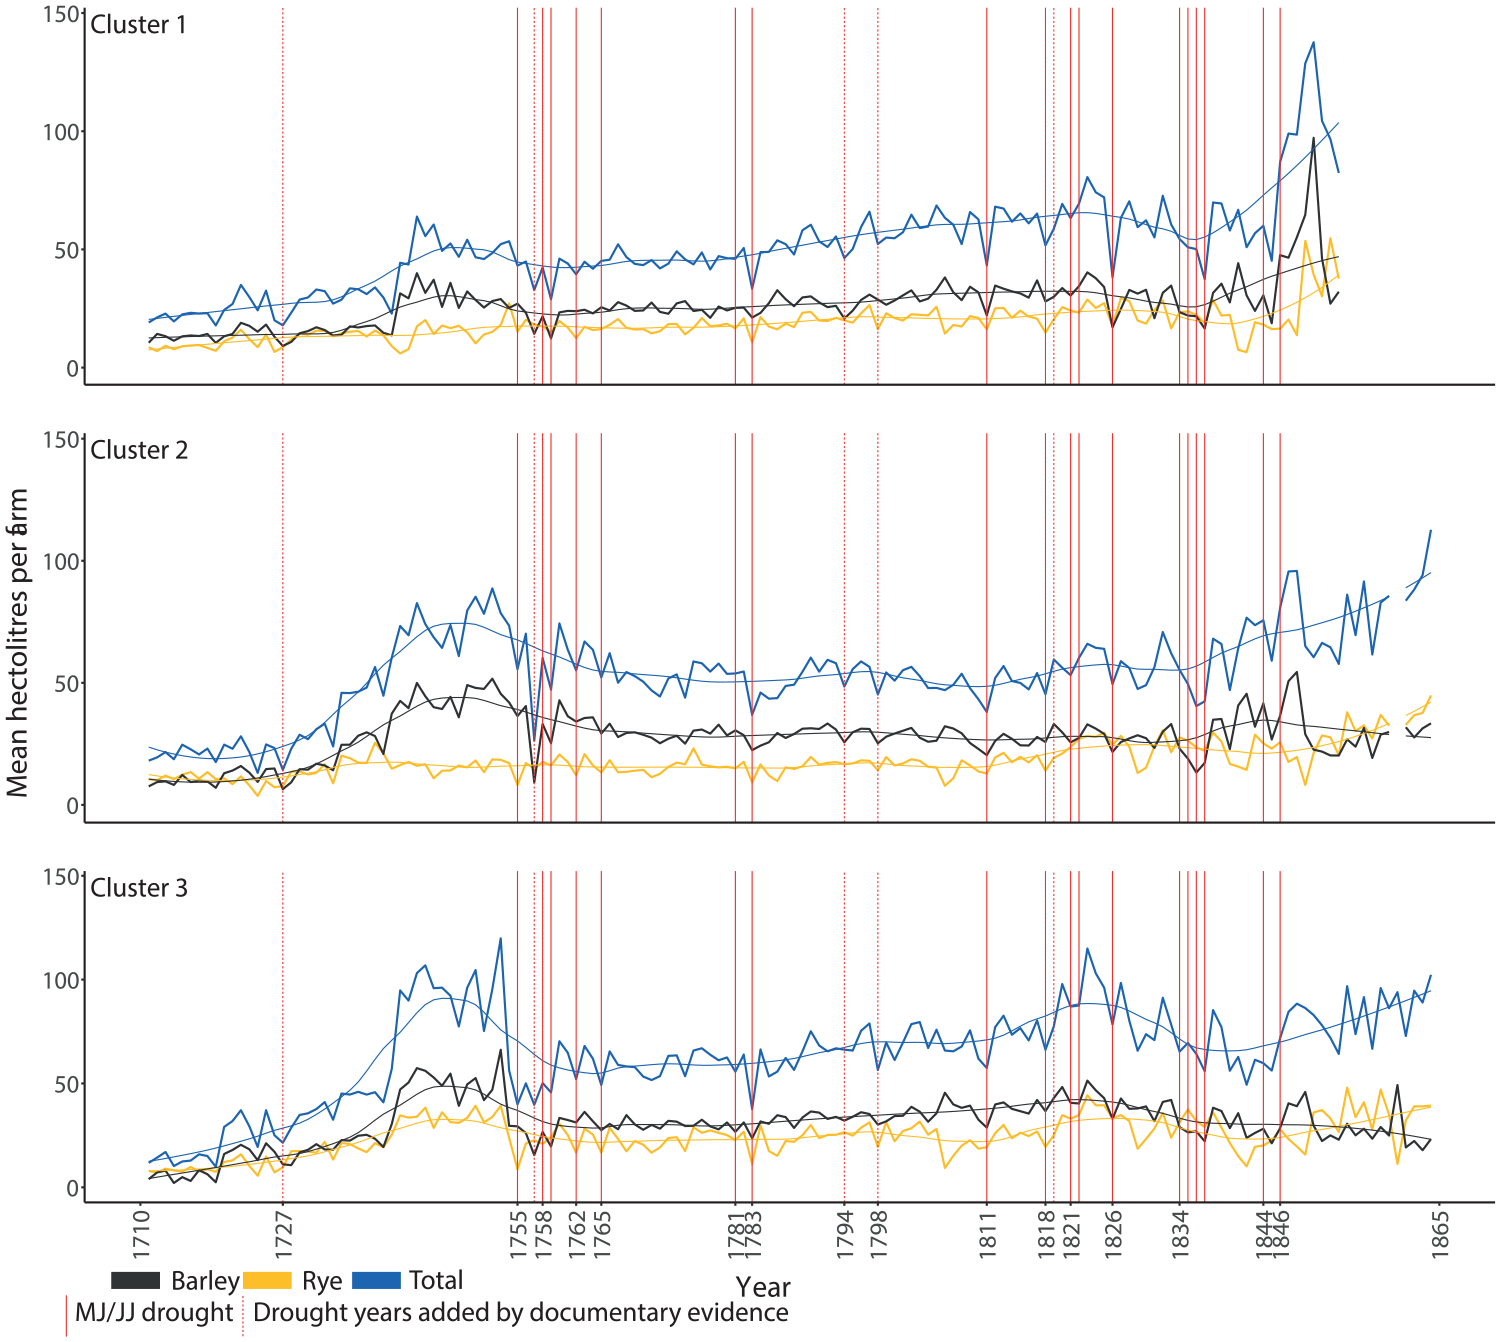
Grain production series for each cluster, including loess smoothers (span = 0.25) and estimated drought years, 1711–1865.
Estimating the impact of drought years
SEA on harvests and grain prices in Scania between 1614 and 1914
Using SEA to estimate the impact of droughtPadj event years on grain production in the cluster-aggregated data during the years 1702–1865 indicates that drought years were detrimental for all grain production in all clusters, showing negative harvest anomalies between 10% and 16%. Harvest losses were slightly smaller in Cluster 2 compared to Clusters 1 and 3. Rye production experienced statistically significant rebounds in t + 1 (i.e. the year subsequent to a drought) years in Clusters 2 and 3. These rebounds were of a slightly larger magnitude compared with the harvest losses in the previous year (see Figure 5). A rebound was also identified for total grain production in Cluster 3. Barley harvest anomalies were consistently lower than rye harvest anomalies in the years subsequent to a drought, but the effect was not statistically significant.
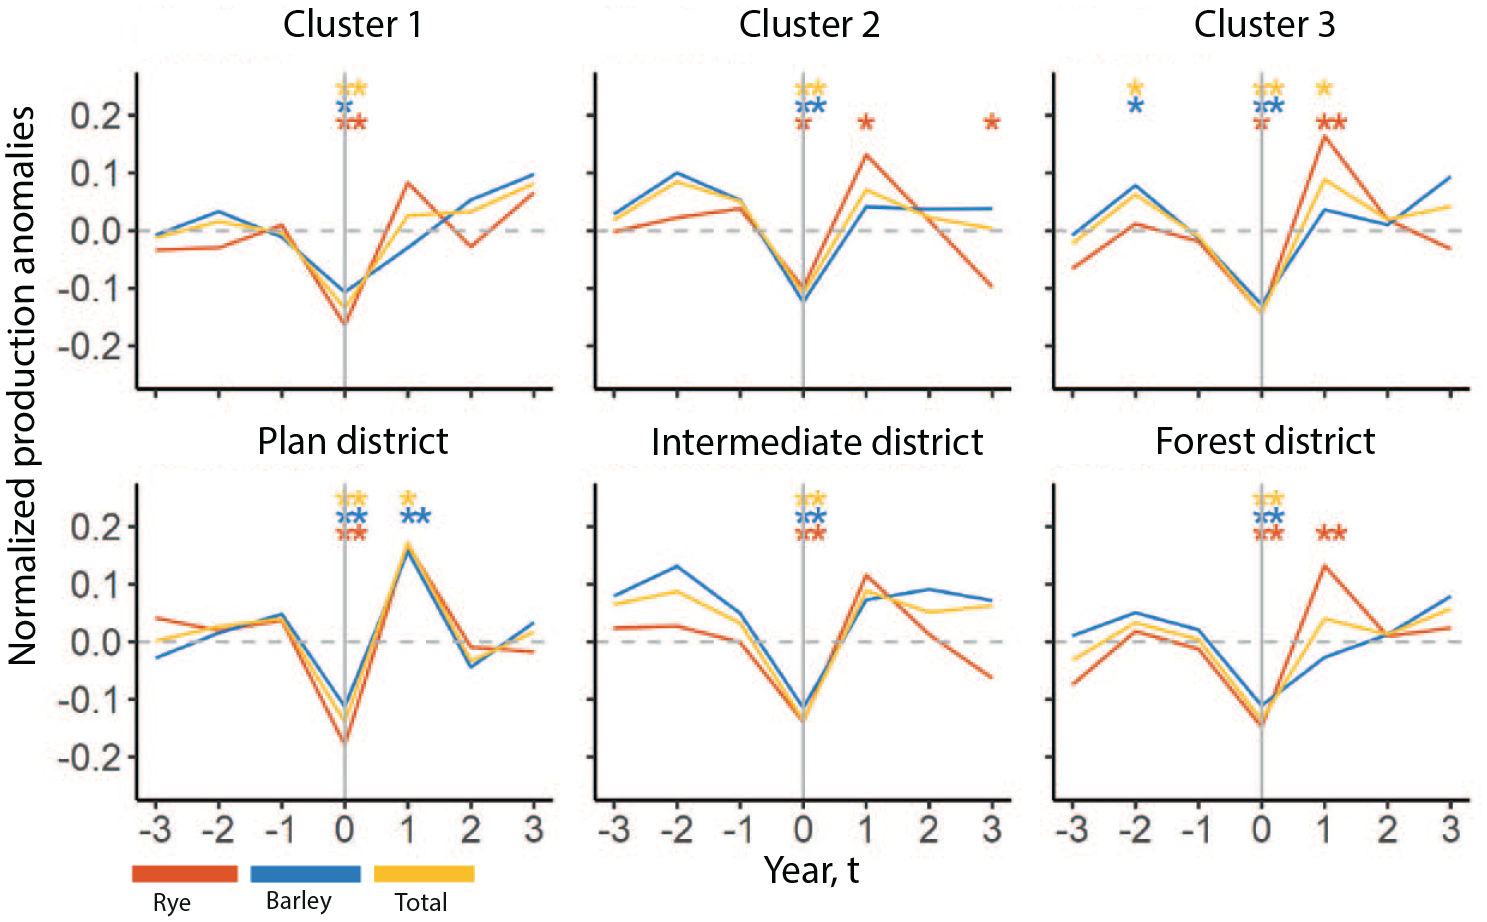
Superposed epoch analysis of grain production by cluster and type of farming district during the years 1711–1865 using droughtPadj years as events. Statistical significance is indicated by * (5% level) and ** (1% level).
Some differences are observed between types of farming districts. The SEA shows a clear rebound in grain harvests in t+1 years in the plain farming districts (although not statistically significant for rye); a similar effect is only found for rye in the forest districts, and not at all in the intermediate districts grain harvest series. The rebounds in the plain districts appear larger than the harvest losses experienced in t ± 0 years (i.e. the drought year) – barley harvests were on average almost twice as large. Barley and total grain harvests were on average almost 20% larger than normal in the year subsequent to a drought (t + 1) in the plain districts, compared to losses between 9% and 14% during the drought year (t ± 0). Intermediate districts also experienced significant barley losses during droughtPadj years but no statistically significant rebound. DroughtPadj years were associated with barley harvest losses in the forest districts during both years t ± 0 and t + 1, indicating persistence in harvest losses, although the effect was not statistically significant in the t + 1 years. Re-performing the analysis with droughtp years gave similar results, but with lower harvest losses in Cluster 2 and in the Intermediate districts sample (see Supplemental Figure S6, available online).
As can be seen in Figure 5, negative harvest anomalies during drought years are of similar proportions in all the samples analyzed here, although rye harvests were slightly larger compared with the other crops in the plains districts and in Cluster 1. Rye harvest losses in drought years range between 10% (Cluster 2) and 18% (plain districts). Corresponding barley harvest losses range between 10% (Cluster 1) and 13% (Cluster 3). Finally, total harvest losses range between 11% (Cluster 2) and 14% (Cluster 3). It should be noted that during individual drought years, harvest losses could be much greater, as in 1783, or lower, as in 1844/1846, as can be ascertained from Figure 4.
Prices of rye, barley, and oats all underwent statistically significant increases during drought years (see Figure 6). During the longer period (ca 1660–1910), rye and barley prices increased by 14% and 20%, respectively, during droughtPadj years as compared to normal years, whereas oat prices rose by almost 32%. While the effect of droughtp years t ± 0 on grain prices is clear, no lagged effects are identified. Due to the uncertainty in the drought chronology before the 18th century, the tests were run again focusing only on droughtp events. In this latter analysis, the corresponding price hikes during drought years were 15% (rye), 17% (barley), and 28% (oats). Again, no significant lagged effects were found, although oat price anomalies appear slightly more elevated in the years subsequent to a drought, compared with other grain price anomalies.
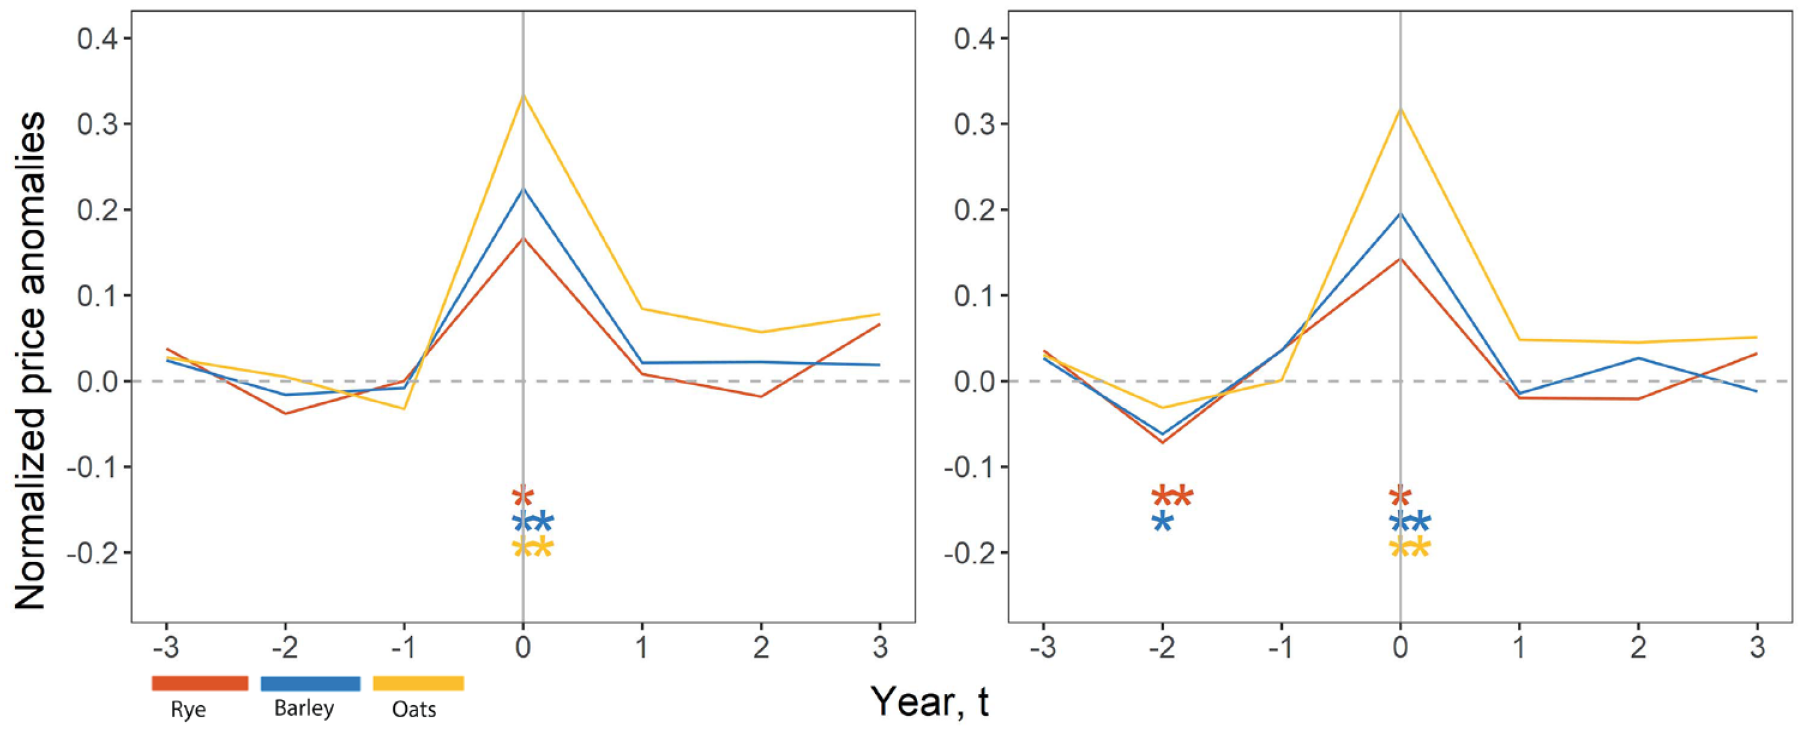
Superposed epoch analysis of grain prices in different time periods, 1664–1914 and 1754–1914, For Peer Review using droughtPadj and droughtp years as events, respectively. Statistical significance is indicated by * (5% level) and ** (1% level).
In order to control for the possibility of results being skewed by years of both extreme cold and drought, the analysis was repeated considering only years with extremely cold springs, excluding droughtp years (Supplemental Figure S7, available online).
SEA on county-level harvest yields in Malmöhus and Kristianstad, 1818–1911
When considering the impact of drought years on the yield ratio data from the 19th century, SEA shows statistically significant negative impacts on most types of crop production during droughtP years t ± 0, except for winter wheat and winter rye in Malmöhus where the effects are not statistically significant (see Figure 7). Statistically significant harvest or yield reductions range between 22% (hay and fodder harvests in Malmöhus) and 10% (barley yields in Kristianstad) compared to normal years.
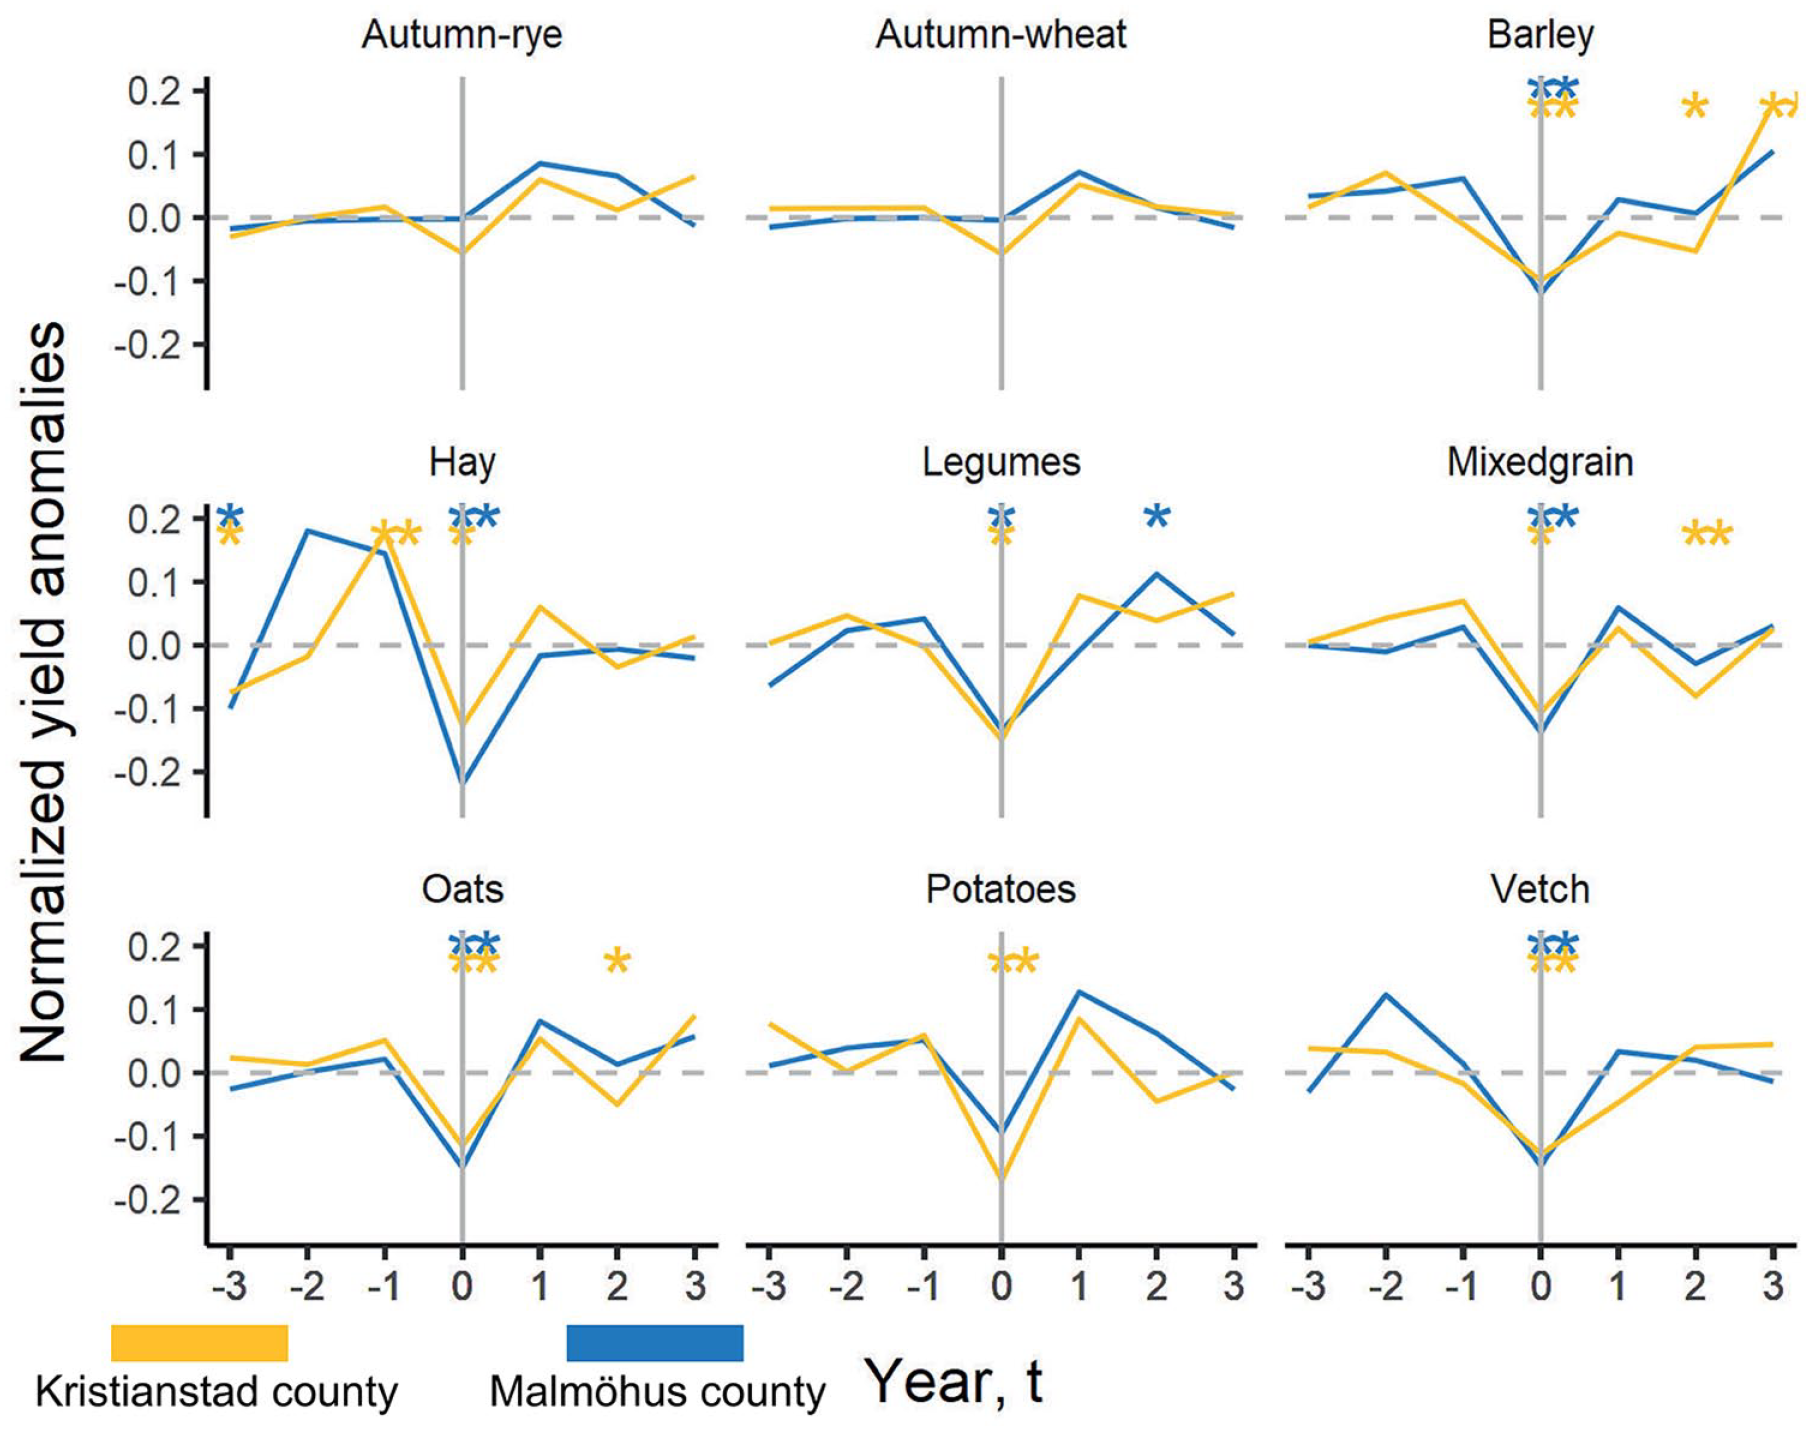
Superposed epoch analysis of crop yields and harvests by county, using droughtp years as events. Statistical significance is indicated by * (5% level) and ** (1% level).
There are clear drops in yields for all spring crops in both counties during droughtP years and, most of them highly statistically significant (at the 1% level) with reductions ranging between 10% and 15% compared to normal years. Although no statistically significant rebounds are evident, there appears to be some recovery in yields or harvests for most crops, excluding vetch, barley, and hay, in these cases, the post-drought years show lower values compared with pre-drought years.
Together with the spring crops, fodder and hay crops appear to be the type of agricultural production that was most vulnerable to drought during the period 1818–1911, suffering losses of similar or larger magnitudes than the spring crops. Yield reductions of 15% and 13% in Malmöhus and Kristianstad, respectively, of the important fodder crop of vetch were highly statistically significant. Hay and fodder harvests suffered reductions of 13% in Kristianstad, and 22% in Malmöhus in drought years.
Discussion
To characterize the summer climate of Scania in terms of its propensity for droughts is not straightforward. As noted, prolonged absolute precipitation droughts (<2 mmP during >60 days) are completely absent from the historical record, even though the possibility of such abnormal droughts should not be discarded. In most years of estimated droughtP years, there were moderate or large amounts of precipitation outside the given parameters. For example, low amounts of rain during June and July could be preceded by a rainy May like in 1835 or followed by a wet August like in 1783. This heterogeneity in the Scanian summer climate and the subsequent difficulties in estimating weather effects on harvests was noted by de Toro et al. (2015) These issues are aggravated when the available information is incomplete. Nonetheless, it is striking that the effects of droughtsPadj and droughtP were so consistent across all different sub-samples, especially during drought years t ± 0.
Previous research has identified the presence of large-scale regional harvest failures in the region during the study period (Dribe et al., 2017b; Nyström, 2019). However, this research merely employed the abstract concept of agricultural risk without systematically linking these risks to specific weather or climate phenomena. For example, Nyström (2019) found large-scale regional harvest losses in Scania in 1837, and associated these with a supposedly cold spring. Taking the existing climate data into account, one indeed finds that the Scanian spring of 1837 was cold (11th coldest between 1701 and 1911). However, this summer also experienced some of the driest conditions during June and July in the entire historical record, only exceeded in this regard by the summer of 2018 (SMHI, 2021). Furthermore, no systematic evidence has been found that indicates an association between cold springs and reduced harvests in Scania, neither in this study (see Table 6 and Supplemental Material, Figures S4 and S5, available online) nor in a previous study by Skoglund (2022). The dominant view in previous research is that agriculture in the southern third of Sweden was mainly constrained by precipitation (Edvinsson et al., 2009; Myrdal, 2011). Considering the impacts of explicitly defined drought years, the results obtained in this article could show that the most apparent type of large-scale agricultural risk facing farmers in Scania before the 20th century was drought. Other type of agrometeorological risks, such as extremely cold springs or summers, appear to have had only local effects, with no systematic indications in the aggregated samples. Thus, from an agricultural perspective, 1837 should first and foremost be considered a drought year.
Mean of farm-level climate correlations between total harvest output and climate indicators within each cluster.
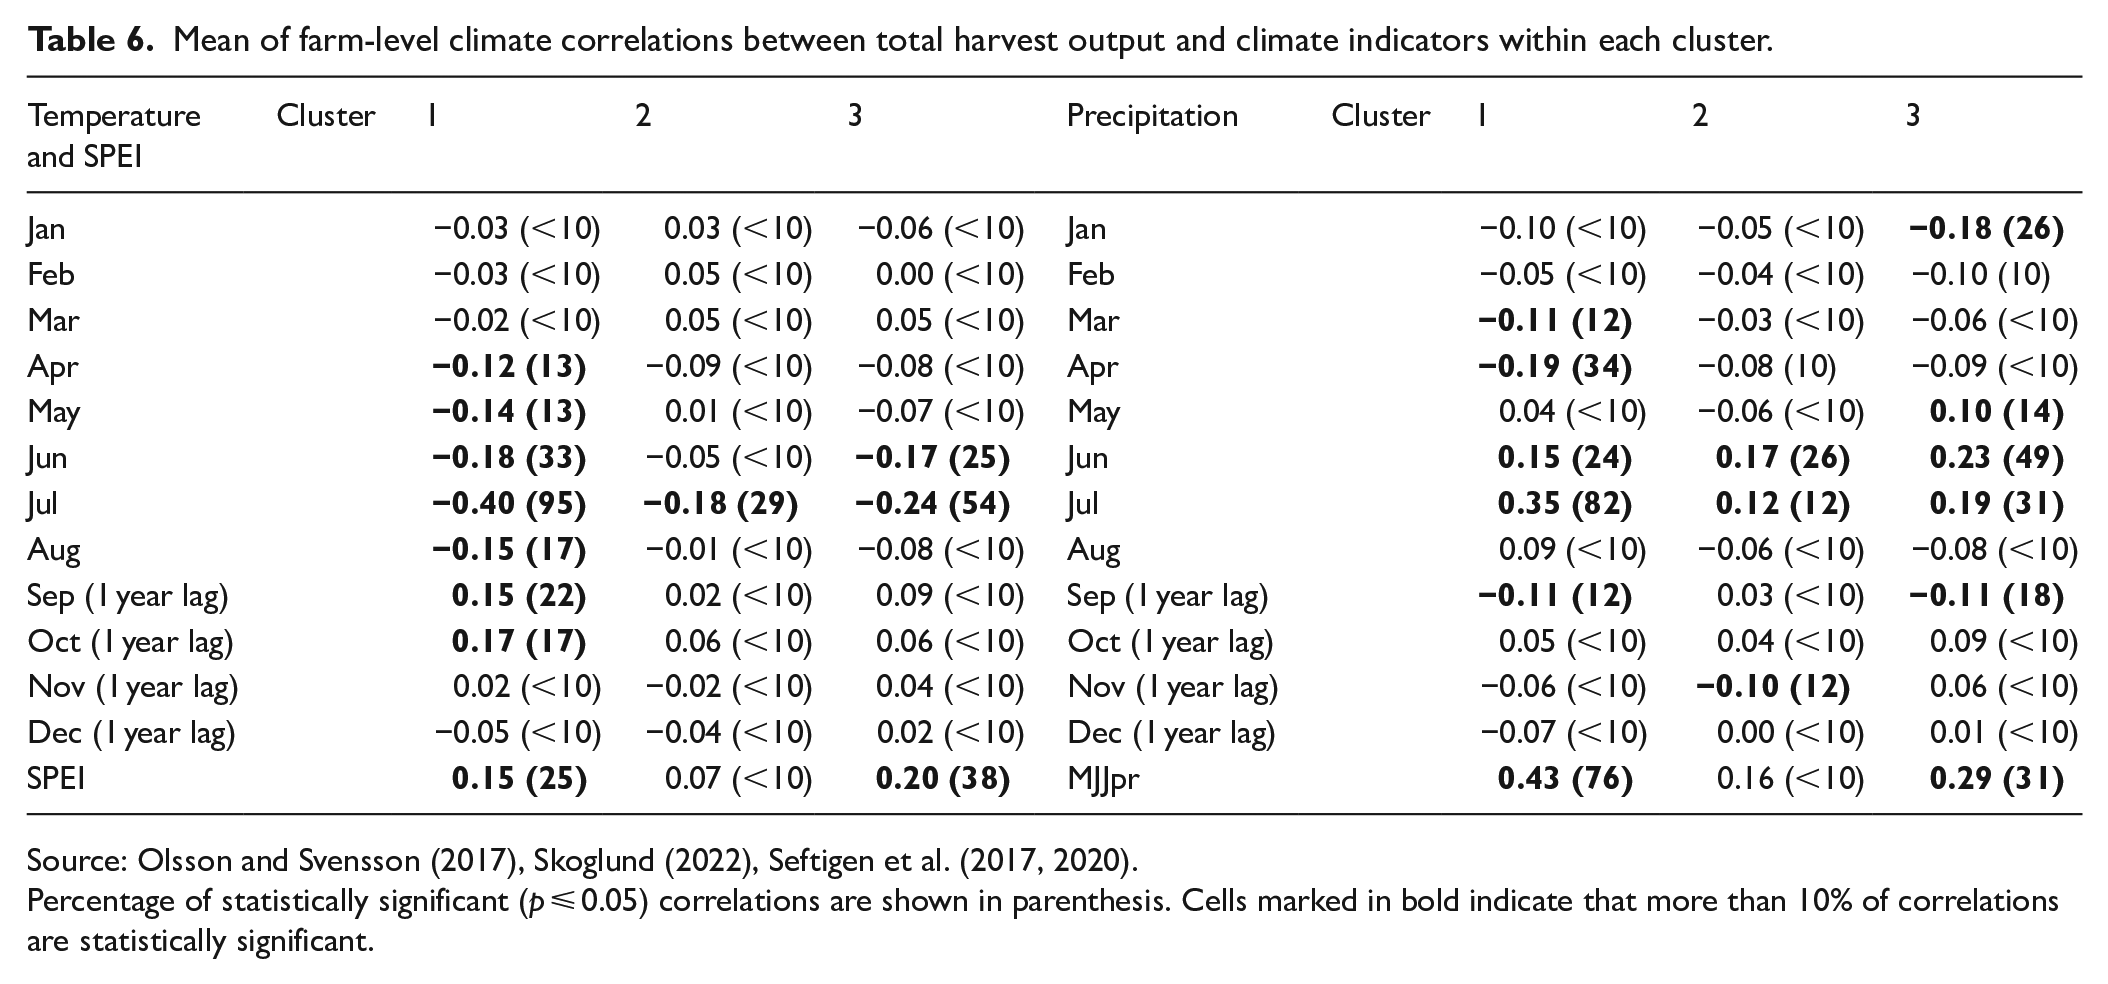
Source: Olsson and Svensson (2017), Skoglund (2022), Seftigen et al. (2017, 2020).
Percentage of statistically significant (p ⩽ 0.05) correlations are shown in parenthesis. Cells marked in bold indicate that more than 10% of correlations are statistically significant.
Regarding the impact of explicitly defined drought years, differences between clusters and type of farming district were less marked, though this was only observed when considering the drought years (t ± 0). Mean negative harvest anomalies during drought years across all samples from the period ca 1702 to 1865 ranged between 10% and 20%. These magnitudes were very close to the mean yield ratio reductions during drought years in the period 1818–1911, which ranged between 10% and 22% for spring and fodder crops (including hay from meadows). However, in this latter period winter crops did not show any systematic harvest or yield reductions during drought years. Grain prices increased significantly during drought years, on average between 17% and 30%. These averages of yield and price anomalies were based on a specific set of explicitly defined drought years. Specific effects in individual drought years could be much larger or smaller. For example, barley yield reductions in 1837 were almost 40% in Kristianstad and 37% in Malmöhus, while in 1844 barley yields were slightly higher than normal.
During the early period (ca 1702–1865), farms, particularly in the forest districts, appear to have suffered persistent losses in barley harvests in the year following a drought, although the effects were not statistically significant. When taking into account the lack of a rebound effect that was present on other types of farms and for other types of grain, the case for persistence becomes stronger. Previous research on early-modern Finland (which was part of the Swedish realm until 1809) has shown that even after one bad harvest of a particular crop, the subsequent seed supply would be reduced (Huhtamaa and Helama, 2017b; Huhtamaa et al., 2022; Jutikkala, 2003). Bekar (2019) found that harvests were persistent on manors in England during the 13th and 14th centuries. The problem was even reported on in the surplus grain-producing region of Scania as late as the early 18th century (Brasch, 2016). Lack of seed may shed some light on persistence in losses in harvest volume but not in regards to yield ratios. One way to mitigate shortfalls in seed supply would have been extensive seed-trading networks. To date there is very little evidence regarding how and whether such trade occurred, at least at the local level (Leino, 2017). In the 18th century, authorities oversaw the establishment of parish grain magazines, in which farmers could save seed-grain for bad years or borrow from other depositors (Berg, 2007).
Considering the effects from the years following a drought, two different risk patterns emerge regarding rebound or persistence effects. On the one hand, farms in the plain districts exhibited a larger degree of variability in grain production compared to farms in other types of farming districts (Nyström, 2019). During drought years, this manifested in large crop losses, relative to harvests in approximate years. However, these farms quickly rebounded, experiencing increased harvests in the year following a drought. A similar pattern of a harvest rebound occurred after the 2018 summer drought (SCB, 2019). On the other hand, farms in the forest districts typically experienced large harvest losses during drought years as well, but not as large as those experienced by farms on the plains. However, losses in barley production on these types of farms showed signs of persistence that tended to last for at least one additional year after a drought.
Interpreting these results in terms of vulnerability and resilience is not straightforward. When only analyzing the years of drought, farms on the plains appear slightly more vulnerable, at least up until the 1850s. However, even after the worst drought years these farms were obviously still able to retain sufficient seed-grain, which allowed them to experience larger than average harvests in the subsequent year. Taking only the drought year itself into consideration, the “risk-averse” forest or intermediate district farms and “risk-prone” farms appear about equally vulnerable to droughts. Considering spans longer than one year, incorporating potential rebound or persistence effects, farms on the plains who traditionally have been seen as more “risk-prone” appear to have in fact been more resilient to droughts, whereas farms in the forest districts appear to have been more vulnerable. Farms located in the forest districts often had a larger reliance on alternative means of subsistence, such as livestock rearing, small-scale handicraft and forest-related industries as well as fishing (Dribe et al., 2017b; Lagerås and Magnell, 2020). However, the fact that there were large price hikes during drought years, implies that the entire agrarian economy of Scania suffered during those times, even in, or perhaps especially in, areas that were less dependent on household grain production for subsistence. If anything, farmers specialized in intensive grain production could have capitalized on high prices, given that they were more likely to have something left over after fixed deductions during a bad year (Pfister and Wanner, 2021).
How did crop diversification affect vulnerability to drought? Historical varieties of spring crops like barley and oats have been noted for other parts of Europe to be particularly susceptible to drought. de Toro et al. (2015), in a study of the worst harvest losses in Scania between 1965 and 1990, found that all of the largest harvest losses for spring crops were associated with very dry conditions in the May–July period, sometimes combined with an extremely wet harvest season (August–September); these results are strikingly similar to those obtained here. Autumn rye varieties, on the other hand, have been seen as more drought-resistant (Pribyl, 2020; Pribyl and Cornes, 2020b). Even in the yearly forms sent out by Tabellverket spring crops were singled out in comparison with winter rye as particularly badly affected by drought. However, results from the SEA indicate that rye harvest losses during summer droughts were, if anything, slightly larger than those of other crops, at least in the period ca 1700–1865. Rye harvests did show a greater tendency to rebound compared with other crops. One explanation for this is that there was a build-up of nutrients in the soil after such years that particularly favored winter crops like rye. Autumn crops were sown about at the same time as the harvest season, meaning that any shortages induced by harvest losses would hardly have begun to make themselves felt (Bringéus, 2013). Barley was not sown until May in the subsequent year, when shortages could have more realistically led to reductions in seed supply. Furthermore, winter crop yields were generally higher, at least by the 19th century, which would have mitigated against seed shortages. Drought sensitivity in winter crops appears to have been greatly diminished in the late 19th century, which can possibly be explained by the introduction of new, more temperature-dependent varieties and increasingly sophisticated agricultural methods (Edvinsson et al., 2009; Skoglund, 2022). Notably, the cold year of 1867 led to yield reductions for winter crops of 18% (wheat) and 23% (rye), compared to 8% and 7% in the subsequent drought year of 1868. Barley and oat yields, on the other hand, suffered negligible reductions in 1867 at 3% and 7%, respectively, especially in comparison with 1868 when the corresponding reductions were 24% and 30% (SCB, 2009). The increased ditching undertaken in the 19th century does not appear to have increased vulnerability to drought, at least for winter crops. Improved drainage may even have helped water retention in the soil by allowing water to penetrate deeper and thus avoiding the greater evapotranspiration in upper soil layers (Nyström, 2019).
Nonetheless, the evidence that all crop cultivation suffered during drought years in the 18th and early 19th centuries, even the supposedly drought-resistant crops, contrasts with the common notion that crop diversity, not least the simultaneous cultivation of winter and spring crops, increased resilience. Such arguments have already been made for other parts of northern Europe like Finland and England (Huhtamaa and Helama, 2017a; Michaelowa, 2001; Pribyl and Cornes, 2020b). A simple explanation for this could be that both spring and winter crops were adapted to the prevailing climatic regime. Cultivating crops that could withstand extreme years but performed less well during average years would have been a less sound strategy unless total harvest failures were common. Significant harvest losses were experienced during drought years, but total or near total harvest failures like, for example, those induced by autumn frosts in more northerly parts of Sweden or Finland appear to have been extremely rare in the more favorable Scanian climate (Huhtamaa and Ljungqvist, 2021; Huhtamaa et al., 2022; Myllyntaus, 2009). In more intensive farming systems, like in Scania, one should expect a larger degree of optimization in line with average conditions. The cultivated crops were not only a product of active choices; before the advent of modern crop breeding, there was more variety within each field, shaped by intentional and non-intentional selection pressures in the local context. In modern parlance, these crops are often called landraces or historical landraces (Newton et al., 2010). Even if diversification strategies were pursued in a context of a relative absence of extreme harvest failures, over time both spring and winter crops would have been subject to similar adaptive pressures found in the local environment.
Most types of agricultural production studied here were negatively affected by droughts. The broader agrarian economy appears to have been impacted as well, as evidenced by the grain price hikes during drought years. The price of grain is one of the central and most socially relevant economic indices during the pre-industrial era (Bateman, 2013; Edvinsson, 2012; Ljungqvist et al., 2022; Persson, 1999). The most obvious way droughts affected grain prices is through the effect it had on harvests, which in turn played an important role in shaping local supply and prices. Thus, the effects were indirect and mediated. Other factors not directly related to the harvest, like processing, could also play a role. For example, in a land survey of the village Harsnäs in Malmöhus in 1717, the surveyor noted that the small village mill often ground to a halt during dry years (Almgren, 1717). Grain prices were also affected by a variety of other important factors, like market integration, regulations, shipping and transport conditions and so on (Persson, 1999). Similarly, harvests were also determined to some extent by non-climatic conditions, even during extreme years, such as by varying application of manure, or the weeding and sowing intensity (Palm, 1997). Even so, this article has demonstrated that droughts had consistent negative impacts on agriculture and the broader agrarian economy of Scania between the 17th and early 20th centuries.
Conclusion
Previous research has identified large-scale regional harvest failures in Scania, but without systematically linking them to specific weather or climate phenomena. This study provides the first systematic chronology of droughts in Scania before the 20th century. Furthermore, this study provides evidence that drought was the most apparent large-scale agricultural risk facing farmers in Scania before the 20th century. Explicitly defined drought years were consistently associated with large harvest reductions or grain price hikes throughout the 17th to early 20th centuries. Winter crops began to exhibit a greater drought-tolerance in the late 19th century while spring and fodder crops continued to be vulnerable to drought throughout the study period. In addition, harvests of winter crops tended to rebound in the year following a drought. Harvest reductions of spring crops, on the other hand, did not show any signs of a rebound in the year following a drought. Over time, diversification as well as intensification strategies both contributed to increase drought resilience, showing the complexity in operationalizing the concept of resilience.
Supplemental Material
sj-docx-1-hol-10.1177_09596836231200431 – Supplemental material for The impact of drought on northern European pre-industrial agriculture
Supplemental material, sj-docx-1-hol-10.1177_09596836231200431 for The impact of drought on northern European pre-industrial agriculture by Martin K Skoglund in The Holocene
Supplemental Material
sj-eps-2-hol-10.1177_09596836231200431 – Supplemental material for The impact of drought on northern European pre-industrial agriculture
Supplemental material, sj-eps-2-hol-10.1177_09596836231200431 for The impact of drought on northern European pre-industrial agriculture by Martin K Skoglund in The Holocene
Supplemental Material
sj-eps-3-hol-10.1177_09596836231200431 – Supplemental material for The impact of drought on northern European pre-industrial agriculture
Supplemental material, sj-eps-3-hol-10.1177_09596836231200431 for The impact of drought on northern European pre-industrial agriculture by Martin K Skoglund in The Holocene
Supplemental Material
sj-eps-4-hol-10.1177_09596836231200431 – Supplemental material for The impact of drought on northern European pre-industrial agriculture
Supplemental material, sj-eps-4-hol-10.1177_09596836231200431 for The impact of drought on northern European pre-industrial agriculture by Martin K Skoglund in The Holocene
Supplemental Material
sj-eps-5-hol-10.1177_09596836231200431 – Supplemental material for The impact of drought on northern European pre-industrial agriculture
Supplemental material, sj-eps-5-hol-10.1177_09596836231200431 for The impact of drought on northern European pre-industrial agriculture by Martin K Skoglund in The Holocene
Supplemental Material
sj-eps-6-hol-10.1177_09596836231200431 – Supplemental material for The impact of drought on northern European pre-industrial agriculture
Supplemental material, sj-eps-6-hol-10.1177_09596836231200431 for The impact of drought on northern European pre-industrial agriculture by Martin K Skoglund in The Holocene
Supplemental Material
sj-eps-7-hol-10.1177_09596836231200431 – Supplemental material for The impact of drought on northern European pre-industrial agriculture
Supplemental material, sj-eps-7-hol-10.1177_09596836231200431 for The impact of drought on northern European pre-industrial agriculture by Martin K Skoglund in The Holocene
Supplemental Material
sj-eps-8-hol-10.1177_09596836231200431 – Supplemental material for The impact of drought on northern European pre-industrial agriculture
Supplemental material, sj-eps-8-hol-10.1177_09596836231200431 for The impact of drought on northern European pre-industrial agriculture by Martin K Skoglund in The Holocene
Footnotes
Acknowledgements
The author is grateful to Prof. Rodney Edvinsson, Stockholm University who shared data on harvest yield ratios for Malmöhus and Kristianstad counties in the 19th century and Prof. Mats Olsson, Lund University, for data on grain prices in Malmöhus.
Funding
The author received no financial support for the research, authorship, and/or publication of this article.
Supplemental material
Supplemental material for this article is available online.
References
Supplementary Material
Please find the following supplemental material available below.
For Open Access articles published under a Creative Commons License, all supplemental material carries the same license as the article it is associated with.
For non-Open Access articles published, all supplemental material carries a non-exclusive license, and permission requests for re-use of supplemental material or any part of supplemental material shall be sent directly to the copyright owner as specified in the copyright notice associated with the article.