
Abstract
How do human communities integrate within food webs? Studies characterizing the historical flow of energy among people and local environments can yield important insights into managing sustainable ecosystems. Here, we combine zooarchaeological, bulk tissue, and compound-specific stable isotope data from late Holocene Santa Rosa Island to investigate the ecological role of people within a southern California nearshore marine ecosystem. We show people foraged in diverse marine habitats, including kelp forests and pelagic waters, and consumed a wide range of species. However, zooarchaeological results reveal >50% of recovered fish remains came from presumed kelp forest carnivores of mid-trophic level (3.0–4.0) such as surfperches and rockfishes. Local fishing strategies thus did not involve the preferential removal of large-bodied, high trophic level species – a pattern known as “fishing down the food web” which has been documented in modern commercial fisheries and results in the collapse of marine ecosystems. Essential amino acid δ13C analysis revealed that the historical fish community relied on basal resources from kelps and phytoplankton. This coupling of benthic and pelagic energy sources suggests late Holocene coastal food webs in the region were in a relatively stable configuration immediately prior to first European arrival. This stability likely contributed to sustaining densely populated Chumash settlements, intensive fisheries, and high local faunal diversity. Our findings provide important pre-industrial data for marine ecosystems and document some of the mechanisms behind the intensive, yet sustainable long-term fisheries of the Island Chumash.
Keywords
Introduction
How do we fit within diverse ecosystems across the globe? This question is foundational for socio-environmental studies, yet people are often considered separately from their environment. In ecology, for example, most research involving people is concerned with our impacts on the environment and our role in ecological degradation and biodiversity loss (e.g. Dayton et al., 1998; Jackson et al., 2001; Jones et al., 2021; McCauley et al., 2015; Steneck et al., 2002) In archaeology, researchers have long considered people as an integrated component of food webs, however more information is needed to understand how people in the past may have influenced the long-term structure and functioning of food webs (Dunne et al., 2016). There is a growing trend across these disciplines to provide more holistic views of people within ecosystems and to evaluate the dynamics among culture and environmental change. Examples include modern urban ecology (Grimm et al., 2008; Pickett et al., 2001), as well as historical ecology investigations regarding the long-term role of people within food webs (Braje et al., 2009, 2017; Erlandson et al., 2009, 2011; Fauvelle and Somerville, 2021; Guiry et al., 2021; Lotze and Milewski, 2004; Morales and Roselló, 2004; Reitz, 2004; Rick and Erlandson, 2008; Yeakel and Dunne, 2015).
Studies of historical human-ecosystem dynamics are highly topical for marine habitats, as people have had strong and enduring connections to the ocean for millennia (Erlandson and Rick, 2010). However, marine ecosystems face dire predictions due to overexploitation from industrial and commercial fishing, habitat alteration, and ocean warming and acidification (Estes et al., 2011; Jackson et al., 2001; McCauley et al., 2015; Steneck et al., 2002). Our understanding of the structure and dynamics of marine food webs is also incomplete, owing to population declines of many species prior to the advent of ecological monitoring programs. This is often termed the “shifting baseline syndrome” (Pauly, 1995) and reflects our inability to see “ecological ghosts” (Dayton et al., 1998). These ghosts encompass not just the extirpation of individual species, but also reductions in species interactions, a problematic blind spot given that food web architecture is a key predictor of local ecological stability (Rooney and McCann, 2012; Rooney et al., 2006). A historical or archeological perspective can help fill these gaps. These studies can provide local-level ecological data prior to intensive commercial/capitalist impacts, (e.g. Braje et al., 2009; Erlandson and Rick, 2010; Pinnegar and Engelhard, 2008), particularly when paired with stable isotope analyses of faunal remains which provide quantitative data on dietary and ecological patterns of ancient consumers (Braje et al., 2017; Guiry et al., 2021; Koch et al., 2017; Szpak et al., 2009, 2012). Historical studies also offer unique insights by identifying specific environmental or cultural contexts where local fisheries were sustainable over long time scales (e.g. Braje et al., 2009, 2017).
Here, we characterize the ecology of people and a marine fish community from the California Channel Islands, a region with at least 13,000-years of settlement by coastal peoples (Erlandson et al., 2008, 2009; Rick et al., 2005). The islands contain important terrestrial resources (e.g. geophytes), but these are often overshadowed by the rich array of foods found in coastal waters, including intertidal and subtidal shellfish, finfishes, and a multitude of marine mammals and seabirds. Archeological studies have documented changing marine resource use by Island Chumash communities over the Holocene, with many early sites indicating a focus on shellfish, whereas finfish and marine mammals often served as the dominant protein source during the late Holocene following technological innovations (e.g. circular shell fishhooks, tomols or plank canoes), increasing population densities, and territorial circumscription (Erlandson et al., 2009, 2011; Jazwa et al., 2020; Rick et al., 2005). The Channel Islands thus serve as an ideal location for studying long-term interactions between people and coastal ecosystems (Erlandson et al., 2009; Rick et al., 2005). Furthermore, because Chumash economies were based primarily on hunting, gathering, and fishing with complex and sophisticated land-use strategies, they provide an important juxtaposition to EuroAmerican commercial/capitalist fisheries that began in the region during the second half of the 19th century (Braje et al., 2021).
We focus on a late Holocene archeological site, CA-SRI-85, located within the Skunk Point State Marine Reserve on eastern Santa Rosa Island (Figure 1). Dated to between 675 and 1835 cal AD (2 sigma), CA-SRI-85, along with nearby CA-SRI-87, likely correspond to the historical Chumash village, Qshiwqshiw, which means “bird droppings” (Braje et al., 2014). The site was occupied into the Mission Period and provides a pre-contact baseline for local ecosystems alongside changes in Chumash society that occurred after the arrival of the Spanish. Ethnohistoric records indicate that Qshiwqshiw was one of the largest and most important villages on the northern Channel Islands, with at least four chiefs in residence in the 19th century and no other island village having more than one (McLendon, 1999). At this time, Chumash population densities were high, estimated to be ~3000 people across the northern Channel Islands and ~120 residents based on baptismal records at Qshiwqshiw alone (Braje et al., 2010, 2014; McLendon, 1999). We combine zooarchaeological analysis from CA-SRI-85 with isotopic techniques including δ13C and δ15N analysis of bulk bone collagen, along with δ13C analysis of individual amino acids. With these data, we reconstruct the local marine food webs utilized by historical Island Chumash communities on Santa Rosa and evaluate broad cultural and ecological patterns, focusing on the period between cal AD 675 and 1415. Our results provide a critical perspective into the fishing practices and ecological role of Indigenous coastal communities of southern California and the dynamics of pre-industrial Pacific ecosystems.
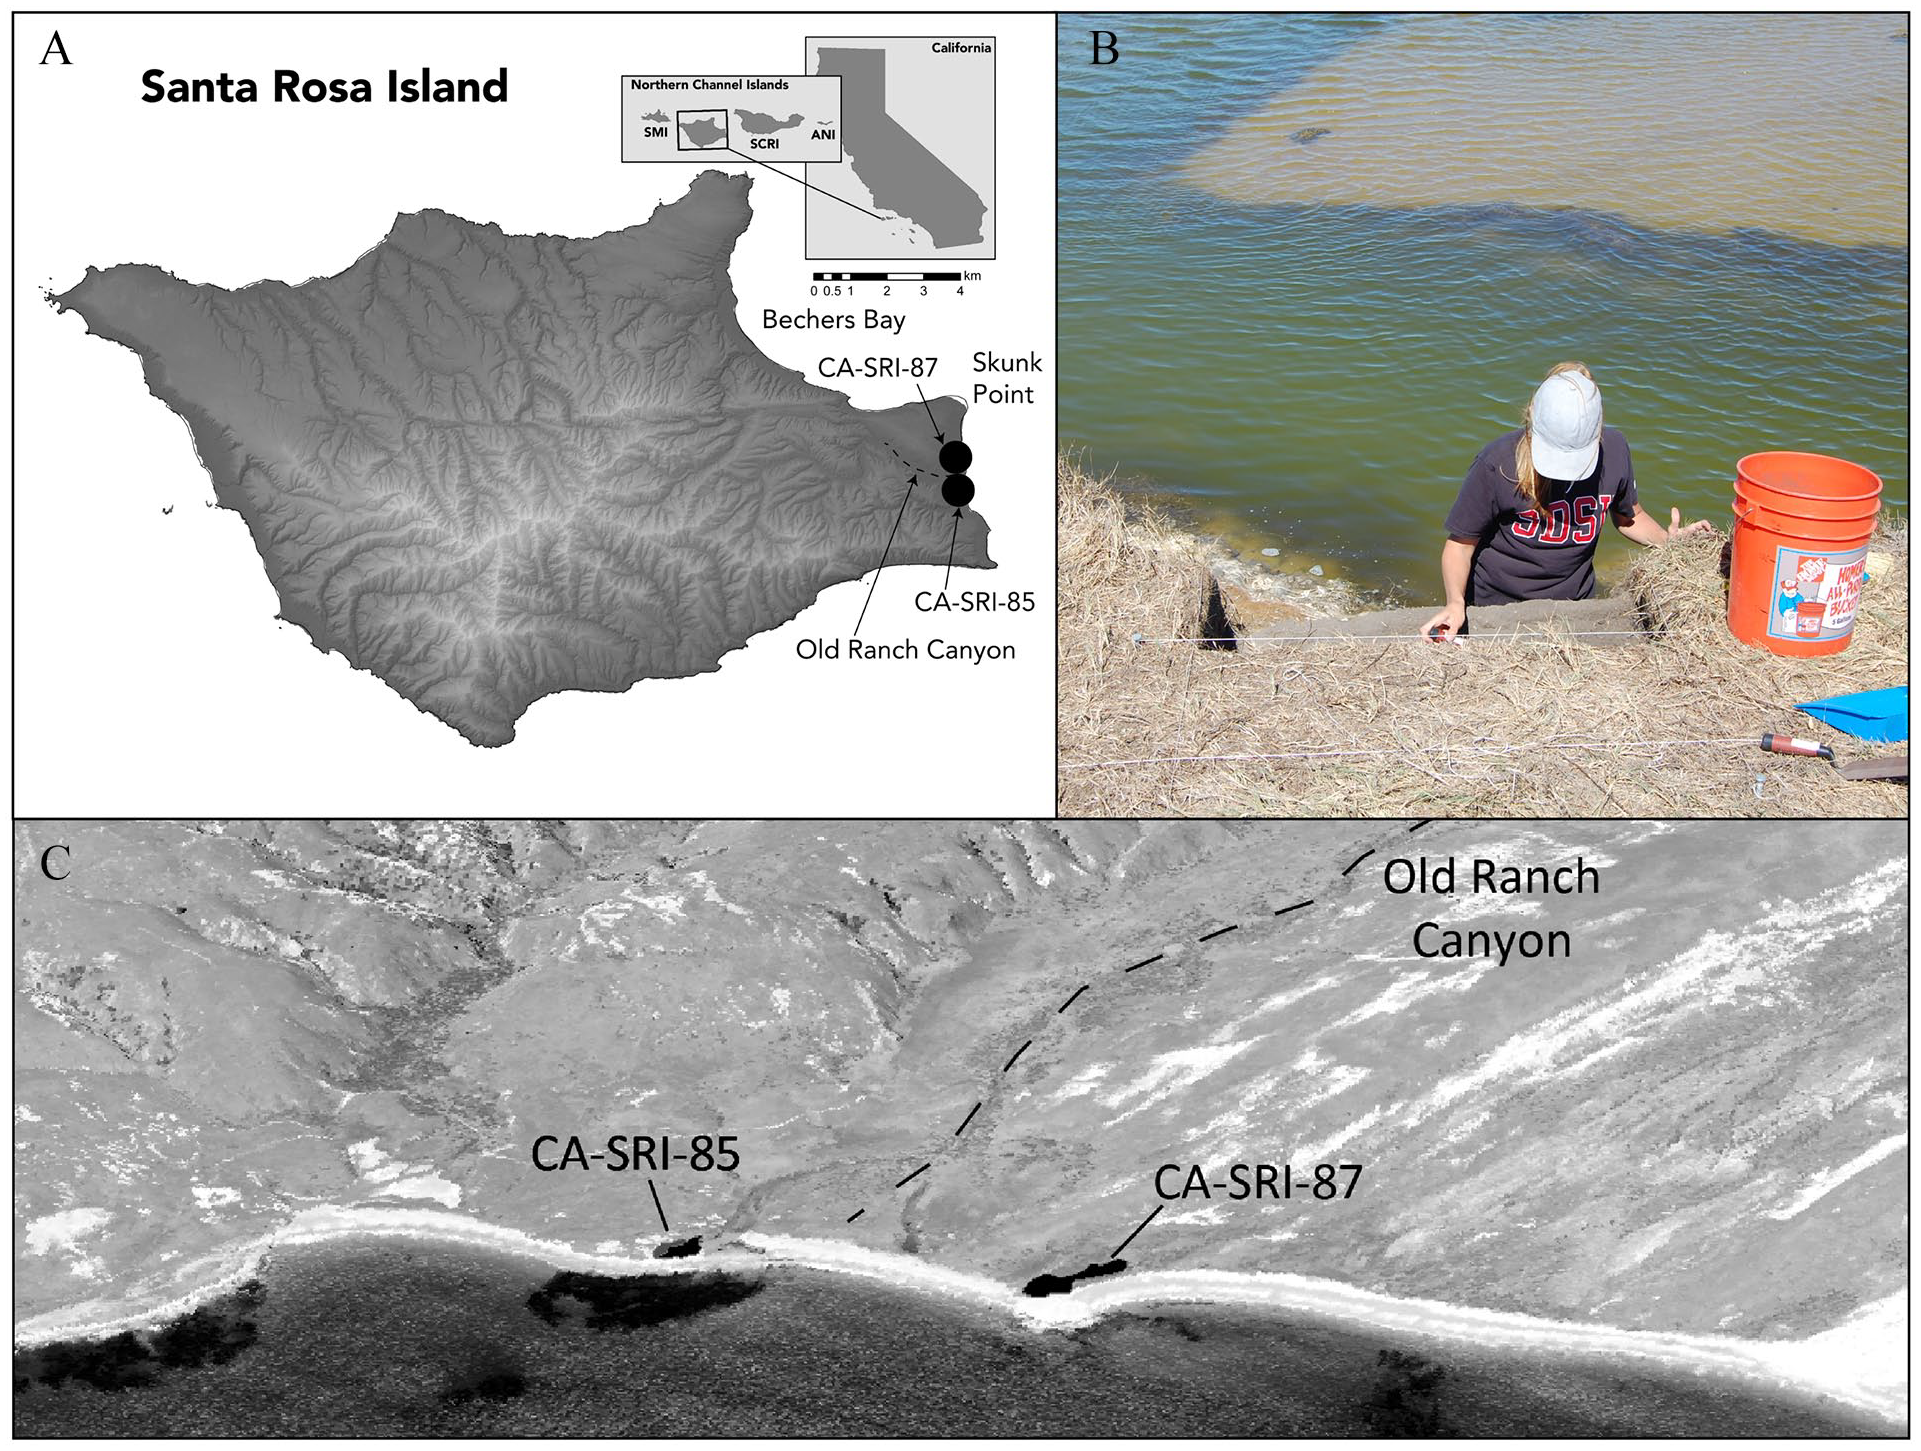
Sites CA-SRI-85 and -87 are the likely sites for the historical Chumash village, Qshiwqshiw. Panels (A and C) show the location of these sites on Santa Rosa Island relative to Skunk Point Marine Reserve and Old Ranch Canyon. Panel (B) shows the excavated unit.
Background and context
Santa Rosa Island is second largest of the Channel Islands at 217 km2 and located 44 km off the mainland Santa Barbara coast (Schoenherr et al., 1999). Santa Rosa, like the other Northern Channel Islands and Santa Barbara mainland coastline, supports a rich array of marine resources including intertidal and subtidal shellfish, nearshore kelp forest finfishes, pelagic finfishes, and a variety of marine mammals. This productive marine ecosystem, along with terrestrial resources such as island chaparral, oak and riparian woodland, Torrey pines (Pinus torreyana insularis), and geophytes, attracted the first island peoples at least 13,000 calendar years ago (Johnson et al., 2002). The number and size of archeological sites increased throughout the Holocene as island populations and population densities expanded (Rick et al., 2005).
During the past 1500 years, many of the Chumash cultural traits, described by Spanish explorers in AD 1542, took shape (Braje et al., 2021; Kennett, 2005; Rick et al., 2005). Large coastal villages were established around island perimeters, plank canoes (tomols) transported food stuffs, people, and trade items between the islands and mainland, shell money beads became standardized trade currency, and hereditary chiefs established socio-political authority (Arnold, 2001; Jazwa et al., 2019; Kennett, 2005). Of 22 or 23 northern Channel Island ethnohistoric villages, nine were located on Santa Rosa Island, one of which (Qshiwqshiw) was positioned on the far eastern end of the island near the mouth of Old Ranch Canyon. Old Ranch Canyon is the largest drainage on the island and runs in a northwest-southwest direction, with a marsh and large coastal plain at the canyon mouth, and a rich variety of nearby marine habitats (i.e. kelp forest, rocky shores, and sand beaches; see Braje et al., 2014; Cole and Liu, 1994).
Located near Old Ranch Canyon, CA-SRI-85 is positioned on a small terrace with deep midden deposits (50–150 cm) eroding from the coastal sea cliff and the drainage front. While not visible today due to shifting sands and dense grasses, Orr (1968) identified eight house depressions at this location. Directly to the north and separated by approximately 300 m of sandy beach, Orr recorded a dense shell midden at site CA-SRI-87 but no other features or artifacts. Survey, small scale excavation, and radiocarbon dating revealed that CA-SRI-85 likely served as an important Late Period village that was occupied into the Historic Period. Radiocarbon dating and the recovery of abundant glass beads indicate, however, that CA-SRI-87 may have been the epicenter of Historic Period occupation in the area.
For this paper, we recalibrated all of the radiocarbon dates from CA-SRI-85 with Oxcal 4.4 and the Marine20 calibration curve (Table 1). We applied a local Santa Barbara Channel reservoir correction of 128 ± 104 (Bronk Ramsey, 2009; Heaton et al., 2020). The reservoir correction was obtained from the 14Chrono database and is based on the Marine20 curve applied to three known-age samples from Ingram and Southon (1996) that were used to calculate an updated ΔR value for a previous value that was long used in the Santa Barbara Channel region (225 ± 35; Rick et al., 2022). Newly calibrated dates are consistent with those originally reported by Braje et al. (2014), although the new dates have a larger standard deviation because of the larger standard deviation of the updated reservoir correction. The dates for Unit 1 indicate a relatively narrow chronology for our samples, dating between cal AD 675 and 1415 (1 sigma), with no stratigraphic reversals.
Radiocarbon dates from CA-SRI-85 reported in Braje et al. (2014) a .
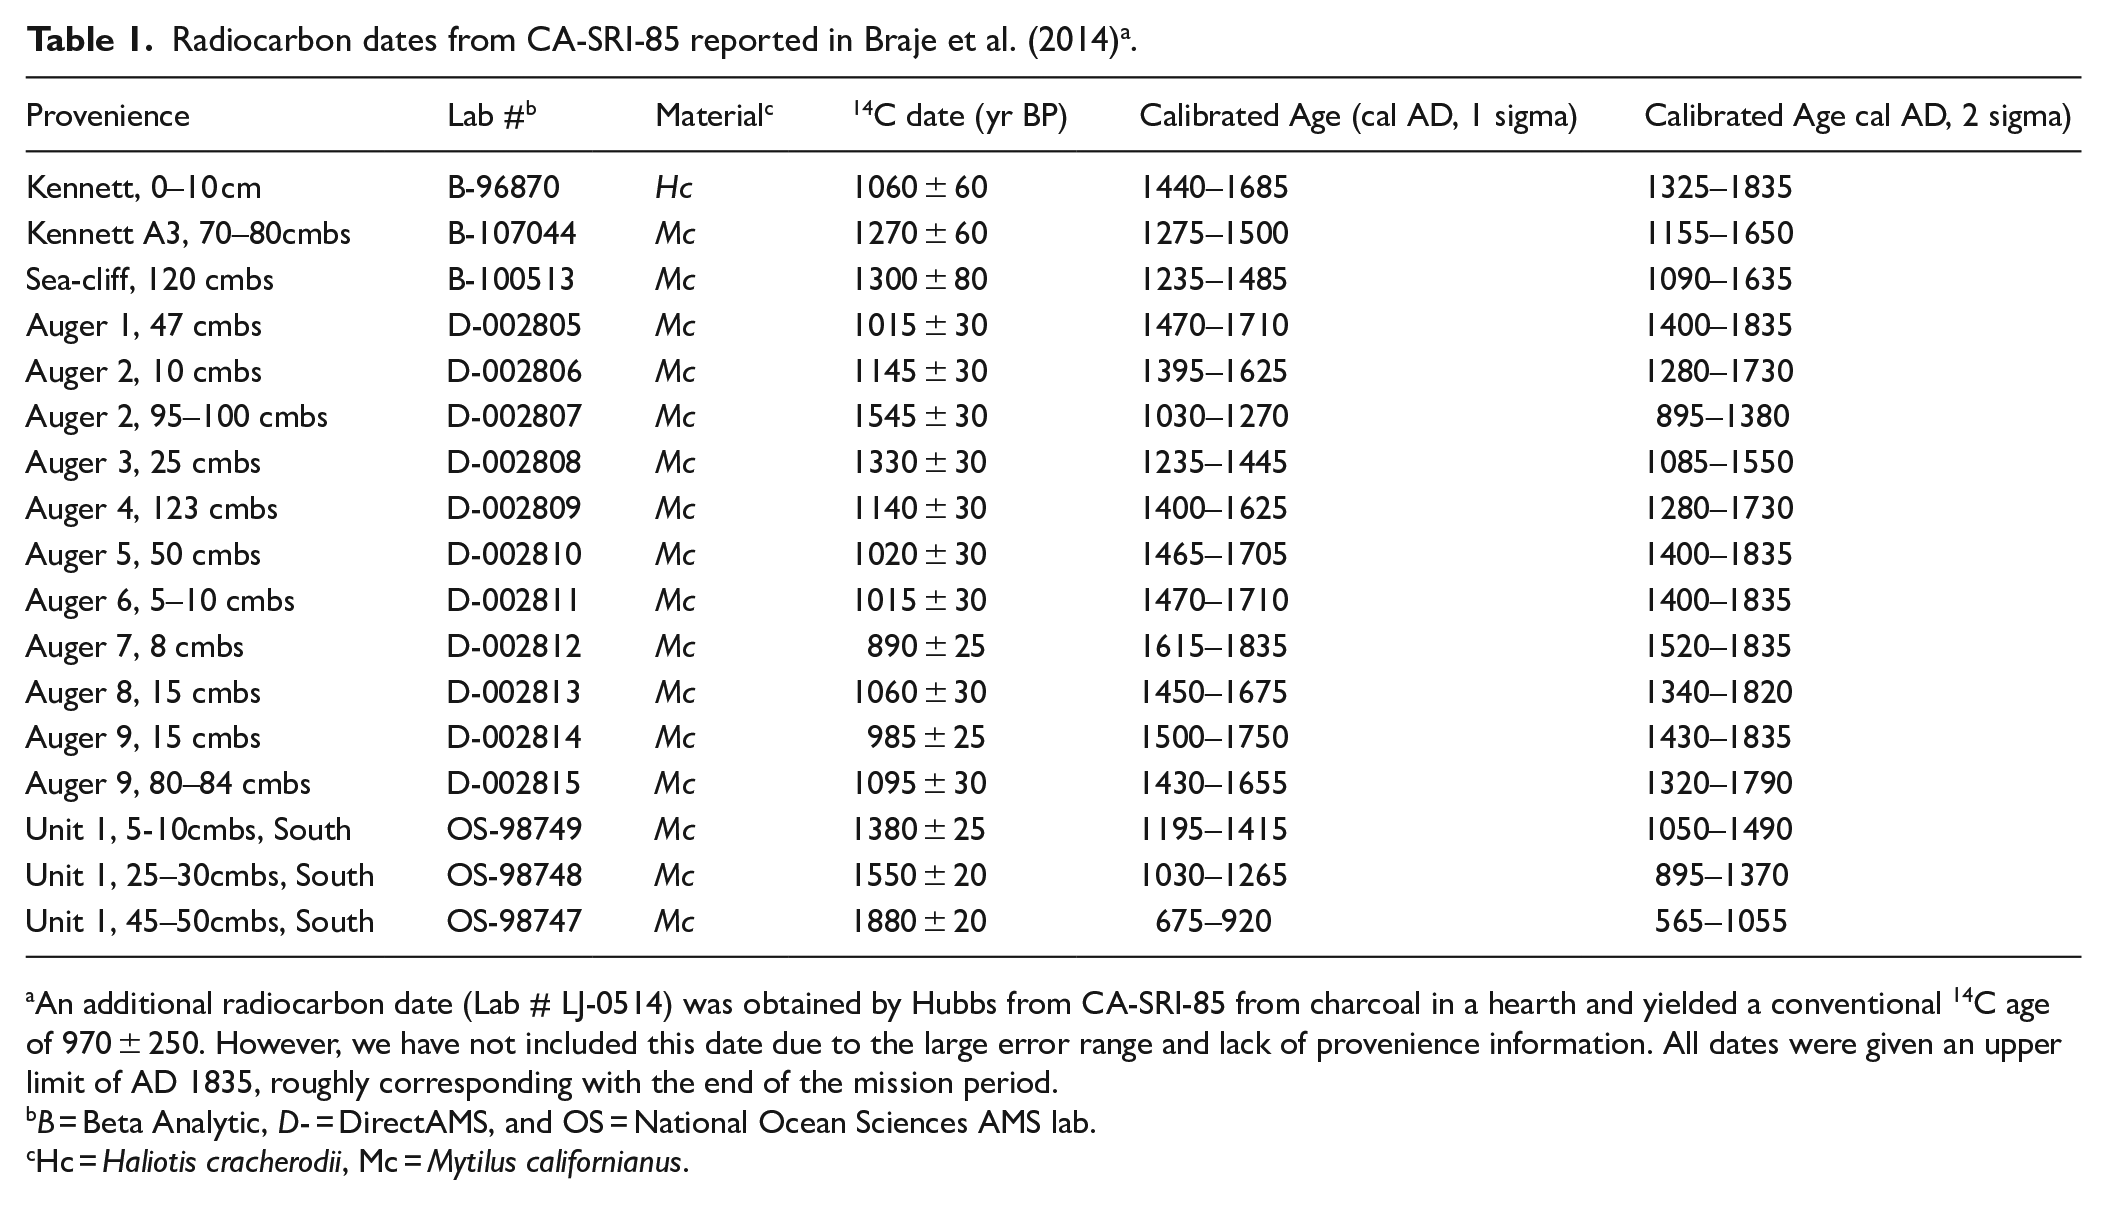
An additional radiocarbon date (Lab # LJ-0514) was obtained by Hubbs from CA-SRI-85 from charcoal in a hearth and yielded a conventional 14C age of 970 ± 250. However, we have not included this date due to the large error range and lack of provenience information. All dates were given an upper limit of AD 1835, roughly corresponding with the end of the mission period.
B = Beta Analytic, D- = DirectAMS, and OS = National Ocean Sciences AMS lab.
Hc = Haliotis cracherodii, Mc = Mytilus californianus.
Materials and methods
Zooarchaeological methods and faunal analysis
Working in cooperation with Chumash consultants Tawnee and Qun-Tan Shup to minimize impacts on site deposits, fieldwork at CA-SRI-85 was performed in 2012 and focused on mapping site features, determining the horizontal and vertical extent of archeological deposits, and obtaining samples for radiocarbon dating. Seventeen auger holes were excavated at CA-SRI-85 to determine site boundaries, to gauge the depth of site deposits, and to collect radiocarbon samples. A 1.0 × 0.5-m unit at an eroding sea cliff exposure at CA-SRI-85 was excavated in arbitrary 5 cm levels within natural stratigraphic levels (Figure 1B), with all residues screened over 1/16-inch mesh. The northern Channel Islands have a dearth of burrowing rodents and human development, leading to excellent preservation of archeological sites with little to no bioturbation and high chronological resolution in excavated deposits (Rick et al., 2005).
All faunal samples from this study were obtained from the 1.0 × 0.5-m Unit 1 and initially sorted and analyzed at San Diego State University’s Environmental Anthropology and Archaeology Laboratory (Braje et al., 2014). Fish remains from 1/8-inch and larger mesh were sorted from all other faunal remains. Due to the dense amount of fish remains in the collection, redundancy in species identified, and temporal overlap between strata, we analyzed six of nine 5 cm levels, including Levels 1 (0–5 cm), 2 (5–10 cm), 3 (10–15 cm), 5 (20–25 cm), 7 (30–35 cm), and 9 (40–45 cm). All fish bone from these levels were identified to the most specific taxonomic level possible by Gobalet using comparative collections from the Ichthyology Department of The California Academy of Sciences (San Francisco, California), along with photos of jaw elements from yellowtail jack (Seriola lalandi) and giant sea bass (Steriolepis gigas) provided by Thomas Wake of the UCLA Cotsen Institute of Archaeology. Prior to Gobalet’s analysis, Rick identified 25 fish bones from levels 4, 6, 7, and 8 that were used for additional stable isotope analysis. These identifications are consistent with Gobalet’s work and are presented in the isotope data but are separate from the quantified identifications of fish bone in Table 2.
Number of identified fish specimens (NISP) from CA-SRI-85.
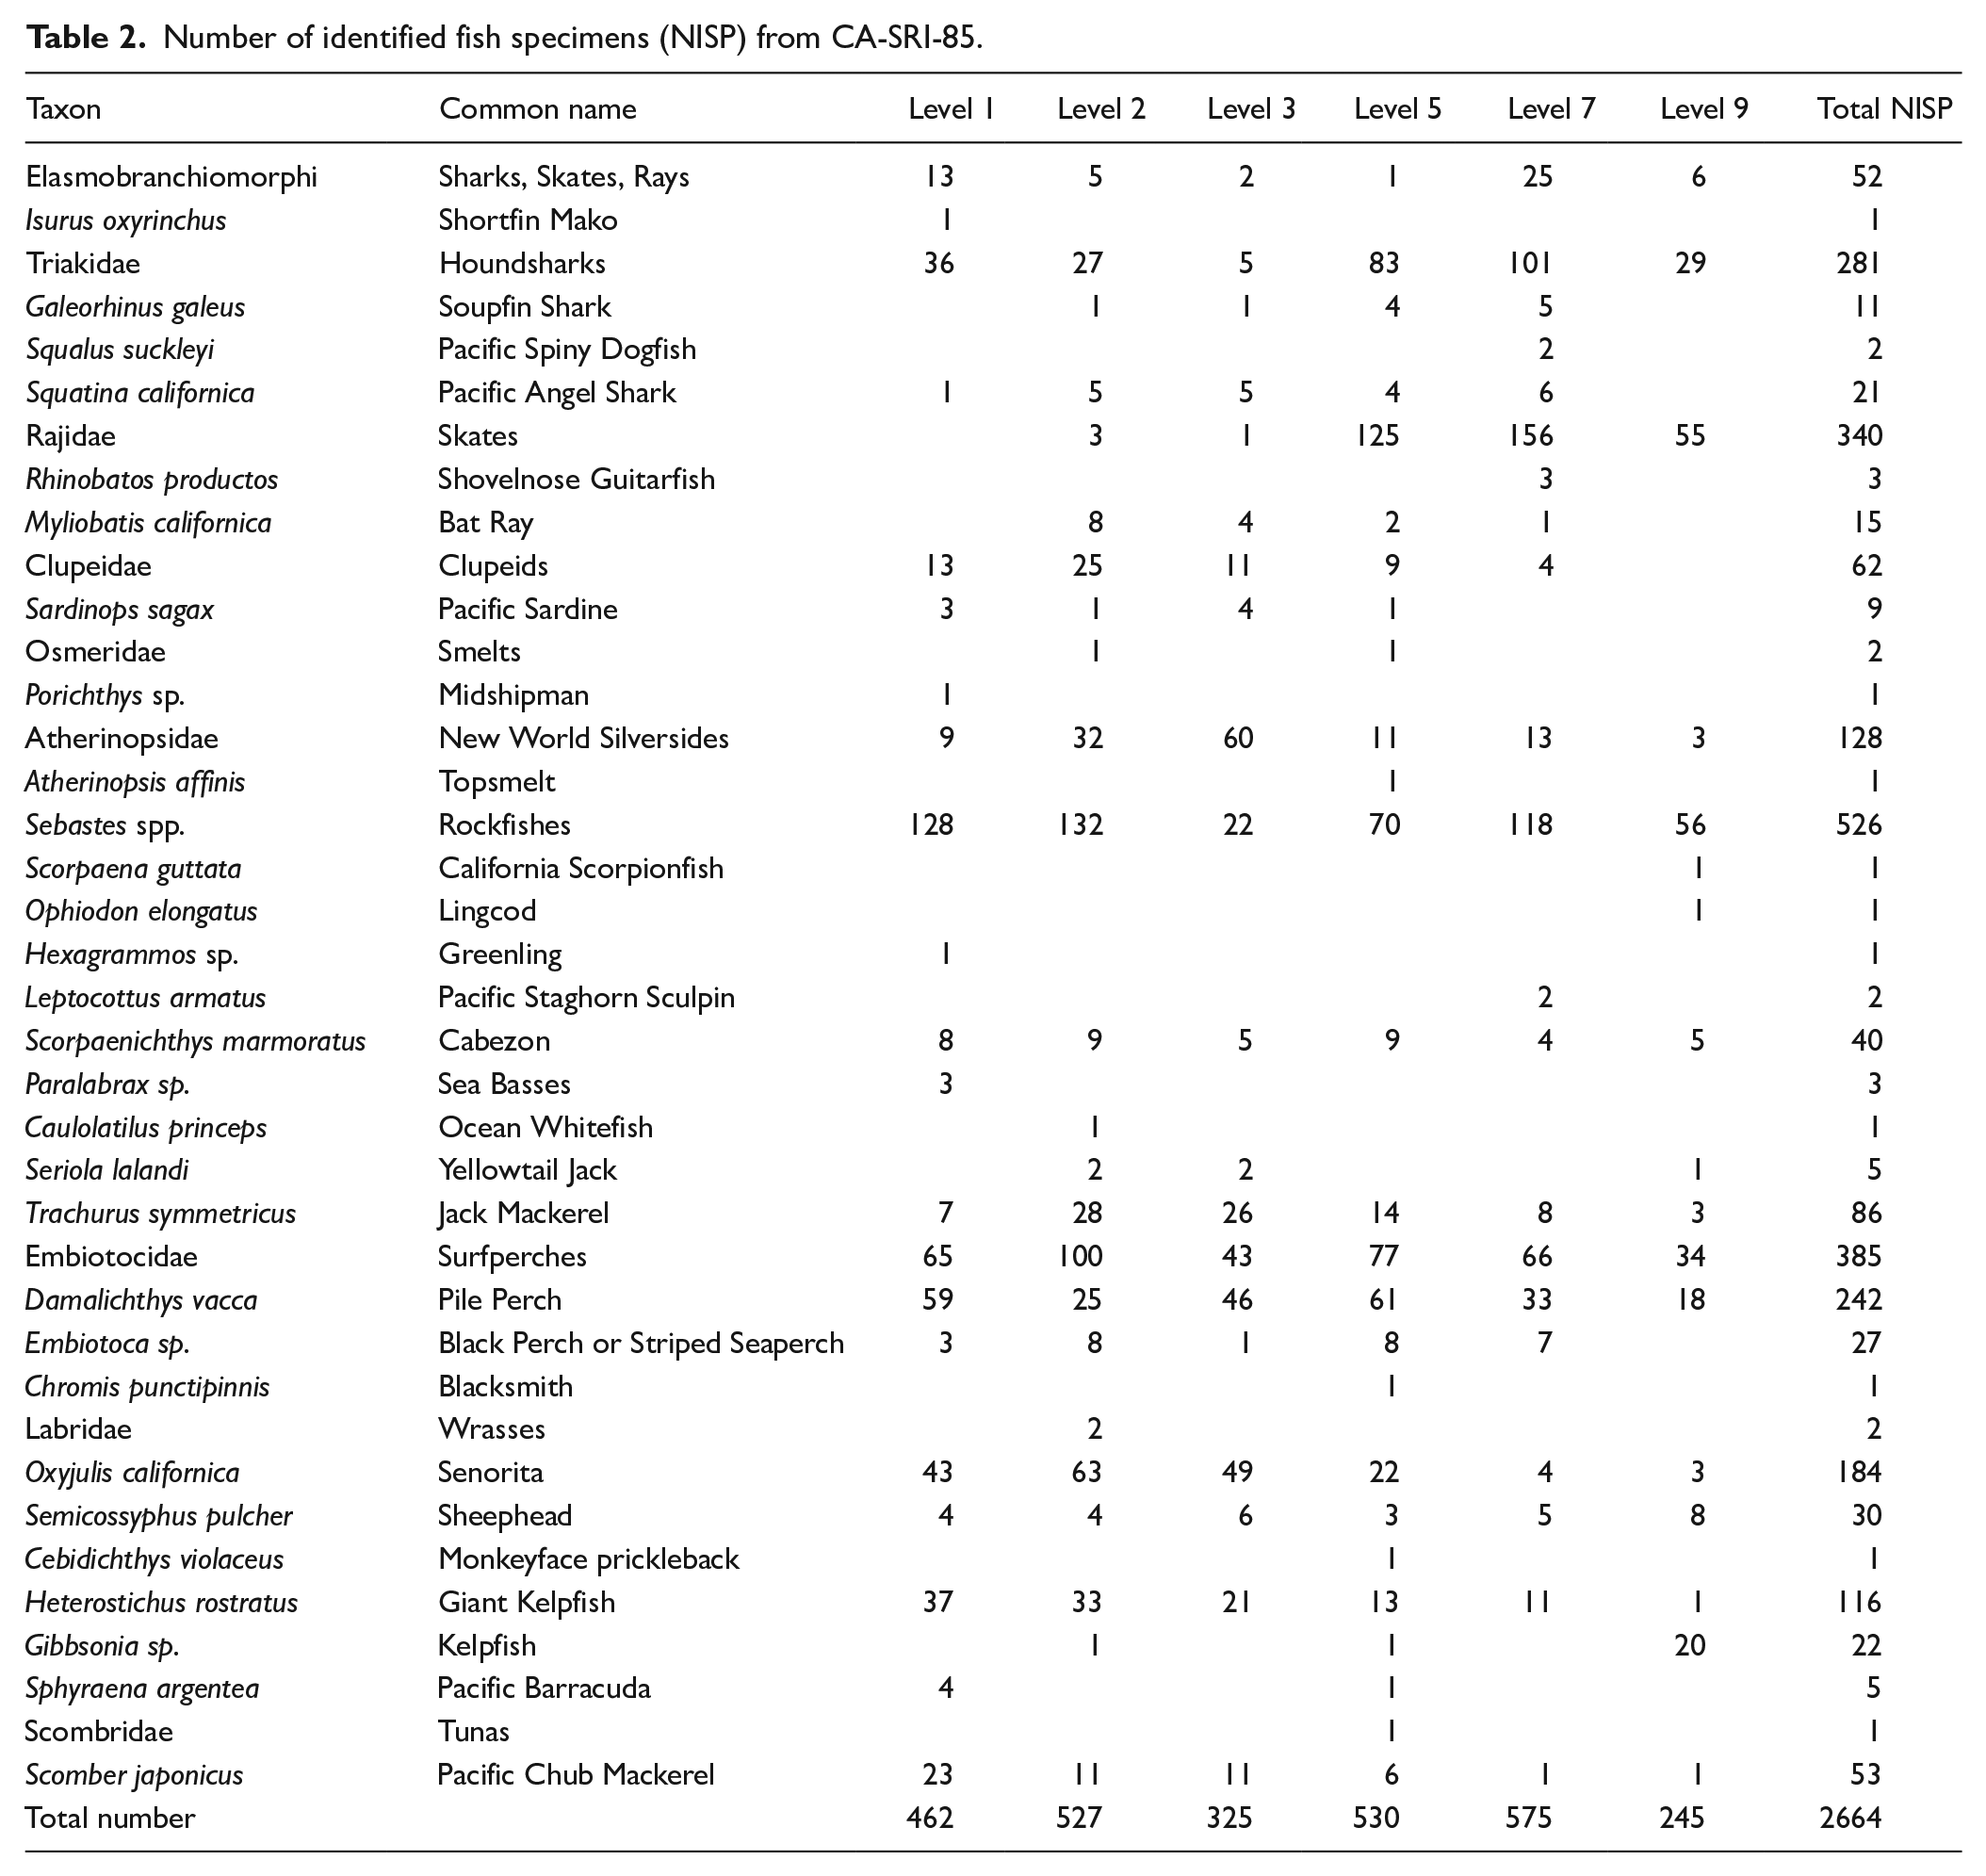
Following standard zooarchaeological procedures, we present the Number of Identified Specimens (NISP) for each identified fish species, genus, or family (Figure 2). Although well preserved, the assemblage is highly fragmented, and we did not count the thousands of non-diagnostic fish bones. These approaches are consistent with a wide range of analyses of fish bones in the Santa Barbara Channel area and broader California Coast (Turnbull et al., 2015). Fish bones tend to be well represented in smaller areas than larger mammals and birds that can be more widely distributed in sites. While any archeological approach does not yield all of the types of fish that were represented at a site, we believe our data are consistent for documenting the overarching patterns of fishing at the site.
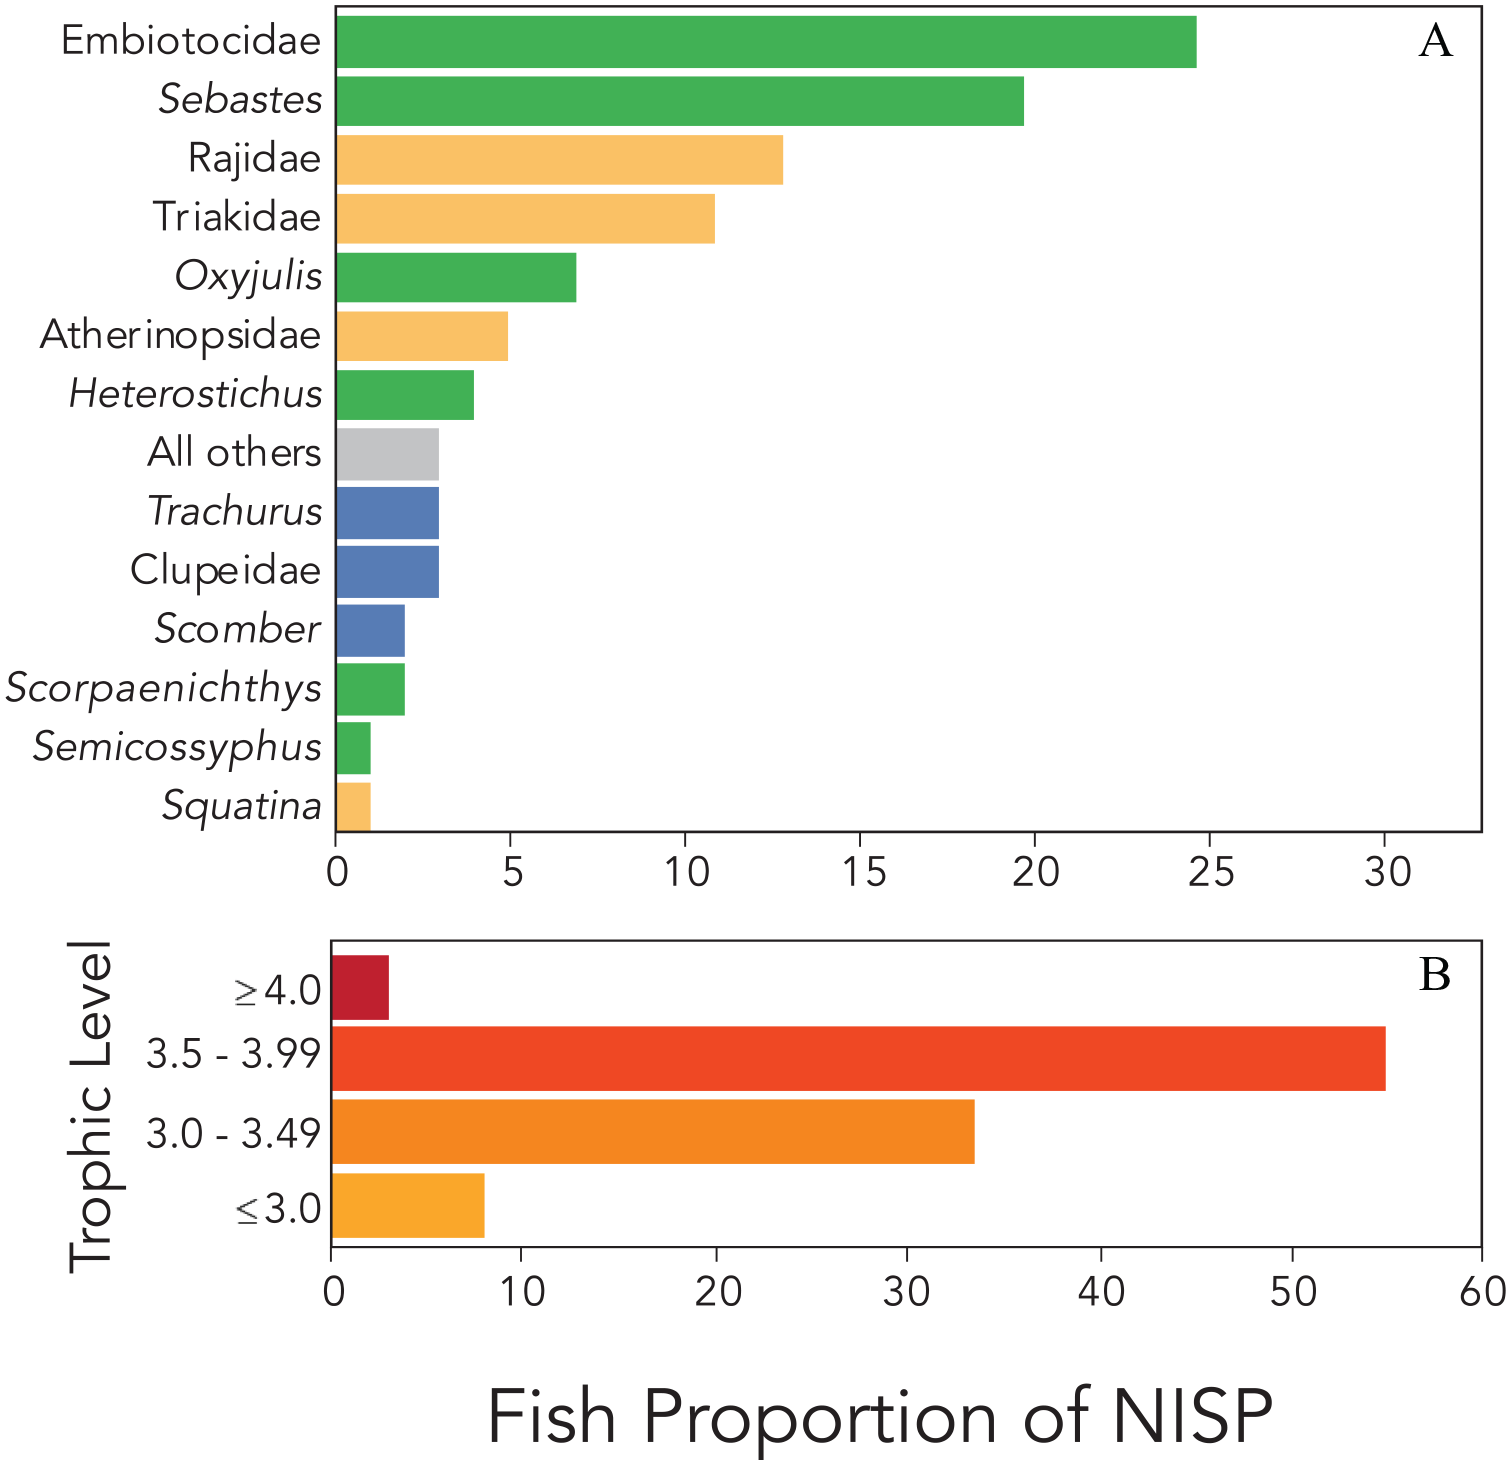
Relative abundances of taxonomic groups (A) and trophic levels (B) among CA-SRI-85 fish remains. Shown are the percentages relative to the total number of identified specimens (NISP). Species in panel A are colored by habitat groupings, with green for kelp forest associated species, tan for mixed/sandy substrate species, blue for pelagic species, and gray for “All others.” Panel B shows percent of identified specimens grouped by trophic levels derived from FishBase (Supplemental Table S1), with darker colors indicating higher trophic levels.
After identifying CA-SRI-85 fish remains, we compiled data on habitat preferences and modern trophic levels for all species. For habitat preferences we grouped species into one of three categories: (a) rocky substrate/kelp forest fauna, (b) sandy or mixed substrate fauna, and (c) pelagic fauna (Allen and Horn, 2006). We compiled data on the modern trophic levels for all species which represented ⩾1% of NISP, as well as two additional species of interest with low NISP – Seriola lalandi and Sphyraena argentea (Table 2 and Supplemental Table S1, available online). Trophic level data came from FishBase (Froese and Pauly, 2021). For families where we did not have identifications to species (Atherinopsidae, Embiotocidae, Rajidae, Triakidae), we computed the average trophic level for all species within that family with a distribution that overlapped our study site or was within ~200 km (Supplemental Table S1, available online). We only included trophic level estimates that came from direct dietary or prey studies for a given species; we did not include estimates based on studies from related groups.
Stable isotope analysis – bulk collagen and individual amino acid measurements
Stable isotope analysis is a well-established technique for evaluating the diet and ecology of modern and ancient consumers (Koch et al., 2017). This technique relies on (1) observed variation at the base of marine and terrestrial food webs in δ13C values, and (2) predictable changes in isotope values (δ13C and δ15N) of consumers associated with changes in trophic level (Koch et al., 2017). To characterize the historical ecology and food web patterns of CA-SRI-85 fish communities, we selected 83 bone samples for stable isotope analysis (Supplemental Table S2, available online), consisting mostly of vertebrae, fragmentary cranial elements, and loose teeth (e.g. for Squatina californica). Prior to isotopic analysis, bone samples were lightly brushed to remove external debris/sediment and then demineralized with 0.5 M hydrochloric acid for 18–72 h at 5°C. Acid was decanted to remove dissolved inorganic substrates from the remaining organic material. This process does not alter bulk tissue isotope values (Wilson and Szpak, 2022). Following demineralization, the remaining organic material for each sample – presumed to be dominated by bone collagen – was lyophilized, weighed out to 0.5–0.7 mg, and sealed in tin capsules for bulk tissue isotopic analysis. A subset of samples was lipid extracted in 2:1 chloroform:methanol (Folch et al., 1951) for 72 h following initial isotopic measurements (see below).
We report all isotopic results as δ values in parts per thousand, or per mil (‰), where δ13C or δ15N = 1000 × [(Rsamp/Rstd)
As a control for the quality of our collagen samples, we converted measured weight percent C:N ratios to atomic C:N values; the generally accepted range of atomic C:N for bone collagen is between 2.9 and 3.6 (DeNiro, 1985; Szpak, 2011). Following demineralization and isotopic analysis, 51 samples had atomic C:N ratios ⩽3.6 indicating well preserved organic material. To determine if the higher C:N ratios in the remaining samples were a result of lipid contamination, we lipid extracted (via sequential 2:1 choloform:methanol baths for 72 h (Folch et al., 1951)) and re-analyzed those which had remaining material (n = 28). After lipid extraction, 20 additional samples had atomic C:N ratios ⩽3.6 (Supplemental Table S2, available online) indicating lipids had been removed and samples were well preserved. Four lipid-extracted samples, and one non-lipid extracted sample without remaining material, had atomic C:N ratios between 3.65 and 3.73. We include these samples in our final dataset (Supplemental Table S2, available online), and thus report isotopic data for 76 CA-SRI-85 fish specimens.
We selected a subset (n = 43 from 16 taxonomic groupings: Supplemental Table S3, available online) of our extracted collagen samples for individual amino acid δ13C analysis. We relied on a combination of specimen stratigraphy and bulk collagen isotopic values to avoid resampling individuals for these analyses. Traditionally, this is done by ensuring only a single, discrete element (e.g. right mandible) is sampled. Unfortunately, many of the specimens from CA-SRI-85 were fragmentary, or the identifiable remains were skeletal elements that could not be reliably ascribed to different individuals (e.g. vertebrae, teeth). We considered samples to be potentially from the same individual if they came from the same, or adjacent levels, and the bulk tissue isotope values were within 1.0–1.5‰ for both δ13C and δ15N (Clark et al., 2017; Hyland et al., 2022). We were not able to pair bulk collagen and amino acid isotopic data for Clupeidae, as the individual vertebrae available for analysis contained <1 mg of collagen and were too small to reliably conduct both analyses. We used different clupeid vertebrae from the same stratigraphic levels for bulk δ13C and δ15N versus amino acid δ13C analysis.
We followed the established protocol by Silfer et al. (1991) to derivatize samples to N-trifluoroacetic acid isopropyl esters and measure amino acid isotopic compositions via gas chromatography. Briefly, samples (~1–5 mg) were hydrolyzed in 1 mL of 6 M hydrochloric acid and swept with N2 gas to prevent oxidation before being sealed and placed in a 110°C oven for 20 h. Hydrolysates were subsequently dried under N2, esterified in 1 mL of 4:1 isopropanol:acetyl chloride (110°C, 1 h), dried again under N2 with two rinse cycles using dichloromethane (DCM), and then acetylated in 1 mL of 1:1 trifluoracetic anhydride:DCM (110°C, 10 min). We derivatized samples in three batches (n = 10–17) along with an in-house reference material of known isotopic composition containing amino acids of interest (Supplemental Table S4, available online). The reagents used during derivatization add carbon to the side chains of amino acids, and δ13C values measured via GC-C-IRMS are thus a combination of intrinsic amino acid carbon and reagent carbon. However, because amino acid reference materials of known δ13C composition are derivatized and analyzed with each batch of samples, we were able to correct for this carbon addition; see Supplemental Text SI for details.
We measured δ13C values of derivatized amino acids via a gas chromatography-combustion system coupled to an isotope-ratio mass spectrometer (GC-C-IRMS) at UNM-CSI. Derivatized samples and in-house amino acid reference mixtures were dried down under a gentle stream of N2 gas and rinsed twice with DCM before being brought up to final dilution in DCM. Sample DCM solutions were injected (1 μL) into a 60 m BPx5 gas chromatograph column (0.32 ID, 1.0 μm film thickness, SGE Analytical Science, Victoria, Australia) for amino acid separation in a Thermo Scientific Trace 1310, and then combusted into CO2 gas via a coupled Thermo Scientific Isolink II. Isotopic ratios were analyzed with a Thermo Scientific Delta V IRMS. Samples were run in duplicate and bracketed with the in-house reference material; we report sample means across injections, and we discarded data where δ13C values varied among injections by >1.8‰. The intra-sample range in δ13C values across injections averaged 0.2 (glycine) to 0.5 (lysine). We measured δ13C values of 12 amino acids, six of which are considered essential – isoleucine (Ile), leucine (Leu), lysine (Lys), phenylalanine (Phe), threonine (Thr) and valine (Val), and six nonessential – alanine (Ala), aspartic acid/asparagine (Asx), glutamic acid/glutamine (Glx), glycine (Gly), proline (Pro), and serine (Ser). However, we report and use only essential amino acid δ13C data as nonessential data are not typically used in isotopic fingerprinting studies (Elliott Smith et al., 2018, 2021, 2022; Larsen et al., 2013). For one pile perch sample (CA-SRI85-DAVA-L9-2) we were not able to obtain reliable lysine δ13C values due to low peak amplitude (Supplemental Table S3, available online).
Statistical analysis
All statistical analyses were performed in Program R (v4.0.3; (R Core Team, 2021)) with RStudio interface (v1.1.463). To characterize the basal energetic sources supporting the CA-SRI-85 fish community, we employed essential amino acid δ13C “fingerprinting,” via linear discriminant analysis (Larsen et al., 2009, 2013). This statistical technique is well validated in coastal marine ecosystems of the Pacific (Elliott Smith, 2019; Elliott Smith et al., 2018, 2022; Fox et al., 2019; Larsen et al., 2013; Rowe et al., 2019). We compared essential amino acid δ13C values of CA-SRI-85 fish to published data (Elliott Smith et al., 2018, 2021, 2022) from marine primary producers collected from coastal Pacific ecosystems. This dataset includes green algae (n = 23), kelps (n = 56), understory or intertidal red algae (n = 24), particulate organic material (n = 23), and cultured phytoplankton (n = 6). These data include important primary producer endmembers within Channel Islands kelp forest communities (Graham, 2004). No intra-laboratory calibrations are needed as the primary producer isotopic data was generated on the same instrument in UNM-CSI using the same derivatization method as we describe here for CA-SRI-85 fish. Per standard protocols, algae samples were run through a Dowex column following hydrolysis to isolate amino acids from other producer metabolites. Additional details on the collection and analysis of these samples are in Elliott Smith et al. (2018, 2021, 2022).
To characterize primary producer essential amino acid δ13C fingerprints and compare them to those in fish from CA-SRI-85, we used a bootstrap resampling approach to linear discriminant analysis, following methods developed in previous studies (Fox et al., 2019). We first examined the classification error rate for the four producer groups – kelps, green algae, red algae, and particulate organic matter/phytoplankton (hereafter simply “phytoplankton”) – using a leave-one-out, cross-validation procedure to establish if our sources were statistically distinct. We then used this training data set to predict group membership for each consumer sample. Prior to bootstrapping, we conducted both the cross-validation procedure and consumer classification with and without lysine δ13C values, as these data were unavailable for one pile perch specimen (Supplemental Table S3, available online). The exclusion of lysine did not change the overall successful reclassification rate of producer samples (~82% in both cases, Supplemental Table S5, available online) and only a single consumer sample changed classification (CA-SRI85-SEPU-2-B1). We thus ran the bootstrapping analysis without lysine, and used δ13C data for isoleucine, leucine, threonine, valine, and phenylalanine to maximize our sample size. We ran 10,000 iterations of the LDA model to evaluate the sensitivity of consumer classification. For each iteration, we randomly selected, with replacement, 15 (red algae) to 30 (phytoplankton + Ulva sp.) producer samples and predicted group membership for CA-SRI-85 fish using this bootstrapped training dataset. We calculated the mean posterior probabilities of classification across all bootstrapped iterations and associated variance for each fish sample (Supplemental Table S6, available online) pooling, post hoc, the probabilities of classification with Ulva and phytoplankton for each iteration. The isotopic overlap between these two sources has been well documented in this system (Elliott Smith et al., 2018, 2021, 2022) and given the minimal contribution of Chlorophytes to regional subtidal NPP (Graham, 2004; Harrer et al., 2013), we assume fish specimens are more likely deriving their energy from phytoplankton. We classified fish specimens according to the highest mean posterior probabilities across all iterations (Supplemental Table S6, available online).
Results
Finfish remains from CA-SRI-85
Consistent with reconstructions from other late Holocene Chumash villages, fish likely dominated the protein portion of human diet at CA-SRI-85, which was supplemented by a broad subsistence base that included marine mammals, shellfish, sea birds, and plant foods (Braje et al., 2014; Kennett, 2005). Analysis and identification of archeological animal bones yielded 908.3 g and 2664 identifiable fish remains from 29 genera and 9 broader taxonomic groups (e.g. Triakidae; Table 2). The most abundant remains were of surfperches (Embiotocidae), particularly pile perch (Damalichthys vacca), followed by rockfishes (Sebastes spp.), skates (Rajidae), and houndsharks (Triakidae), representing respectively 25%, 20%, 13%, and 11% of the total Number of Identified Specimens (NISP; Figure 2). Grouping specimens by presumed ecological role (Allen and Horn, 2006; Froese and Pauly, 2021) revealed that people at CA-SRI-85 heavily fished kelp forest fauna from trophic levels 3.0 to 3.9 (59% of NISP). Only 8% and 3% of identified specimens came from species with trophic levels lower than 3.0 or higher than 4.0, respectively (Figure 2, Table 2, Supplemental Table S1, available online). In contrast, the range of trophic levels reported within FishBase for modern day California Current Large Marine Ecosystem is 2.0 (Pacific fat sleeper, Dormitator latifrons) to 4.9 (smooth hammerhead, Sphyrna zygaena).
Bulk tissue δ13C and δ15N values of CA-SRI-85 fish
Isotopic analysis allowed us to characterize food web structure and infer ecological interactions among species from CA-SRI-85 (Koch et al., 2017). We obtained reliable bulk tissue isotope data for 76 specimens (Supplemental Table S2, available online). Bulk tissue isotope values varied among species, habitat, and trophic level (Figures 3 and 4; Supplemental Table S2, available online). Specimens of pelagic species (Figure 3A) showed the narrowest range of δ13C values, from −16.1‰ to −13.3‰, but the widest range of δ15N values, from 11.9‰ (Sardinops sagax) to 18.4‰ (Sphyraena argentea). Isotope values of mixed habitat species (Figure 3B) were intermediate relative to kelp forest and pelagic fish, with δ13C values from −14.2‰ (Elasmobranch) to −10.6‰ (Batoidea), and δ15N values from 13.5‰ (Batoidea) to 17.3‰ (Triakidae). Kelp forest consumers (Figure 3C) showed the widest range of δ13C values, from −16.7‰ (Oxyjulis californica) to −9.7‰ (Damalichthys vacca), while δ15N values ranged from 12.1‰ (Oxyjulis californica) to 17.6‰ (Sebastes spp.). Mean bulk bone collagen δ15N values were strongly correlated with modern trophic level estimates for each taxon provided from FishBase (Figure 4; F(1,13) = 99.15, p < 0.001, R2 = 0.88), suggesting that trophic relationships among these species have not changed significantly over the late Holocene.
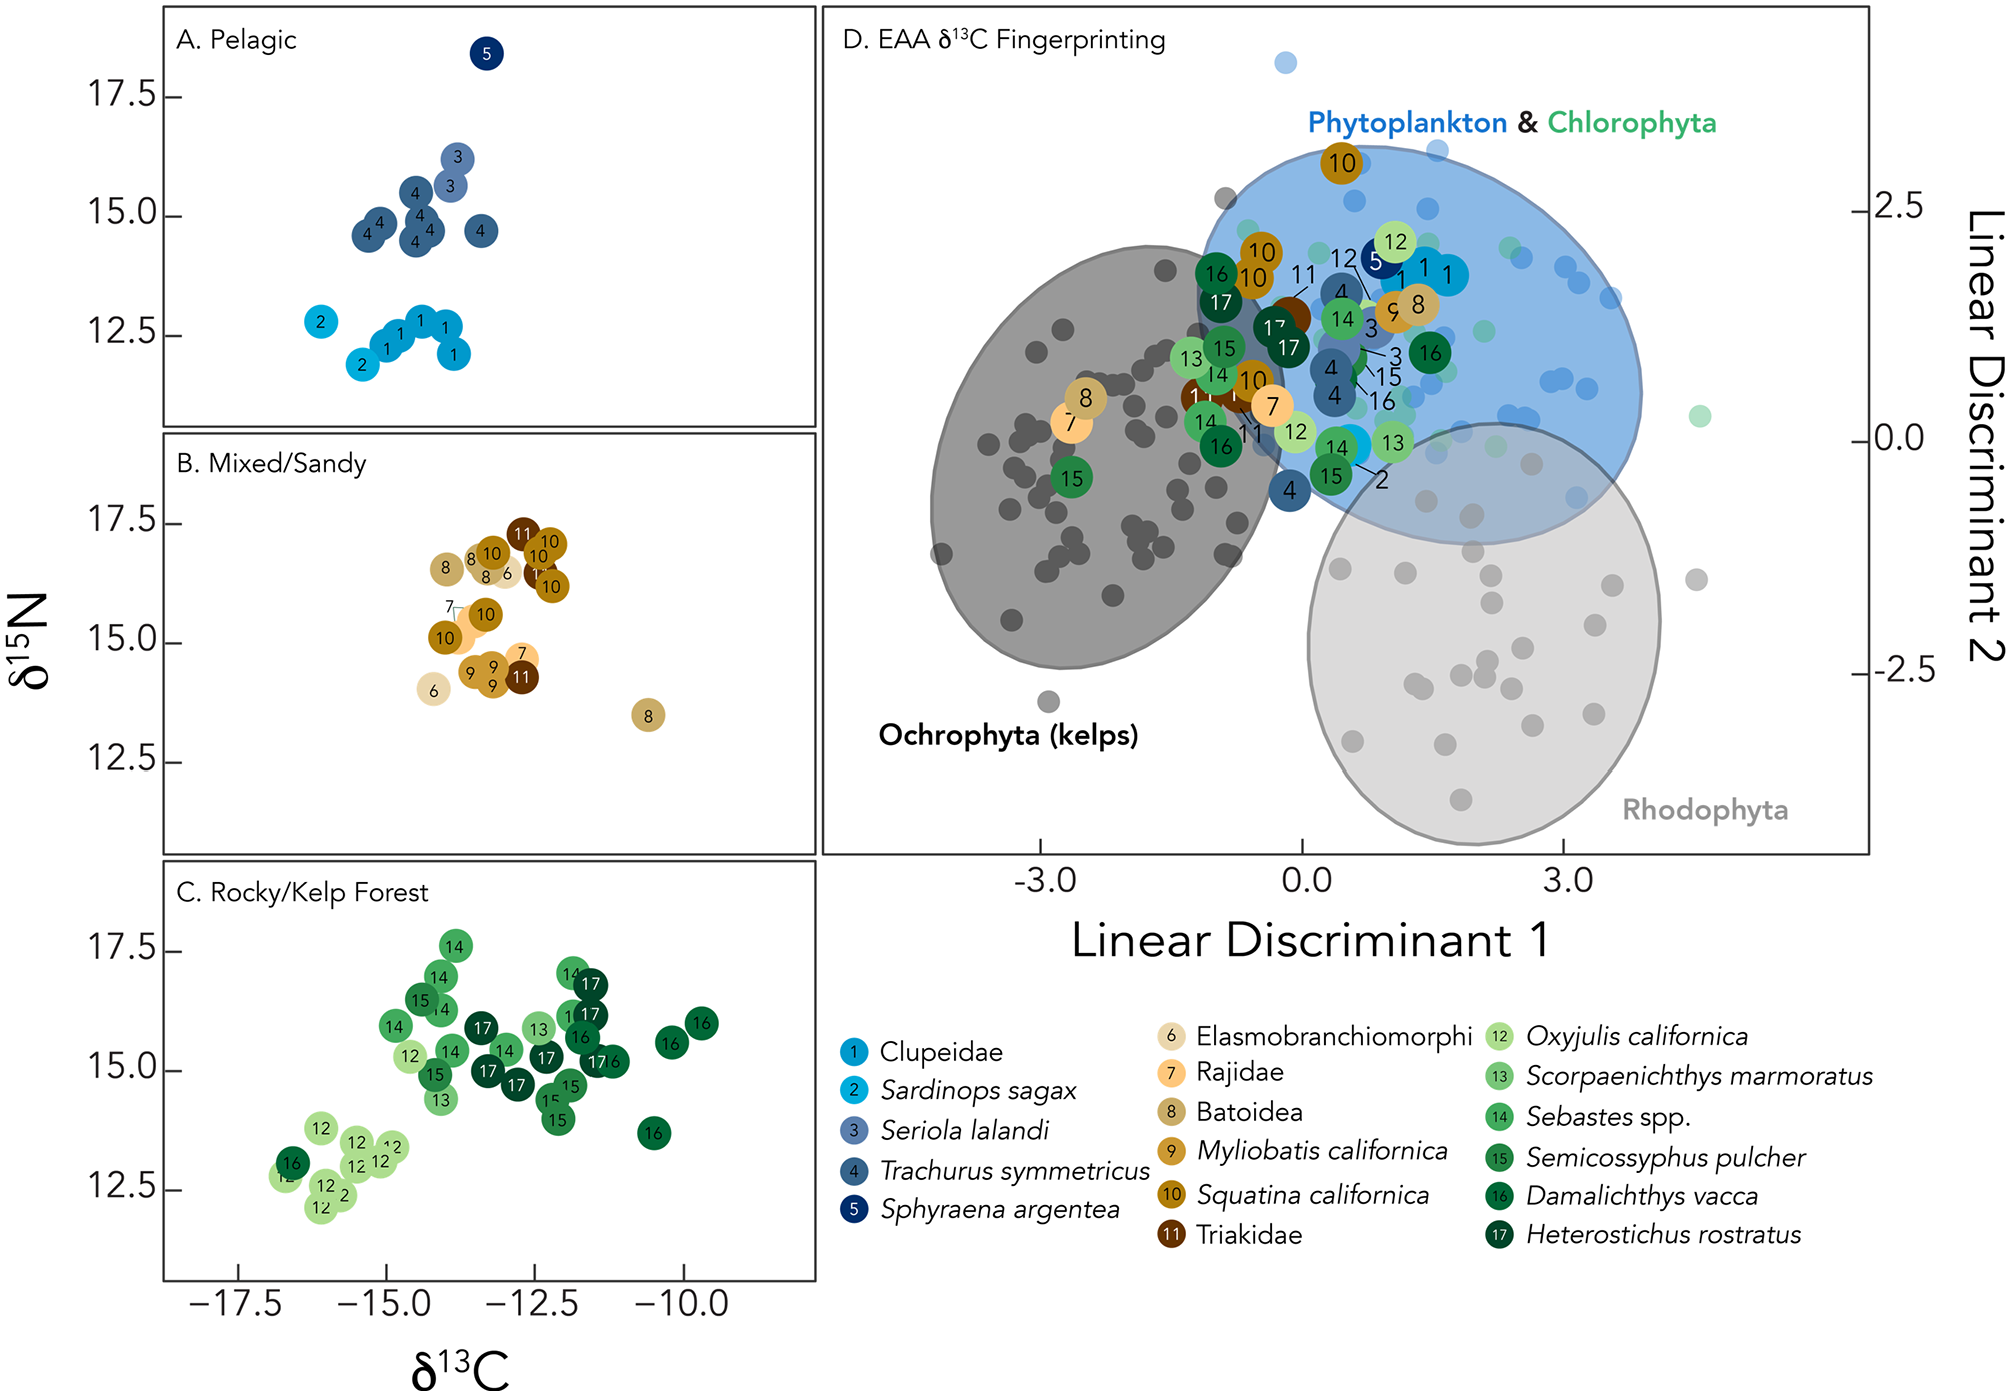
Bulk tissue δ13C and δ15N values of CA-SRI-85 fish specimens and essential amino acid (EAA) δ13C fingerprinting. All isotope values are presented in delta (δ) notation, with conventional units of parts per thousand, or per mil (‰). Circles represent isotope values of fish specimens; numbers and colors differentiate among species. We note that some samples with similar isotope values (i.e. within 1–1.5‰) may represent the same individual (Hyland et al., 2022). Lefthand panels show bulk bone collagen isotope values and separates fish species according to presumed habitat preference: (A) pelagic, (B) mixed sandy/rocky substrate, (C) rocky substrate/kelp forest. Top right panel (D) shows habitat use of CA-SRI-85 fish based on EAA δ13C fingerprinting via linear discriminant analysis. For this analysis, EAA δ13C data from fish specimens were compared to an isotopic library of coastal Pacific marine primary producers (Elliott Smith et al., 2018, 2021, 2022). Primary producer data are shown in small circles with ellipses representing 90% confidence interval for each group, with Chlorophyta and phytoplankton plotted together. The first two linear discriminant axes accounted for >90% of the variation in the primary producer dataset and separated algal groups, apart from Chlorophyta and phytoplankton which overlap. Large circles represent linear discriminant loadings for CA-SRI-85 fish; where a specimen plots in this space reflects the dominant local primary producer from which that individual derived essential amino acids.
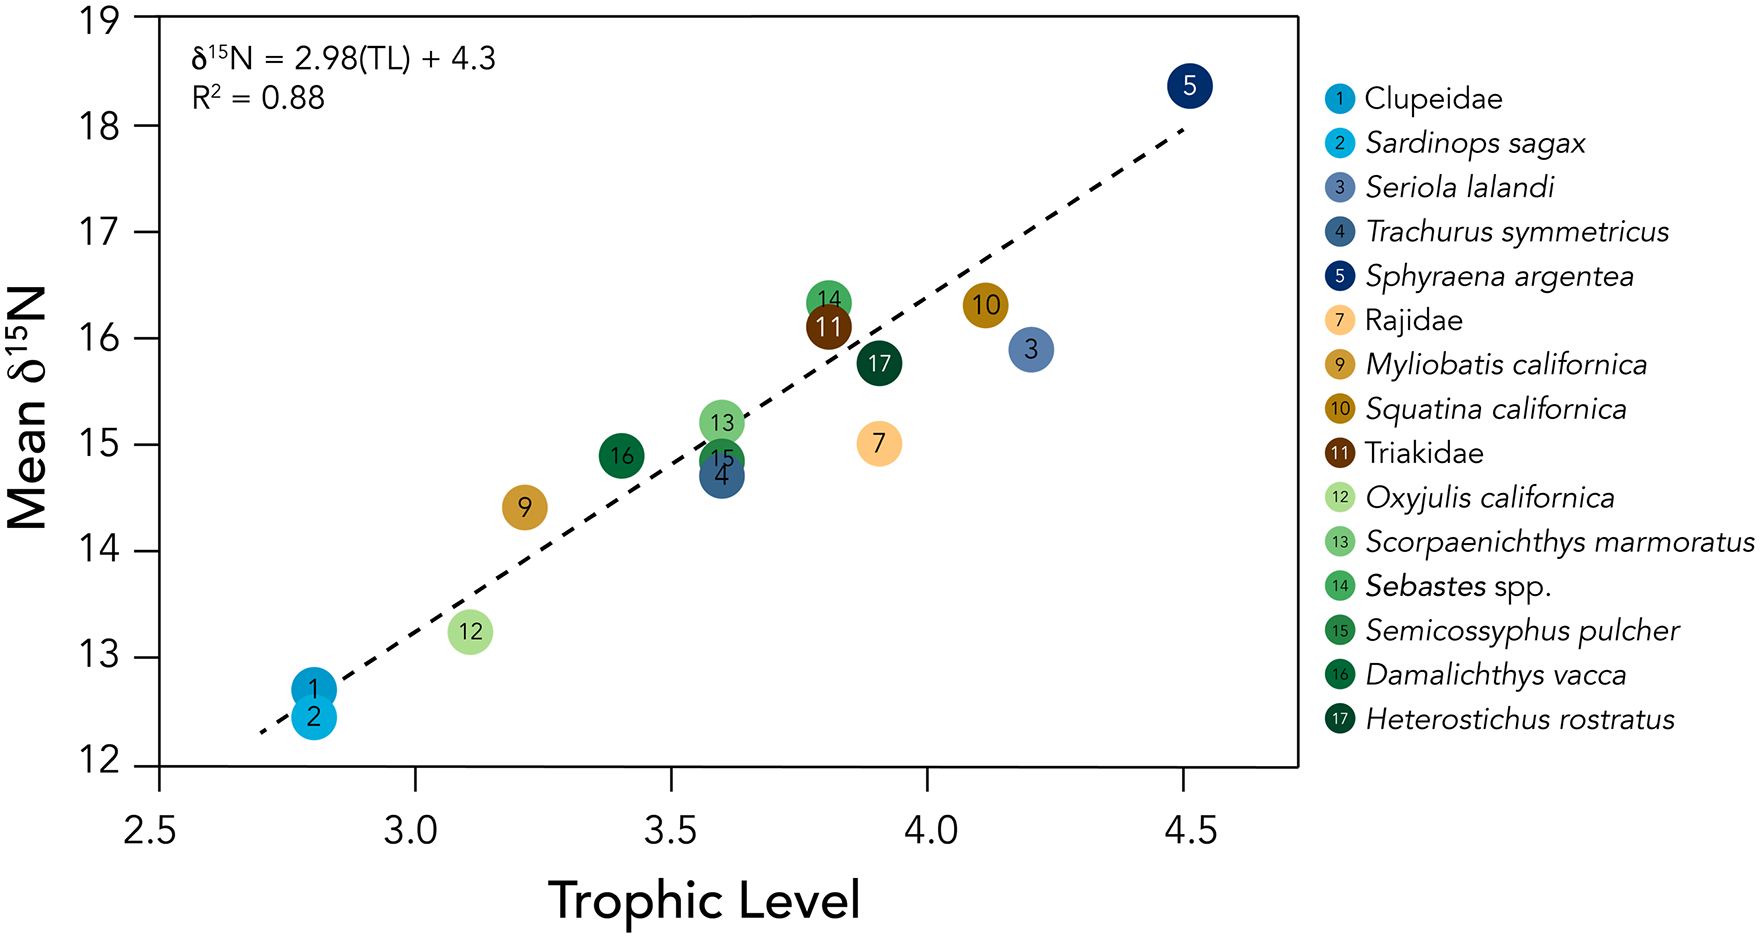
Trophic levels and mean bulk bone collagen δ15N values of CA-SRI-85 fish. Trophic levels are from FishBase. Isotope values are presented in delta (δ) notation, with conventional units of parts per thousand, or per mil (‰). We included only estimates of trophic level that came from direct dietary studies of a given species rather than studies from related groups. For higher taxonomic groups like genus (e.g. Sebastes) and family (e.g. Rajidae), we computed the average trophic level for all species within that group with a distribution that overlapped our study site or was within ~200 km (Supplemental Table S1, available online). For this figure, we excluded two groups for which the taxonomic resolution was too broad to reasonably include (e.g. elasmobranch). The linear model shown by the dashed line indicates a high correlation between FishBase trophic levels and mean δ15N values of the listed species (F(1,13) = 99.15, p < 0.001, R2 = 0.88).
CA-SRI-85 food web structure – essential amino acid δ13C fingerprinting
To assess the habitats and energetic pathways supporting historical Santa Rosa fish communities, and thus the people of CA-SRI-85, we used an essential amino acid δ13C “fingerprinting” approach (Larsen et al., 2013). We compared essential amino acid (EAA) δ13C values obtained from fish specimens (Figure 3D; Supplemental Table S3, available online) to a published dataset of nearshore Pacific autotrophs (Elliott Smith et al., 2022) using a bootstrap resampling multivariate “fingerprinting” approach (Fox et al., 2019). Initial cross validation with the full primary producer dataset (Supplemental Table S5, available online) showed good separation, with an overall 82% successful reclassification rate among algae endmembers: Ochrophyta, Chlorophyta, Rhodophyta, and phytoplankton (Elliott Smith et al., 2022). The error in reclassification was driven predominantly by overlap between Chlorophytes (Ulva sp.) and phytoplankton, whereas kelps and red algae had much higher successful reclassification rates from 88% to 96% (Supplemental Table S5, available online; Elliott Smith et al., 2018, 2021, 2022). Comparison with CA-SRI-85 samples indicated that the historical Santa Rosa fish community was reliant on a combination of pelagic energy (i.e. from phytoplankton), and benthic energy from kelps (Figure 5, Supplemental Table S6, available online). Nine fish specimens from seven taxonomic groups classified with kelps, and 27 classified with pelagic energy sources. Seven specimens exhibited variable classifications across bootstrapped iterations (Figure 5, Supplemental Table S6, available online). We did not find evidence of significant energetic contributions from Rhodophytes (<15% probability of classification; Supplemental Table S6, available online). The average posterior probabilities of classification with kelps (across bootstrap iterations) were weakly but significantly related to bulk bone collagen δ13C values (F(1,41) = 8.1, p = 0.006, R2 = 0.16), indicating that fish with higher bulk tissue δ13C values were relatively more reliant on benthic, kelp-derived energy.
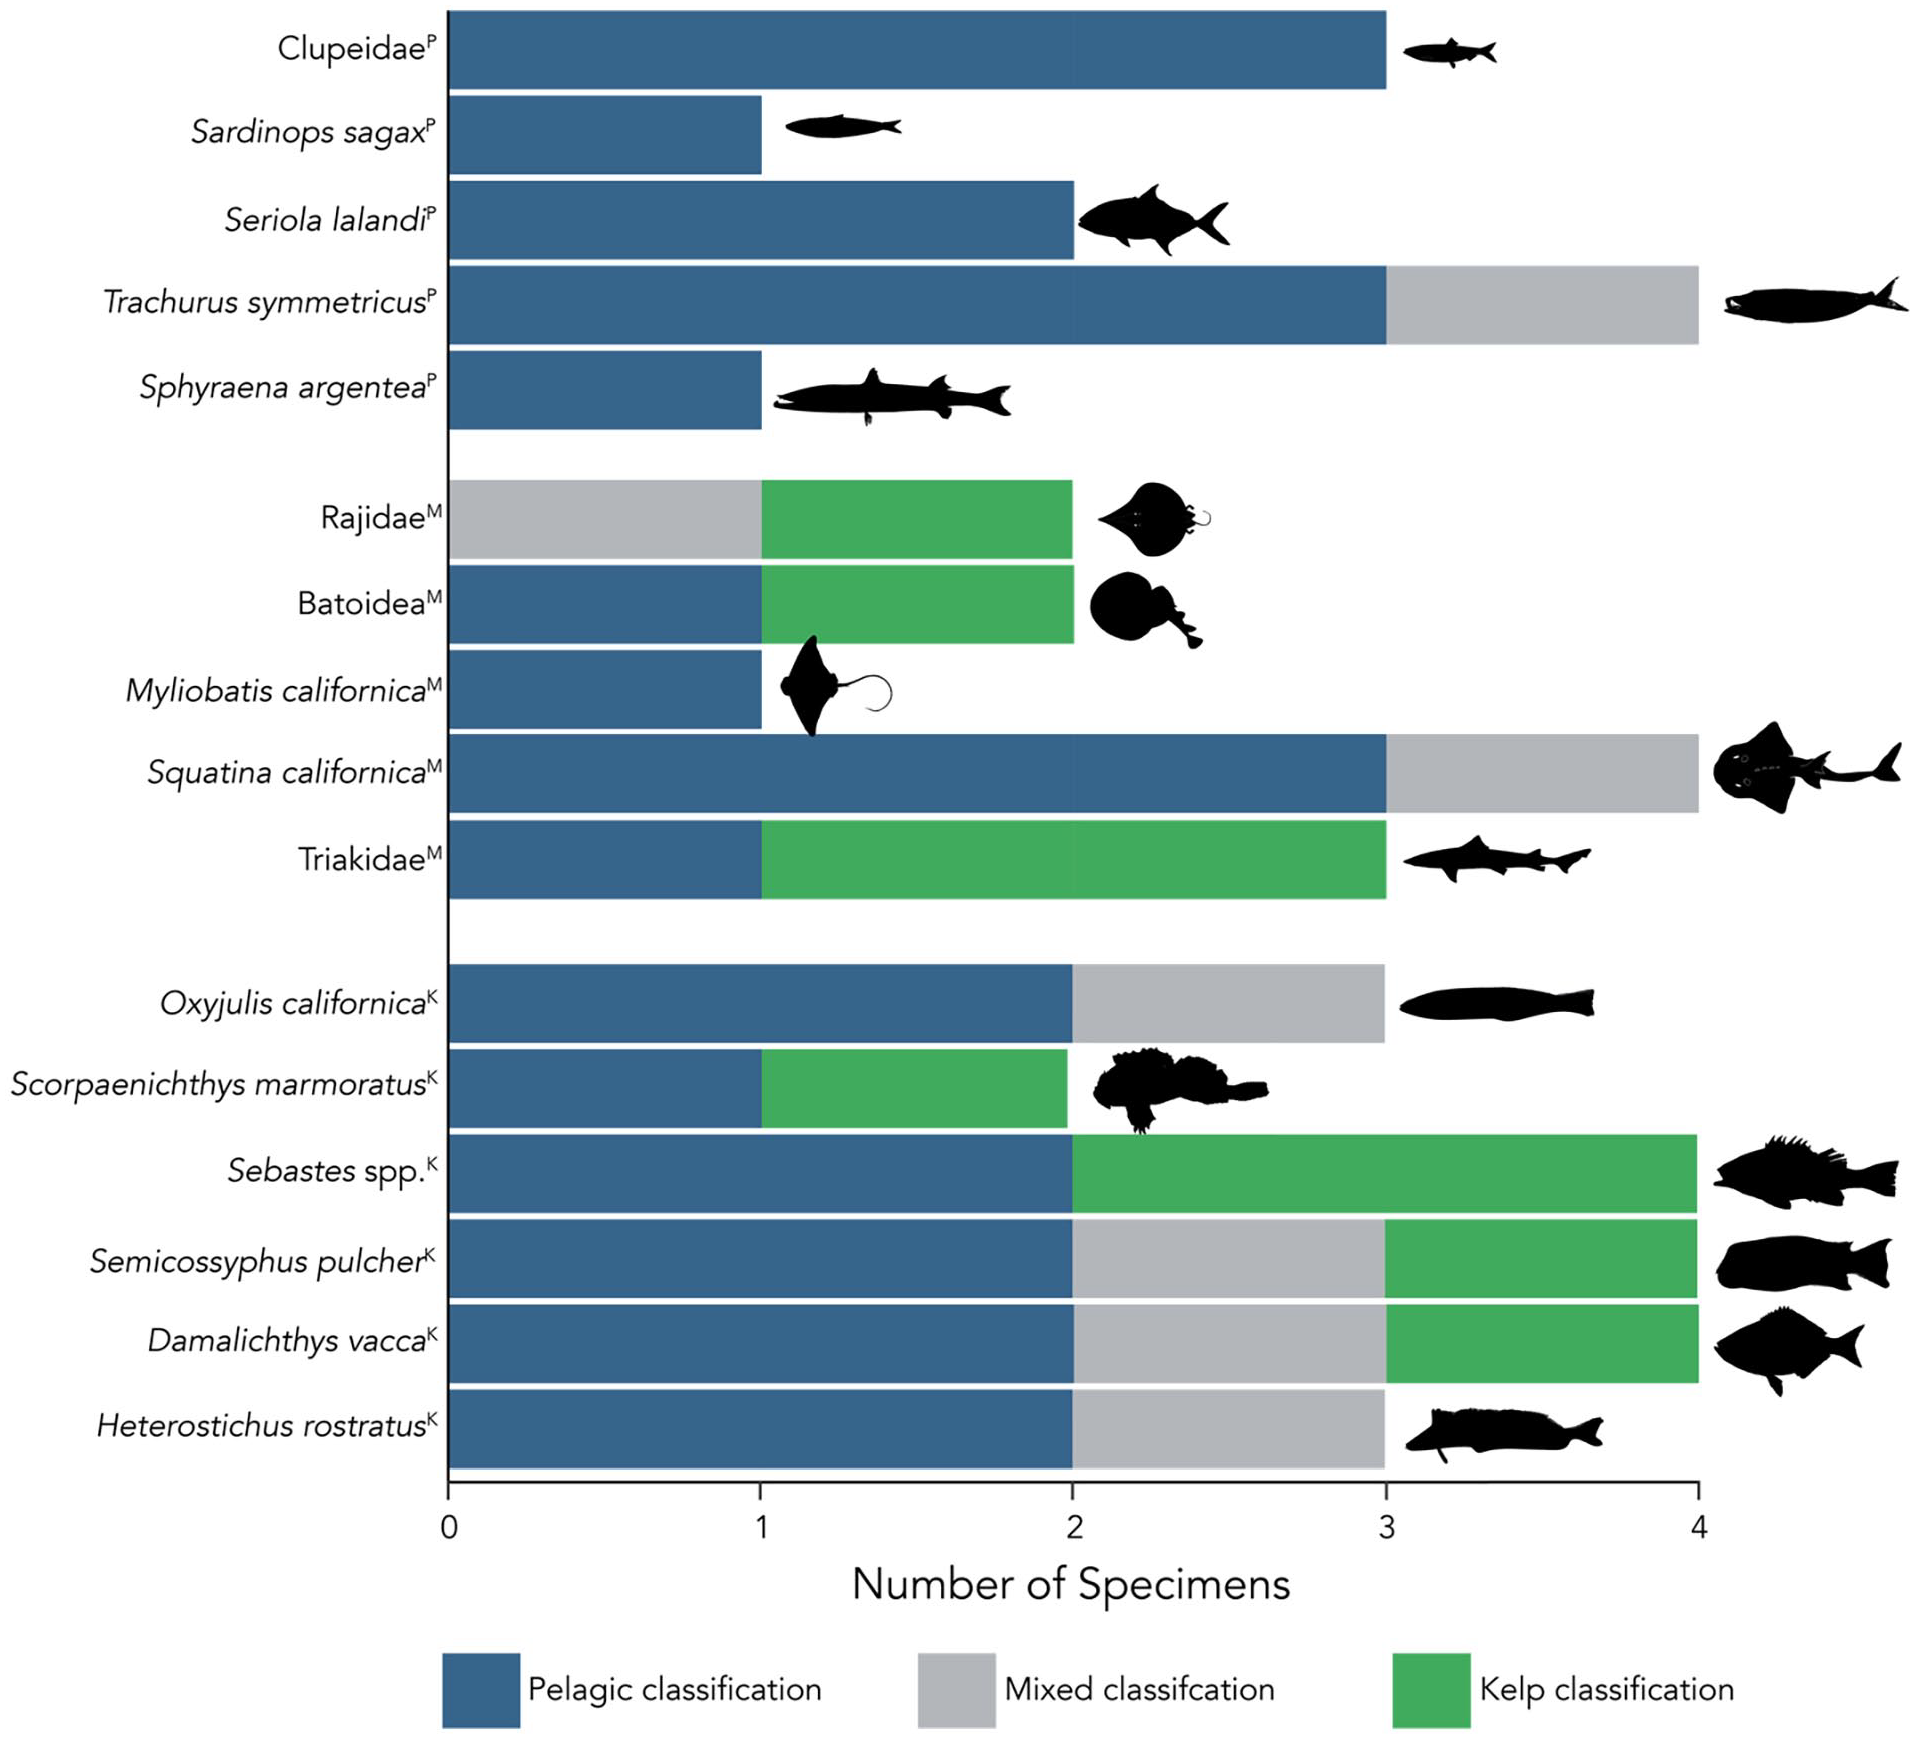
Energy channels supporting historical Santa Rosa fish communities. Shown are results from the linear discriminant bootstrapping analysis using essential amino acid δ13C data. The color for each specimen indicates classification with a primary producer group, and thus where the essential amino acids in that specimen were likely sourced from. Specimens that classified as “Mixed” changed classification across LDA bootstrap iterations (Supplemental Table S6, available online). The “Pelagic” classification includes contributions from Ulva sp. and phytoplankton which overlap isotopically (Elliott Smith et al., 2018, 2021, 2022). However, chlorophytes contribute minimally to regional subtidal NPP and detrital pools (Graham, 2004; Harrer et al., 2013), thus we assume specimens classifying with Ulva are more likely deriving their energy from phytoplankton. Superscripts above species names indicate general habitat preferences, with p = pelagic, M = mixed/sandy substrate, K = rocky substrate/kelp forest species.
Discussion and conclusion
Qshiwqshiw was an important Chumash village for several centuries prior to the arrival of the Spanish and into the Historic Period, representing a critical moment in Chumash history characterized by high population densities, hereditary leadership, sophisticated fishing and maritime technologies, and regional currency and trade (Braje et al., 2014; Rick et al., 2005). Within this cultural context, our findings suggest that people were embedded within a diverse and stable marine ecosystem. Zooarchaeological data show that the Island Chumash were fishing across, rather than down (e.g. Pauly et al., 1998) local food webs, and served predominantly as generalist fishers of mid-trophic level kelp forest species. Bulk tissue and compound-specific stable isotope measurements provide evidence that local marine fish of the Channel Islands were supported by both benthic (macroalgae) and pelagic (phytoplankton) production, which we interpret to mean the systems were highly stable during the occupation of CA-SRI-85. This stability likely contributed to sustaining intensive human harvesting for millennia, when thousands of Chumash hunter-gather-fishers continuously subsisted on local marine shellfish, fish, and marine mammals for most of the protein in their diet. This work provides a unique glimpse into coastal southern California communities – both human and animal – before European arrival and the enormous changes that followed.
Faunal and bulk tissue isotopic analyses show that the people who lived at CA-SRI-85 were intensive generalist fishers, sourcing prey across a diverse array of foraging patches. The CA-SRI-85 fishery targeted species from kelp forests, sandy/mixed substrate environments, pelagic habitats, and multiple trophic levels (Figures 2–4). This finding of historical “super generalist” human communities in southern California mirrors work in the North Pacific (Dunne et al., 2016) and the southeastern United States (Reitz, 2004). However, from across this broad ecological range the most heavily fished species at CA-SRI-85 were kelp forest carnivores with trophic levels between 3.0 and 4.0 (Figure 3). Surfperches, and especially pile perch (Damalichthys vacca), were the most abundant fish remains recovered (Figure 2). The focus on middle trophic level marine fauna (e.g. between TL 3.0 and 4.0) by the people who lived at CA-SRI-85 likely mitigated the impact of the Chumash fishery on nearshore food webs Pacific (Dunne et al., 2016). Although our results are from a single site and a few centuries, these patterns are supported by other studies from across the northern Channel Islands that support patterns of generalist foraging and sustainable marine harvesting practices. For example, previous research on red abalone, Haliotis rufescens (Braje et al., 2009), and California sheephead, Semicossyphus pulcher (Braje et al., 2017) suggest fisheries for these species were sustainable for millennia within Channel Island waters.
We find little evidence of large, open ocean fish such as swordfish, blue/mako sharks, and tunas (Thunnus spp.) being harvested by the people who lived at CA-SRI-85. Remains from these species are usually found in low abundance in Channel Island archeological sites (Turnbull et al., 2015), but they do become more common in northern Channel Island sites during the late Holocene, perhaps following the use of the tomol (plank canoe) ca. CE 500, and are associated with feasting (Arnold, 1995; Bernard, 2005; Noah, 2005). Swordfish were a key part of Chumash ritual and symbolism, with the fishery deeply embedded within the broader social and cultural context of Chumash lifeways (Bernard, 2005; Davenport et al., 1993; Noah, 2005). Although they appear in greater frequency after 1500 years ago, swordfish, along with other pelagic fish, continue to be a minor contributor to the protein diet, far outweighed by other nearshore fishes at most island sites – a pattern consistent with our finding at CA-SRI-85 (Erlandson et al., 2009; Noah, 2005; Turnbull et al., 2015). Indeed, we found only a single shortfin mako, Isurus oxyrinchus, and no tuna or swordfish (Table 2). The pelagic species we did identify at CA-SRI-85, including the Pacific barracuda (Sphyraena argentea) and yellowtail jack (Seriola lalandi), typically remain close to coastlines and frequently venture within kelp forests (Allen and Horn, 2006). We thus suspect CA-SRI-85 fish remains reflect a generalist fishing strategy by people within the local nearshore environment of Santa Rosa Island. This pattern of fishing across rather than down the food web, or targeting mid-trophic level fishes and thus regulating pressure on high trophic level fishes like swordfish, stands in contrast to modern large-scale commercial/capitalist activities that preferentially remove large-bodied, high trophic level species and have well-documented negative impacts (Estes et al., 2011; Jackson et al., 2001; Lotze and Milewski, 2004; McCauley et al., 2015; Springer et al., 2003). Historical ecology and zooarchaeology studies in the Pacific Northwest document Indigenous mariculture and management strategies for other species including shellfish (Slade et al., 2022; Toniello et al., 2019) and forage fish (McKechnie et al., 2014). Our findings from CA-SRI-85 thus reflect a broader strategy of long-term fisheries management by the Island Chumash and other Indigenous communities of the Pacific Coast.
Our essential amino acid δ13C measurements of CA-SRI-85 fish specimens allowed us to measure key attributes of historical Santa Rosa marine food webs and provide unique insights into the ecology and stability of these systems. Stable isotope analysis of individual amino acids has been used previously to study energy flow in a range of coastal Pacific ecosystems (Elliott Smith et al., 2018, 2021; Fox et al., 2019; Larsen et al., 2009, 2013; Nye, 2019; Rowe et al., 2019; Vokhshoori et al., 2014), and the utility of this technique relies on three key observations. First, δ13C values of essential amino acids are minimally altered during trophic transfers (Fantle et al., 1999; McMahon et al., 2015), although de novo synthesis by gut microbial communities cannot be ruled out. Second, some primary producer clades, such as kelps (Elliott Smith et al., 2022), impart distinct δ13C values on essential amino acids, which can be identified in consumers using multivariate statistics (Elliott Smith, 2019; Elliott Smith et al., 2018, 2022; Fox et al., 2019; Larsen et al., 2009, 2013). Finally, these “fingerprints” appear to be conserved over broad geographics scales, and over multiple centuries (Elliott Smith et al., 2022), enabling the reconstruction of energy flow in historical marine communities.
By comparing essential amino acid δ13C data of CA-SRI-85 fish specimens to published datasets of modern and historical marine autotrophs (Elliott Smith et al., 2022), we find that the nearshore food web was supported by both benthic (i.e. kelp) and pelagic (phytoplankton) primary production (Figure 5, Supplemental Table S6, available online). Fishes associated with kelp forest and mixed substrate habitats showed the greatest degree of coupling among these “energy channels,” meaning essential amino acids in these species were derived from multiple primary producer groups (Figures 3 and 5). In contrast, essential amino acids in pelagic fish were overwhelmingly from pelagic sources, apart from one Trachurus symmetricus specimen, which classified with both pelagic and benthic energy sources across bootstrap model iterations (Figure 5). This pattern of diverse energy usage – both within and among species – is thought to be a key attribute of stable and resilient food webs (Rooney et al., 2006), as the coupling of slow (benthic) and fast (pelagic) production can reduce recovery time following perturbations (Kondoh, 2003; Post et al., 2000; Rooney et al., 2006; Wolkovich et al., 2014). Similar patterns of energetic coupling through food webs have been used to infer stability in historical freshwater systems (Dombrosky et al., 2020). The isotopic patterns we find here in CA-SRI-85 fish (Figure 5, Supplemental Table S6, available online) thus suggest that the marine coastal food webs supporting people were organized in a relatively stable configuration prior to European arrival. This likely contributed to maintaining both dense hunter-gatherer-fisher communities and high faunal diversity in the region (Braje et al., 2009, 2014; Erlandson et al., 2009, 2011; Rick et al., 2005). However, we recognize the limited geographic and temporal scope of our current study and more data from across the North Pacific will be needed to refine these ideas.
Broadly, the archeological and isotopic data we present from CA-SRI-85 indicate people were fishing across, rather than down, coastal food webs. Our work expands upon a previous meta-analysis of fish remains from the Channel Islands over the Holocene (Erlandson et al., 2009), by demonstrating the specific ways people in densely populated island fishing communities were foraging across diverse habitats. Our findings suggest that local fishing practices were sustainable, particularly since regional communities intensively harvested marine resources for millennia (Erlandson and Rick, 2010; Erlandson et al., 2011; Fauvelle and Somerville, 2021; Rick et al., 2005). Other archeological studies have looked for patterns of fishing down the food web, finding a range of patterns including significant declines following the onset of commercial fisheries (e.g. Guiry et al., 2021; Lotze and Milewski, 2004; Morales and Roselló, 2004; Pestle, 2013; but see Reitz, 2004). However, many of these previous works have examined changing patterns of resource use and faunal abundance over long periods of time (millennia, or more). In contrast, Pauly and others (Estes et al., 2011; Jackson et al., 2001; Pauly et al., 1998) documented catastrophic collapse of modern fisheries and other ecosystems over decades to centuries. Our study thus highlights the importance of pairing regional archeological records with local studies on shorter time scales (centuries). We provide ecologically relevant data on the structure and function of marine ecosystems and the integration of people within them. More broadly, our study and a growing body of research demonstrates that continued integration among the socio-environmental sciences is crucial for the management of coastal ecosystems and fisheries around the world, providing key insight into the dynamics of these habitats through time and under a range of anthropogenic pressures and climatic conditions.
Supplemental Material
sj-docx-1-hol-10.1177_09596836221145383 – Supplemental material for Archaeological and stable isotope data reveal patterns of fishing across the food web on California’s Channel Islands
Supplemental material, sj-docx-1-hol-10.1177_09596836221145383 for Archaeological and stable isotope data reveal patterns of fishing across the food web on California’s Channel Islands by Emma A Elliott Smith, Todd J Braje, Kenneth W Gobalet, Breana Campbell, Seth D Newsome and Torben C Rick in The Holocene
Footnotes
Acknowledgements
Our project was designed following consultation with the Santa Ynez Band of Chumash Indians, a site visit by Kathy Conti, and conducted under a permit from the National Park Service. We thank Kathy Conti for help throughout the project. We also thank Chumash consultants Qun-Tan Shup and Tawnee Shup for all of their help. We would also like to thank Drs. Laura Burkemper and Viorel Atudorei for their general excellence, lightning-fast turnaround on bulk isotopic analyses, and support in fixing broken mass spectrometers on many occasions. We thank Alana Robinson for laboratory assistance, and Jon Dombrosky, Tony Gargano, Alexi Besser, Zoë Rossman, and Felisa Smith for their insights and advice. Fieldwork at CA-SRI-85 was supported by the National Park Service, especially Ann Huston and Kelly Minas. Any opinions, findings and conclusions or recommendations expressed in this material are those of the authors and do not necessarily reflect the views of the National Science Foundation, Smithsonian Institution, or National Park Service.
Funding
The author(s) disclosed receipt of the following financial support for the research, authorship, and/or publication of this article: National Science Foundation Postdoctoral Research Fellowship in Biology DBI-1907163 (EES), Smithsonian Institution NMNH Peter Buck Postdoctoral Fellowship (EES), San Diego State University Grants Program Award (TJB), California State University Council on Ocean Affairs, Science & Technology (COAST) award CSUCOAST-CAMBRE-SDSU-AY1314 (TJB).
Supplemental material
Supplemental material for this article is available online.
References
Supplementary Material
Please find the following supplemental material available below.
For Open Access articles published under a Creative Commons License, all supplemental material carries the same license as the article it is associated with.
For non-Open Access articles published, all supplemental material carries a non-exclusive license, and permission requests for re-use of supplemental material or any part of supplemental material shall be sent directly to the copyright owner as specified in the copyright notice associated with the article.