
Abstract
Anticosti Island, located in the Gulf of St. Lawrence (GSL; Quebec, Canada) is covered by ~25% peatland ecosystems, and conditions supporting their development remain poorly documented. We present the first reconstructions of the ecohydrological conditions (vegetation successions and water table variations) and related carbon accumulation of two maritime peatlands (Pluvier; PLU and Pointe de l’Est; PTE) located on the eastern part of Anticosti Island. These ombrotrophic peatlands developed under the influence of the GSL sea-surface conditions in interaction with atmospheric circulation during the Holocene. Long-term apparent Rate of Carbon Accumulation (LORCA, g C m−2 a−1) at PLU (13.3) and PTE (16.8) are lower than the mean global value for northern peatlands (22.9), likely due to high wind exposure. Results show that despite the earlier peat inception at PLU (9440 cal a BP) before PTE (6250 cal a BP), the fen-bog transition of both peatlands occurred almost synchronously (4540 and 5070 cal a BP respectively), suggesting favourable hydroclimatic conditions for peat growth. A slowdown in peat accumulation combined with dry and variable hydrological conditions after ca. 3300 cal a BP in the two studied peatlands coincided with the transition from the mid-Holocene to the Neoglacial cooling. At ca. 800 cal a BP, the shift from wet Sphagnum to dry ligneous peat corresponds to the transition from the Medieval Climate Anomaly to the Little Ice Age. Cooling periods, characterized by a decrease in incident solar radiation and the incursion of cold and dry Arctic air masses into the GSL, are marked by a decrease in peat accumulation, especially at PLU, due to its higher wind exposure, which influenced reduced snow cover thickness as well as frost penetration and duration through the peat.
Keywords
Introduction
Northern peatlands are an important terrestrial carbon (C) sink, as well as a key component of the global C cycle and feedbacks with climate change (Gallego-Sala et al., 2018; Yu, 2012). Peatlands cover approximately 13% of the emerged land of Canada, mainly concentrated in the boreal and subarctic biomes, and have accumulated ~150 Gt of C during the Holocene (Tarnocai, 2009; Tarnocai et al., 2011). In eastern Canada, previous studies have shown high spatial and temporal variability in apparent C accumulation rates (aCAR), driven by changes in temperature and atmospheric moisture balance throughout the Holocene (Charman et al., 2015; Garneau et al., 2014; Magnan and Garneau, 2014a). These climatic changes, along with internal processes (Swindles et al., 2012), drive shifts in peatland vegetation and surface wetness, thus influencing C sequestration (Charman et al., 2013; Loisel et al., 2014; Magnan and Garneau, 2014a). Therefore, ombrotrophic peatlands, which receive nutrients and water through precipitation are particularly sensitive to climate change and act as palaeoclimate archives at various timescales (Charman et al., 2015). Given their role on the climate system through C sequestration, it is important to better understand how peatlands respond regionally to climate changes.
In southeastern Canada, the Gulf of St. Lawrence (GSL) is a semi-enclosed sea characterized by strongly stratified waters and low sea-surface thermal inertia. The latter depends on atmospheric conditions, favouring very large seasonal contrasts from warm sea-surface temperature (SST) in summer to sea-ice coverage in winter (Galbraith et al., 2012; Wu et al., 2022). In the GSL region, air masses circulation was influenced by the North Atlantic Oscillation (NAO) throughout the Holocene (Jessen et al., 2011; Olsen et al., 2012). However, reconstructed trends in the NAO need to be interpreted with caution as changes in the Northern Hemisphere incident summer insolation strongly influenced climate throughout the Holocene, while air-sea interface feedbacks may have altered the amplitude of trends in maritime regions (Renssen et al., 2005; Wanner et al., 2011). There is a need to document how these air-sea interactions and specific climate settings may have influenced peat and C accumulation in maritime peatlands.
Peat-based palaeoclimate reconstructions suggest links between maritime peatland development and climate variations, driven by solar forcing and changes in ocean and atmospheric conditions in the GSL region (Blundell et al., 2018; Hughes et al., 2006; Magnan and Garneau, 2014a, 2014b; Peros et al., 2016; Pratte et al., 2017; Figure 1, nos 1–7–10). Shifts towards wetter peat surface between ca. 8000 and 5000 cal a BP in Newfoundland are thought to reflect reduced evapotranspiration from cooler climatic conditions, related to meltwater injections transported by the Labrador Current (LC) (Blundell et al., 2018; Hughes et al., 2006). On the north shore of the GSL, lower carbon accumulation rates during the Little Ice Age (LIA), associated with shorter lengths of growing seasons, were reported (Magnan and Garneau, 2014a), while drier peat surface conditions were attributed to increased frost penetration and duration in the peat surface horizons, influenced by the incursion of cold and dry Arctic air masses and reduced snow cover (Magnan and Garneau, 2014b; Pratte et al., 2017). Palaeoclimatic reconstructions from bogs along the GSL shore region can therefore improve our understanding of atmospheric climate variability and marine hydrographic conditions that influenced peatland dynamics in coastal environments.
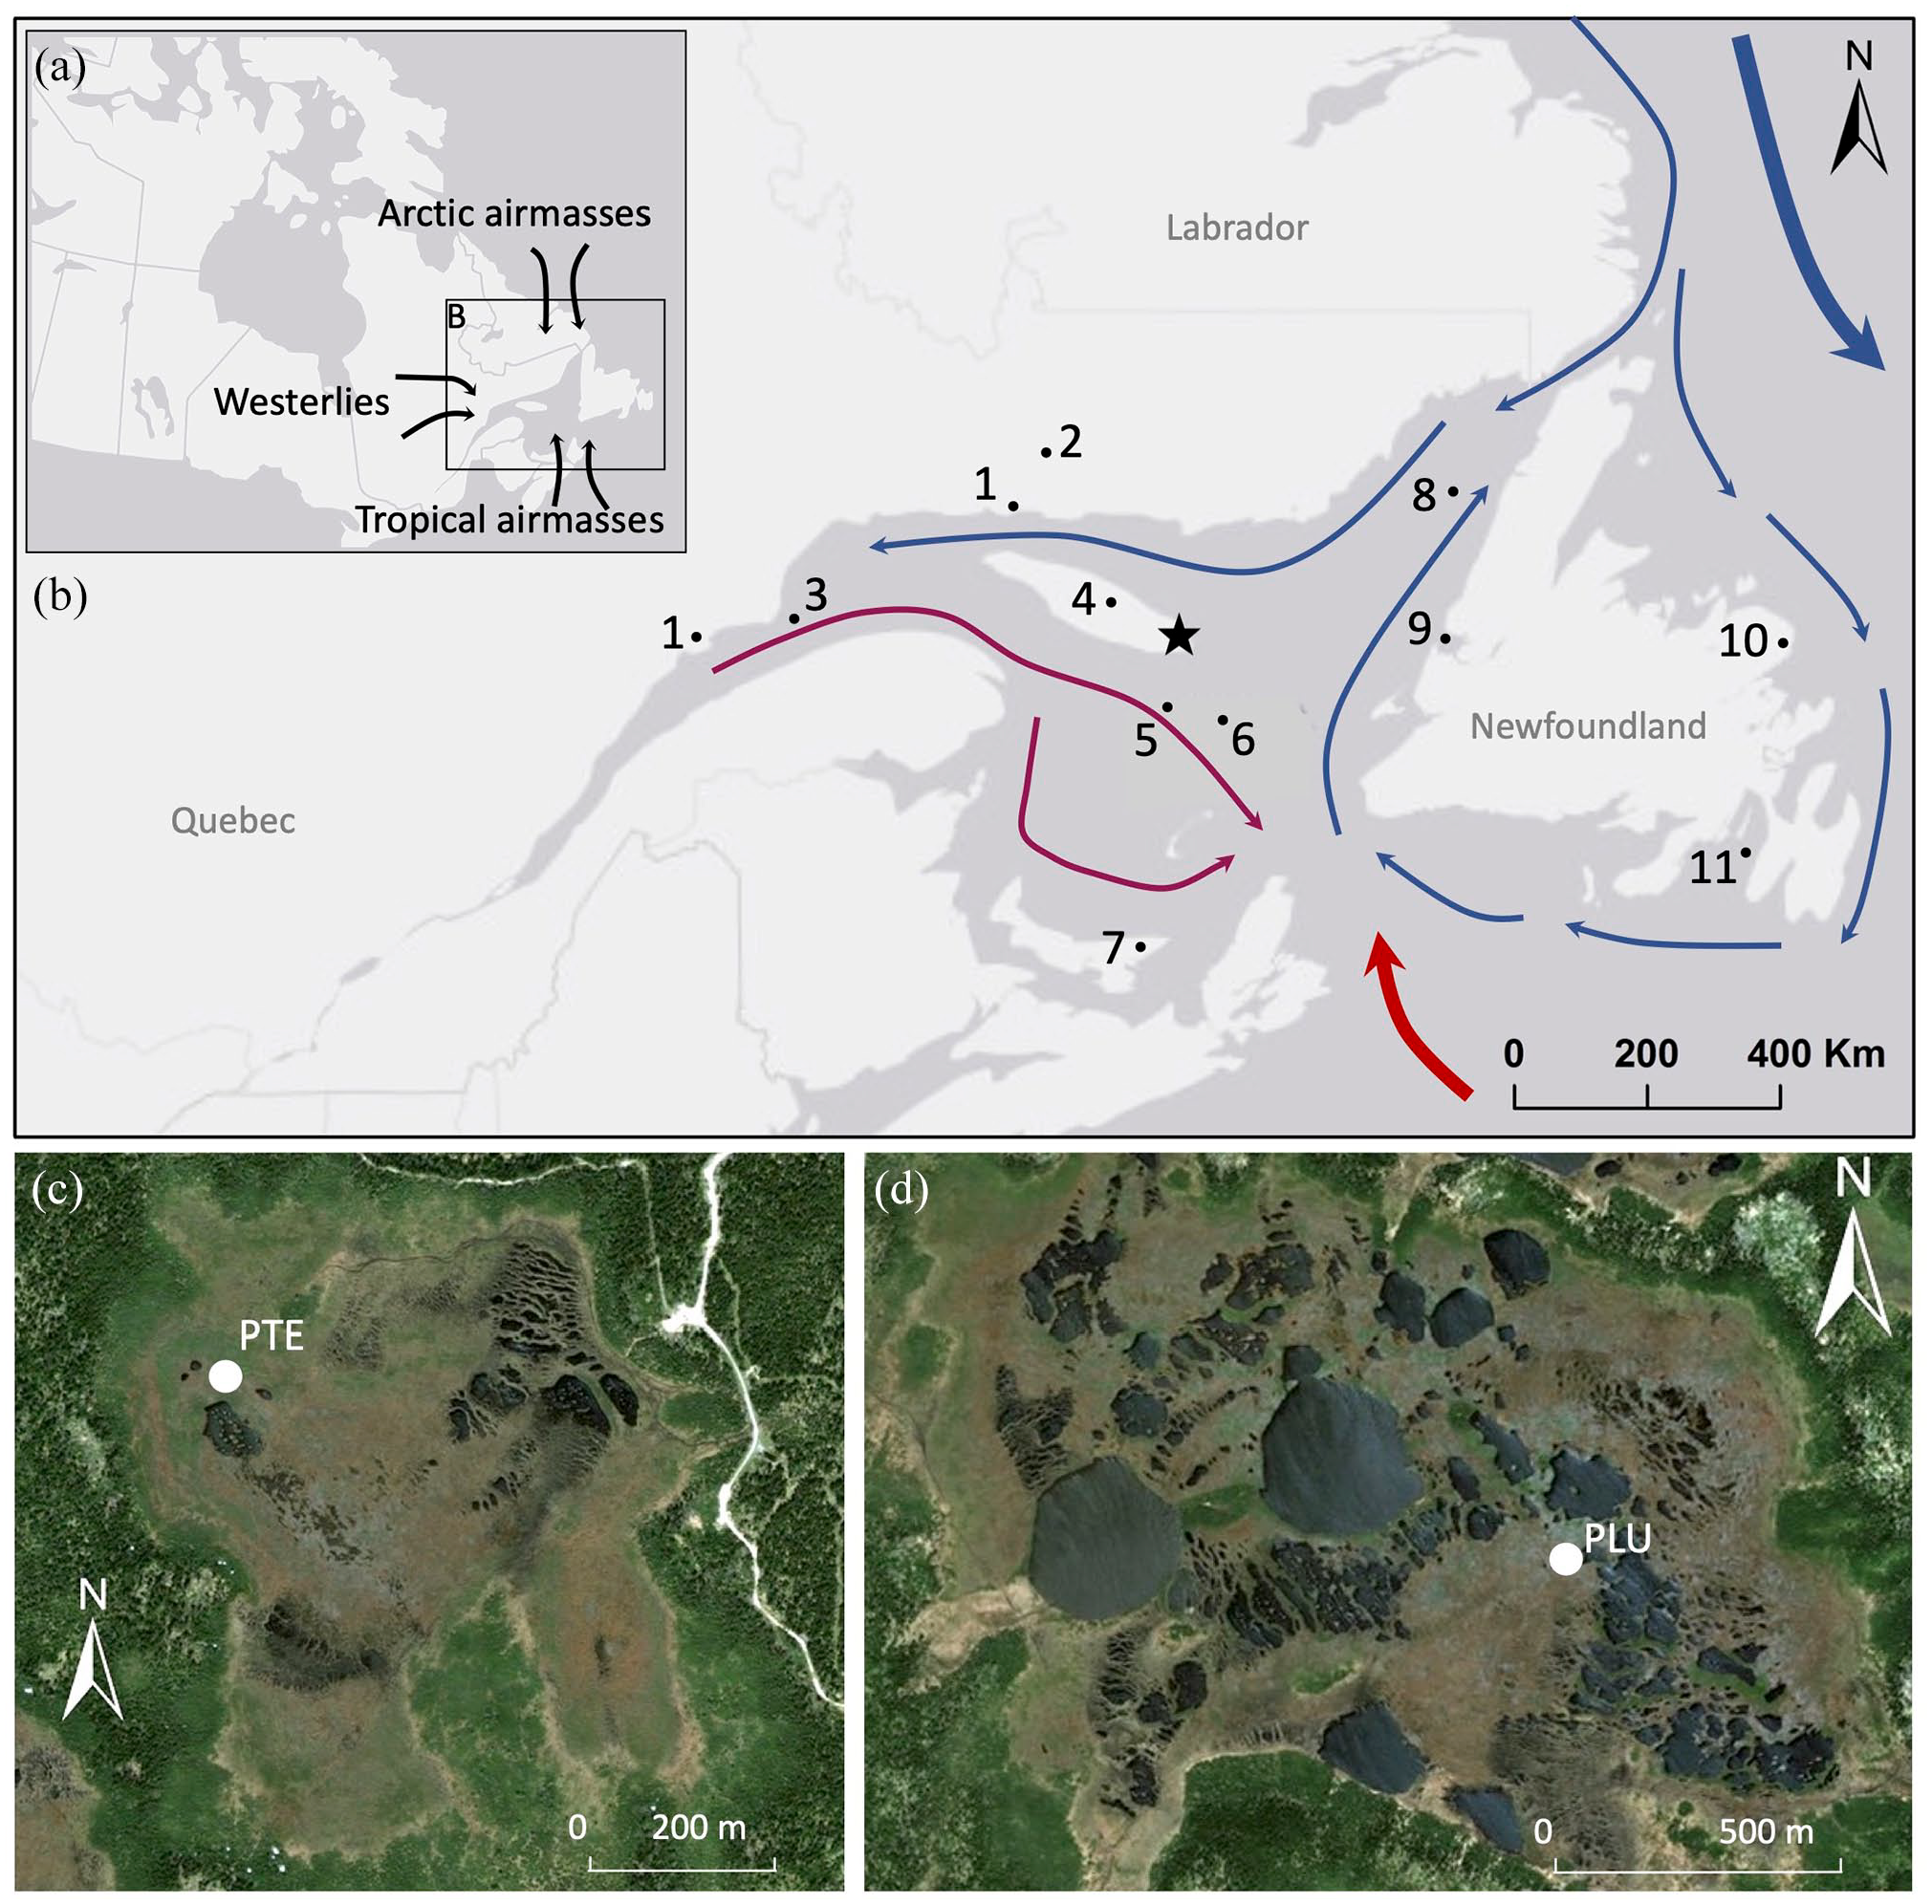
Location of the study area in Quebec and air masses (a) and identification of the surface and subsurface water currents into the Gulf of St. Lawrence: St. Lawrence River (burgundy), Labrador Current (blue) and North Atlantic Current (red) (b). The study area in eastern Anticosti Island is shown by a star. The numbers indicate the location of the study sites mentioned in the text. 1- peatlands in Baie-Comeau, Havre-St-Pierre and Ile du Havre (Magnan and Garneau, 2014a, 2014b; Pratte et al., 2017; Sauvé, 2016; 2- Bouleau and Mista peatlands (Primeau and Garneau, 2021); 3- COR0602-42PC (Lemay-Tougas, 2014); 4- Observation peatland (Lavoie and Filion, 2001; Sauvé, 2016; 5- MSM46-03 (Wu et al., 2022); 6- COR0503- 37PC (Dhahri, 2010; Genovesi et al., 2011; 7- Baltic bog (Peros et al., 2016); 8- CR06-TCE (Thibodeau et al., 2013); 9- Bay of Islands MD99-2225 (Levac, 2003); 10- Nordan’s Pond (Hughes et al., 2006) and Pound Cove bog (Blundell et al., 2018); 11- Placentia Bay AI07-12G (Jessen et al., 2011). Sampling localisation for Pointe de l’Est (PTE) (c) and Pluvier (PLU) (d) peatlands.
On Anticosti Island, while the regional Holocene vegetation has been reconstructed from palynological analyses (Lavoie and Filion, 2001), conditions supporting the establishment and development of peatlands in the regional landscape remain unknown. The central position of Anticosti Island in the GSL provides a unique region from which to evaluate interactions between different air masses at the interface of the sea-surface and the coast (Figure 1) that influenced peatland development through time. This study aims to reconstruct the Holocene hydroclimatic conditions from the initiation and development of two maritime peatlands located in the eastern part of Anticosti Island. More specifically, we aim to (i) reconstruct their ecological and hydrological changes over time from plant macrofossil and testate amoeba assemblages, (ii) quantify changes in peat and C accumulation rates during peatland development and (iii) characterize the relationship between regional climate variability throughout the Holocene and the development of these two maritime peatlands.
Study region and sites
Anticosti Island is located in the GSL, between 49° and 50° N and 61° and 64° W, and covers a total surface area of 7943 km2. The bedrock is composed of Ordovician and Silurian fossiliferous carbonate limestone, and is characterized by several karst features (Côté et al., 2006). The island was glaciated by the Laurentian Ice Sheet (LIS) and its centre remained covered by an isolated ice cap until ca. 14,200 cal a Before Present (BP; Dalton et al., 2020). The Goldthwait Sea marine transgression reached a maximum height of approximately 70 and 50 m in the western and eastern sections of the island, respectively (Grant, 1989). Anticosti is covered by thin, discontinuous layers of till, and approximately 25% of its surface area is covered by peatlands, especially in the central and eastern sectors where numerous ombrotrophic and minerotrophic complexes have developed (Dubois et al., 1990; Ministère de l’Énergie et des Ressources naturelles du Québec, 2019). Regional vegetation is characterized by the balsam fir-white birch bioclimatic domain of the closed boreal forest (Saucier et al., 2009). The increase in deer population during the 20th century and their intensive browsing has transformed the forest communities from a dominance of balsam fir (Abies balsamea) to a higher dominance of white spruce (Picea glauca) and black spruce (Picea mariana) (Barrette et al., 2014; Tremblay et al., 2007). Anticosti Island is characterized by a maritime climate, influenced by waters from the LC that contribute to relatively mild winters and cool summers. Gridded ANUSPLIN climate data (McKenney et al., 2011; Vincent et al., 2018) from 1950 to 2017 were generated for the Pointe Heath area in the eastern section (Supplemental Figure S1, available online). Mean annual air temperature (T°) is 2.8°C, mean summer T° (JJAS) is 13.6°C, which increased by ~0.6°C between 1950 and 2017. The number of growing degree-days above 0°C (GDD0) increased particularly between 1990 and 2017, reaching over 2200 degree-days. Mean annual precipitation is 960 mm, of which about 25% falls as snow. With current warming, the maximum sea-ice coverage of the GSL has decreased by 10% between 1968 and 2020 (Supplemental Figure S2, available online; Environment and Climate Change Canada, 2021).
The two studied peatlands are located in the eastern sector of the island, approximately 3 km from the shore and 2 km apart (Figure 1). Pointe de l’Est (unofficial name, PTE, 49°11′48″N, 61°47′49″W, alt. 74 m) covers a total surface of 0.3 km2, with a small proportion of pools (~5%) in its northeast section. Pluvier (unofficial name, PLU, 49°10′23″N, 61°45′55″W, alt. 61 m) occupies a total surface of 1.7 km2, of which 25% is covered by pools. PTE is surrounded by a forested fringe dominated by Picea spp. and Abies balsamea, while PLU is much more open and exposed to north-northeasterly winds. Both peatlands have ombrotrophic and minerotrophic sections. Surface vegetation in ombrotrophic sections follows a microform humidity gradient, with water table depths (WTD) varying between 40 and 0 cm and a pH ranging from 4 to 5. A few stunted Larix laricina and Picea mariana are found on hummocks, with some lichens (Cladonia stellaris) are found on the driest sections. Ericaceous shrubs, including Chamaedaphne calyculata, Kalmia angustifolia, Rhododendron groenlandicum, Andromeda polifolia, Vaccinium angustifolium and Vaccinium oxycoccos, are distributed on hummocks and lawns microforms. Bryophytes, including Sphagnum fuscum, S. rubellum and Leiomylia anomala, colonize the hummocks and lawns. Herbaceous vegetation dominated by Trichophorum cespitosum, Rubus chamaemorus, Eriophorum angustifolium, Carex exilis and Drosera rotundifolia are found on lawns and hollows. Along pool edges, species such as S. fallax and S. tenellum were identified. Betula michauxii and Myrica gale were found in laggs within both peatlands.
Methods
Fieldwork and sampling
Eastern Anticosti peatlands were preliminary selected based on analyses of Google Earth satellite images. In July 2019, six sites were visited and two representative peatlands were selected based on their ombrotrophic nutrient status, size and accessibility. Peat thickness was measured with an Oakfield probe at systematic 25 m intervals to reconstruct the underlying basin topography for the ombrotrophic sections of each of the two peatlands. A peat core was retrieved from a lawn microform in the deepest section of each peatland to obtain the longest temporal reconstruction. The first metre was collected with a Box corer (100 × 8 × 8 cm) (Jeglum et al., 1992) and the deeper peat sections were sampled with a Russian corer (4 cm diameter) (Jowsey, 1966). Peat cores were wrapped with cellophane and aluminium foil, transported in polyvinyl tubes and refrigerated at 4°C until analysis. At each coring site, vegetation surveys from 1 m2 quadrats were conducted using the Braun-Blanquet (1932) abundance method. In both peatlands, testate amoeba surface samples were also collected from each microform following the Booth et al. (2010) protocol.
Carbon data
In the laboratory, each core was cut into 1-cm slices and stored at 4°C for further analysis. Dry bulk density, organic matter and mineral content were obtained using the loss-on-ignition (LOI) protocol described in Chambers et al. (2011). Contiguous 1-cm3 subsamples of fresh peat material were dried overnight at 105°C to obtain dry density and burned at 550°C for 3.5 h to determine organic matter and mineral content (Heiri et al., 2001). Carbon density (g cm−3) was estimated by multiplying the organic matter density by 0.5 (Turunen et al., 2002).
Plant macrofossil analyses
Preparation and analysis of plant macrofossil was performed at 2–4 cm intervals from 3 cm3 peat subsamples, following the protocol in Mauquoy et al. (2010). Samples were gently boiled in a 5% KOH solution and filtered through a 125 µm sieve with distilled water. Samples were stored in plastic bags at 4°C until analysis. A stereoscopic microscope (4–40× magnification) was used to estimate the relative abundance (%) of the different peat types (Sphagnum, brown mosses, ligneous and herbaceous) and to count individual macrofossil remains (needles, seeds, Ericaceae leaves, Chara oogonia and Cenococcum sclerotia) in a gridded petri dish. When possible, vascular plants were identified to genus- or species-level using Lévesque et al. (1988), Mauquoy and van Geel (2007) and the macrofossil reference collection from the Continental Paleoecology Laboratory at Geotop-UQAM (Garneau, 1995). Nomenclature for vascular plants follows Marie-Victorin (2002) while bryophyte identification and nomenclature follow Faubert (2014). For each sample, approximately 50 Sphagnum leaves were randomly selected and identified to the section level (e.g. Sphagnum sect. Acutifolia) with a light microscope (100–400× magnification) using the Laine et al. (2009) identification guide. The degree of peat decomposition (decay index) was visually estimated, from an index of 0 (fresh intact peat) to 5 (highly decomposed peat). Plant macrofossil diagrams were generated using the C2 software version 1.7.7 (Juggins, 2007). The zonation of the plant macrofossil diagrams was established using stratigraphically constrained cluster analysis (CONISS; Supplemental Figure S5, available online) with the Rioja package version 0.9-21 (Juggins, 2020) in R version 3.6.1 (R Core Team, 2019).
Testate amoebae and water table depth reconstructions
Following Booth et al. (2010), testate amoeba analyses were performed at the same intervals as those for plant macrofossils. Each 1 cm3 subsample was immersed in 50 ml of distilled water and gently boiled for 10 minutes. A tablet of Lycopodium spores (batch #3862) was added as an exotic marker to calculate test concentrations (Stockmarr, 1971). The material was filtered with distilled water through 250 and 15 µm sieves, centrifuged in 15 ml plastic tube and stored at 4°C. A minimum of 100 tests were counted and identified under a Leica DMLS light microscope at 400× magnification using the Charman et al. (2000) and Booth (2008) identification keys. Some samples with low test concentrations but comprising at least 50 counts were considered reliable for WTD reconstructions, although the values should be interpreted with caution (Payne and Mitchell, 2009). WTD were reconstructed in the Rioja package version 0.9-21 (Juggins, 2020) in R software version 3.6.1 (R Core Team, 2019) using the Lamarre et al. (2013) transfer function based on 206 modern assemblages, including 120 samples from the North Shore of the St. Lawrence region. WTD were inferred with the weighted average and tolerance down-weighted (WA-Tol) function, and error range was calculated using a bootstrap cross-validation method with 1000 cycles. Testate amoeba diagrams and WTD were generated using the C2 software version 1.7.7 (Juggins, 2007). A CONISS analysis was performed using the Rioja package version 0.9-21 (Juggins, 2020) in R version 3.6.1 (R Core Team, 2019) to support the diagram zonation, in addition to the plant macrofossils.
Multivariate analyses
A principal component analyses (PCA) was performed using the Canoco 5.0 software (Ter Braak and Šmilauer, 2012) for plant macrofossil data in addition to the zonation established with CONISS. Plant macrofossils expressed in relative abundance (in percentages) were included in the ordination when they occurred in at least two samples. Four inferred palaeoenvironmental variables were fitted as passive variables in the ordination: dry bulk density, mineral residue content, inferred water table depth, and peat decomposition, in order to identify potential links with the plant macrofossil data without assuming statistical relationships.
Chronology
A total of 19 samples were submitted for radiocarbon (14C) dating at the A.E. Lalonde AMS laboratory (University of Ottawa, Canada). Sphagnum stems were preferentially selected (Nilsson et al., 2001); coniferous needles, ericaceous seeds or leaves, Cyperaceae seeds and moss stems were also used when Sphagnum was not sufficiently abundant. Two bulk peat samples were dated in highly-decomposed peat sections (PLU–188 and PLU–240). Radiocarbon dates were calibrated (cal a BP) using the IntCal20 calibration curve (Reimer et al., 2020) in CALIB 8.2 (Stuiver et al., 2021), and modern dates were calibrated with the Northern Hemisphere Zone 1 (NHZ1) post-bomb atmospheric radiocarbon curve (Hua et al., 2013; Table 1).
Detailed AMS radiocarbon dating results (14C age, uncalibrated), 2-sigma range (calibrated dates from CALIB 8.2; CaliBOMB for modern dates where F14C > 1) and modelled dates (from Plum).
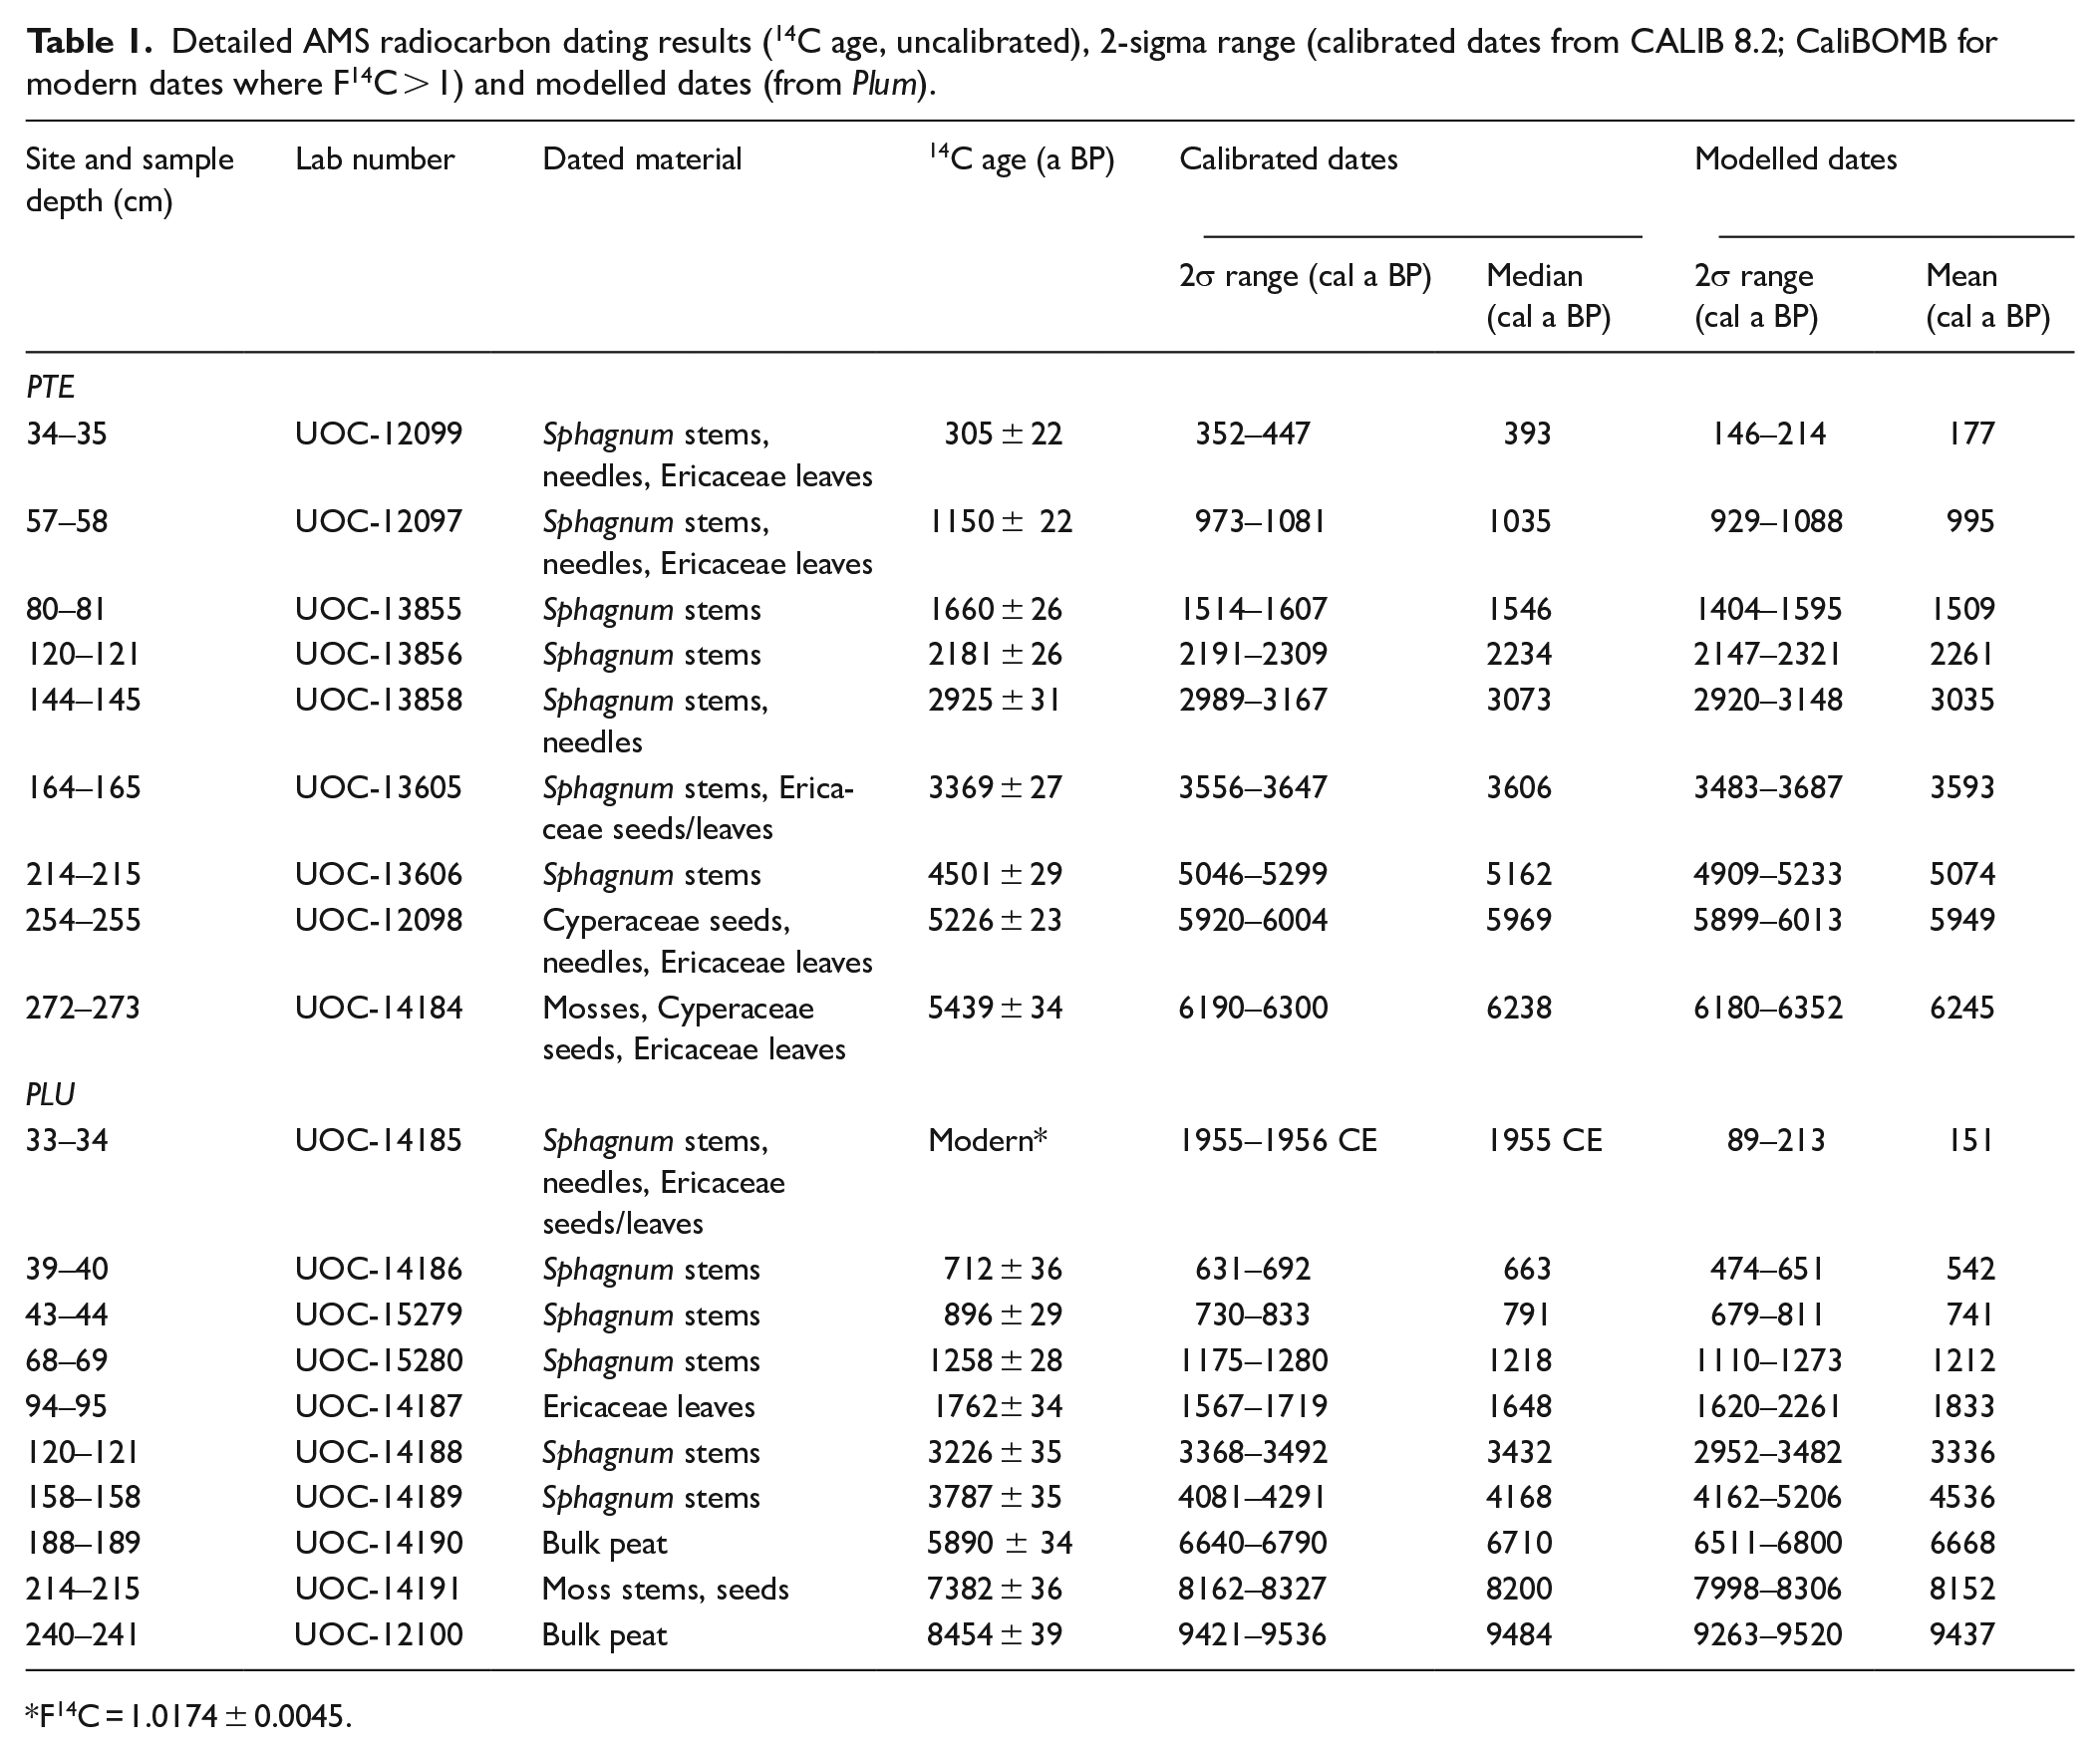
F14C = 1.0174 ± 0.0045.
For recent chronologies (<150 years), lead-210 (210Pb) dates were performed respectively on the first 37 cm and 36 cm of the PTE and PLU cores to reach the unsupported 210Pb limit (Supplemental Table S1, available online). At 2-cm intervals, samples were spiked with a polonium-209 (209Po) chemical yield tracer and, following a sequential HNO3:H2O2:HCL (1:2:1) acid digestion preparation, electroplated onto silver discs. Activities of polonium-210 (210Po, daughter-product of 210Pb) and 209Po were measured using an EGG-Ortec Type 576ATM alpha spectrometer at the Radiochronology Laboratory (Geotop-UQAM). The ratio obtained was used to calculate 210Pb activity based on sample density and peat depth (Turetsky et al., 2004).
Age-depth models were built using the Bayesian Plum model, version 0.2.2 (Aquino-López et al., 2018) in R version 3.6.1 (R Core Team, 2019) and using a combination of 210Pb activity, data and uncalibrated 14C ages. The acc.mean prior parameter was set to 20 a cm−1 for PTE and to 50 a cm−1 for PLU based on the approximate peat accumulation rate for each core. Dates were modelled (cal a BP) in Plum using the IntCal20 calibration curve (Reimer et al., 2020). The age of the peatland surface was set to −69 cal a BP, which corresponds to the year of coring in 2019 CE and where the ‘present’ (BP) is considered as 1950 CE.
Peat and carbon accumulation
The LOng-term apparent Rate of Carbon Accumulation (LORCA, g C m−2 a−1) was calculated for both cores by dividing the total mass of carbon accumulated by the basal 14C calibrated age (Turunen et al., 2002). REcent apparent Rates of Carbon Accumulation (RERCA; g C m−2 a−1) were calculated by dividing the total mass of carbon accumulated in the acrotelm by three basal 210Pb ages (1850 CE, 1900 CE and 1950 CE) to the coring year (2019 CE). Peat accumulation rates (PAR; cm a−1) and carbon accumulation rates (CAR; g C m−2 a−1) were calculated by dividing peat thickness and carbon density by the deposition time (a cm−1) obtained by the age-depth modelling. Results were plotted using the C2 software version 1.7.7 (Juggins, 2007). LORCA values are not compared to higher RERCA values recorded in the near-surface peat, due to incomplete decay in the upper horizons (Young et al., 2019). However, we compare RERCA values between sites from same time periods, allowing for the identification of potential climatic responses in these recent peat layers (Piilo et al., 2019; Sim et al., 2021).
Results
Chronologies combined with peat, carbon and lead-210 accumulation
Pointe de l’Est – Maximum peat thickness at PTE is 2.72 m. This peatland developed in a relatively well-constrained depression. Peat accumulation started around 6250 cal a BP and total mean PAR is 0.44 mm a−1 corresponding to a mean net accretion rate of 23.56 years per cm (a cm−1). The upper horizons show the highest PAR values (1.37 mm a−1) and correspond to the less-compacted and less-decomposed acrotelm peat (Figures 2 and 3). LORCA is 16.80 ± 0.23 g C m−2 a−1 and RERCA values range from 55.64 ± 3.04 g C m−2 a−1 since 1850 CE, 65.55 ± 2.30 g C m−2 a−1 since 1900 CE and 77.33 ± 2.86 g C m−2 a−1, since 1950 CE. A mean 210Pb activity of 167 Bq m−2 a−1 is recorded in the upper horizons (0–37 cm) with a total 210Pb inventory of 5784.2 Bq m−2 (see Supplemental Table S2, available online).
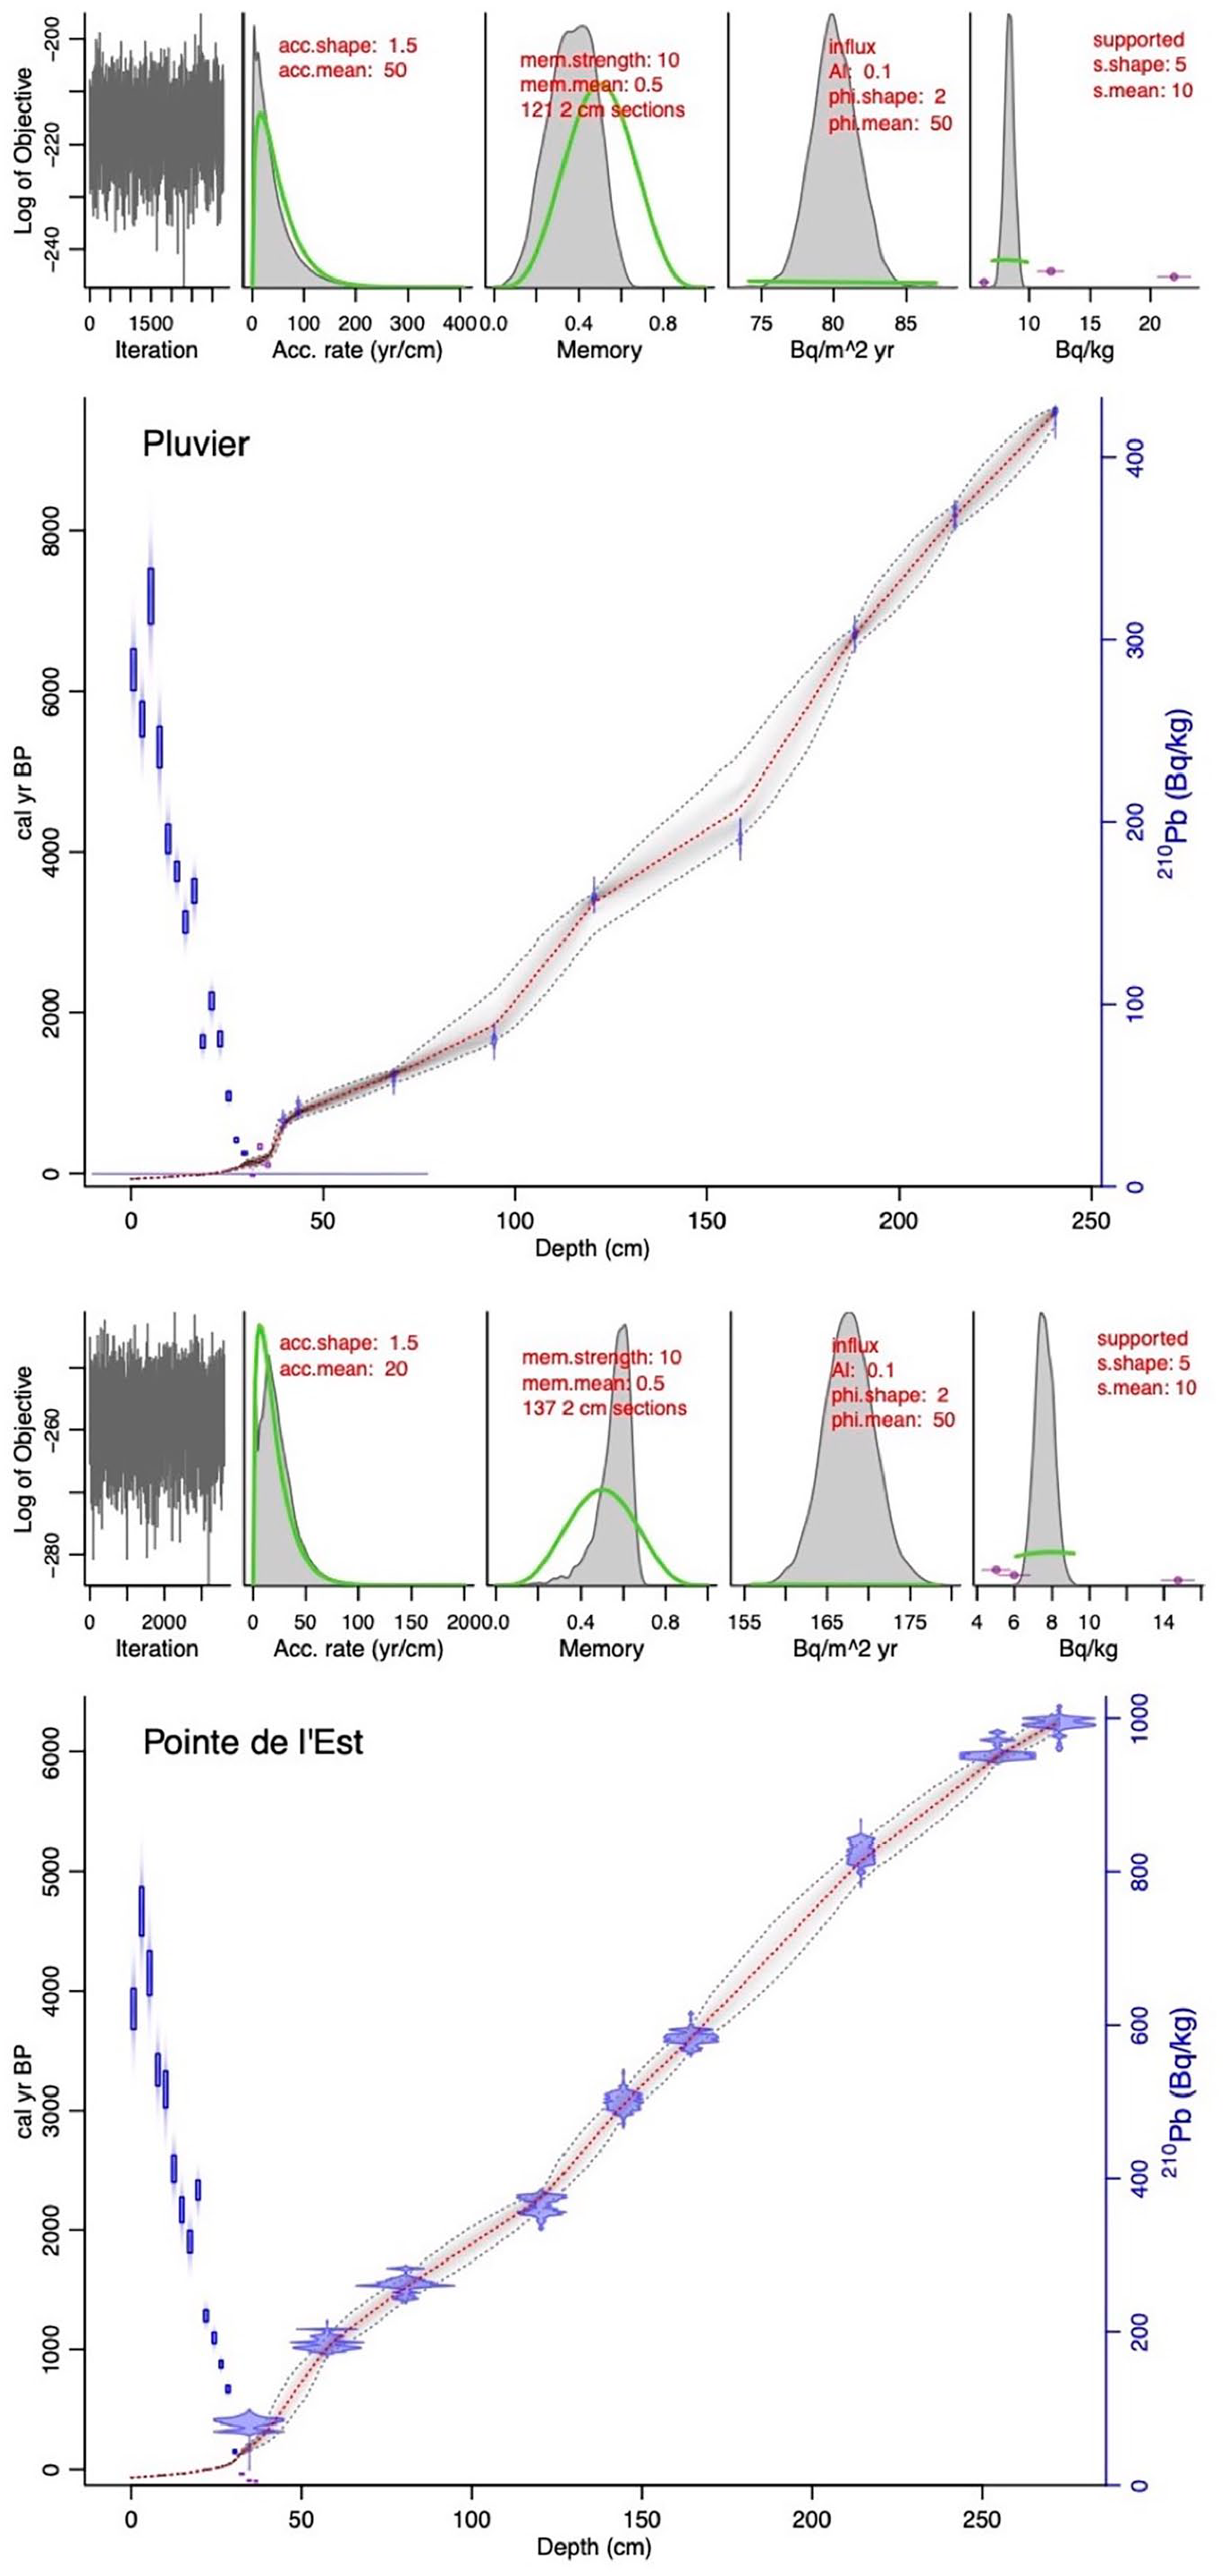
Age-depth models for the two peatland sites modelled using the R package rPlum version 0.2.2 (Aquino-López et al., 2018). The 210Pb activity (Bq kg−1) is represented by the blue rectangles and 14C dates are shown in purple. The red line represents the mean model, grey dashed lines are the 95% confidence intervals. The prior (green lines) and posterior (grey plots) distributions of each model are shown in the mini plots.
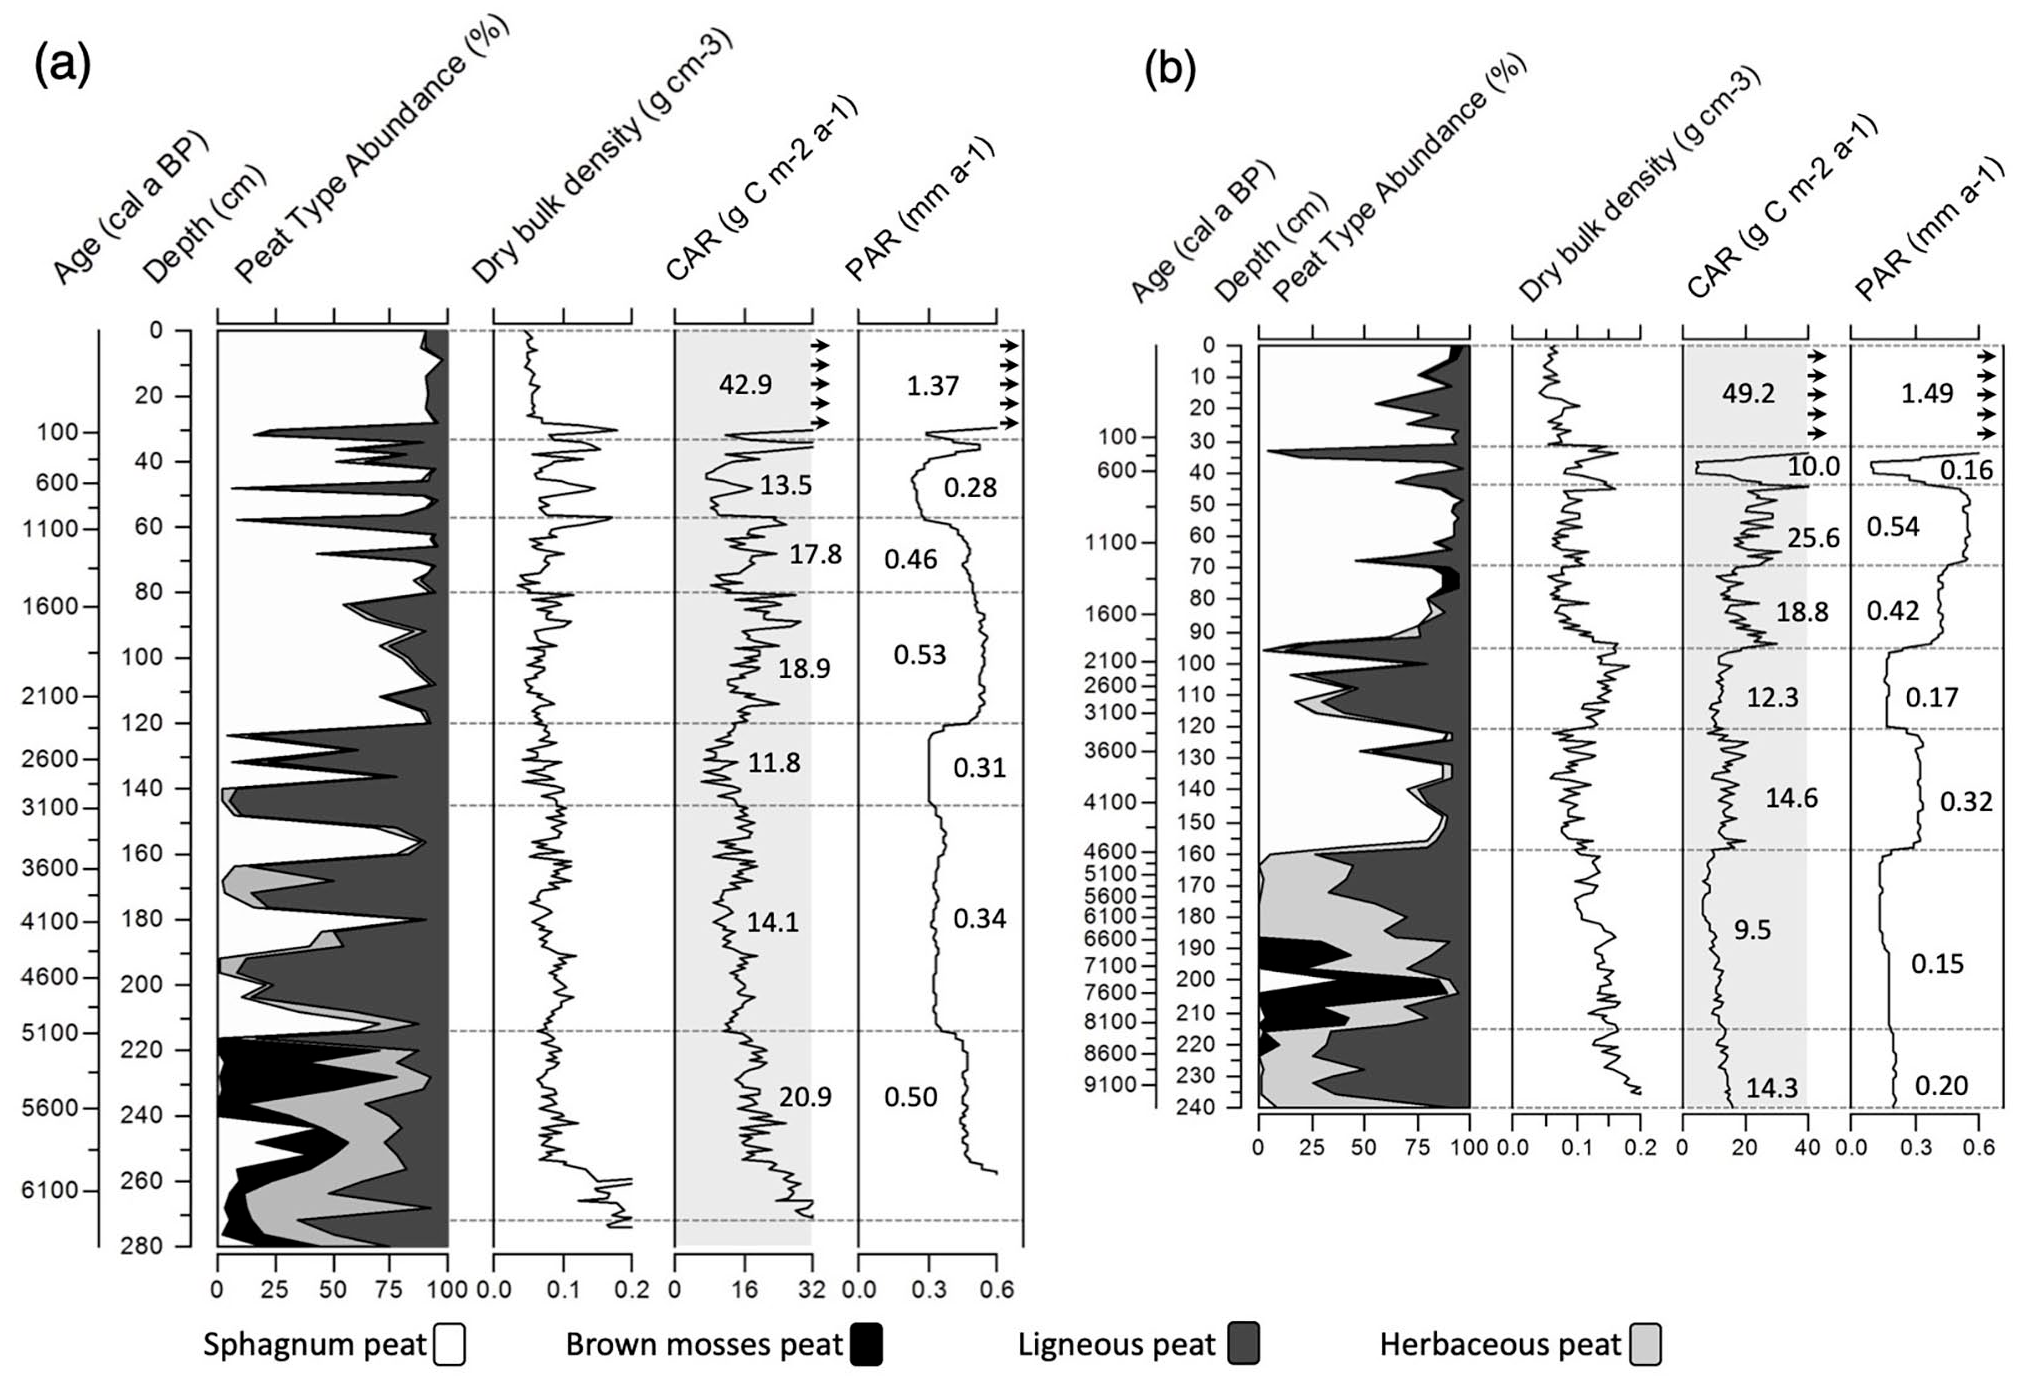
Plant macrofossil abundance, dry bulk density, carbon (CAR) and peat (PAR) accumulation rates for Pointe de l’Est (a) and Pluvier (b). Mean CAR and PAR are indicated in each subzone. CAR values >40 g C m−2 a−1 and PAR values >0.6 mm a−1 in the upper horizons are indicated with lateral arrows.
Pluvier – Maximum peat depth at PLU is 2.40 m. This peatland developed in a more complex hydro-geomorphological context than PTE. Peat accumulation in the PLU peatland initiated around 9440 cal a BP, with a total mean PAR of 0.25 mm a−1 and corresponds to a mean net accretion rate of 40.11 a cm−1. As in PTE, the highest PAR (1.49 mm a−1) was recorded in the less decomposed surface horizons corresponding to the acrotelm (Figure 3). The LORCA at the PLU peatland is 13.30 ± 0.18 g C m−2 a−1, RERCA calculated since 1850 CE is 53.90 ± 8.34 g C m−2 a−1, 67.89 ± 4.54 g C m−2 a−1 since 1900 CE, and 87.66 ± 3.88 g C m−2 a−1 since 1950 CE. A lower mean 210Pb activity of 80 Bq m−2 a−1 than at PTE is recorded in the upper horizons (0 cm–36 cm) with a total 210Pb inventory of 2934.7 Bq m−2 (see Supplemental Table S2, available online).
Palaeoecohydrological reconstructions
Pointe de l’Est – Peat accumulation began around 6250 cal a BP over a silty till matrix as a rich fen characterized by Sphagnum sect. Cuspidata and sect. Squarrosa, brown mosses, herbaceous remains and oogonia of Chara suggesting a rich pond environment (PTE-1a). Testate amoeba assemblages characterized by Centropyxis species, which incorporate mineral particles into their tests, suggest near-surface (~5 cm) to intermediate (~10 cm) WTD in a rich minerotrophic environment. Inferred WTD between 224 and 212 cm in subzone PTE-1b should be treated with caution because of low test counts (50–75 counts). As shown in Figure 4 and Table 2, the beginning of subzone PTE-2a corresponds to the fen-bog transition, marked by the appearance of S. sect. Acutifolia within the horizons. From 5070 to 2260 cal a BP (PTE-2a-b), highly decomposed ligneous horizons (~2.5–3) and Cenococcum ectomycorrhizal fungi suggest aerobic conditions, supported by testate amoeba assemblages dominated by D. pulex, and corresponding to drier and more variable WTD (Lamarre et al., 2013; Sullivan and Booth, 2011). From 2260 cal a BP (PTE-2c), a dominance of poorly decomposed (~1.5–2) S. sect. Acutifolia and a shift from xerophilous testate amoebae taxa to a co-dominance of dry and wet taxa suggests wetter conditions. The WTD value at 74 cm has a higher error margin because of low test concentration (61 counts). Between 1030 and 60 cal a BP (PTE-2d), the succession of ligneous horizons highly decomposed (~2.5–3) and S. sect. Acutifolia horizons, combined with alternating dry and wet testate amoebae taxa, suggest a period of fluctuating water tables (~10–20 cm) (Sullivan and Booth, 2011). The upper subzone PTE-2e is dominated by almost undecomposed (~0.5) S. sect. Acutifolia, corresponding to the acrotelm.
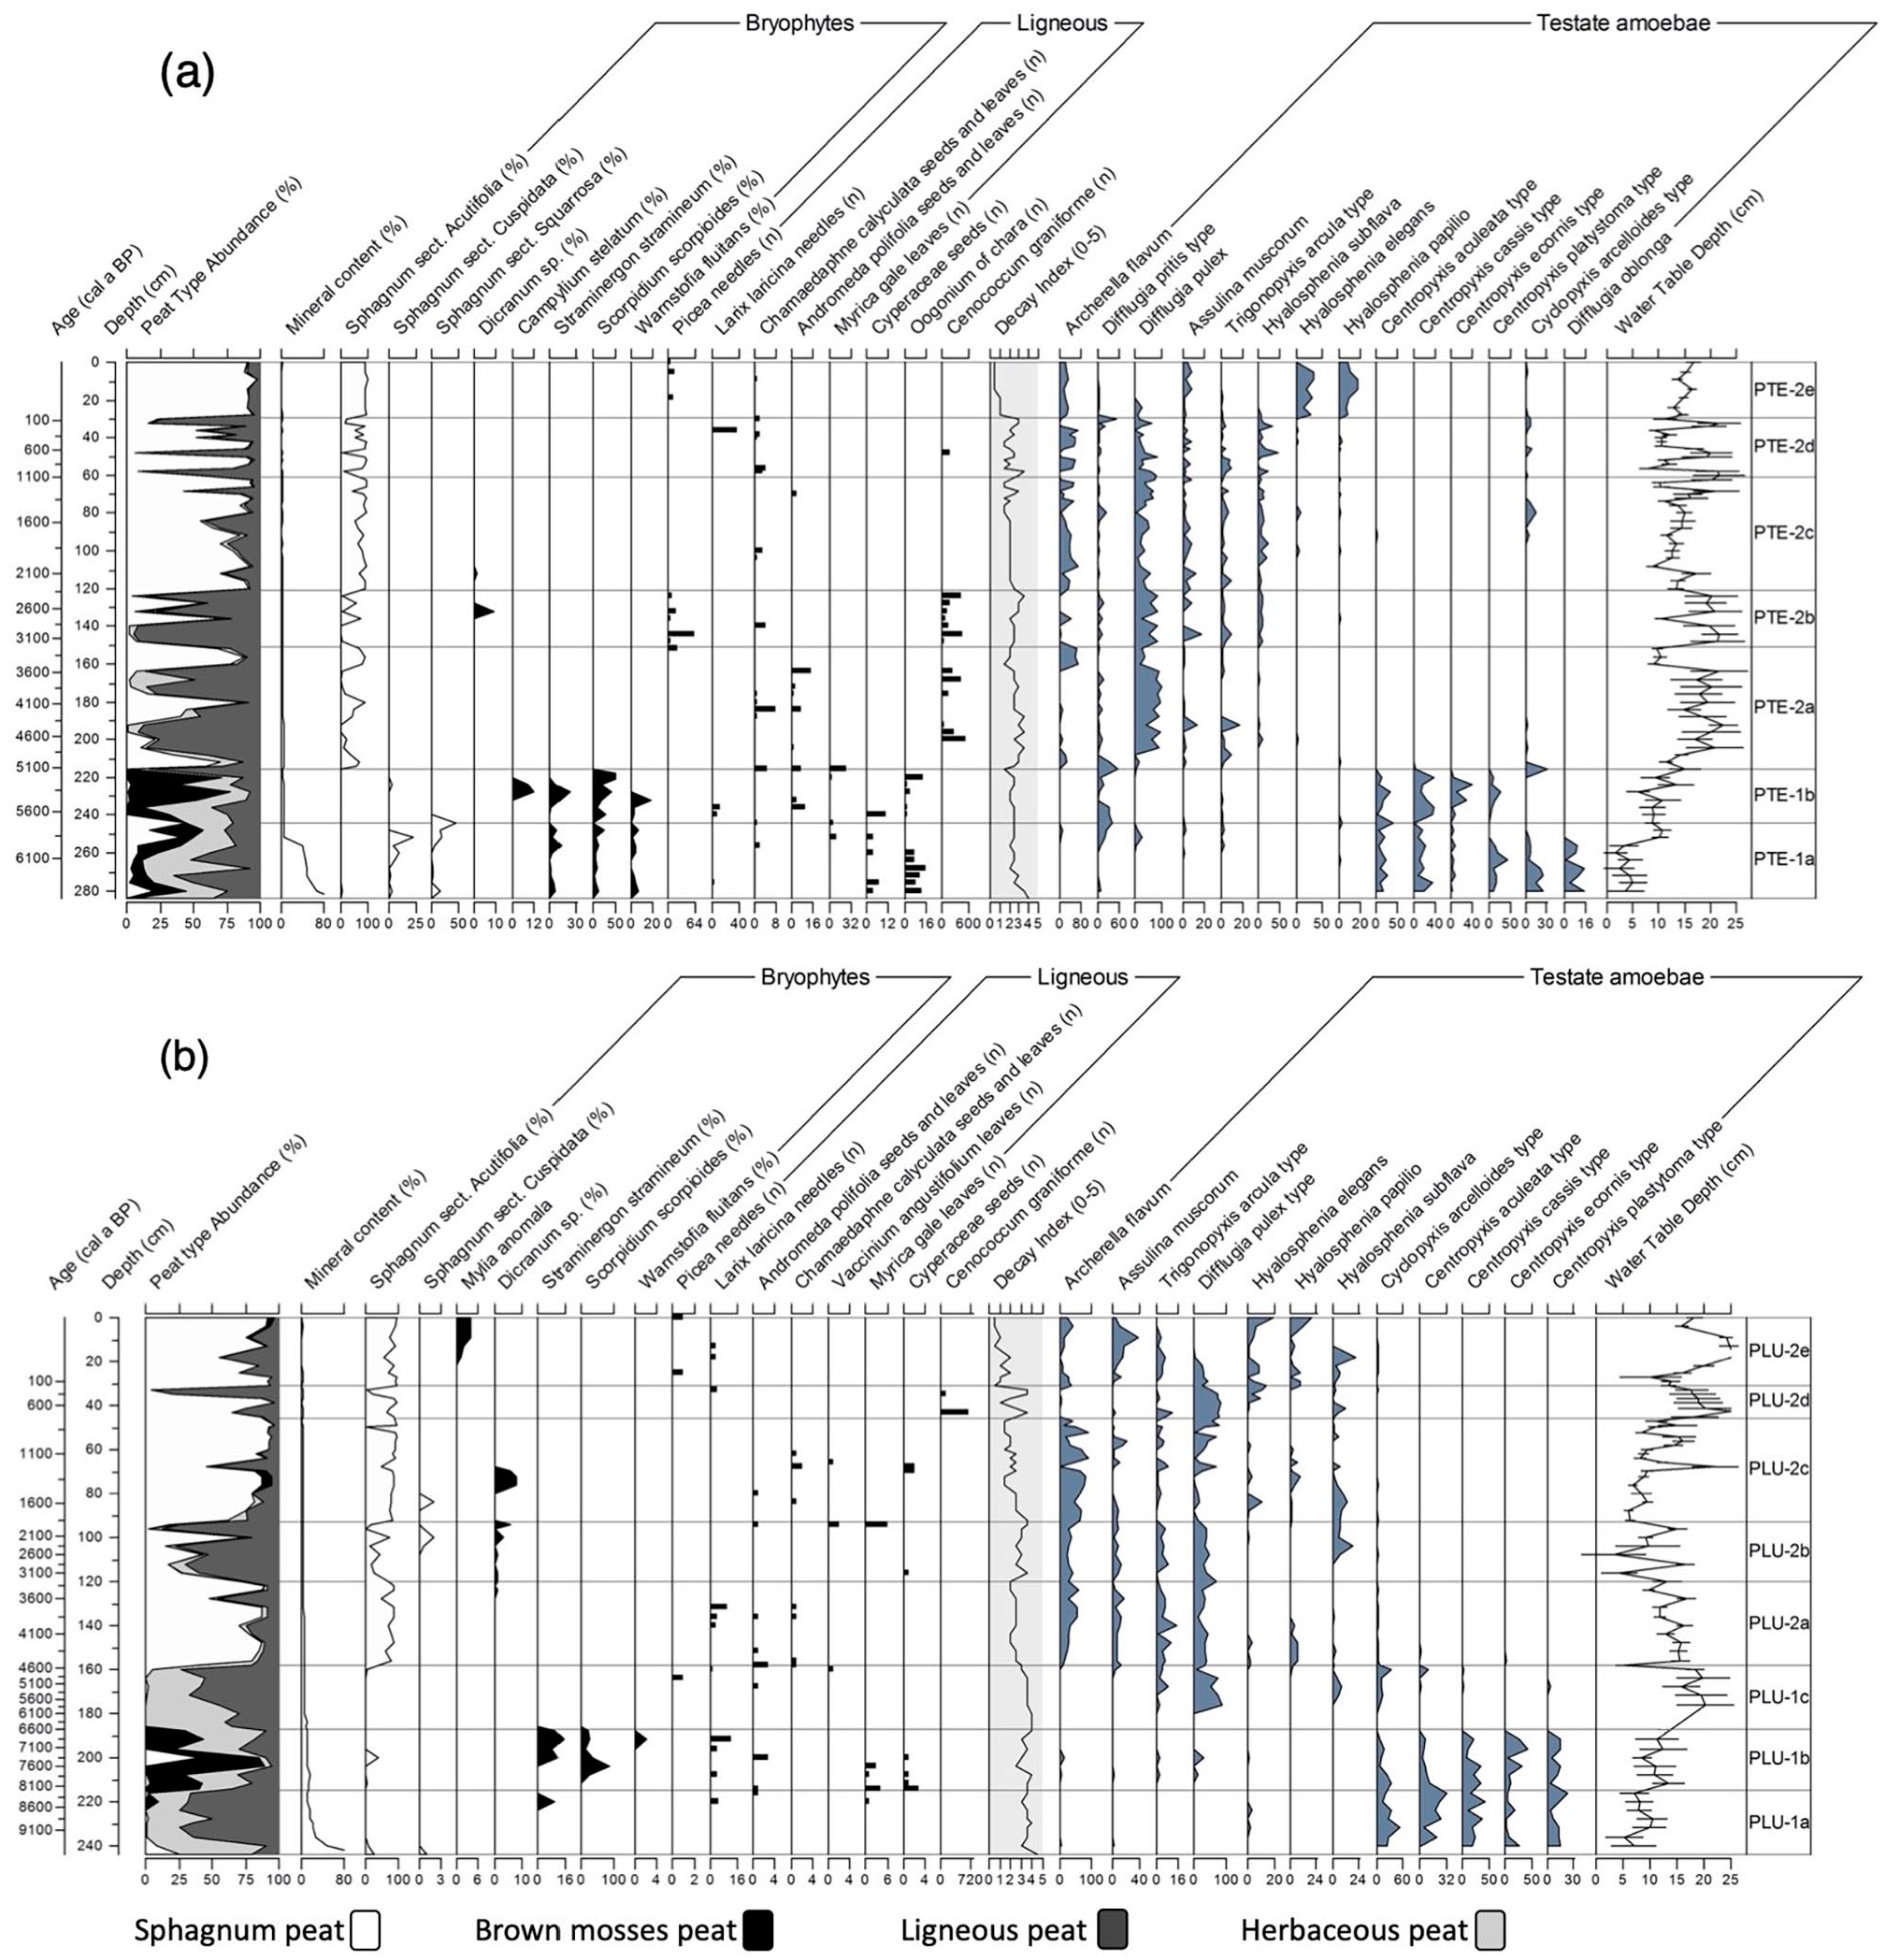
Plant macrofossil abundance (%) and count (n), testate amoeba assemblages (%) and inferred water table depths for PTE (a) and PLU (b).
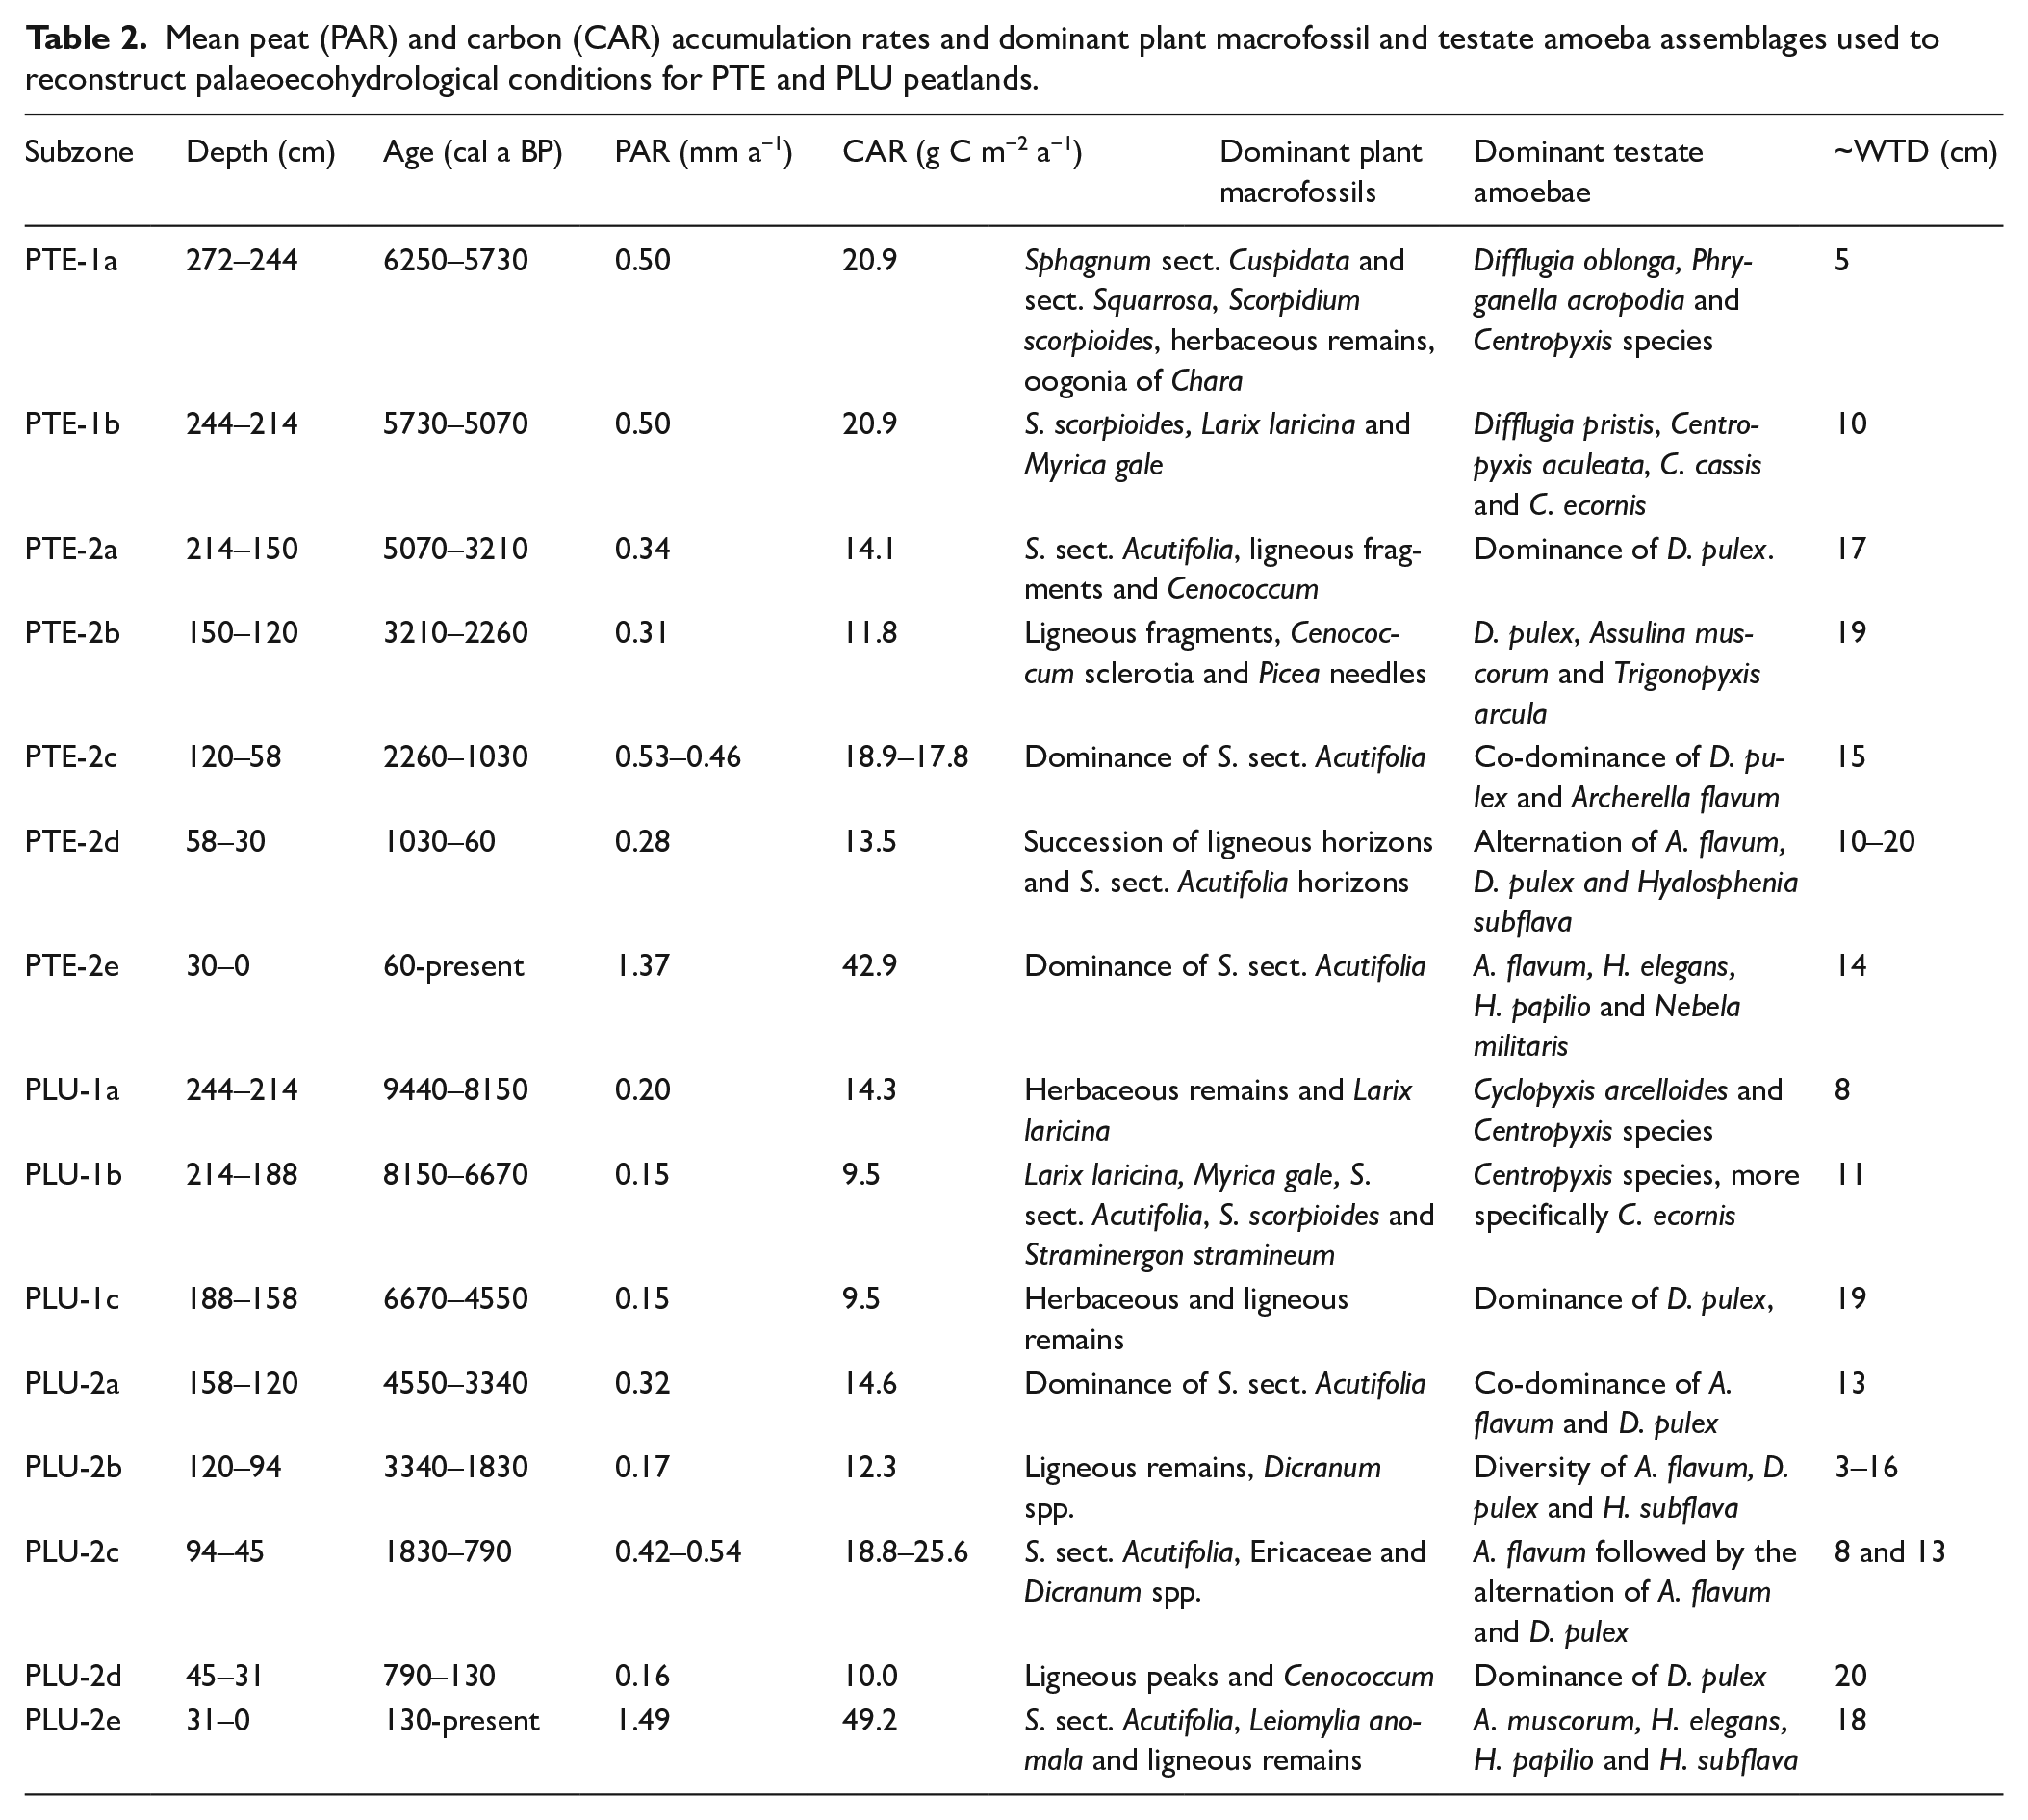
Mean peat (PAR) and carbon (CAR) accumulation rates and dominant plant macrofossil and testate amoeba assemblages used to reconstruct palaeoecohydrological conditions for PTE and PLU peatlands.
Pluvier – Peat began to accumulate around 9440 cal a BP under poor fen condtions and a silty till matrix, in which very decomposed herbaceous and ligneous plant remains were identified (PLU-1a and PLU-1c). Between 8150 and 6670 cal a BP, subzone PLU-1b is characterized by a dominance of S. sect. Acutifolia and brown mosses. From 6670 cal a BP (PLU-1c), testate amoeba assemblages suggest a shift from a shallow WTD to a deeper WTD (~19 cm). WTD in peat horizons between 228 and 204 cm should be treated with caution because of low test counts, and the water table could not be inferred between 188 and 180 cm because of the low concentration of tests in highly decomposed peat (Figure 4). At 4540 cal a BP, subzone PLU-2a marks the transition from minerotrophic to ombrotrophic conditions, with a dominance of S. sect. Acutifolia in the vegetation assemblage, and the co-dominance of wet and dry taxa in the testate amoeba assemblages, suggesting an intermediate and fluctuating WTD (Charman, 2007; Lamarre et al., 2013; Sullivan and Booth, 2011). From 1830 cal a BP, there is a shift from highly decomposed (~3) ligneous remains and fluctuating water tables (ca. 3–16 cm) (PLU-2b) to S. sect Acutifolia-dominated peat and shallow WTD (~8 cm). This was followed by a subsequent apparent deepening (~13 cm) of the WTD associated with high PAR between 1210 and 790 cal a BP (PLU-2c). Between 790 and 130 cal a BP, subzone PLU-2d is characterized by the lowest PAR of the whole peat sequence with very decomposed ligneous peaks (~3.5) at 43 and 33 cm where 700 and 130 Cenococcum graniforme D. pulex were counted. The dominance of D. pulex in the testate amoeba assemblages suggests a deep WTD (~20 cm) (Charman, 2007; Lamarre et al., 2013). The upper surface of the core (PLU-2e), corresponding to the acrotelm, is dominated by fresh (~0.5–1) S. sect. Acutifolia peat and a deep inferred WTD (~18 cm).
Ordination of plant macrofossil data
The ordination of the plant macrofossil data shows a significant separation between the reconstructed zones. The PCA also shows some clear relationships between plant macrofossil assemblages and the environmental variables, similar for the two cores (Figure 5). The cumulative variance explained by axis 1 and 2 is 83.4% for both PTE and PLU. In the PCA for each peatland, the main axis of variance (Axis 1) reflects a trophic gradient correlated with mineral content, dry bulk density and decay. On the right side (higher PCA axis 1 scores), rich minerotrophic communities dominated by brown mosses, herbaceous plants and Sphagnum sect. Squarrosa and sect. Cuspidata are associated with high mineral content. On the left side (lower PCA axis 1 scores), low values of dry bulk density and of mineral content show a transition to nutrient-poor ombrotrophic conditions expressed by Sphagnum sect. Acutifolia. The water table depth variable is mainly correlated with Axis 2, especially for PLU, where wet taxa dominated by Sphagnum and brown mosses are found at the top, while dry taxa characterized by ligneous plants are located at the bottom of the ordination space.
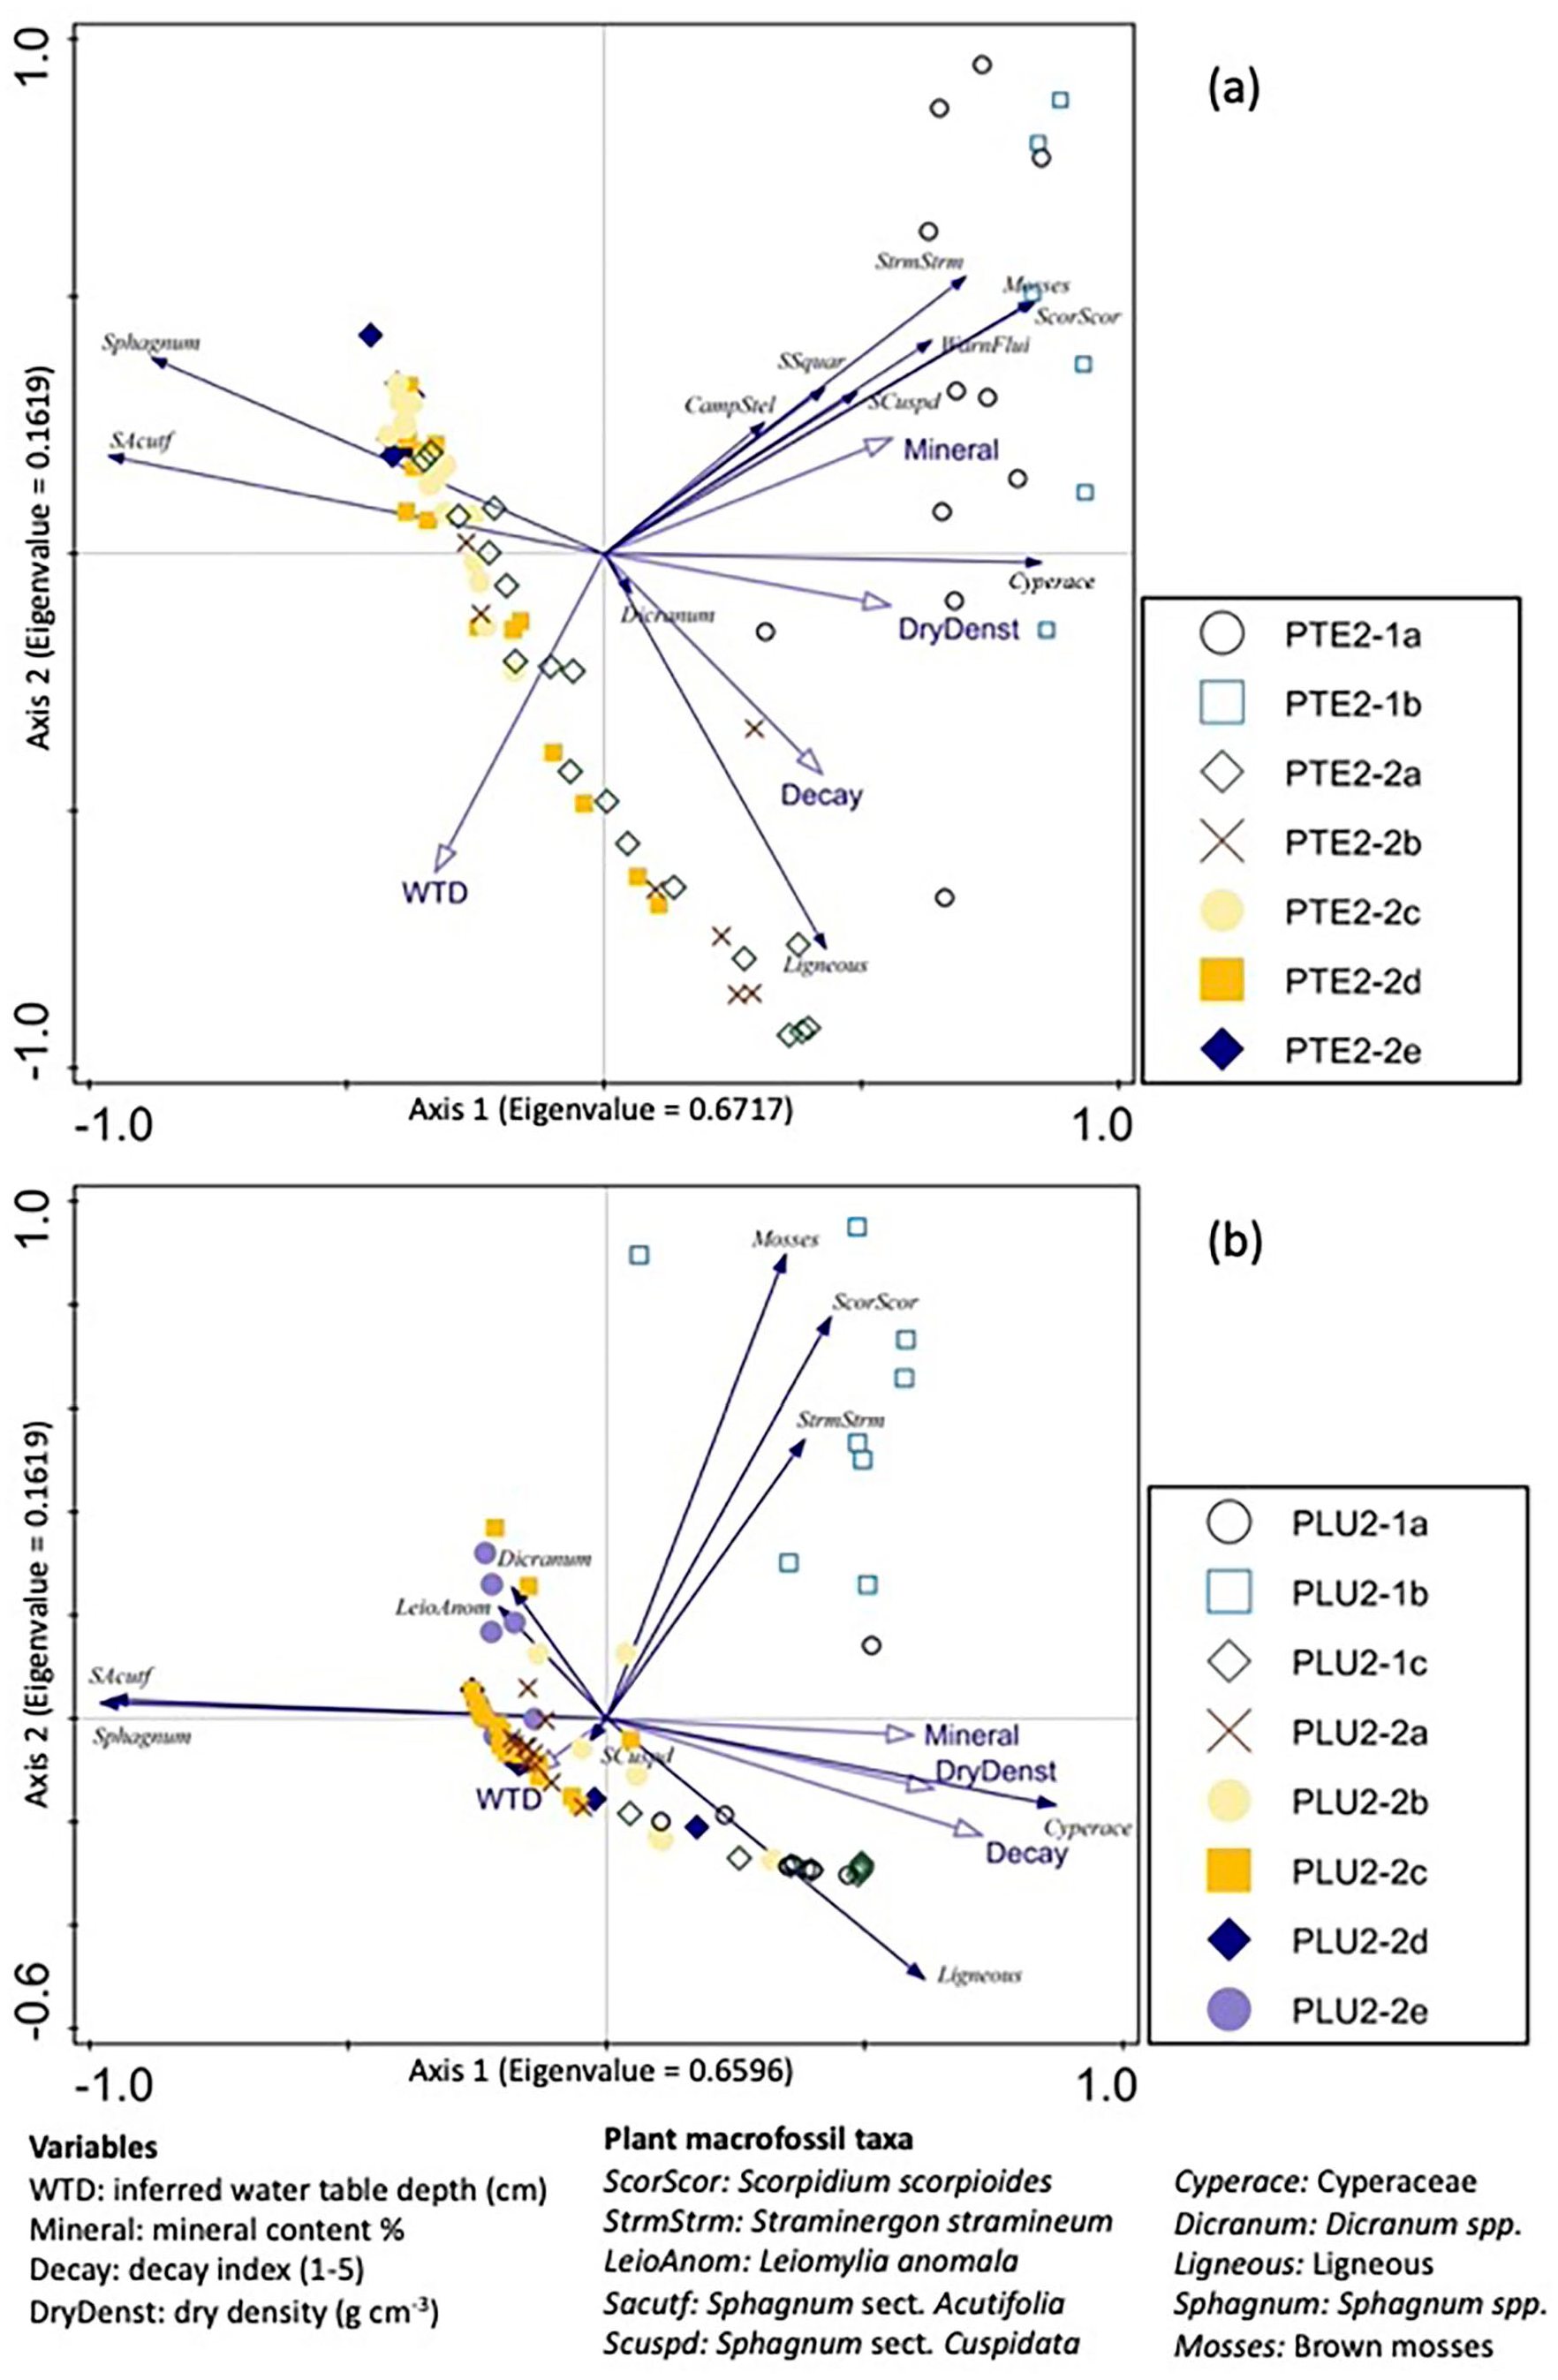
Triplots of PCA axis 1 and 2 of plant macrofossil assemblages showing the taxa ordination of taxa and samples for PTE (a) and PLU (b). Variables are passively fitted in the ordination.
Discussion
Influence of trophic status, site exposure and incident solar insulation on peat and C accumulation
The LORCA values for PTE and PLU (16.8 and 13.3 g C m−2 a−1 respectively) are slightly lower than those recorded in peatlands on the North Shore of the GSL (16.0–45.7 g C m−2 a−1; Magnan and Garneau, 2014a; Primeau and Garneau, 2021), the mean values for the province of Quebec (26.1 g C m−2 a−1; Garneau et al., 2014) and for global northern peatlands (22.9 g C m−2 a−1; Loisel et al., 2014). The LORCA values of the two studied peatlands could differ according to their trophic status, as observed in the plant macrofossil assemblages and PCAs (Figures 4 and 5). Despite a peat inception at PLU more than 3000 years before PTE, the LORCA and mean PAR for PLU are lower than those at PTE. Although the minerotrophic sections can have greater net primary production and high PAR, they also register faster decay rates which result in low net PAR, as recorded at PLU (Loisel et al., 2014, 2017).
The low LORCA and PAR values in both peatlands may also be in part attributed to the site exposure to strong NNE winds, which may have reduced winter snow cover and promoted frost penetration and persistence in the peat surface horizons (Friesen et al., 2021). Compared to PTE, the more exposed PLU peatland recorded more fluctuating PAR, varying between 0.16 and 0.54 mm a−1 from 9440 to 150 cal a BP. As PTE is surrounded by a forested fringe, snow cover may have been more important than at PLU, thus insulating the peat surface and supporting less harsh conditions expressed by the less variable accumulation rates. Lead-210 activity and inventory are also twice as high at PTE than at PLU, supporting the hypothesis of a less exposed peat surface due to greater snow accumulation, hence more stable hydrological conditions, resulting in greater peat and 210Pb accumulation (Du et al., 2015).
Furthermore, at PTE and PLU, testate amoeba assemblages were composed of D. pulex, H. subflava and A. muscorum, suggesting drier and variable WTDs (Sullivan and Booth, 2011), probably influenced by frost. Increased soil frost exposure is highly limiting for large testate amoeba species while smaller species are more resistant (A. flavum, A. muscorum, D. pulex; Jassey et al., 2016). The inferred WTD is consistent with the hypothesis of frost penetration and persistence, resulting in highly decomposed ligneous peat during a period where climate conditions were associated with cooler temperatures. The frost penetration likely reduced peat growth and carbon accumulation in these coastal peatlands. This effect would be particularly likely during cooler episodes (as shown in Magnan and Garneau, 2014a), when a negative NAO index would have generated cold and dry winter winds in southeastern Canada (Figure 6a).
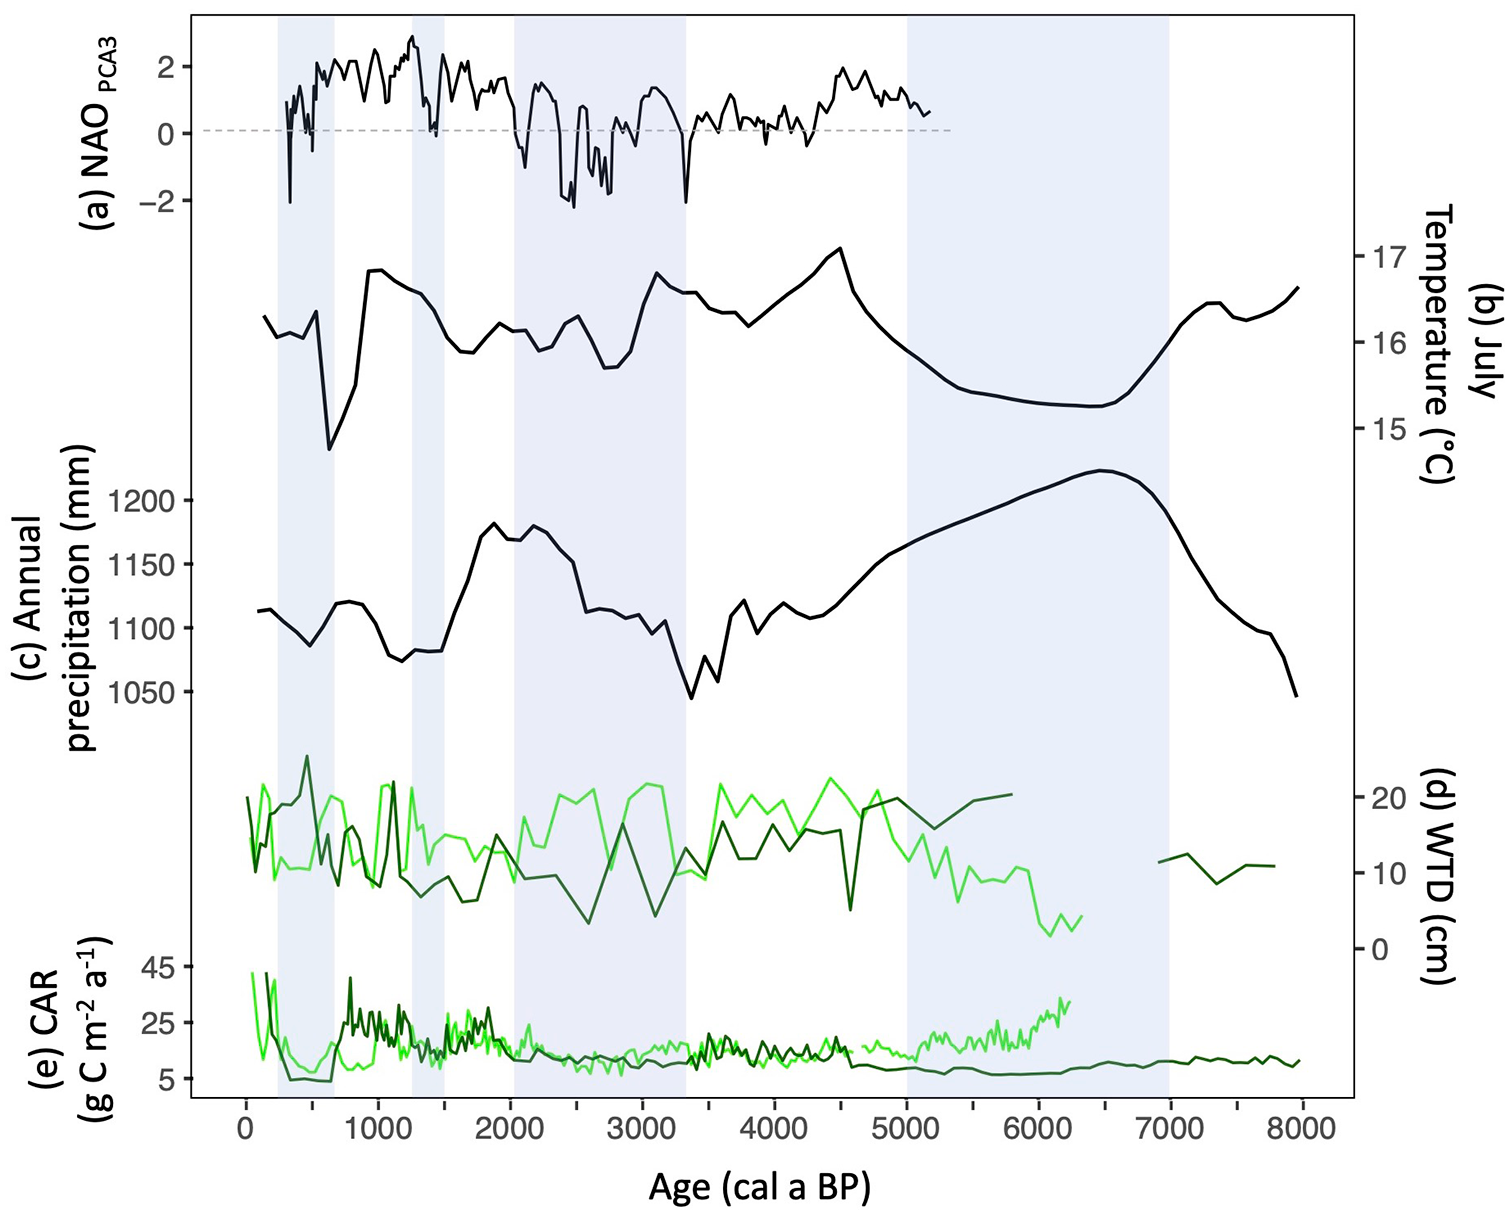
(a) Inferred NAO index (Olsen et al., 2012). (b) Mean July Temperature (Sauvé, 2016). (c) Total annual precipitation in Observation peatland (Sauvé, 2016). (d) Water Table Depth with a smoothing (span of 0.05) in ggplot (this study). (e) Carbon accumulation rates with a smoothing (span of 0.05) in ggplot (this study). PTE (light green) and PLU (dark green). Blue zones correspond to documented cooler periods.
The lower LORCA values recorded in maritime peatlands compared to continental peatlands may also be explained by a shorter summer incident solar radiation due to frequent foggy and cloudy conditions (Fréchette et al., 2021). During summer seasons, large air-sea thermal contrasts between the persistent cold winter SST and the warming air masses can induce water vapour condensation generating fog. Through the Holocene, colder episodes led to cold SST and longer sea-ice cover duration in opposition to warmer episodes associated with shorter sea-ice cover allowing warmer summer SST (Dhahri, 2010; Wu et al., 2022).
Influence of atmospheric and oceanic processes on terrestrial palaeoecohydrological records in the GSL region
Early to mid-Holocene (9500–5000 cal a BP)
Following the final retreat of the residual ice sheet on Anticosti at ca.14 200 cal a BP (Dalton et al., 2020), peat inception of PLU at 9440 cal a BP and the initial plant colonization on the Island at 9500 cal a BP (Lavoie and Filion, 2001) was delayed due to persistent cold conditions and likely related poor soil development. The proximity of the LIS on the North Shore of the GSL generated katabatic winds that maintained cold and dry climatic conditions during the Younger Dryas (Dalton et al., 2020; Lavoie and Filion, 2001). This cold interval may also be the result of a large flux of glacial meltwater from the LIS and of freshwater from proglacial Lake Agassiz-Ojibway drainage via the St. Lawrence River into the GSL, thus causing a decrease in SST and an increase in sea-ice cover duration (Levac, 2003; Levac et al., 2015). These conditions would have resulted in a prolonged atmospheric cooling in the coastal region of the GSL and delayed the development of the regional vegetation (Fréchette et al., 2021).
While internal peat dynamics and the limestone bedrock likely played a role in maintaining minerotrophic conditions, climatic factors also exerted a clear influence. While warmer (+1.5°C) July temperatures, estimated at 16.5°C, were reconstructed on Anticosti between 8700 and 7100 cal a BP (Sauvé, 2016), cooler July temperatures (15.5°C) and wetter conditions (~1150 mm a−1) were reconstructed between 7500 and 4800 cal a BP (Figure 6d and e; Sauvé, 2016). During this period, the dominance of colder waters off the coast of Newfoundland would have driven decreasing local air temperatures, resulting in decreasing evapotranspiration and leading to wetter conditions in peatlands (Blundell et al., 2018). In the GSL, these cold SST may have favoured persistent foggy and cloudy conditions that reduced summer incident solar radiation (Fréchette et al., 2021). The combined influence of cooler air temperature, shallow WTD and reduced solar radiation probably influenced the persistence of minerotrophic conditions in PLU and PTE due to less favourable growing season conditions (Figure 6b–d).
Mid- to late-Holocene (5000–3300 cal a BP)
The timing of the fen-bog transition in PLU and PTE (4540 and 5070 cal a BP respectively), as well as those reconstructed from peatlands on the North Shore of the GSL (4560 and 4750 cal a BP; Primeau and Garneau, 2021; Pratte et al., 2017) points to a climatically-induced trophic transition in the region. In these peatlands, trophic transitions, characterized by a shift to Sphagnum-dominated peat (Hughes and Barber, 2003; Loisel et al., 2014), occurred within a period of ca. 500 years, associated with favourable hydroclimatic conditions in the GSL region. From 5000 to 3100 cal a BP, pollen-based July temperatures show warmer conditions (~16.5°C) on Anticosti (Figure 6b; Sauvé, 2016). Also, a zonal circulation (+NAO) characterized by southwesterly winds to eastern Canada (Jessen et al., 2011; Olsen et al., 2012) could have favoured an increase in winter precipitation, thus insulating the peat and supplying soil moisture conditions at the beginning of the growing season. Reconstructions suggest moderately wet conditions at PLU during this period, with testate amoeba assemblages dominated by H. elegans, H. papilio and A. flavum (Figures 4b and 6d), the latter suggesting relatively stable environmental conditions (Sullivan and Booth, 2011). The warmer mid-Holocene period with stable hydroclimatic conditions (Garneau et al., 2014) probably influenced Sphagnum sect. Acutifolia growth (Figure 4) in the studied peatlands, thus insulating the peat surface from groundwater contributions, and promoting the observed trophic transition (Loisel et al., 2017).
Late-Holocene (3300–150 cal a BP)
From 3340 to 1830 cal a BP (PLU) and 3210–2260 cal a BP (PTE), WTD records suggest fluctuating climate conditions, marked by possible episodes of frost aggradation and thaw within the two studied peatlands. The highly variable WTD at PLU and dry surface conditions inferred at PTE (Figure 6d) were also recorded by Magnan and Garneau (2014b) and Primeau and Garneau (2021) on the North Shore of the GSL. This is supported by a decreasing July air temperature reconstructed on Anticosti (Sauvé, 2016) and the transition from a mixed forest with thermophilous trees to a Picea/Abies-dominated boreal forest around 3000 cal a BP in the eastern part of the island (Lavoie and Filion, 2001), both suggesting a cooling corresponding to the Neoglacial. This cooling was likely enhanced by an atmospheric circulation forcing and a positive ocean feedback in the North Atlantic region, as identified by Renssen et al. (2006), with the coldest period between 2800 and 2600 BP (2900–2700 cal a BP). From 3000 cal a BP, in parallel with colder SST in the GSL (Dhahri, 2010), the transition to a meridional atmospheric circulation (–NAO; Jessen et al., 2011; Olsen et al., 2012; Figure 6a) may have favoured cold and dry winds from the Arctic to the GSL. The longer-lasting decomposed ligneous peat and the significant slowdown of net peat and carbon accumulation rates recorded at PLU may have been influenced by these cold winds considering the exposition of the sites (Figures 3 and 4). Conversely, increasing peat surface moisture was recorded for the same period in Prince Edward Island and Newfoundland, possibly due to the meridional circulation favouring more winter storm tracks with increased precipitation in these regions (Blundell et al., 2018; Peros et al., 2016).
From 2260 to 790 cal a BP, rapid peat accumulation of Sphagnum sect. Acutifolia and moderately wet WTD at PTE and PLU (Figure 6d and e) suggest favourable growing seasons. This is supported by an increase in July temperatures (+1.5°C warmer than present-day; Sauvé, 2016). This period corresponds to the Roman Warm Period (RWP; 2250–1400 cal a BP; 300 BCE – 550 CE; Wang et al., 2013) and the Medieval Climate Anomaly (MCA; 1000–700 cal a BP; 950–1250 CE; Mann et al., 2009), and has registered warmer SST in the GSL (Dhahri, 2010; Wu et al., 2022) under a positive NAO index, allowing for mild and wet southwesterly winds over eastern Canada (Figure 6a; Olsen et al., 2012).
These warming periods with high CAR were interrupted by reduced accumulation in both peatlands between 1500 and 1250 cal a BP (Figure 6e), probably affected by the cold episode of the Late Antique Little Ice Age (LALIA) between 1414 and 1290 cal a BP (536–660 CE; Büntgen et al., 2016). This cooling in the North Atlantic region is also associated with the Dark Ages Cold Period (DACP; 1550 to 1185 cal a BP; 400–765 CE) as suggested by Helama et al. (2017). During this cooling event, the NAO tended to be negative, resulting in more frequent incursions of cold and dry Arctic winds to eastern Canada (Olsen et al., 2012), which likely drove greater frost penetration and duration through the peat.
From ca. 800 cal a BP, PLU and PTE recorded their greatest decrease in PAR and CAR. While PLU recorded its driest conditions, WTD at PTE were variable, likely driven by a succession of frost aggradation and thaw episodes. Sauvé (2016) reconstructed cold July temperatures on Anticosti (15°C) between 800 and 150 cal a BP (Figure 6b), in response to the decrease in solar radiative forcing during the LIA period (Mann et al., 2009). The LIA cooling was suggested as a transition to a negative NAO, favouring the penetration of cold and dry winds in eastern Canada (Figure 6a; Olsen et al., 2012). An increase in dust fluxes, associated with an increase in storm events and the influence of sub-arctic winds was also identified by Pratte et al. (2017) in the GSL.
Recent ecohydrological changes (150 cal a BP to the present day)
From 180 and 150 cal a BP respectively, CAR values for PTE and PLU show an apparent increase due to the less-decomposed peat in the acrotelm. In contrast to the drying of oceanic peatlands in Europe related to a decrease in precipitation (Swindles et al., 2019), our results show that the apparent decrease in WTD is probably caused by rapid vertical peat accumulation (Swindles et al., 2012) promoted by relatively stable precipitation since 1950 CE (Supplemental Figure S1, available online). Even if these RERCA values are apparent, they show, for the same time period, lower values than those reconstructed in other regions from eastern Canada (133.09 to 147.07 g C m−2 a−1; Lamarre et al., 2012; 142.7 g C m−2 a−1; Primeau and Garneau, 2021; 77.3–87.7 g C m−2 a−1; this study). These differences may be explained by the recent warming that is amplified in high-latitude regions (Warren and Lulham, 2021), as an increase in GDD0 (Supplemental Figure S1, available online) and a recent warming of surface and deep-water temperatures also recorded in the GSL region (Genovesi et al., 2011; Thibodeau et al., 2013; Wu et al., 2022) along with a decrease in sea-ice cover (Environment and Climate Change Canada, 2021).
Conclusion
Our study showed that the development of the two maritime peatlands located on eastern Anticosti Island were sensitive to the climatic variations amplified by the atmospheric and sea-surface conditions in the GSL region. Despite a temporal difference of a few millennia for peat initiation (9440 and 6250 cal a BP), the transition to ombrotrophic conditions around 5000 and 4500 cal a BP was almost synchronous between the two sites. A dominance of Sphagnum sect. Acutifolia, with high peat and carbon accumulation rates and relatively wet conditions were influenced by warmer conditions as suggested by their occurrence during the mid-Holocene and other reported Holocene warm periods (RWP, MCA). These episodes were characterized by longer growing seasons favoured by an increase in air temperature and incident solar insolation combined with a zonal atmospheric circulation (+NAO). In contrast, PLU and PTE recorded dry surface conditions and low peat accumulation during the Neoglacial and the LIA cold periods. A meridional atmospheric circulation (−NAO) favouring the incursion of cold and dry Arctic winds in eastern Canada, combined with cold SST and longer sea-ice cover duration, accentuated the cooling episodes, promoting frost penetration and duration within the peat horizons of Anticosti peatlands but also in several other records in eastern Canada. In addition to the significant wind exposure, growing season in maritime peatlands could have been affected by lower incident solar insolation due to fog episodes caused by high thermal contrasts at the atmosphere-sea interface. The harsh maritime conditions may also explain the lower LORCA and RERCA values recorded in this study compared to other continental peatlands in eastern Canada. These results show the sensitivity of maritime peatlands to some climate variations reinforced, as in this study, by a strong connection with atmospheric conditions, and to a lesser extent, by the GSL sea-surface conditions.
Supplemental Material
sj-docx-1-hol-10.1177_09596836221095978 – Supplemental material for Climate-driven Holocene ecohydrological and carbon dynamics from maritime peatlands of the Gulf of St. Lawrence, eastern Canada
Supplemental material, sj-docx-1-hol-10.1177_09596836221095978 for Climate-driven Holocene ecohydrological and carbon dynamics from maritime peatlands of the Gulf of St. Lawrence, eastern Canada by Léonie Perrier, Michelle Garneau, Steve Pratte and Nicole K Sanderson in The Holocene
Footnotes
Acknowledgements
We would like to thank Jérémie Maillé Bizier for his help during the field campaign and Gabriel Magnan (UQAM) for his invaluable assistance in analyzing and interpreting results. Thanks also to Joannie Beaulne, Camille Girard, Pénélope Germain Chartrand and Guillaume Primeau for their constant help and support. Thank you to Guillaume Dueymes and Philippe Gachon (Centre ESCER, UQAM) providing the ANUSPLIN climate data. We are also grateful to Dr. Thomas P. Roland and an anonymous reviewer for their constructive comments on earlier versions of the manuscript.
Funding
The author(s) disclosed receipt of the following financial support for the research, authorship, and/or publication of this article: Funding was provided by the Natural Sciences and Enginnering Research Council of Canada (NSERC–DG 250287) to Michelle Garneau. Scholarship to Léonie Perrier was provided by the Fonds de recherche du Québec – Nature et technologies (FRQNT).
Supplemental material
Supplemental material for this article is available online.
References
Supplementary Material
Please find the following supplemental material available below.
For Open Access articles published under a Creative Commons License, all supplemental material carries the same license as the article it is associated with.
For non-Open Access articles published, all supplemental material carries a non-exclusive license, and permission requests for re-use of supplemental material or any part of supplemental material shall be sent directly to the copyright owner as specified in the copyright notice associated with the article.