
Abstract
Alluvial landscapes have long been considered optimal locations for Neolithic settlement because of the availability of water and nutrient-bearing silts. However, the dynamics of these landscapes have often been underestimated in relation to the interactions of precipitation, temperature and vegetation at catchment scale, along with flow and geomorphic processes in the channel and adjacent areas. In this paper we employ a multi-method approach to model the alluvial landscape around Çatalhöyük in central Turkey to develop a more nuanced understanding of the potential interactions between the Neolithic population and its environment. Starting from detailed sedimentological reconstructions of the area surrounding the site, we use climate and vegetation proxies to estimate past climate scenarios. Four temperature and five precipitation scenarios and two vegetation endmember scenarios were constructed for the Neolithic. These scenarios are coupled with a stochastic weather generator to simulate past flows using the HEC-HMS rainfall-runoff model. Impacts and extents of past flooding are then estimated using bankfull flow estimates from the modelled time series. The model results suggest that crops at Çatalhöyük were less vulnerable to flooding than has previously been supposed, with flooding spread more evenly through the year and with relatively unerosive flows. Spatial variability suggests a range of wet and dry conditions would have been available at different times of the year near the site. Interannual and decadal variability was important and so resilience against drought is also a significant consideration and so subsistence patterns must have been resilient to this variability to enable the settlement to continue for over a millennium. This interpretation of the riverscape of Neolithic Çatalhöyük as a mosaic of wet and dry conditions is compatible with the range of plant and animal remains excavated from the site.
Introduction
Archaeologists have considered alluvial landscapes to be preferred locations for Neolithic occupation due to the essential resources they provide for early agricultural communities (Sherratt, 1980; Van Andel and Runnels, 1995). These conceptual models have typically been based on a static perspective of the alluvial landscape as being a provider of water and of fertile silts. This view contrasts with the dynamic relationship between climate – temperature as well as precipitation – vegetation cover and the local topography that drives the nature and extent of flow within a river channel and the effects that they might have on the adjacent floodplain. This set of interactions makes alluvial landscapes extremely sensitive and responsive to change in any of these parameters over seasonal, interannual, decadal and longer timescales, with impacts on the human occupation of the floodplain. Understanding the dynamism of these riverscapes is critical for evaluating the establishment and sustainability of human settlement, and Neolithic populations may have been particularly sensitive in this respect.
Years of excavation and palaeoenvironmental work at the Neolithic setllement of Çatalhöyük in central Anatolia has provided a wealth of information on the adoption of early agriculture and increasing social complexity (Hodder, 1996, 2021; Mellaart, 1962). The landscape around Çatalhöyük has been the focus of geoarchaeological investigations for several decades (Ayala and Wainwright, 2020; Ayala et al., 2017, 2021; Boyer et al., 2006; Roberts et al., 1996, 1999, 2007) producing an evolving picture of the nature of the Çarşamba River during prehistory. The changing interpretations of how the river flowed and sculpted the landscape has produced different interpretations as to the potential of various land-use models (Charles et al., 2014; Roberts and Rosen, 2009). Interpretations of Neolithic land-use practice in the vicinity of the tell site has been driven by interpretations of the nature, location and development of the alluvial landscape (e.g. Charles et al., 2014; Roberts and Rosen, 2009; Rosen and Roberts, 2005; Sherratt, 1980). Initial theories of floodplain or decrue agriculture (Sherratt, 1980) during the Neolithic in which floodplain soils were sought after for their humidity and self-mulching properties were later contested (Roberts, 1991) and replaced by interpretations of an environment dominated by extensive and long-lasting spring flooding which would have rendered much of the local environment unable to support crops (Roberts and Rosen, 2009; Rosen and Roberts, 2005). These previous interpretations have since been developed and contested through a high-resolution investigation of the sedimentary sequence in the immediate vicinity of the site that have proposed an alternative interpretation of the river system and its sequence (Ayala et al., 2017, 2021). The new data allow for a more nuanced investigation of the river system through integration of a broad range of datasets to enable a reconstruction of the river system through time and space and the effects that it would have had on the occupation of the floodplain that the previous static models did not allow.
This paper focusses on the reconstruction of the Neolithic riverscape of the Çarşamba River; the way it was experienced by the local inhabitants as well as the rôle it plays in unlocking our interpretations of this pivotal moment in human history in relation to the onset of agriculture and the emergence of dense centres of population. In this paper we aim to build on the latest phase of geoarchaeological investigation (Ayala et al., 2017, 2021) through palaeohydraulic modelling of the Çarşamba River during the Neolithic. These models enhance our palaeoenvironmental reconstruction of the landscape surrounding Çatalhöyük by modelling the way that the river would have behaved and therefore how it could have been experienced by the Neolithic occupants. This approach requires us to address issues of climate variability and change coupled with the way in which they interact with change in fluvial systems which makes estimates of palaeohydrology even more difficult to establish. The modelling approach requires the integration of interdisciplinary evidence from archaeology, geomorphology, sedimentology and climatology. We argue that a holistic approach to palaeohydrology in this way is necessary for interpreting the human use of riverscapes in the past.
Material and methods
Çatalhöyük is located in Konya Province in central Anatolia in Turkey at 37°40′1″N, 32°49′41″E (Figure 1). It was occupied from 7100 to 5600 BCE (Bayliss et al., 2015; Hodder, 2021; Orton et al., 2018). Here we focus on reconstructing the environment contemporary with the Neolithic settlement of the East Mound at Çatalhöyük, ending around 5950 BCE. Site occupation is described by Hodder (2021) as occurring in the following continuous phases: Early (7100–6700 BCE), Middle (6700–6500 BCE), Late (6500–6300 BCE) and Final (6300–5950 BCE).
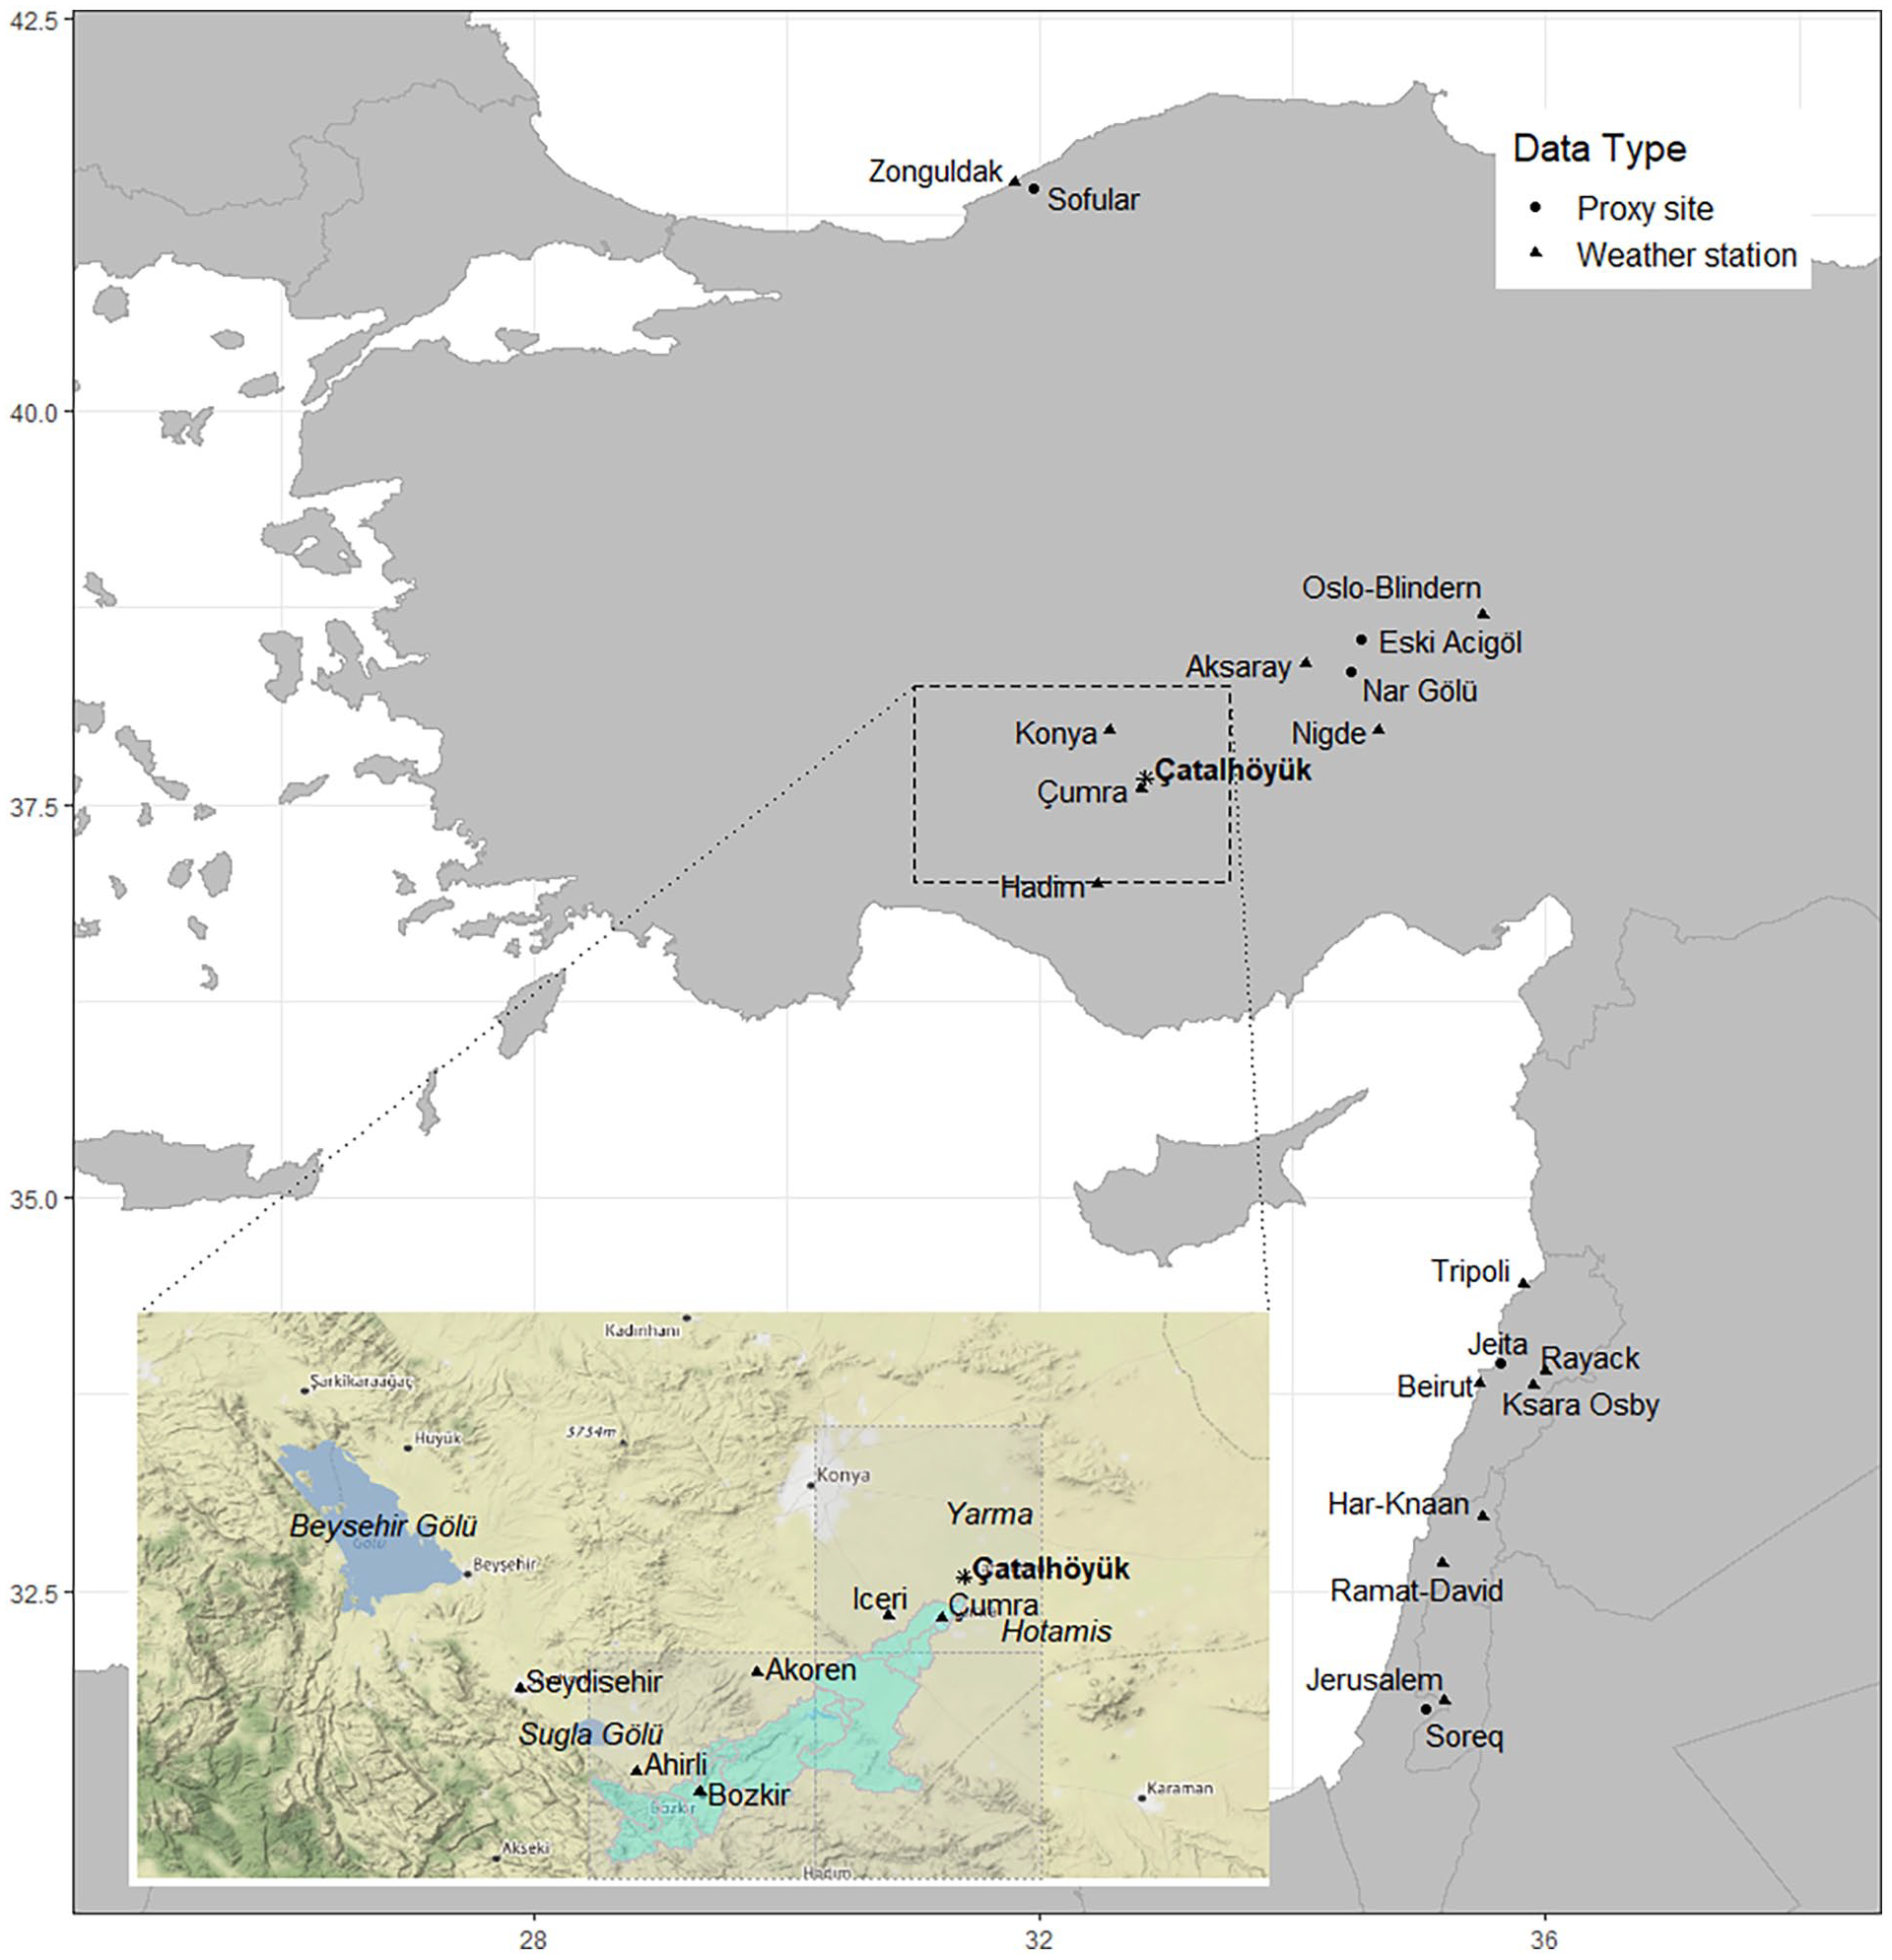
Location of the study site. Main map shows locations of proxy sites and weather stations used to estimate past climate changes. Inset shows locations of weather stations used to develop the stochastic weather model for parameterizing the Çarşamba basin changes through time. The catchment outline is shown (see Figure 10 for more details of flow-monitoring stations), and the grey boxes are the CRUTS grid boxes used in parameterizing the links between the regional proxies and local responses. Other places mentioned in the text are shown in italics.
The current climate is hot arid steppe (BSh) in the Köppen-Geiger classification (Climate Change and Infectious Diseases Group, 2019), with hot, dry summers and cold winters typical of a continental régime. Using the CRU-TS 4.1 0.5° gridded data for the 1961–1990 baseline period (Harris et al., 2014), the mean annual temperature is 10.3°C in the upper part of the catchment, 11.0°C in the middle part of the catchment and 11.4°C in the lower part of the catchment (Table 1). Conversely, mean annual precipitation decreases from 599 to 480 mm and 350 mm when moving from the upper to the lower part of the catchment. Instrumental data from Hadim suggest that precipitation in the upper, non-instrumented parts of the catchment are significantly higher. Convective rainfall is common, and peak daily rainfall of 58.7 mm has been recorded at Bozkır and 51 mm at Çumra. Çatalhöyük sits in one of the lower parts of the Konya basin, which is endorheic and covers an area of 53,850 km2. The presence of a lake in the basin in the Pleistocene (Roberts, 1983) means that these lower areas in the immediate vicinity of the site have very low relief: the plain surrounding the site is at approximately 1009 m asl, compared to the lowest points of the basin at c.999 m asl about 32 km to the north.
Modern-day climate statistics and extremes.
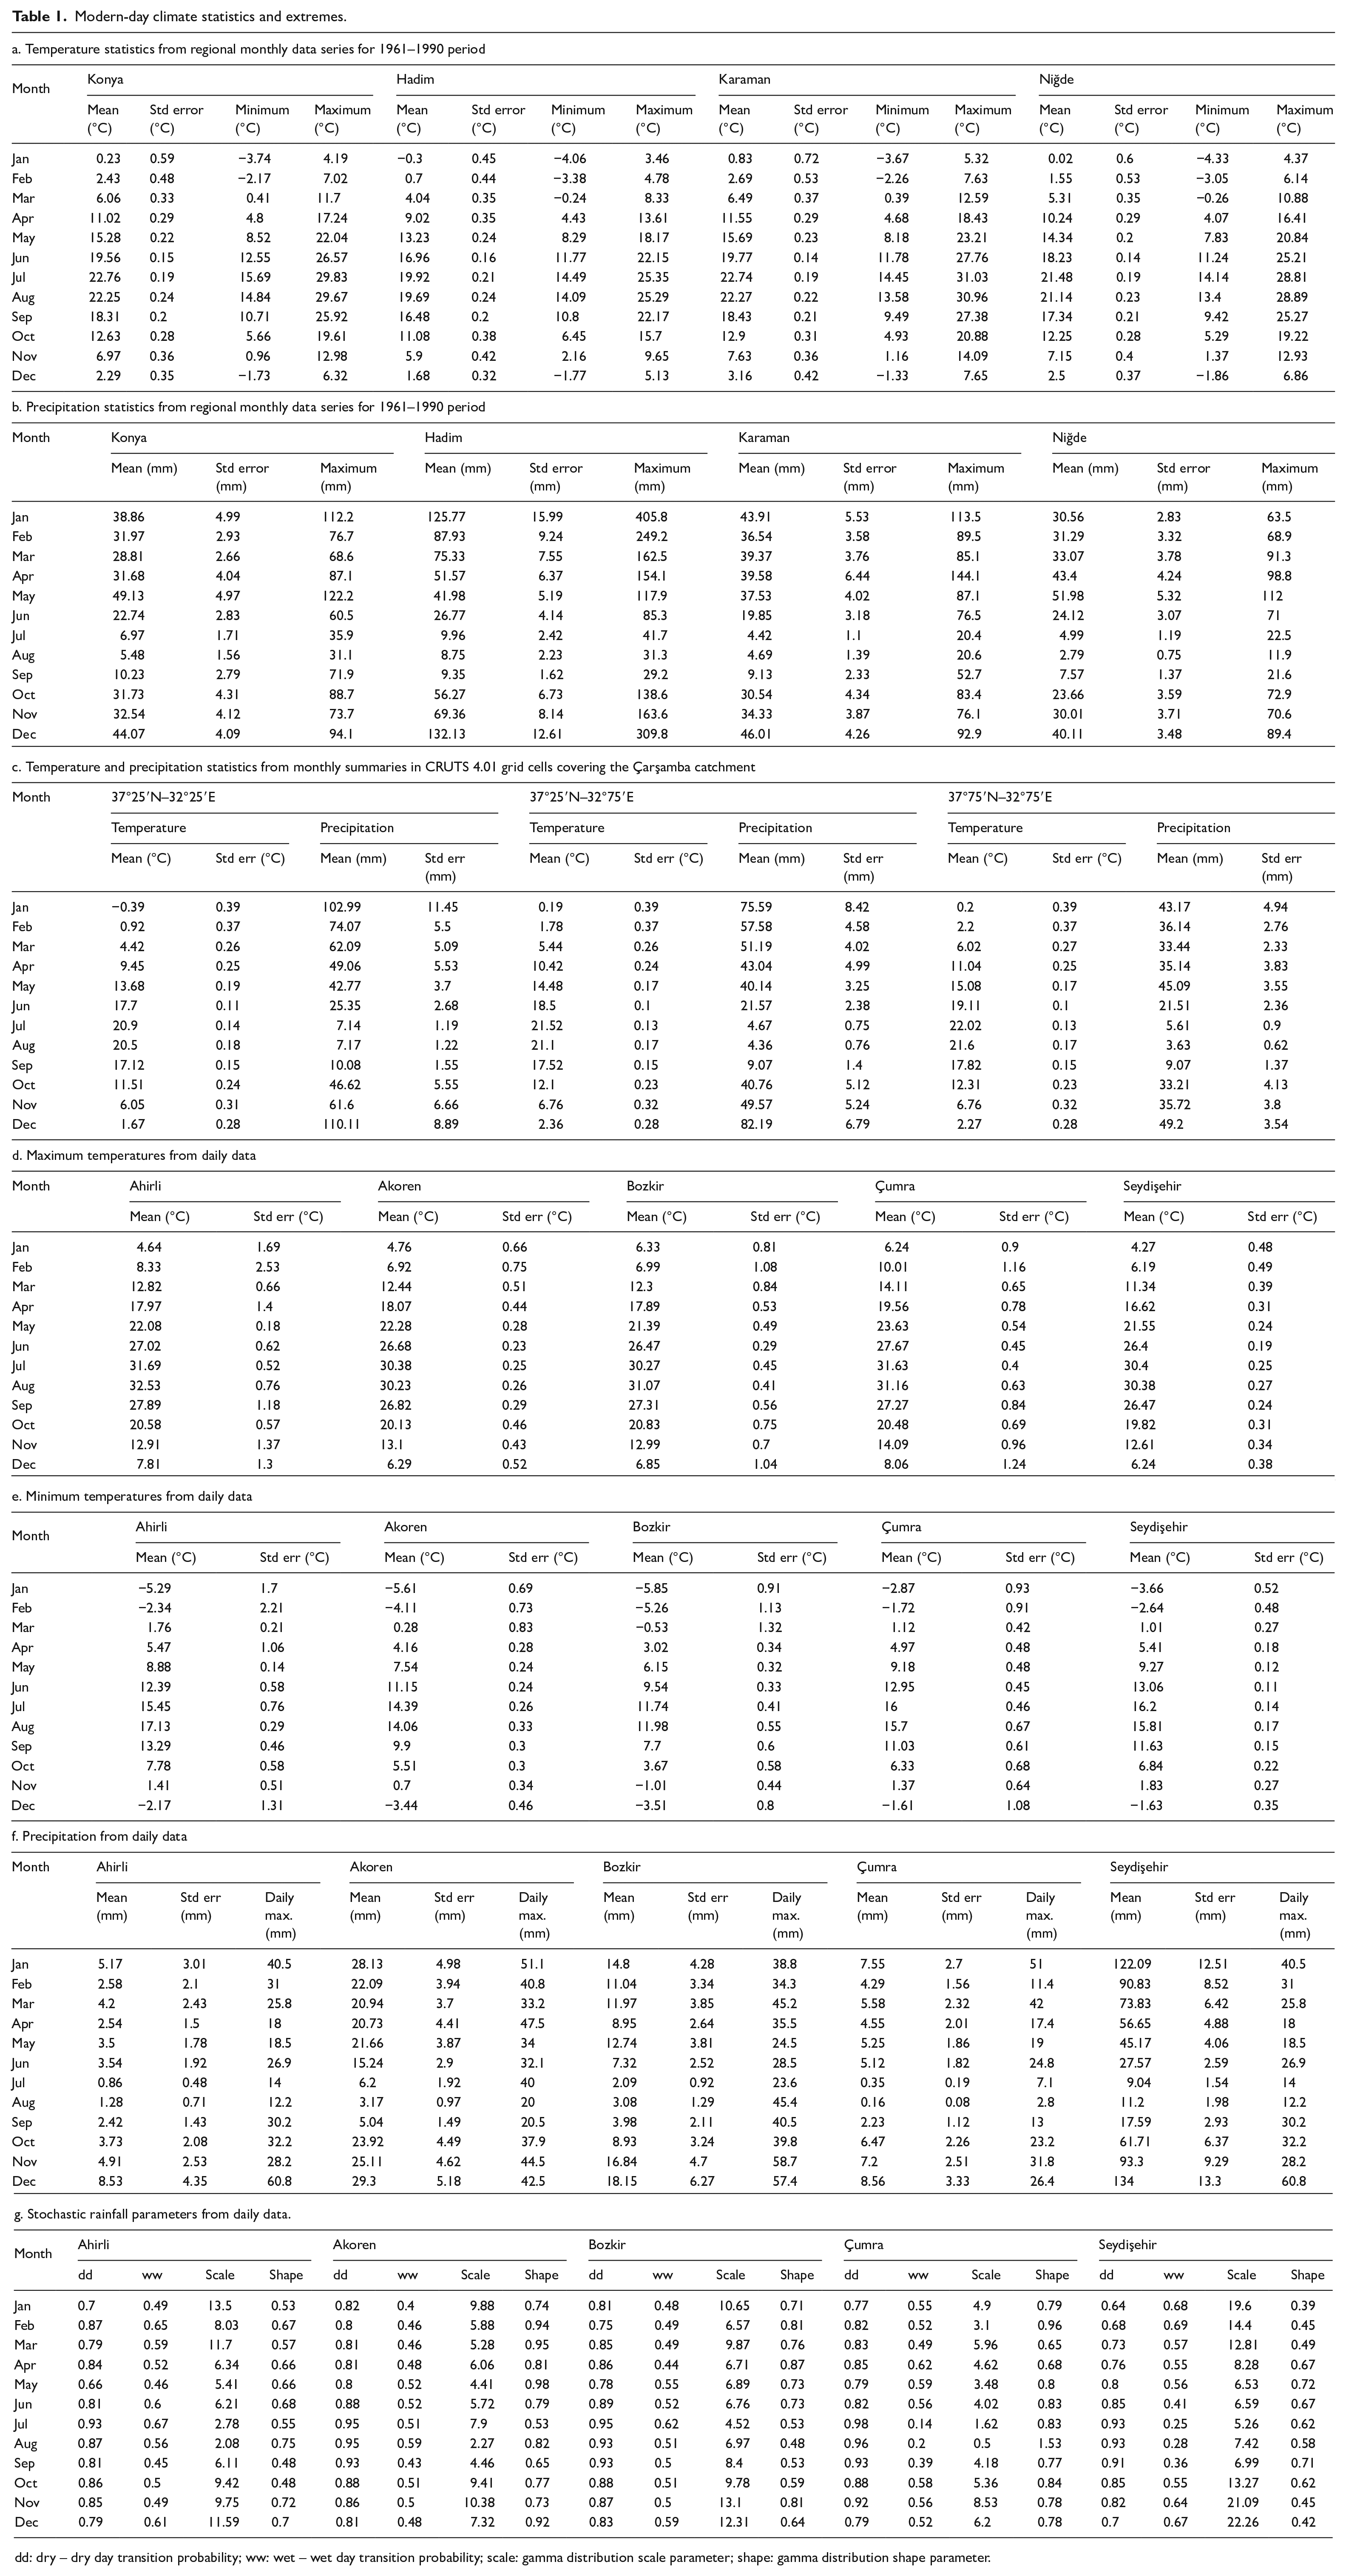
dd: dry – dry day transition probability; ww: wet – wet day transition probability; scale: gamma distribution scale parameter; shape: gamma distribution shape parameter.
The River Çarşamba is the biggest of the six larger rivers (catchments ⩾60 km2) flowing into the Konya Basin. It is currently heavily channelized and modified. The present main branch of the lower river runs in a concrete channel to the west of the archaeological sites at Çatalhöyük. It was diverted to this current position in the 1960s from its previous course running between the East and West Mounds, although earlier 20th Century maps suggest some variability in the exact course of the channel. The catchment is elongated and runs broadly from the SW to the NE, with its highest elevations at 2,481 m in the Taurus Mountains. With the elevation changes, the middle part of the catchment is in the warm temperate with hot, dry summers (Csa) classification and the upper part of the catchment is warm temperate with warm, dry summers (Csb; Climate Change and Infectious Diseases Group, 2019).
In the central reaches of the catchment, the river runs through a sinuous gorge up to 35 km long and 250 m deep. The gorge is interpreted as a karstic cave system developing in the later Pliocene to early Pleistocene, forming a gorge with the collapse of the cave roof during the Pleistocene (Öztürk, 2006). During the Late Pleistocene the gorge permitted overflow from the Lake Beyşihir–Suğla basin based on the analysis of heavy minerals in the Konya Basin (De Ridder, 1965), but the latest major episode of an overflow seems to relate to a Lake Beyşehir highstand at around 25–21 ka bp (Roberts, 1983; Zahno et al., 2009). Bildirici (2000) states that in wet years there were later overflows into the Çarşamba from Suğla leading to intermittent drainage issues, although Altuntaş (2000) noted that droughts frequently caused drought and famine in the Konya basin. Erdoğru (2010) suggests a ‘great canal’ was in existence in 1530 to take water into the Çarşamba from the Lake Beyşihir–Suğla basin to provide water to villages in the Konya basin. It possibly fell into disuse as there were later several unsuccessful attempts from 1796 to the end of the 19th Century to divert water into the Çarşamba to mitigate droughts, until finally in 1908 the Ottoman-Anatolia Railway Company was awarded a contract for 19.5 M French Francs to construct a 217-km long canal connecting the Çarşamba directly to Lake Beyşehir (Altuntaş, 2000; Bildirici, 2000). This canal was completed in 1912 and has a capacity of 22.4 m3 s−1, so that from this time the flows of the lower part of the Çarşamba are significantly modified. Further downstream, the Apa Dam was constructed between 1958 and 1962 to store 0.169 km3 of water to supply irrigation systems in the basin, so that flows reaching Çatalhöyük are now heavily regulated. Modern flow statistics for the area above the modified section are presented in Table 2.
Modern-day monthly flow statistics and daily extremes for DSI stations upstream of the modified sections of the channel.
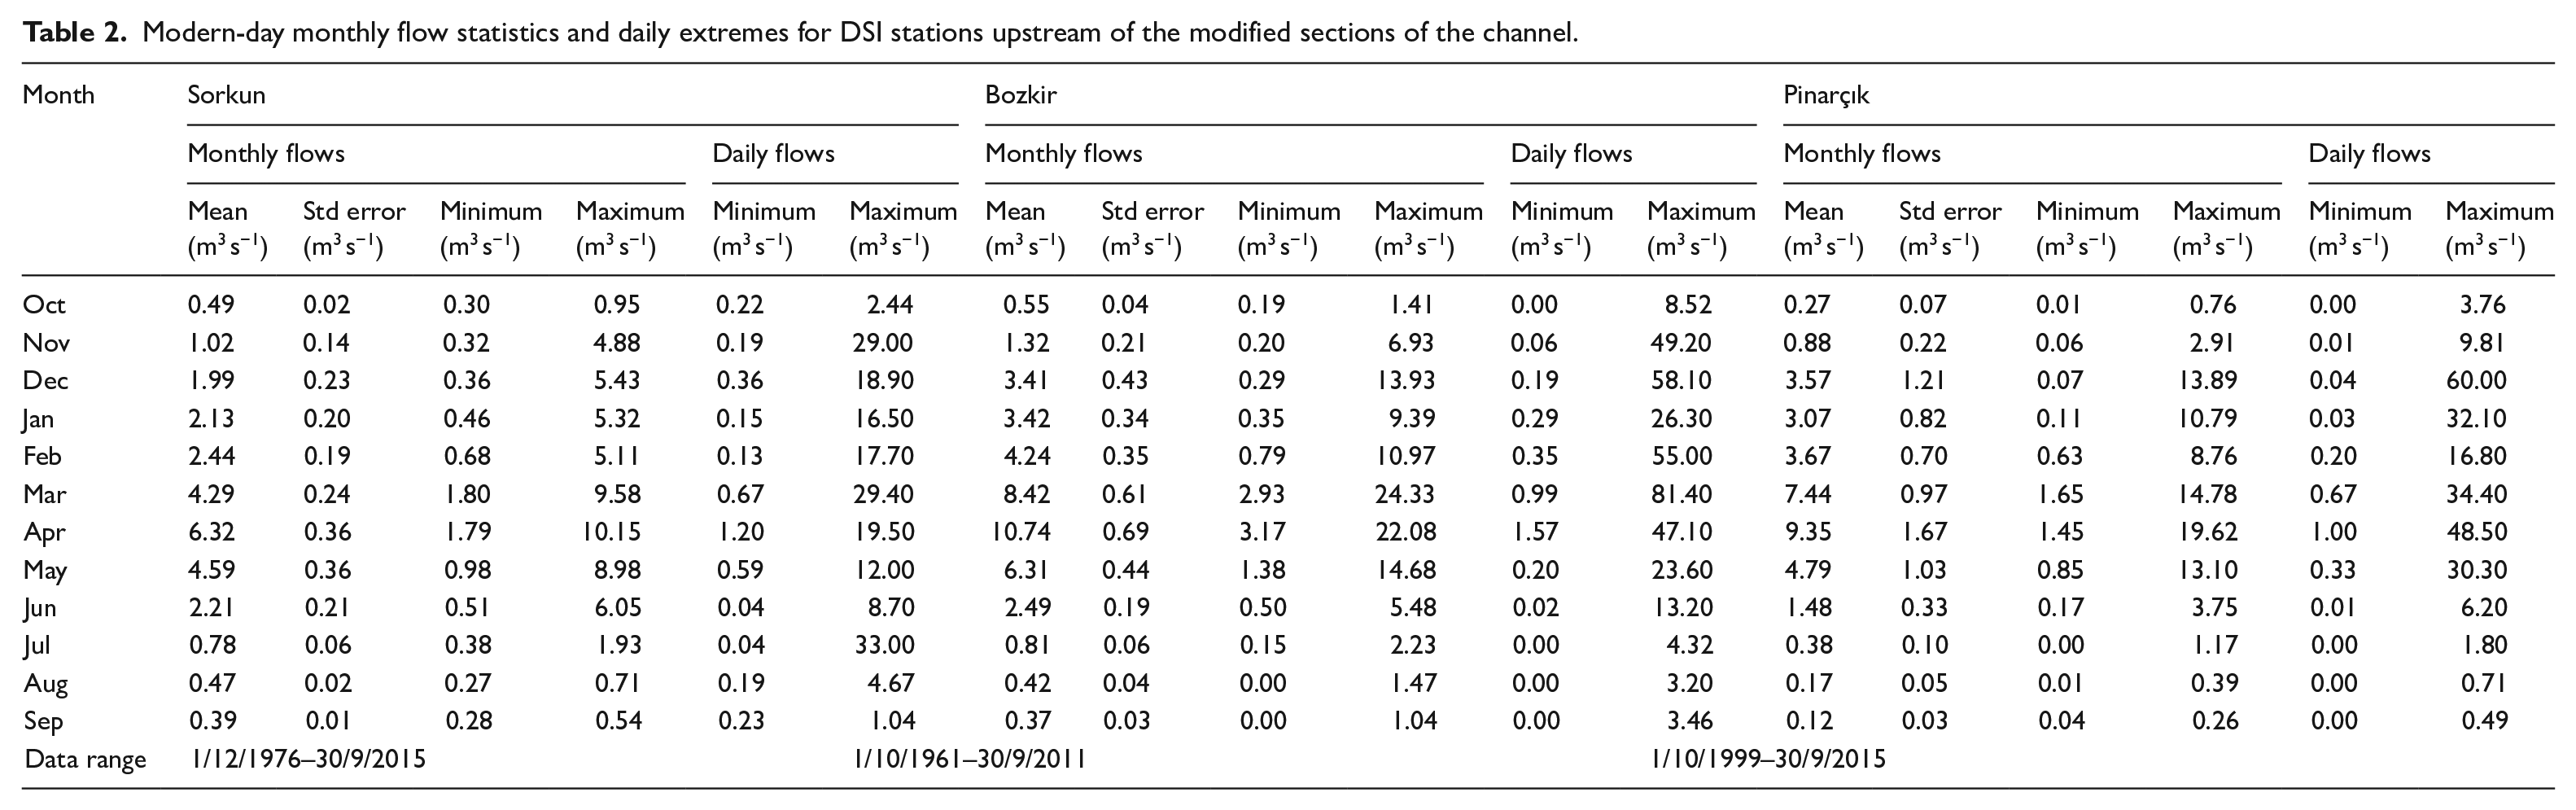
As a result of these modifications, the instrumental record of flows in the Çarşamba catchment are of limited direct use in interpreting the riverscapes of Neolithic Çatalhöyük. We thus use a multi-method approach to combine the reinterpretations of the channel system near to the site in the Neolithic (Figure 2). First, we provide an overview of the reinterpretation of the sedimentology and what it tells us about the past flow dynamics. Secondly, proxies of past climate will be interpreted in relation to the present climate data to develop scenarios of the Neolithic climate of the Çarşamba catchment. To estimate river flow, we employ a process-based modelling approach, so that the third step is to use the characteristics of modern flows, where available, together with instrumental climate data to estimate the catchment parameters. Fourthly, to estimate catchment behaviour in the Neolithic we use modern climate data to produce stochastic rainfall and temperature sequences, and combine them with the past climate scenarios. Fifthly, we use palaeoenvironmental proxies to estimate the potential further effects of past vegetation change on the catchment response. Sixthly, the model is run using the various climate and environmental scenarios to generate estimates of flow within the catchment, but with a particular emphasis on the flow reaching the immediate vicinity of Neolithic Çatalhöyük. The resulting flow estimates are used to provide flood proxies, and hydraulic characteristics of the reconstructed system are used to estimate past high and low flow conditions near to the site and their landscape implications. These conditions are evaluated over multitemporal frameworks, from individual floods through seasonal and interannual variability to decadal and millennial timescales. This approach allows for the model to contribute to the interpretation of different archaeological materials and environmental proxies on site.
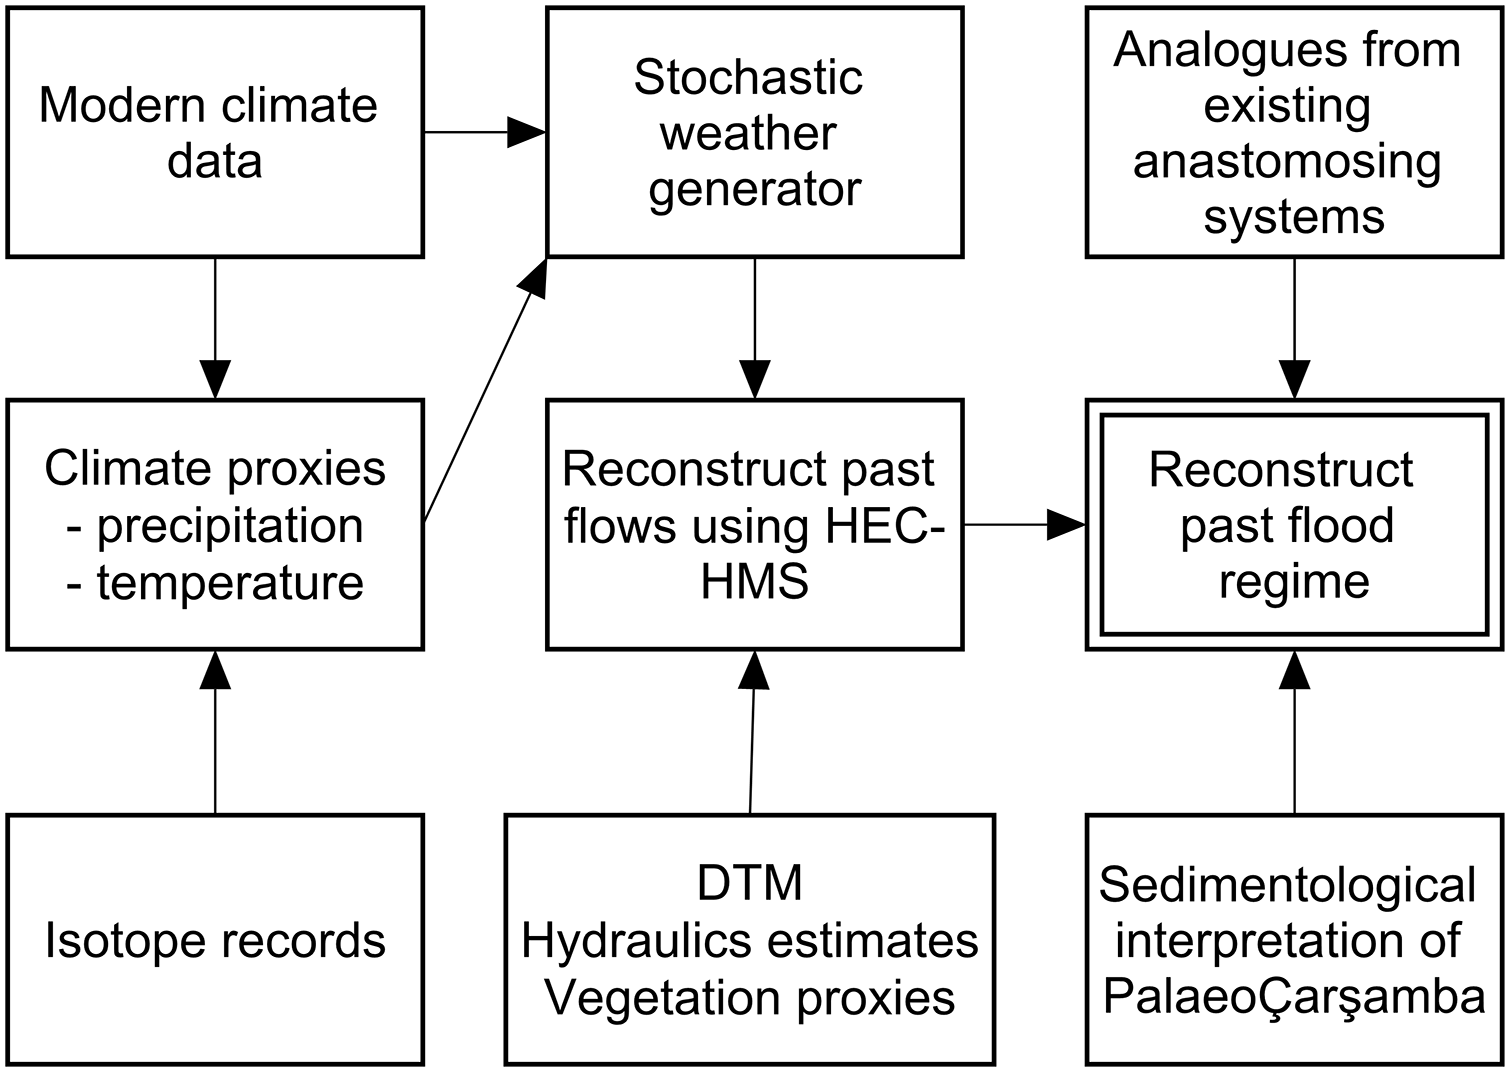
Flowchart of methods and data sources used to reconstruct the past flow régime of the Çarşamba River.
Sedimentology of the Neolithic Çarşamba
The soil survey undertaken by De Meester (1970) has had a long-lasting influence on subsequent studies of the Neolithic Çarşamba (e.g. Boyer et al., 2006; Collins et al., 2018; Roberts et al., 1996, 1999, 2007). De Meester (1970) mapped most of the area as ‘backswamp soils’ despite the location being geomorphologically inconsistent with this term (Charles et al., 2014; Doherty, 2020). Furthermore, the interpretation was based on very sparse data on the depositional environment at depths corresponding to the Neolithic.
To address these issues and provide a more detailed evaluation of the sedimentary history of the tract of the Çarşamba River directly adjacent to the site of Çatalhöyük, an intensive coring programme was carried out within a kilometre of the site (Ayala and Wainwright, 2020; Ayala et al., 2017, 2021) (Figure 3). The results provided further temporal and spatial resolution to the previous KOPal project coring in the vicinity of the site. The new data are compared to the previous coring results both at the site (Boyer, 1999: 65–87) and 16 nearby archaeological sites (Boyer, 1999: 103–165; Boyer et al., 2006: 684, 2007). Correlation of both on-site and off-site descriptive elements and sedimentological results provided an elaboration of the larger scale interpretation of the development of the channel belt.
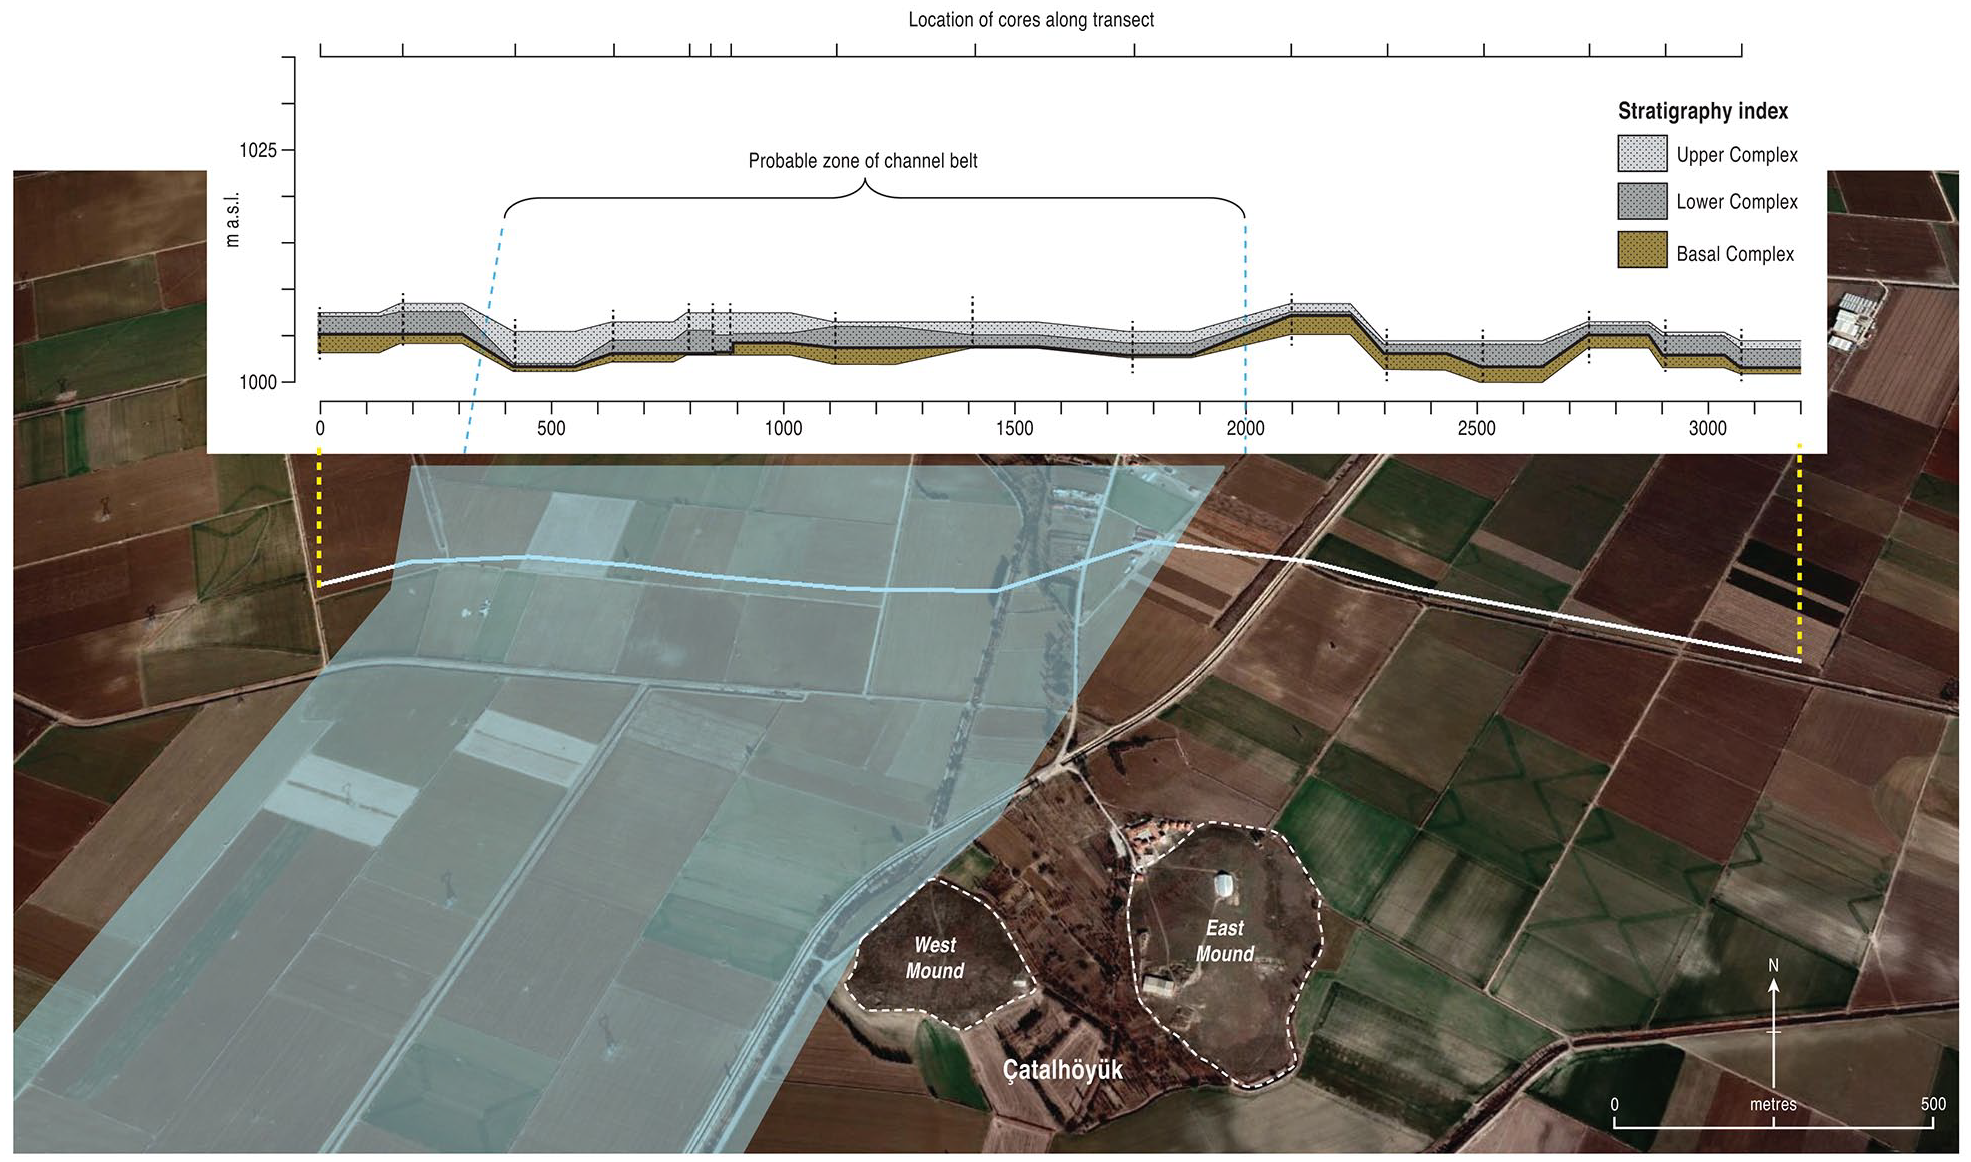
Cross section of the stratigraphy along a W-E transect to the north of Çatalhöyük showing the likely constraint of the channel-belt area between local high points in the pre-existing topography; shaded area on the image shows the likely upstream position of the channel belt in relation to the site (see Ayala et al., 2021, for further details).
Past climate proxies
Proxies were reconstructed for temperature and precipitation where modern data could be used to develop a relation between long oxygen and carbon isotope series and climate parameters. As the isotope sites are at distances of at least 160 km from Çatalhöyük, a further stage was to use relations between the present climate variable at the reconstructed site compared to Çatalhöyük, and to use both relations with a propagated error term to reconstruct the past climate at the site.
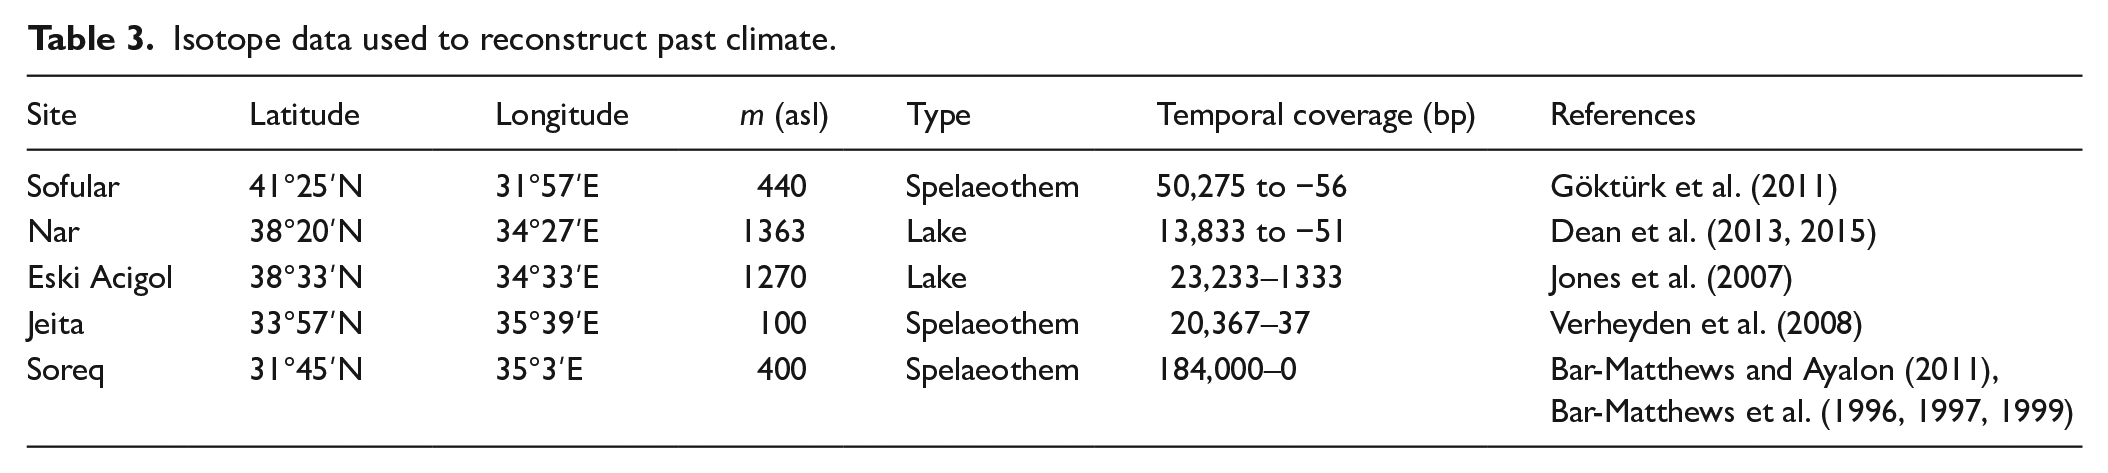
Isotope data are available from three sites in Turkey – Sofular (Göktürk et al., 2011), Nar (Dean et al., 2013, 2015) and Eski Acigol (Jones et al., 2007) – and two in the Levant – Jeita (Verheyden et al., 2008) and Soreq (Bar-Matthews and Ayalon, 2011; Bar-Matthews et al., 1996, 1997, 1999). Details of the sites are in Table 3. Modern precipitation and temperature data were employed from values from local measurements in the original published papers (Bar-Matthews et al., 1997; Dean et al., 2015; Göktürk et al., 2011; Jones et al., 2005), from weather stations included in the CRU-TS4.01 database and the 0.5° reconstructions up to 2016 in CRU-TS4.01 (Harris et al., 2014). These data were also used to evaluate seasonal patterns and interannual variability. Analyses were carried out in R (R Core Team, 2013), and errors propagated using the root-mean square of the model-estimated standard errors.
Isotope data used to reconstruct past climate.
Flow modelling
To estimate flows in the catchment, the HEC-HMS v.4.5 model was used (HEC, 2020). The model has sufficient complexity to cover the range of processes controlling flows in the catchment, while having options for simpler representations of the processes appropriate for the level of data available for parameterization. The SCS-Curve Number approach was used for estimating runoff from daily rainfall, simple surface and canopy models represented storage in each sub-catchment, flow was calculated using the Snyder Unit Hydrograph approach and the simple recession model was used for baseflow. Flow routing was by the Muskingum-Cunge method, with a percolation term defining transmission losses. These losses are significant in the middle reaches of the catchment, so it is important to include them. The Hamon model is used to estimate potential evapotranspiration from air temperature data, and a temperature index method is used to estimate snowfall and snowmelt. Because of the mountainous and continental nature of the catchment, snowfall is a significant form of precipitation in winter months.
The catchment was defined using the 30-m SRTM DTM dataset (NASA JPL, 2014) and the HEC-GeoHMS extension in ArcMap (HEC, 2013). To avoid inclusion of the Beyşehir-Suğla basin and thus be more representative of pre-1530 conditions, an artificial blockage was added to the catchment just upstream of where the Beyşehir-Çarşamba Canal joins the main stem of the Çarşamba River, and flow routing calculated on a filled surface. For the purposes of subsequent analyses, the outflow of the catchment was defined as the location just north of Çumra where the present Çarşamba is split into three main artificial channels. This point is called ‘Çatal Inflow’ in the analysis below, and has a contributing area of 2079 km2. A total of 12 sub-watersheds were identified based on the locations of 11 modern flow-monitoring stations and the Çatal Inflow site (DSI, 2019). The subcatchment delineation using this method provides catchment areas for the upstream subcatchments of Sorkun, Bozkir and Pinarçık that are consistent with the quoted values from the Turkish Hydrology Service (DSI – Devlet Su Işerli).
Rainfall and temperature data for modern conditions are required to calibrate the model and provide parameter estimates for modern conditions that can be used as a basis for subsequent scenarios. Daily data were supplied for sites within and near the catchment by the Turkish Meteorological Service, and these data are summarized in Table 1. Rainfall for each of the subcatchments in the model was allocated using Thiessen polygons. Because of the significant orographic effects, each subcatchment was split into four categories of elevation each representing 25% of the subcatchment area, and precipitation scaled according to a linear model based on the elevations of the observed data using annual averages from Ahırlı, Akoren, Bozkir, Çumra, Içeri and Hadim. Although this model is highly significant (r2 = 0.95, p = 9.4 × 10⁻⁴), there is still a possibility that it underestimates values at the highest elevations (Hadim is at 1509 m asl), and clearly it cannot incorporate any seasonal variability in elevation effects. However, it is critical to include these elevation effects as initial attempts to calibrate the model using just the rainfall at Bozkir (1132 m asl, near the subcatchment outlet) did not estimate the observed runoff event even if all the surfaces were represented as being completely impervious, which is clearly an unrealistic scenario.
Initial parameter estimates for Curve Numbers were based on values in Natural Resources Conservation Service (2004) assuming soils in fair condition, hydrological soil group C, with best analogues from piñon-juniper for uplands and sage grass for lower altitudes in the catchment. For the Snyder Unit Hydrograph, basin lag time was estimated using flow lengths and average catchment slopes as suggested in Natural Resources Conservation Service (2010), with values estimated using the flow routing derived in ArcMap. The peaking coefficient was estimated based on values for ungauged catchments suggested by McEnroe and Zhao (1999). Baseflows from measured data at Sorkun, Bozkir and Pinarçık were estimated using the hydrostats package in R (Bond, 2019), and used to estimate recession coefficients. Channel dimensions were estimated from Google Earth, using visible infilled palaeochannels rather than modified modern channels wherever possible. For a relatively smooth, natural channel a Manning’s n value of 0.03 was assumed throughout.
Calibration for improved parameterization was then carried out using the simplex optimization method in HEC-HMS on multiple parameters. Minimization of the sum of squared residuals proved the best method for approximating both peak flows and total volumes. Some trial and error was found necessary for getting the best joint estimates of the flow and the snowmelt model components, presumably because of the presence of local minima in the optimization surface when all variables were included. Unfortunately, the overlaps in available daily rainfall and daily flow data are relatively short so that calibration was only possible for the Sorkun and Pinarçık subcatchments for the 2014–2015 hydrological year, for Bozkir for 1985–1987. However, this approach did mean that it was possible to identify important spatial variability in parameters.
Stochastic weather generation
To estimate daily temperature and precipitation changes through time, modern data were first used to estimate the parameters of a stochastic weather generator using standard approaches (Wilks and Wilby, 1999). Daily data were available for Ahirli, Akoren, Bozkir and Çumra that were used in subsequent model reconstructions, and they were supplemented by the long sequence from Seydişehir to provide a further boundary condition for the spatial autocorrelation.
Precipitation values were modelled using a first-order Markov chain to estimate transition probabilities from wet to dry days and vice versa (Gabriel and Neumann, 1962), and then using a gamma distribution of daily rainfall amounts to estimate the actual rain falling (Katz, 1977; Stern and Coe, 1984; Thom, 1958). Transition probabilities were estimated using the markovchain package in R (Spedicato, 2017), and the rainfall distributions using maximum likelihood estimators in the fitdistrplus package in R (Delignette-Muller et al., 2020). Daily precipitation was considered independent at the sites for simplicity. Parameter estimates for both the Markov chain and the gamma distribution components of the model were made on a monthly basis to represent seasonal variability.
Minimum and maximum temperature values were estimated as spatially autocorrelated sequences with precipitation as a further controlling variable. The Comprehensive Temperature Generator in the R package RMAWGEN was used for model fitting (Cordano and Eccel, 2019), and optimal model fits identified using the Akaike Information Criterion and normality and seriality tests as suggested by Cordano and Eccel (2016).
Past vegetation proxies
Asouti and Kabukcu (2014) have argued that the early Holocene saw the replacement of steppe grasslands with semi-arid deciduous oak across much of Anatolia. Plant charcoal from Çatalhöyük suggest the presence of tree species close to the site, and Collins et al. (2018) suggest using climate and soils evidence that the trees would be largely riparian in the early Holocene, although their interpretation of the exact locations of the channel areas is based on a simplistic understanding of the De Meester (1970) soils maps (see discussion above). The review of pollen vegetation in Ayala et al. (2021) suggests that in different parts of Anatolia during the Neolithic parkland and woodland were present, and we assume that these incursions are most likely to have happened at higher altitudes, at least initially. It is necessary to consider the wooded options for all phases, as there are no particularly close pollen records and the regional records suggest woodland from the midpoint of the Early occupation phase to the end of the Late phase (Beyşehir), or from before settlement to midway through the Final phase (Golhisar) or indeed for the entire period of occupation (Nar). The low rainfall amounts on the plain are likely to have resulted in more steppe-like vegetation throughout.
To parameterize HEC-HMS for Neolithic conditions we therefore used three scenarios to represent endmembers of conditions and possible patterns. In the first, the modern baseline conditions were used, based on the calibration of modern flows. The second assumed complete woodland coverage in the catchment, while the third used the modern lower woodland limit at around 1450 m asl to calculate area-weighted mixes of woodland and steppe vegetation. It should be noted that the second scenario is not intended to be realistic, but is simply used as an end member to evaluate the maximal potential effect of vegetation change on the flood régime. In the absence of more detailed reconstructions, the actual effects are likely to be somewhere in the continuum between the different scenarios. Curve Numbers for woodland were estimated using Natural Resources Conservation Service (2004), and initial abstractions and canopy storage were also modified to represent the changes to the hydrology.
Modelling past flows
HEC-HMS was applied to model flows in the catchment, looking at (i) the effect of multiple replications to investigate sensitivity to stochastic weather generation; (ii) the effect of climate variability based on the modelling of climate proxies; and (iii) the effect of the different vegetation patterns. The flow produced at the Çatal Inflow location would have been delivered to the reconstructed channel belt c.4 km to the south of Çatalhöyük. Because the nature of the stratigraphy of the anastomosing channels makes it impossible to reconstruct channel cross sections, we follow the assumption that bankfull flows were adjusted to the flow discharge with a recurrence interval of 1.5 years (known as the Q1.5 flood; Leopold et al., 1964), and use simple hydraulic reconstructions to estimate the nature and extent of Neolithic flooding. Although there has been debate about the general validity of the Q1.5 threshold (Williams, 1978), we use it from the perspective that it is most likely to overestimate past flooding and thus give the most extreme view of the reconstructed flood régime.
Results
The Neolithic Çarşamba
The reconstruction of the sedimentary sequence identified a series of four phases of river development (Ayala et al., 2017: 41–42). During the third of these phases, which corresponds to the Neolithic, the Carsamba becomes a dryland anabranching system (Nanson and Knighton, 1996) consisting of a wide channel belt of multiple channels with localised areas of wetter conditions (channel cut offs or lower points in the topography) that began to fill in the undulating topography.
Alluvial anabranching (or anastomosing) systems tend to be mud-dominated (Tooth et al., 2000) and are characterised by multiple main channels that are often accompanied by interconnected floodplain-surface channels for distributing overbank flow. Variable flow régimes encourage the creation and abandonment of the different channels within the belt (Nanson and Knighton, 1996). As the system matures, vegetation (reeds and shrubs then trees) reinforces the banks of the major channels and helps stabilise the islands in between them. Secondary channels that are full only during periods of extensive flooding tend to be shallower with their beds at a higher elevation than the major channels. As floodwater recedes these secondary channels may retain of water in drier periods creating either a series of pools or isolated wet, marshy areas on the floodplain.
The difficulty with identifying and mapping the location of these channels is that it is impossible to estimate the past channel dimensions directly from the stratigraphic record (Nanson and Knighton, 1996), even if there were available exposures locally. Modern examples of dryland anabranching river systems across the globe can have very extensive channel belts made up of multiple channels that can vary in width across the floodplain. American examples, both in Canada and South America, have anabranching reaches which have channel belts of very restricted dimensions c. 1.5 km (Li et al., 2015; Smith and Smith, 1980), while some Central Australian examples (Nanson et al., 1986, 1988; Rust and Nanson, 1986) can extend up to 60 km. The evidence from Ayala et al. (2021) based on reconstructing the marl surface that the channel was cut into suggests that the Neolithic Çarşamba was closer to the lower of these bounds.
The identification and interpretation of the Palaeoçarşamba as a dryland anabranching system during the Neolithic renders the previously held belief of the area being an extensive series of ‘backswamp’ basins surrounding local marl highs (Roberts and Rosen, 2009: 396–397) untenable (Ayala and Wainwright, 2020; Ayala et al., 2017, 2021; Charles et al., 2014; Doherty, 2020). Sedimentological evidence for flooding has focussed in the literature on the identification of clay content in the soils and sediments in the immediate vicinity. In the 1970 soil survey (De Meester, 1970) ‘backswamp clays’ were identified in the area denoted as the Çarşamba Fan (~75–80% clay fraction). While KOPAL studies reported >50% clay for the Lower Alluvium or at times reported as ‘Lower alluvium backswamp clay’ (Boyer, 1999: Figure 4.17; Boyer et al., 2006: Table 1), which supported the interpretation of extensive flooding of long duration, more recent analysis (Ayala et al., 2017) has instead found the sediments of the Lower Complex to be silty clays (>50% silt; Ayala et al., 2017: 7 and supplementary information), which would support a more turbulent, potentially shorter lived, seasonal flooding régime. Furthermore, the ‘backswamp’-derived soils described by De Meester (1970) are relatively shallow (no more than 1.5-m deep [p. 82]), which would mean that these materials post date the Neolithic. Off-site coring by Boyer (1999) at tell sites in the vicinity also found variable depths of alluvial sequences (p. 163), although the sampling adjacent to tell sites was not an optimal design for reconstructing the detail of this part of the palaeolandscape. Lastly, modern mapping of the Çarşamba shows a split into three channels to the north of the sand ridge near Çumra but to the south of Catalhöyük. The eastern branch has been heavily modified in the historic period (Roberts, 1990). Therefore, without further study to refine its chronology there is no certainty to the presence, nature or size and significance of the branch during the Neolithic occupation of Çatalhöyük. Estimates below have assumed that all flow in the Neolithic Çarşamba followed the channel belt reconstructed from our sedimentary data. If the eastern channel belt had been active at the same time, the amount of water flowing past Çatalhöyük would have been lower than in the estimates below, and thus flooding probably less extreme, but with a higher vulnerability to drought.
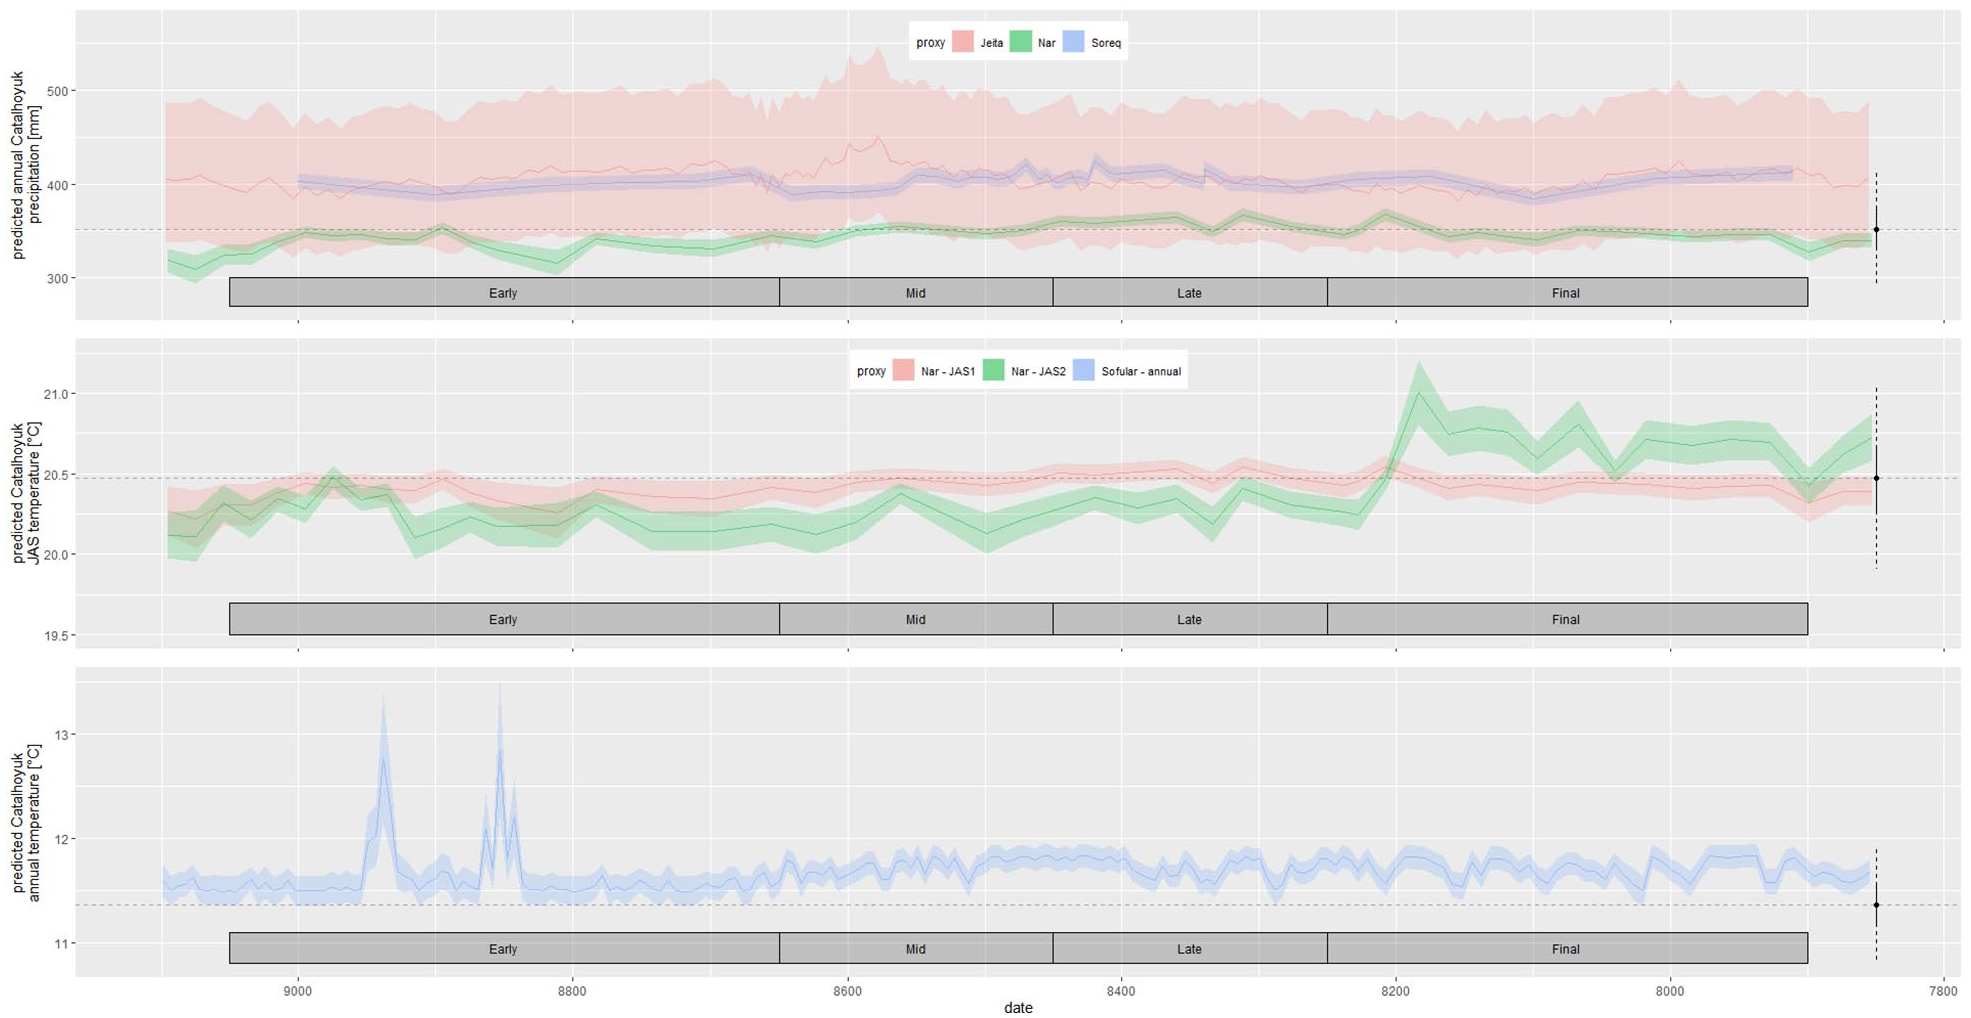
Estimated climate proxies for Çatalhöyük for the period from 9100 to 7850 BCE. Archaeological phases are shown in the boxes beneath each panel. Upper: predicted annual precipitation based on Jeita, Nar and Soreq proxies; middle: predicted JAS temperature based on two alternative proxies from Nar and one from Sofular; and lower: predicted annual temperature based on a proxy from Sofular. Shaded bands are 95% confidence intervals on the mean based on RMS combined errors of the proxy and of the relation between the modern climate measurement at the proxy site and at Çatalhöyük.
Past climate proxies
Significant proxies for annual precipitation were found using the δ18O signal from Nar Lake, and the spelaeothems from Jeita and Soreq (Figure 4). The Nar proxy overlaps with the 95% confidence interval of the mean of the modern value throughout the occupation of Çatalhöyük. The proxies from Jeita and Soreq are about 16% higher on average than the Nar proxy, although the much greater uncertainty on the Jeita proxy means that it always overlaps with the 95% confidence interval of the mean of the modern value. The Soreq proxy is better constrained but always within the 95% range of modern variability.
The Sofular spelaeothem record provides a proxy for annual average temperature based on the δ13C signal. In the Early phase of Çatalhöyük occupation, the average temperature was on average about 0.2°C warmer than at present, and thus on the limit of the modern 95% confidence interval (Figure 4). There were two short-lived, larger excursions of up to 1.3°C between 9000 and 8300 cal bp. From about 8700 to 8500 cal bp, there is an upward trend of the proxy temperature, after which it stabilizes about 0.4°C warmer than present. This pattern continues throughout the time of settlement occupation, although from about 8400 cal bp there are pronounced oscillations between about 0.2°C and 0.4°C warmer with a wavelength of about 50 years.
The Nar proxy provides a reconstruction of summer temperature. Although Jones et al. (2005) found a proxy with summer (July–September) maximum temperature using an 8-year moving average based on the estimated residence time of water in the lake, we found a better link with the mean summer temperature using an 8-year moving average (Figure 4). The Nar1 proxy is based on just the δ18O signal, and shows a relatively stable temperature reconstruction, at or close to the modern mean and within the 95% confidence interval throughout. The Nar2 proxy is based on both the δ13C and 18O signals. Thus in both cases, some caution is required in its interpretation in that the δ18O has already been used to interpret the precipitation signal, and thus it should properly be the residuals from the precipitation signal used to reconstruct temperature, although it is clearly impossible to do this for the past record. This interpretation is consistent with that of Jones et al. (2005), who interpret the Nar signal as being related to water stress, and thus a combination of the precipitation and temperature signals. The pattern in Nar2 suggests that summer mean temperatures were about 0.2°C cooler than the present until about 8250 cal bp, where they increased to about 0.17°C warmer than present. Apart from a very short interval, this increase is within the 95% confidence interval of the modern mean, and remains within the 95% range of variability of modern values.
Based on these proxy reconstructions, we developed four precipitation (named 1P–4P with 0P as the modern baseline values) and five temperature scenarios (named 1TE, 2TE, 2TMLF, 2TML, 2TF with 0T as the modern baseline with the letters relating to the Early, Middle, Late and Final phases of Neolithic occupation at Çatalhöyük to which the scenarios are relevant; Table 4). In 1P, the precipitation is assumed to be 4% drier than at present, consistent with the average early phase signal from the Nar precipitation proxy. Although the Soreq proxy is based on annual rainfall, for 2P we interpret it as being relevant for summer rainfall only, based on interpretations of more northerly incursions of the Intertropical Convergence Zone into the Levant in the early Holocene (Horowitz, 1987; Weinstein-Evron, 1987), and keep the annual average rainfall the same. In 4P, we increase overall rainfall by 16% based on the Soreq proxy, while 3P is a more conservative estimate of wetter conditions, based on the later phases at Nar. For temperature scenario 1TE, we assume the Sofular signal in the early phase increases temperatures throughout the year by 0.1832°C, while 1TMLF represents the 0.3597°C higher temperatures in these phases at Sofular. In 2TE, the Nar2 proxy is used to suggest mean summer temperatures 0.2284°C lower than present, with the rest of the year 0.1832°C warmer based on the Sofular proxy. For the later phases, 2TML has 0.2284°C cooler summer temperatures from Nar2, but is 0.3597°C warmer otherwise based on Sofular, and in 2TF, summer temperatures are 0.1687°C warmer than present and 0.3597°C warmer otherwise. For simplicity in making comparisons between simulations, these modifications are made directly to each replication of daily precipitation and temperature. In the case of precipitation, this method ignores potential changes in numbers of events per year, but it is retained in the absence of any proxy to support an alternative approach.
Precipitation and temperature scenarios used in modelling Neolithic flows based on the various proxy records.
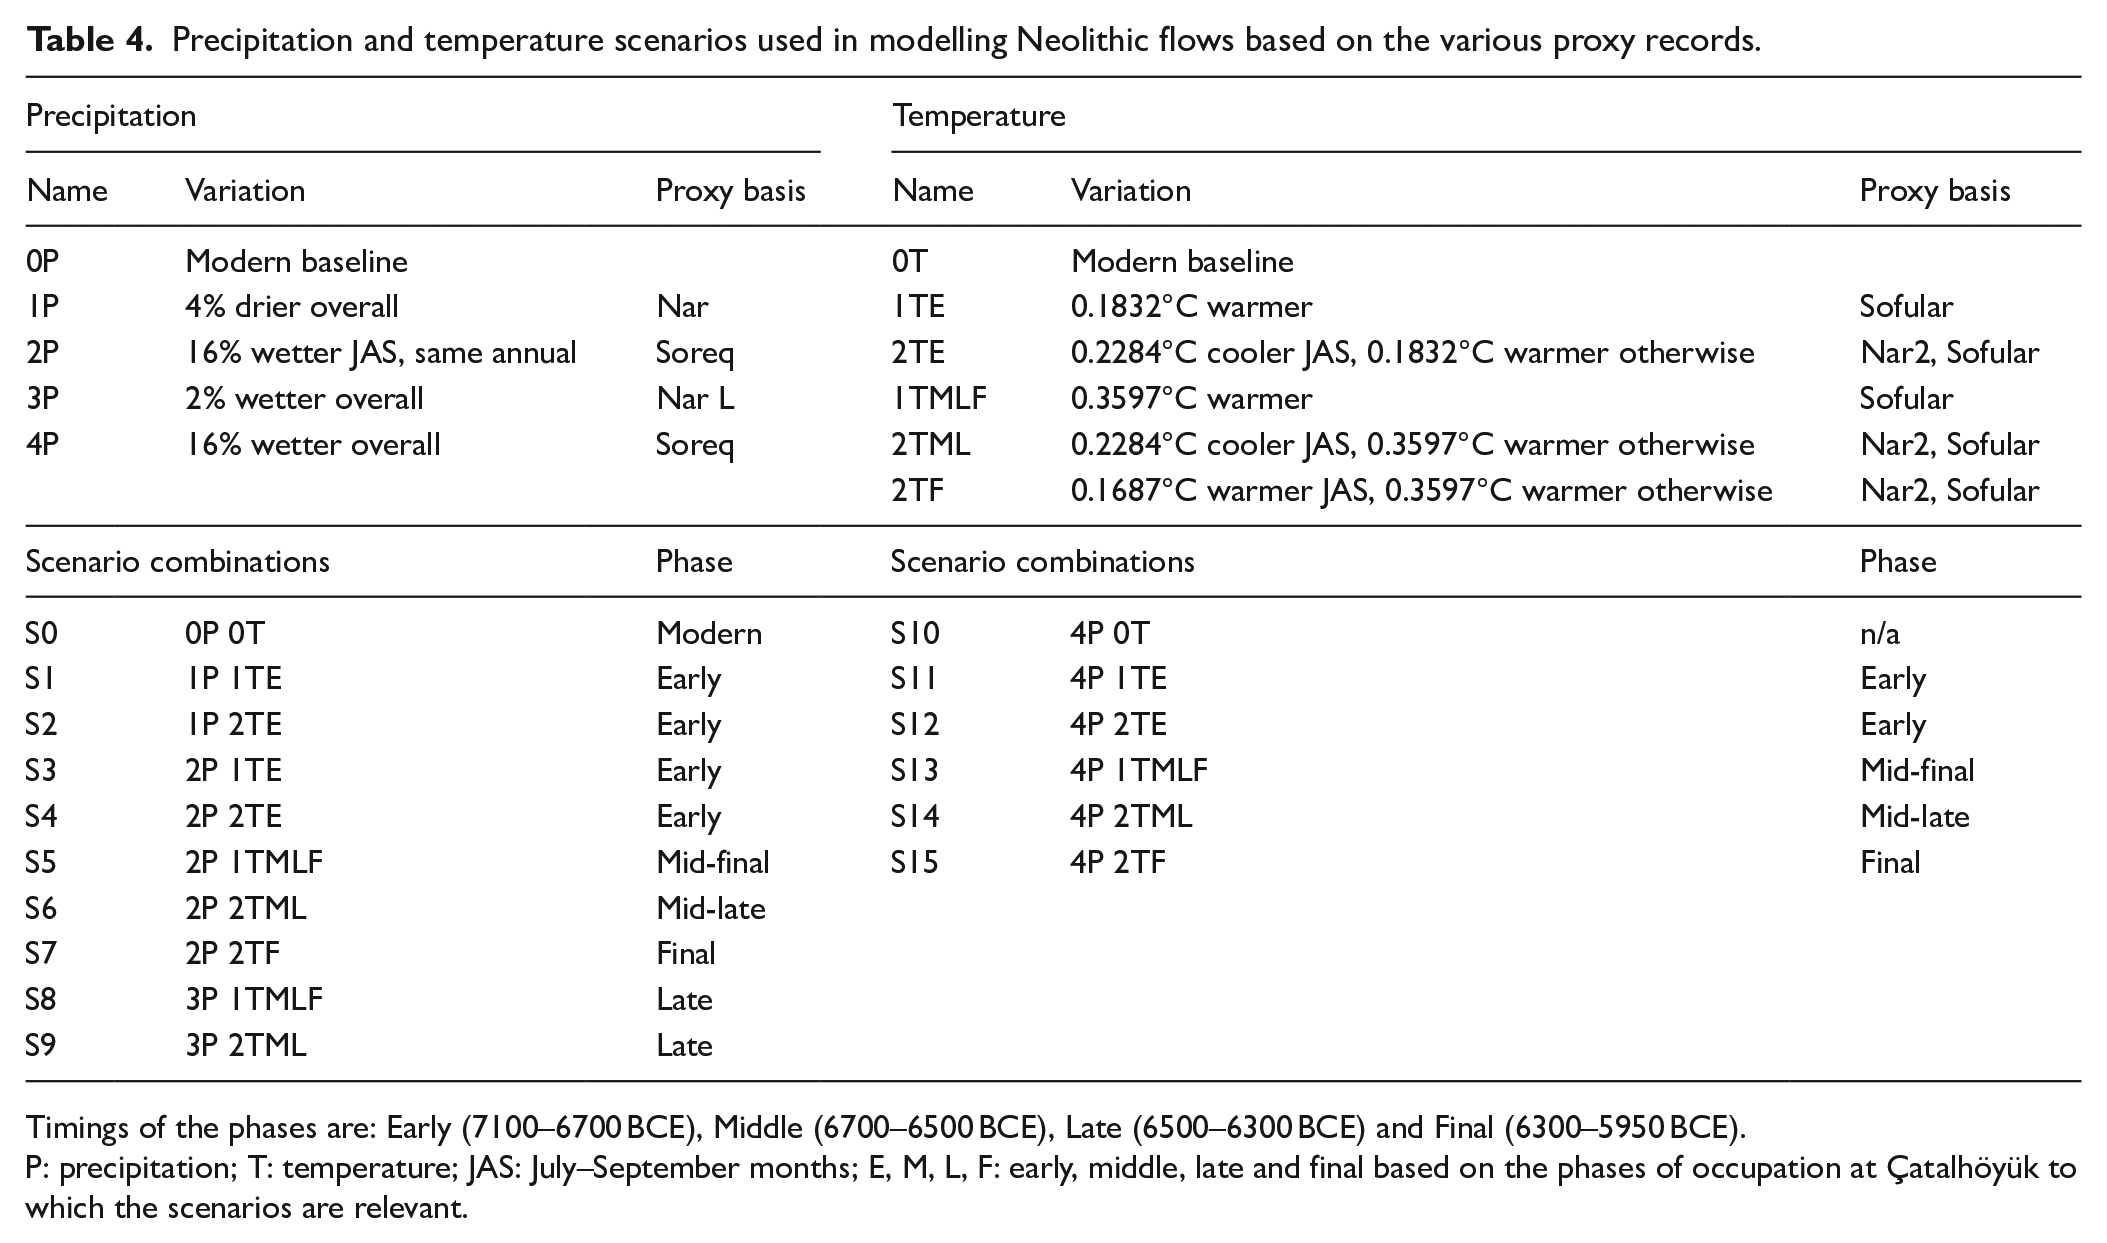
Timings of the phases are: Early (7100–6700 BCE), Middle (6700–6500 BCE), Late (6500–6300 BCE) and Final (6300–5950 BCE).
P: precipitation; T: temperature; JAS: July–September months; E, M, L, F: early, middle, late and final based on the phases of occupation at Çatalhöyük to which the scenarios are relevant.
Modern flows and flow modelling
Flow data from the unmodified part of the upper catchment (Table 2) show the peaky response that is expected of upland catchments, and a clear increase of flows as the catchment area increases from 84 km2 at Sorkun to 206 km2 at Bozkir (Figure 5). Moving further downstream to Pinarcık (343 km2), the increase is much less marked, and indeed the flow yield (volume of runoff per unit area) is about half that at Pinarcik compared to Bozkir. On 80% of days between October 1999 and September 2011 flow was lower at Pinarcık than at Bozkir. There is a clear seasonal variation in this flow loss, with losing and gaining conditions approximately equal in March and April, but with losing conditions >68% of the time in the other months, and all of the time in September (Figure 6). Gaining conditions are more likely to occur during larger flows, and in low flow conditions, there was frequently a complete loss of flow between Bozkir and Pinarcık (26%, 57%, 66%, 39% and 10% of days in July–November, respectively). Where there are data at Pinarcık and Mavi, as well as from the Suğla outflows, the suggestion is that there are still losses, but these data are too sparse to provide further generalizations. However, it should be noted that there is either a buffering of flows from the upstream part of the catchment for significant parts of the year, and frequent decoupling in summer and autumn.
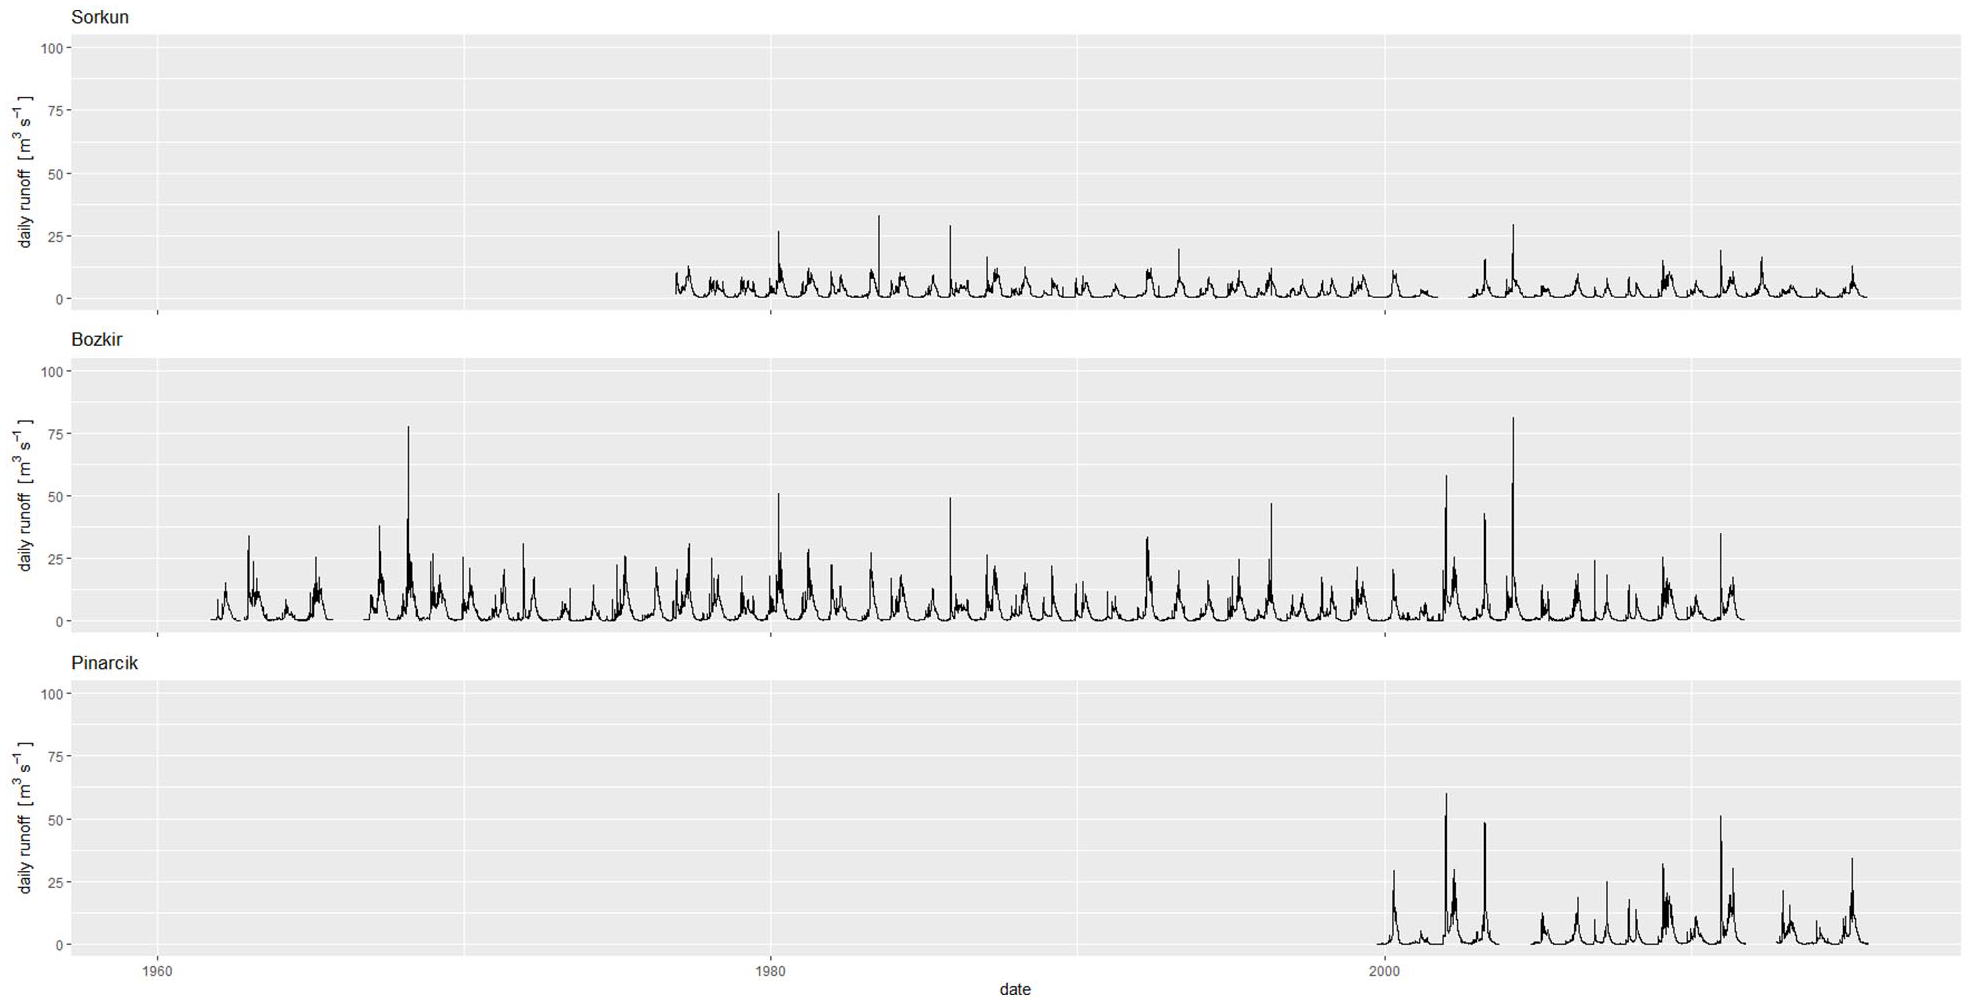
Available measured flows in the unmodified part of the upper catchment from DSI reports.
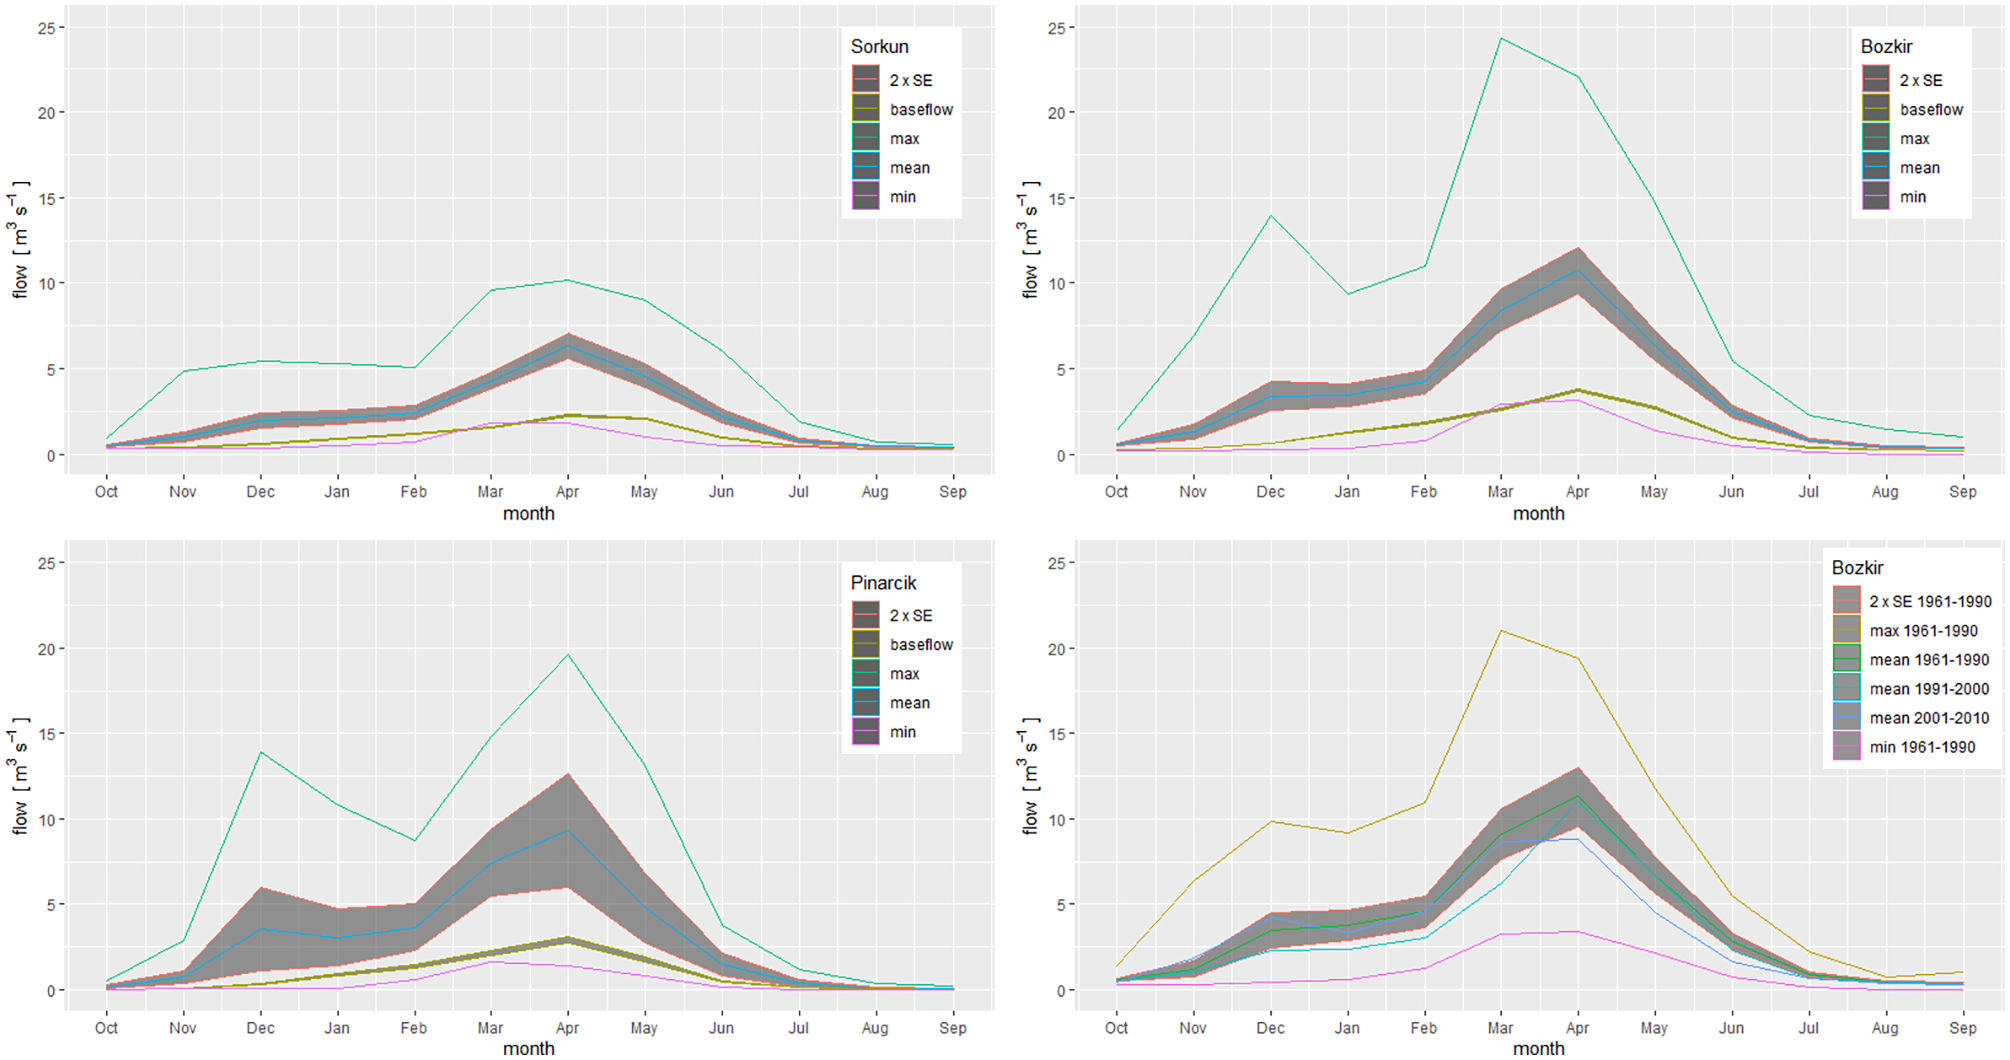
Monthly summaries of flows in the unmodified part of the catchment based on data from DSI reports. The longer series at Bozkir is used to show the difference between the 1961 and 1990 baseline period and the complete data sequence.
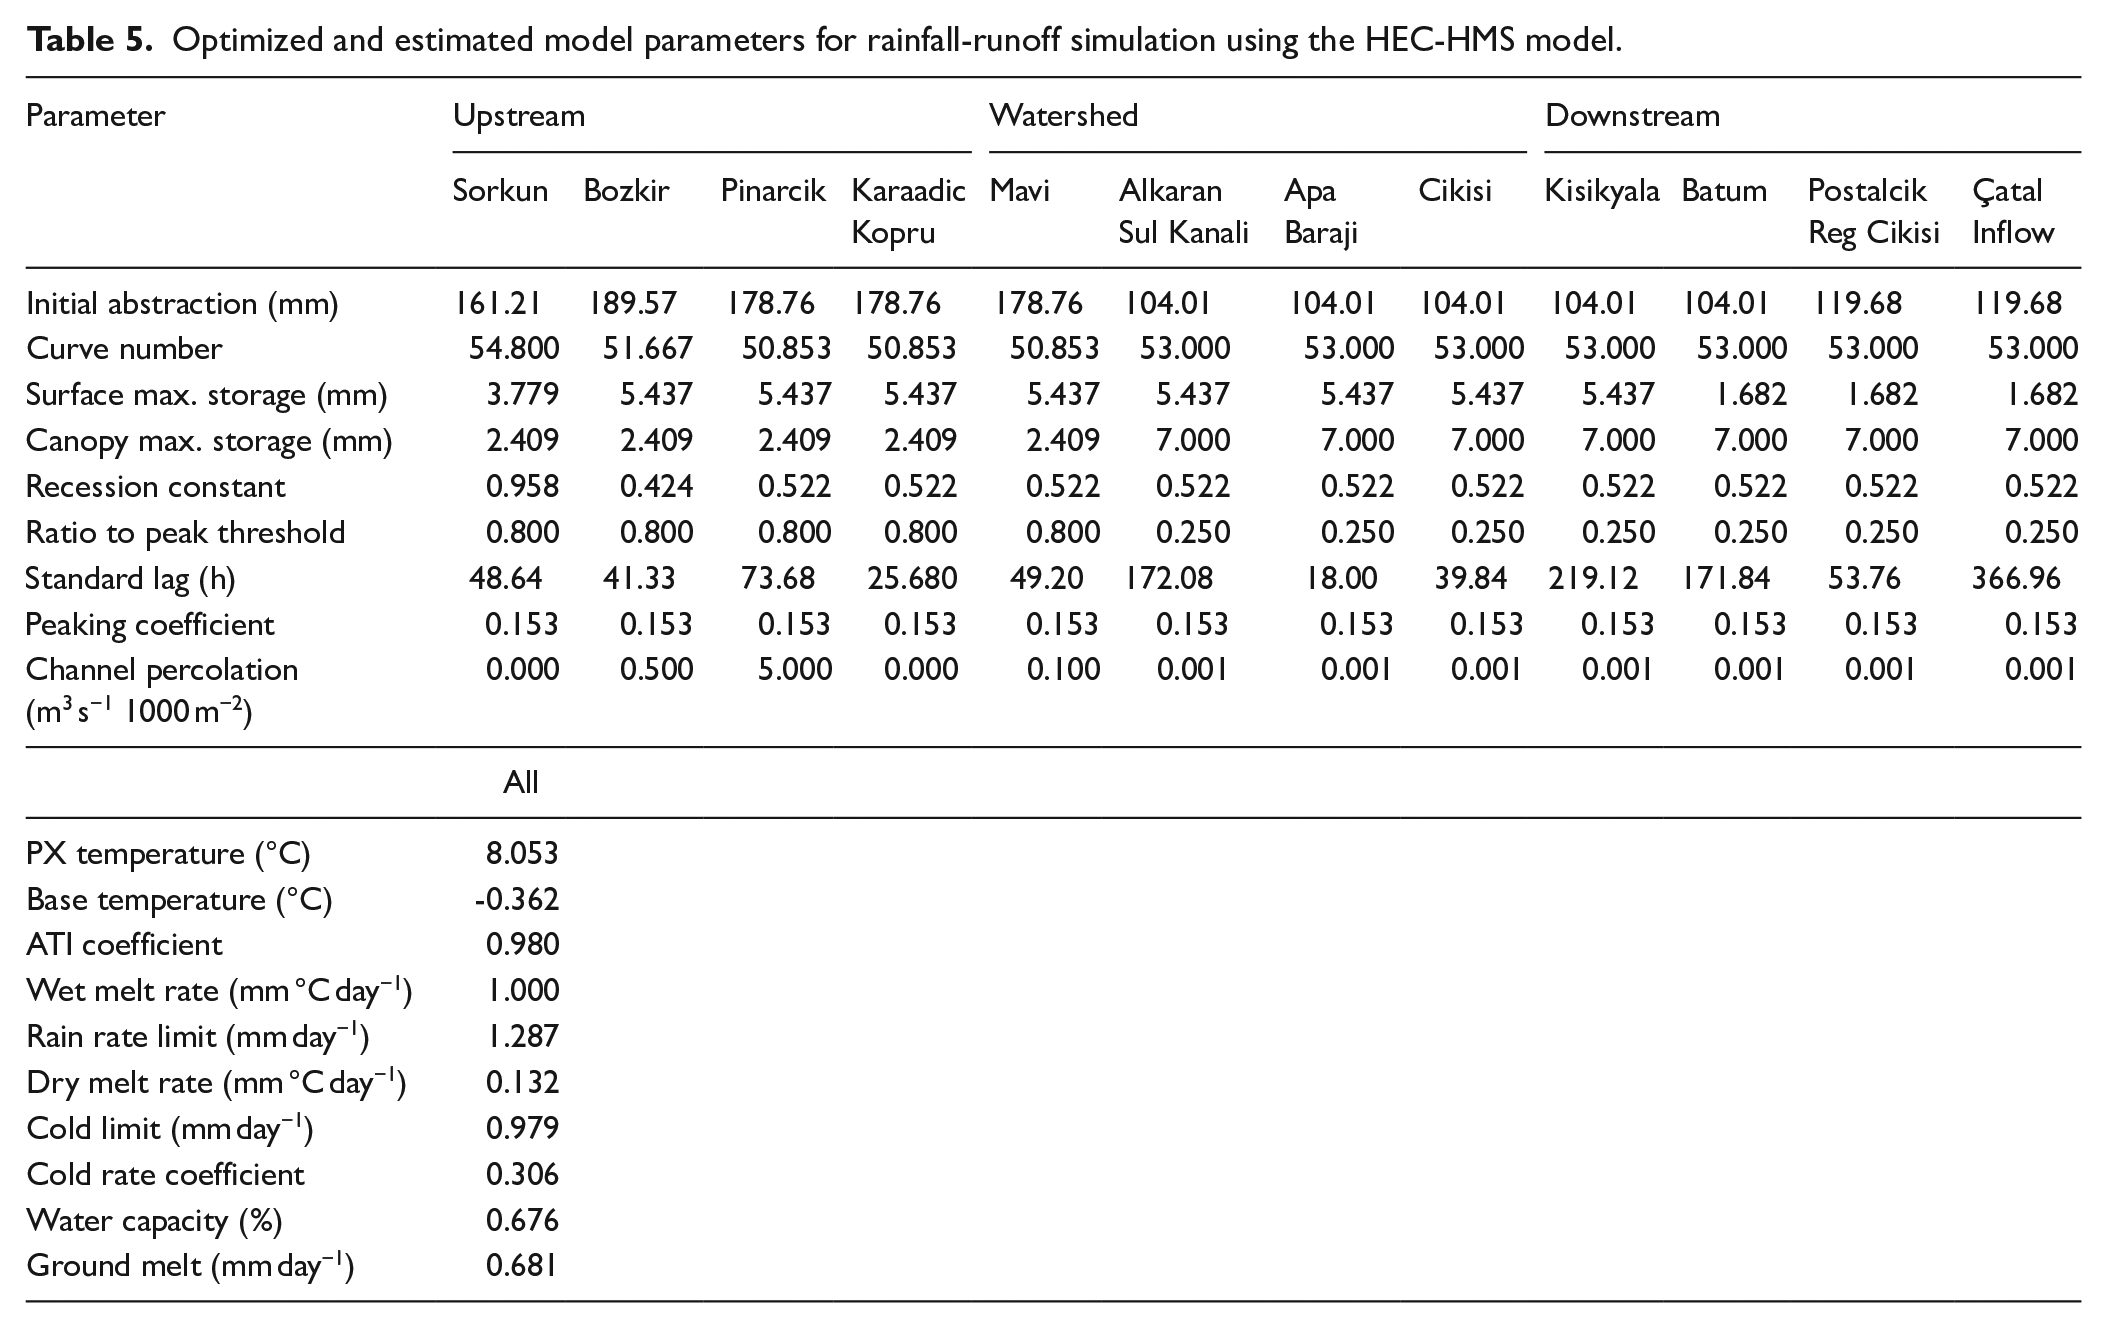
In the first stage of calibration, flows for the hydrological year October 2014–September 2015 were optimized at Sorkun, the most upstream station of the catchment. The rainfall record from Bozkir had to be used. The goodness-of-fit as shown by the Nash-Sutcliffe statistic was 0.644, with a simulated runoff of 754.49 mm and an observed runoff of 847.07 mm. Simulated daily peak flow was 8.0 m3 s−1, compared to the observed 13.0 m3 s−1. These parameters were then fixed and parameters for the Bozkir and Pinarcik subcatchments were optimized for the Pinarcik gauge. The resulting Nash-Sutcliffe statistic was 0.548, with a simulated runoff of 313.57 mm and an observed runoff of 389.70 mm. Simulated daily peak flow was 17.7 m3 s−1, compared to the observed 34.4 m3 s−1. Although runoff volumes are reasonably estimated, care needs to be taken in evaluating subsequent simulations in that peak flows tend to be underestimated (Figure 7). There is also a tendency to overestimate runoff in the autumn months, potentially because the surface parameterization is not able to capture modern cultivation in the area, and to estimate the peak flow a month too early, although this effect is minimized further downstream. Estimated parameters used in subsequent simulations are presented in Table 5.
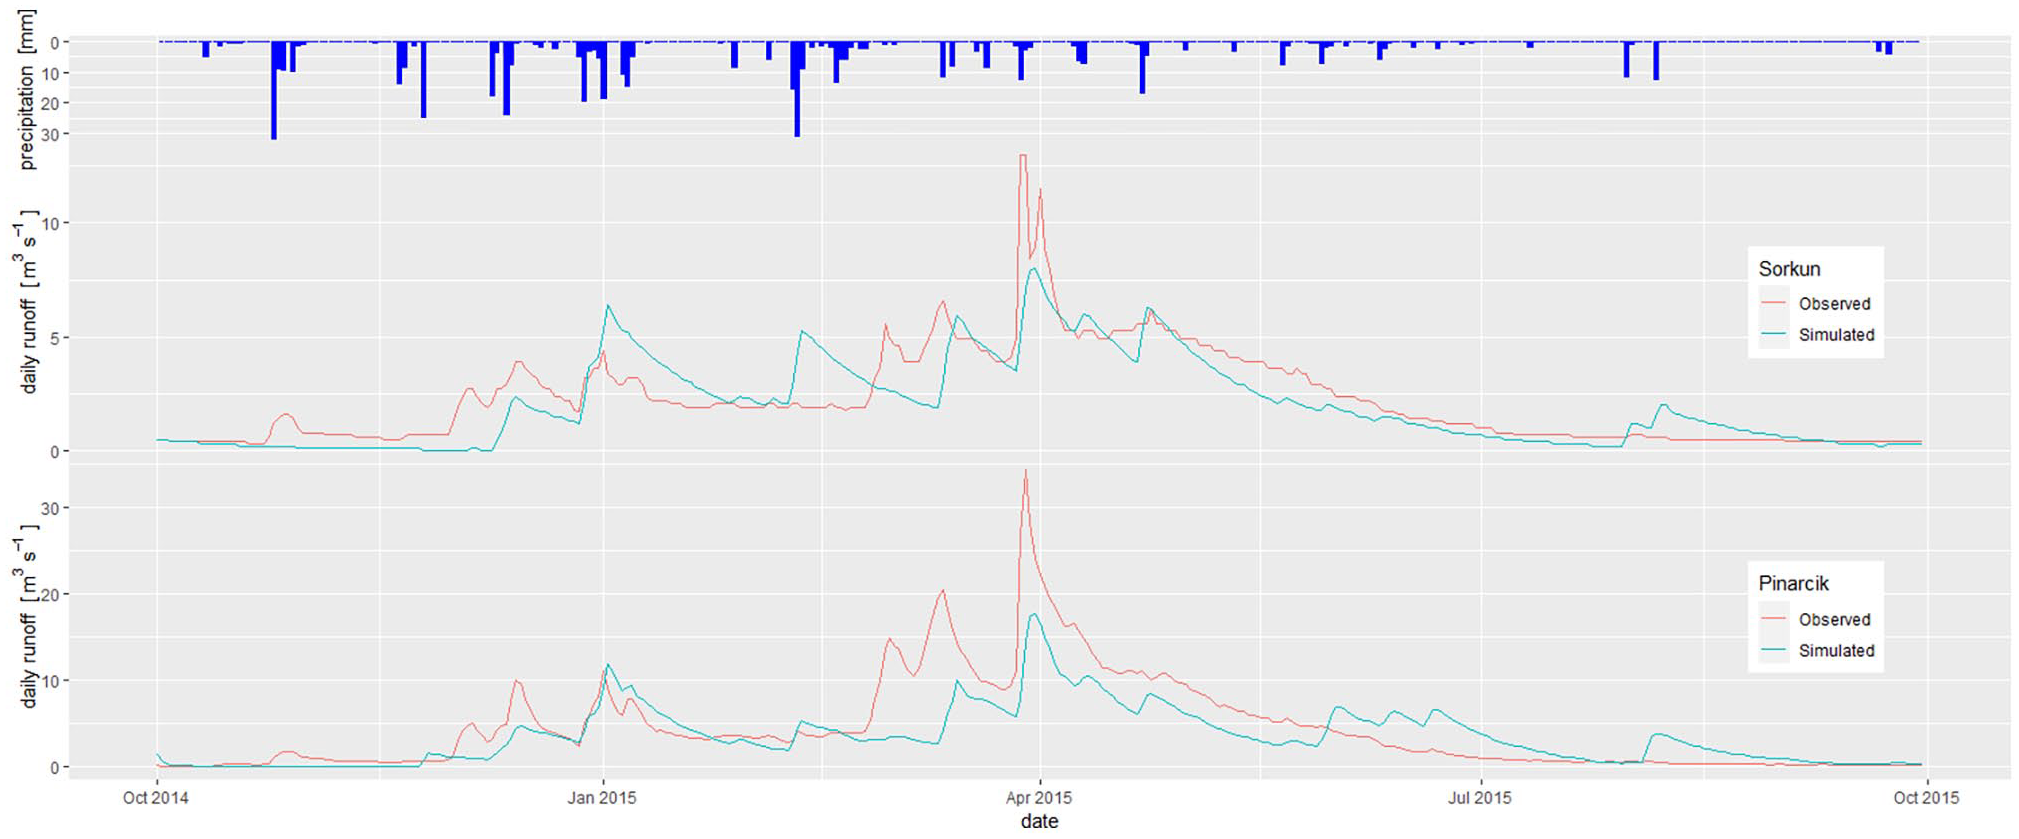
Results of model calibration for 2014–2015 hydrological year at Sorkun and Pinarcik.
Optimized and estimated model parameters for rainfall-runoff simulation using the HEC-HMS model.
Stochastic weather generation
Comparison of the 95% confidence intervals of the measured and simulated monthly temperature and precipitation suggest that the modelled weather is able to capture the seasonal patterns well (Figure 8). In all cases, the precipitation values are not significantly different. There is a slight tendency in the sites within the catchment to overestimate the winter temperature. The Seydişehir temperatures are more widely overestimated, although these simulations are not subsequently used in the analysis. These results suggest that there can be a reasonable level of confidence in the simulated climate data used to simulate the longer flow characteristics.
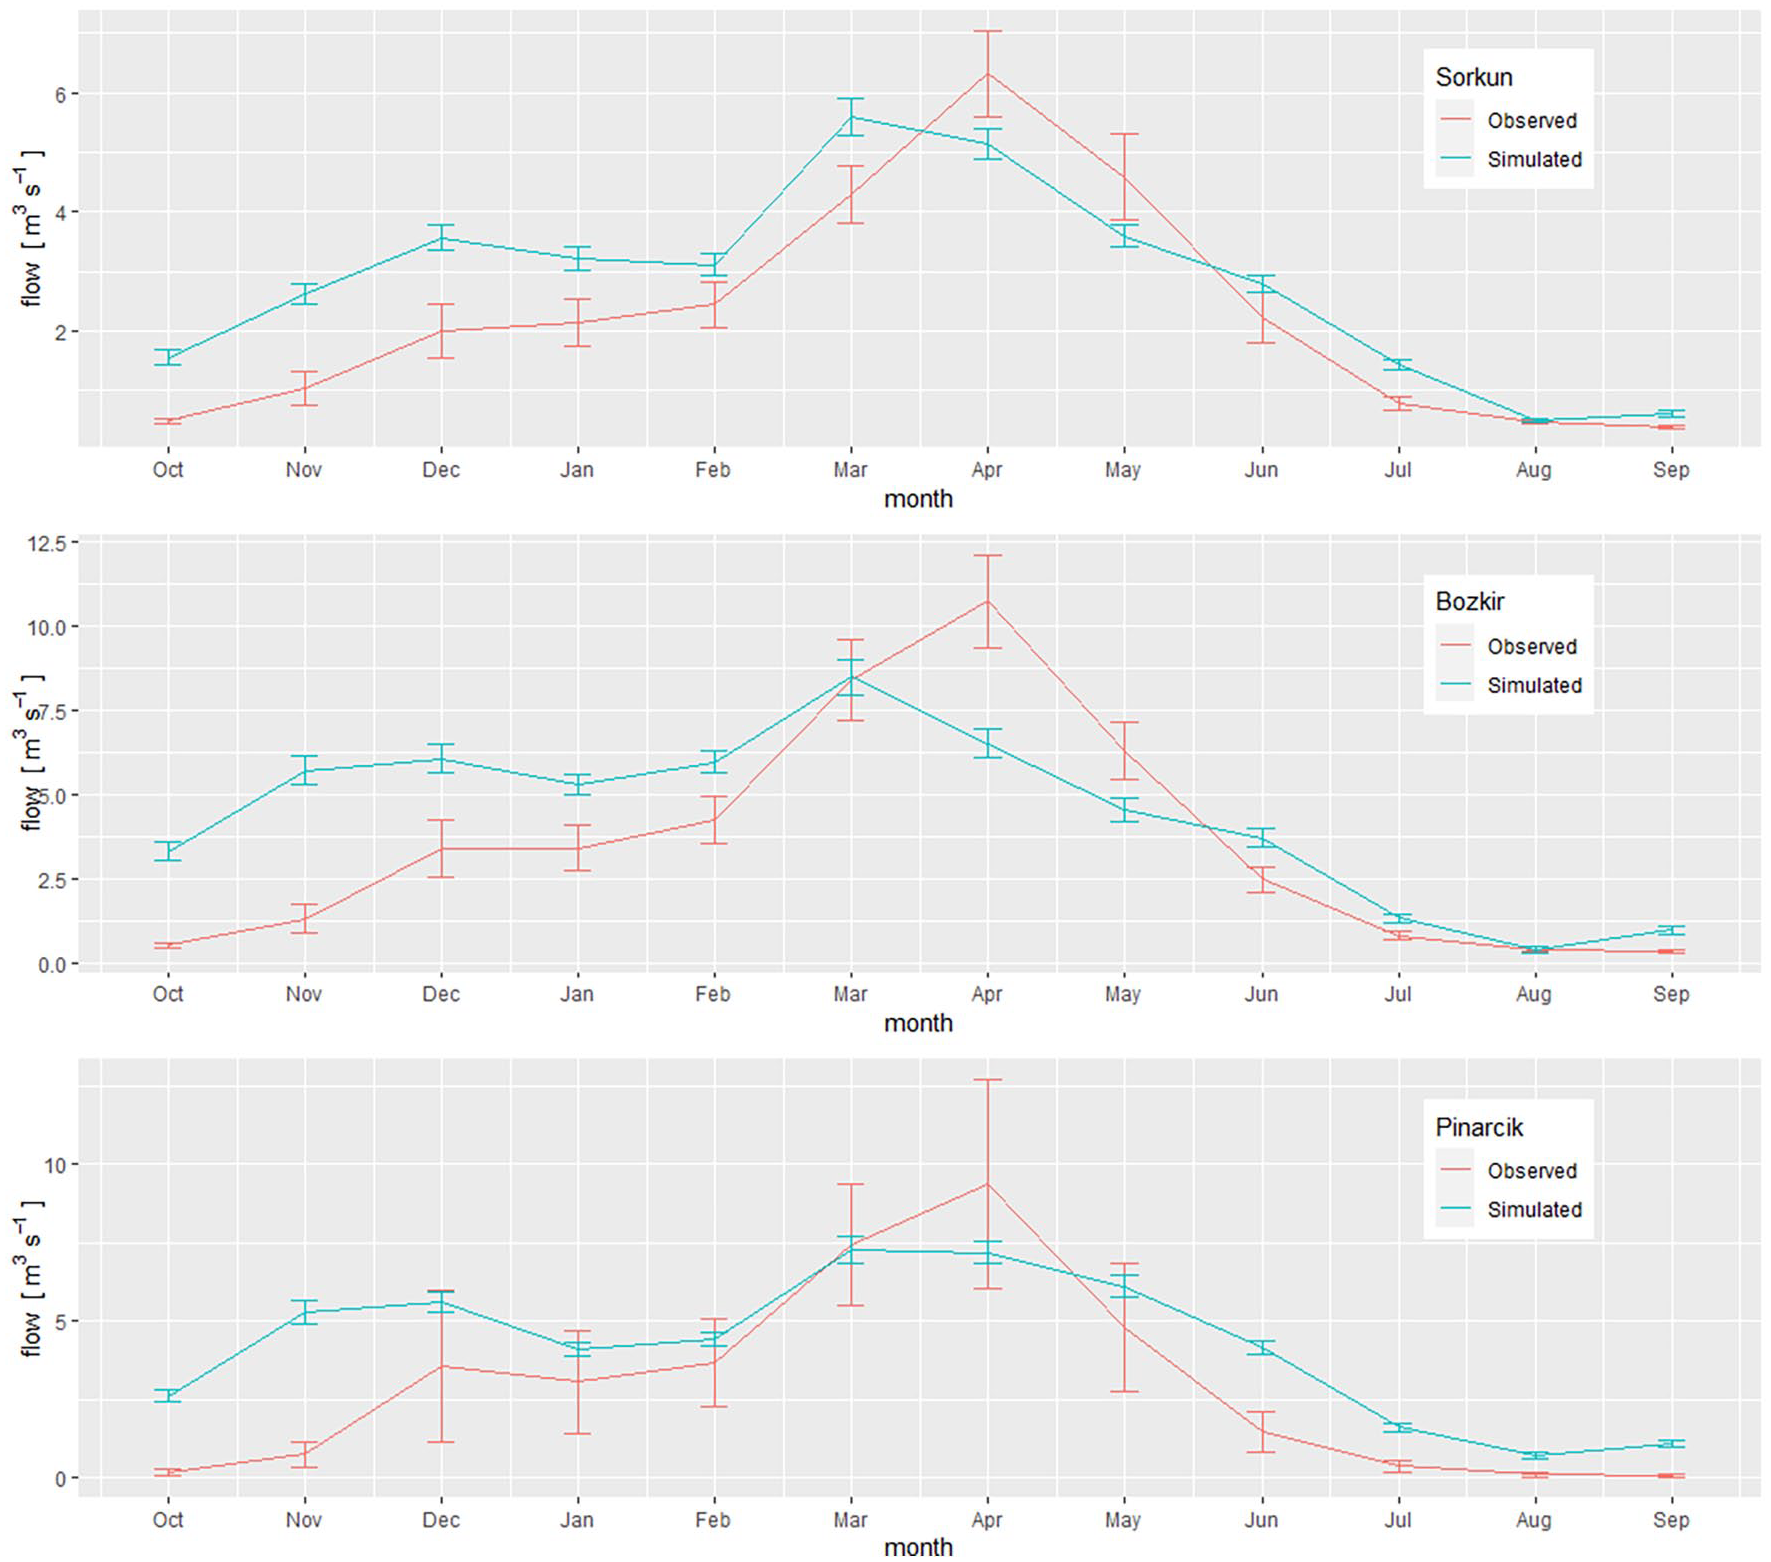
Comparison of simulated and observed monthly flows in the upstream, unmodified part of the catchment.
Modelling flows
A baseline set of model runs was used with modern simulated climate and conditions over a 30-year period. Figure 9 compares the modern measured flows with the simulated flows for 10 stochastic replications of the weather. There is a tendency again to overestimate autumn and winter flows, and the flow peak is in March rather than April, although this effect is minimal on reaching Pinarcık. The flow is relatively flashy in the upstream part of the catchment, but the transmission losses in the middle part of the catchment mean that the downstream flows are often decoupled from the upstream ones (Figure 10). The simulated flows in the lower part of the catchment are less flashy and the total flow more evenly spread through the winter and spring months. For example, the highest simulated monthly average mean flows occur in March in Bozkir, whereas in the Çatal Inflow site, they are in April and May.
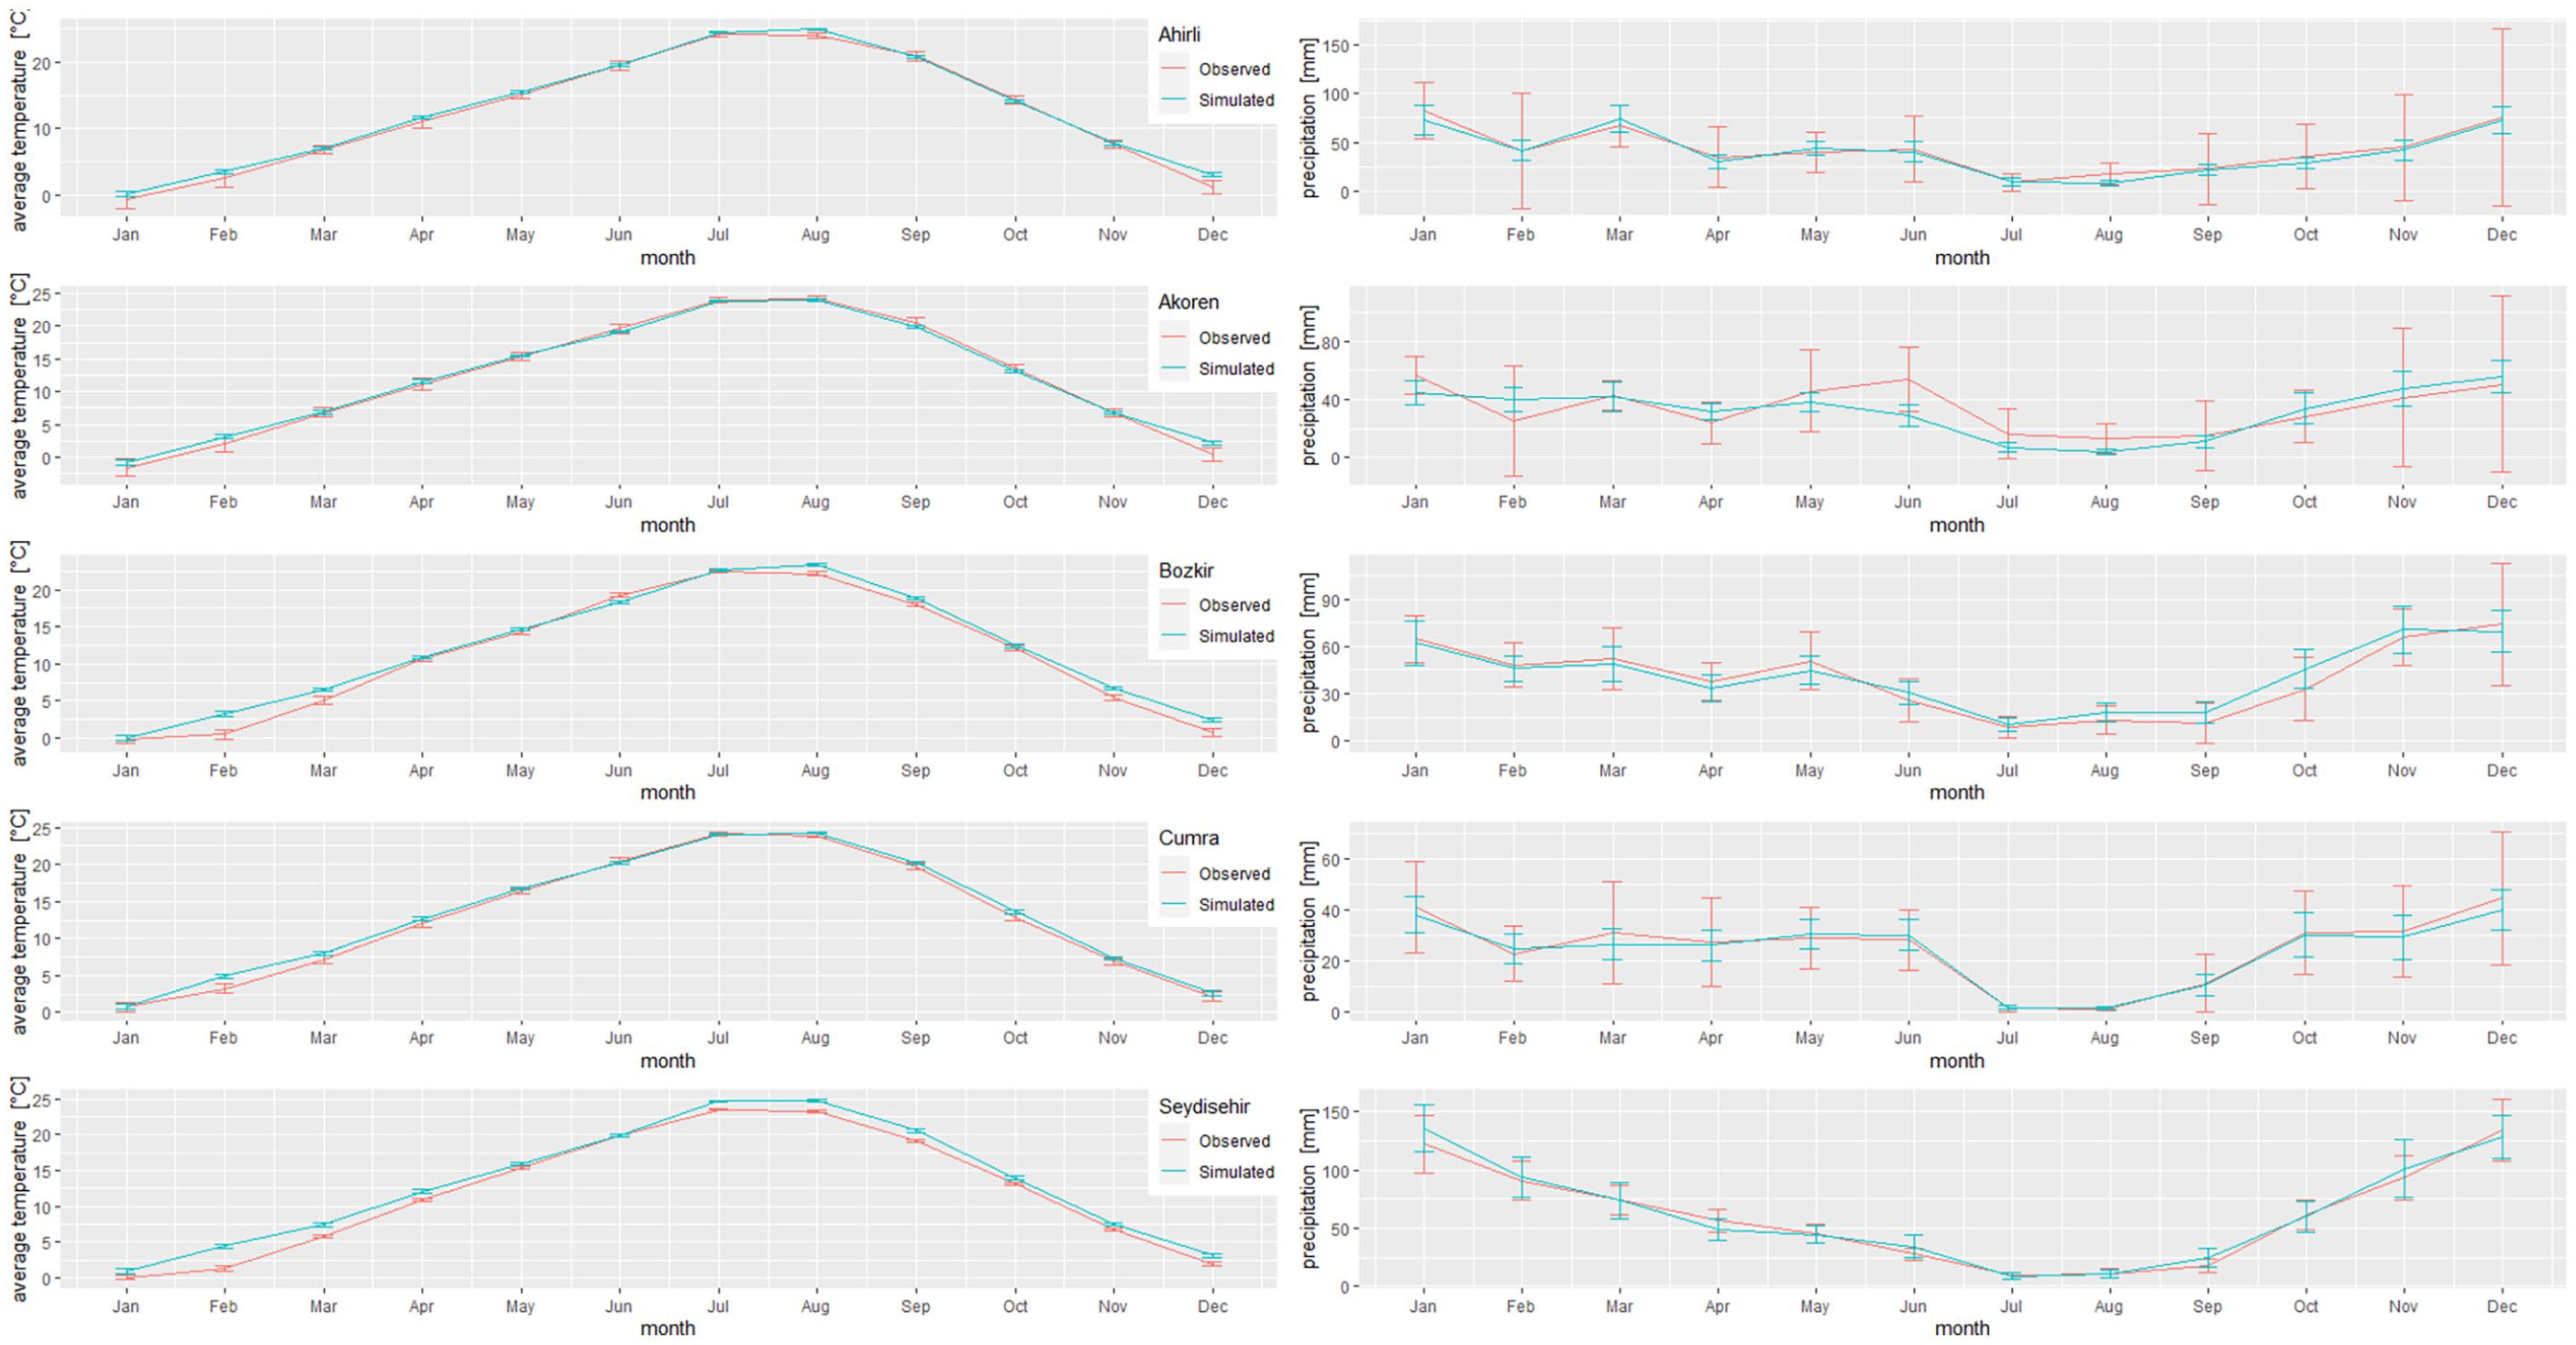
Comparison of simulated and observed stochastic weather generation results.
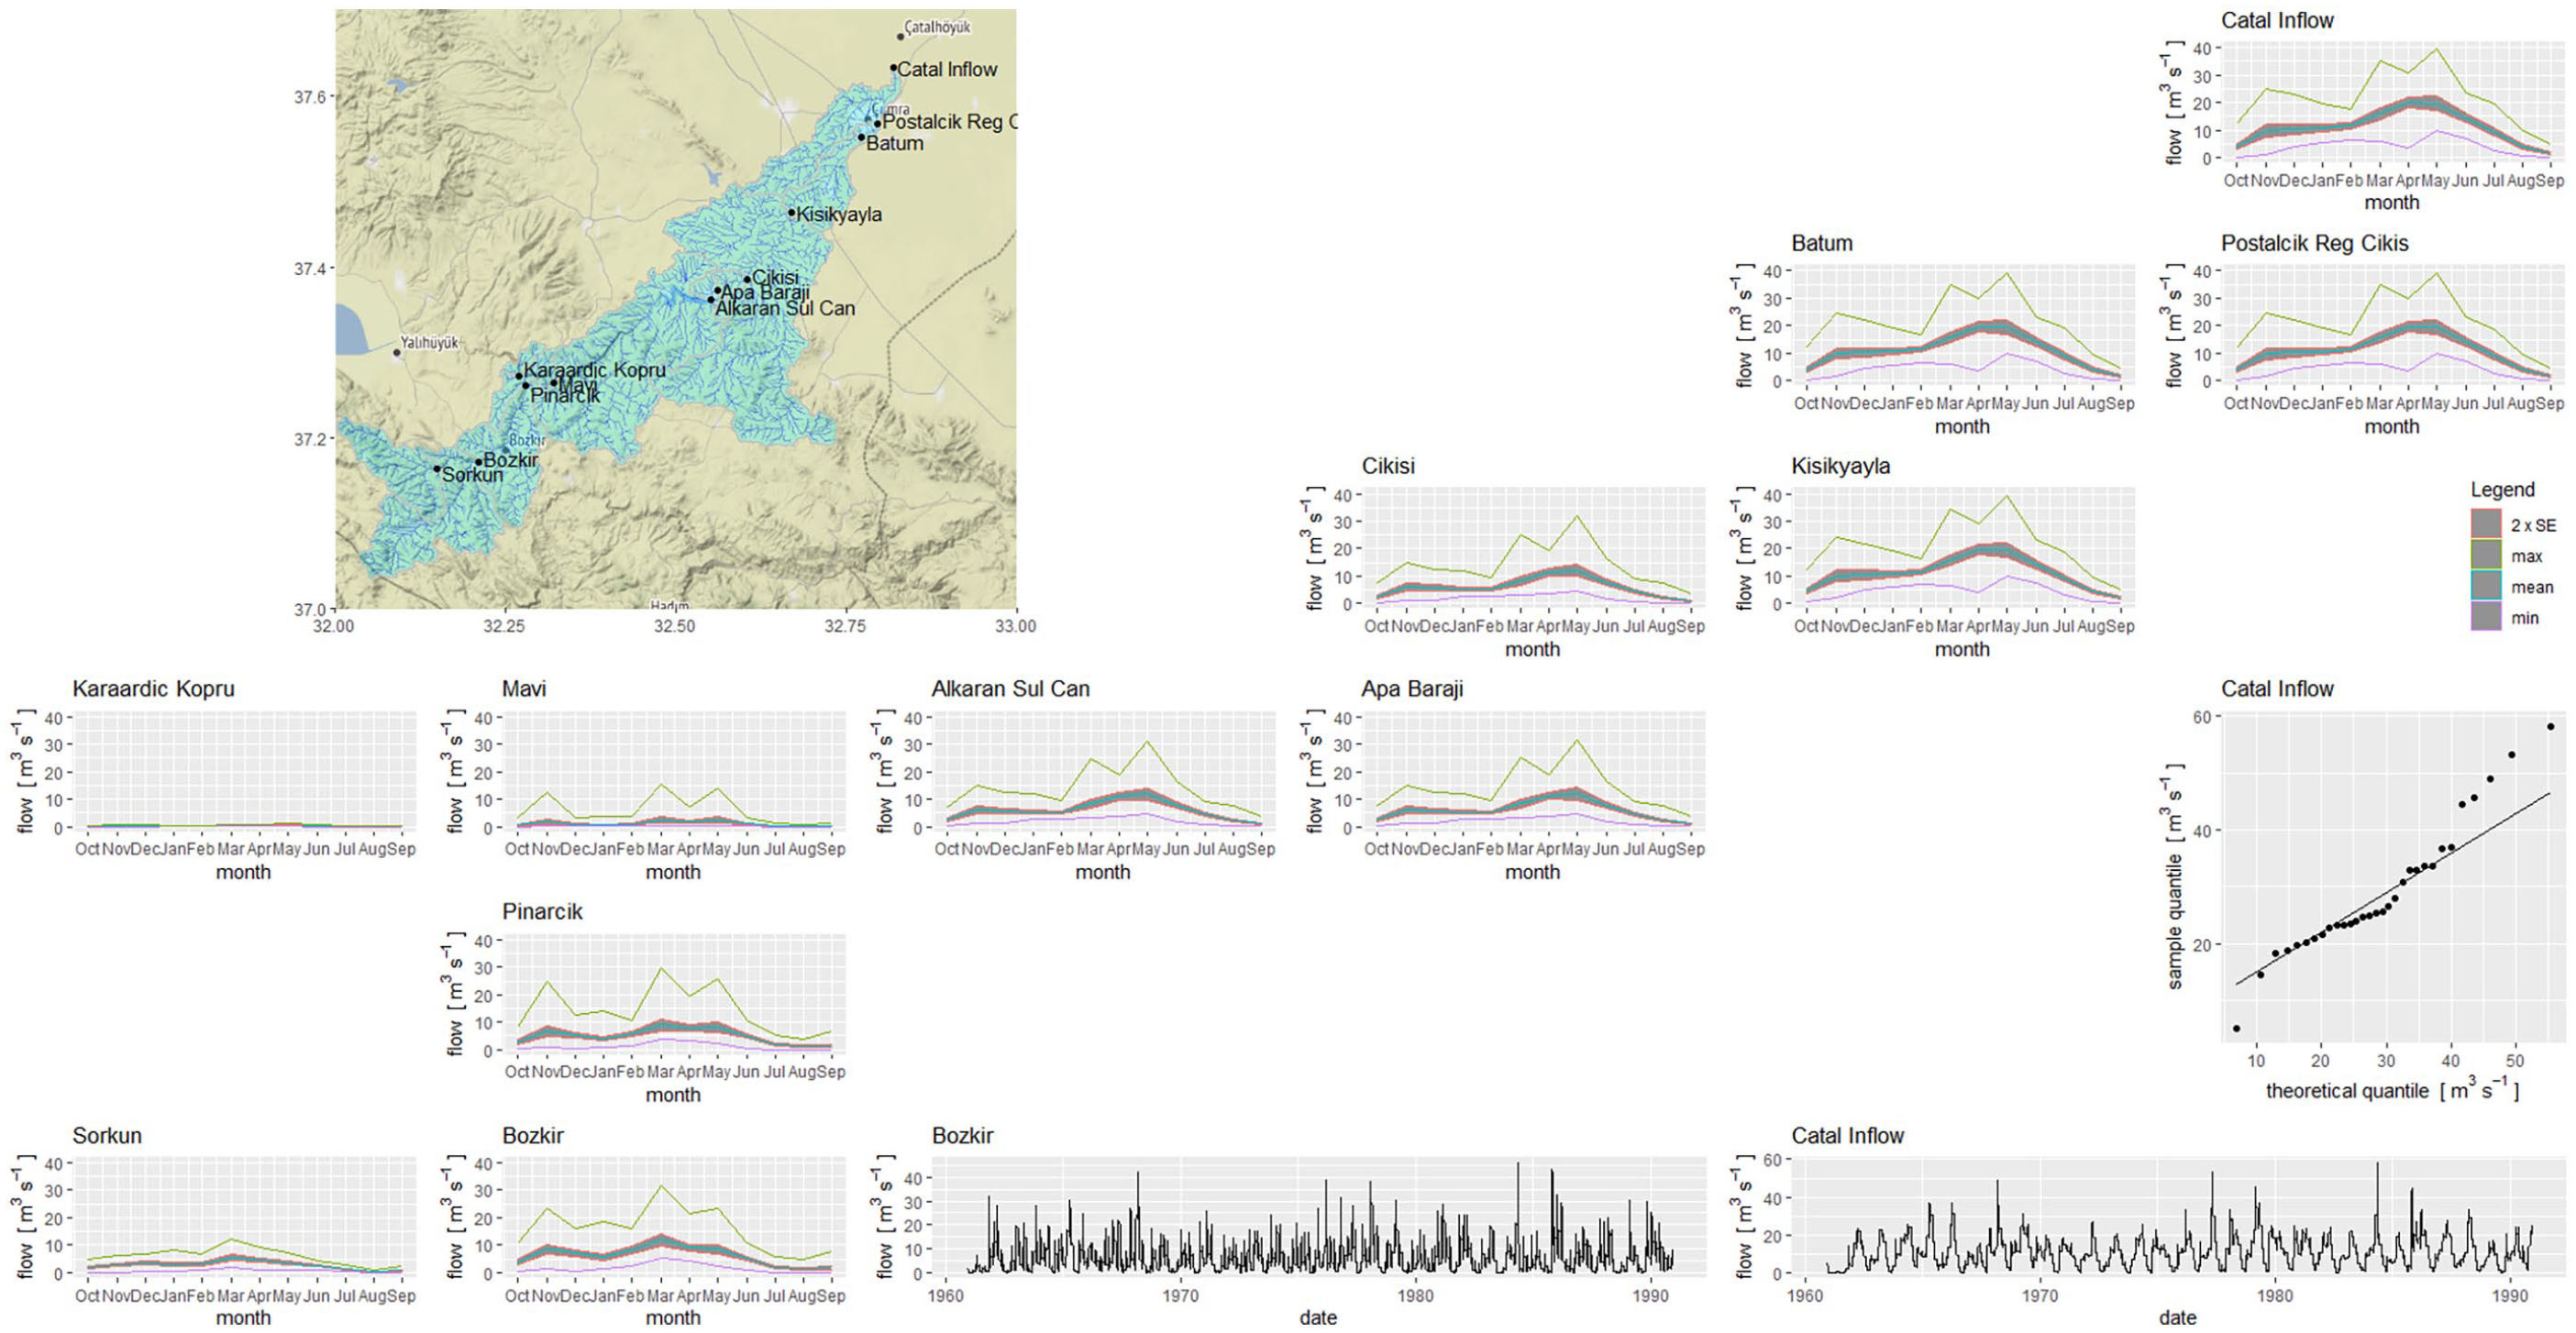
Simulation of catchment flows for modern baseline climate assuming no modifications to the catchment. Monthly summaries are shown for all catchment subdivisions, and time series are shown for the upstream (Bozkir) and downstream (Çatal Inflow) locations as well as the quantile-quantile plot for Çatal Inflow.
The sensitivity to past climate results in 6 different groups of pattern from the 15 scenarios (numbered S1–S15). In order of increasing difference from the modern baseline, these groups are (a) S8 and S9; (b) S1; (c) S10, S11, S13, S14 and S15; (d) S2; (e) S12; and (f) S3, S4, S5, S6 and S7 (Figure 11). Simulations in group (a) have small decreases in April to August mean flows when compared to the modern baseline simulation, and slight increases in the other months. Changes in the mean in all scenarios are affected more by changes in flow minima than flow maxima. In group (b), the period of reduced mean flows extends from April to November, and there is greater variability in the flows. Group (c) has increases in mean flows in each month, and the increase is greater than the 16% increase in rainfall, showing an amplification effect in the process of runoff generation. Increased simulated flows in this group are more pronounced in May to October. For group (d), mean simulated flow decreases between March and August, but increases in the other months. Group (e) is similar to group (c) as expected, albeit with more pronounced effects especially in September and October, but continued amplification of the rainfall increase until March, after which, the flow increase is less than the rainfall increase. Finally, group (f) has simulated decreases of simulated mean flows from either February or March until July, as a result of reduced maxima, and reduced minima from May to July. There are big increases in this group in mean flows in September and October, which is particularly related to the increase in minimum flows. These results demonstrate the importance of considering both rainfall and temperature changes on the hydrological régime, as well as the seasonal patterns of those changes, given that impacts are highest in the scenarios where the bigger rainfall increases are concentrated in a single part of the year. Relating the groups of simulation back to the occupation phases at Çatalhöyük, the Early Phase has scenarios from groups (b) to (f), the Middle Phase from groups (c) and (f), the Late Phase from groups (a), (c) and (f), and the Final Phase from groups (c) and (f). Thus, there is a wide range of uncertainty in the climate impacts, which is especially pronounced in the Early and Late Phases. Further work is required on improving climate proxies to attempt to reduce this uncertainty.
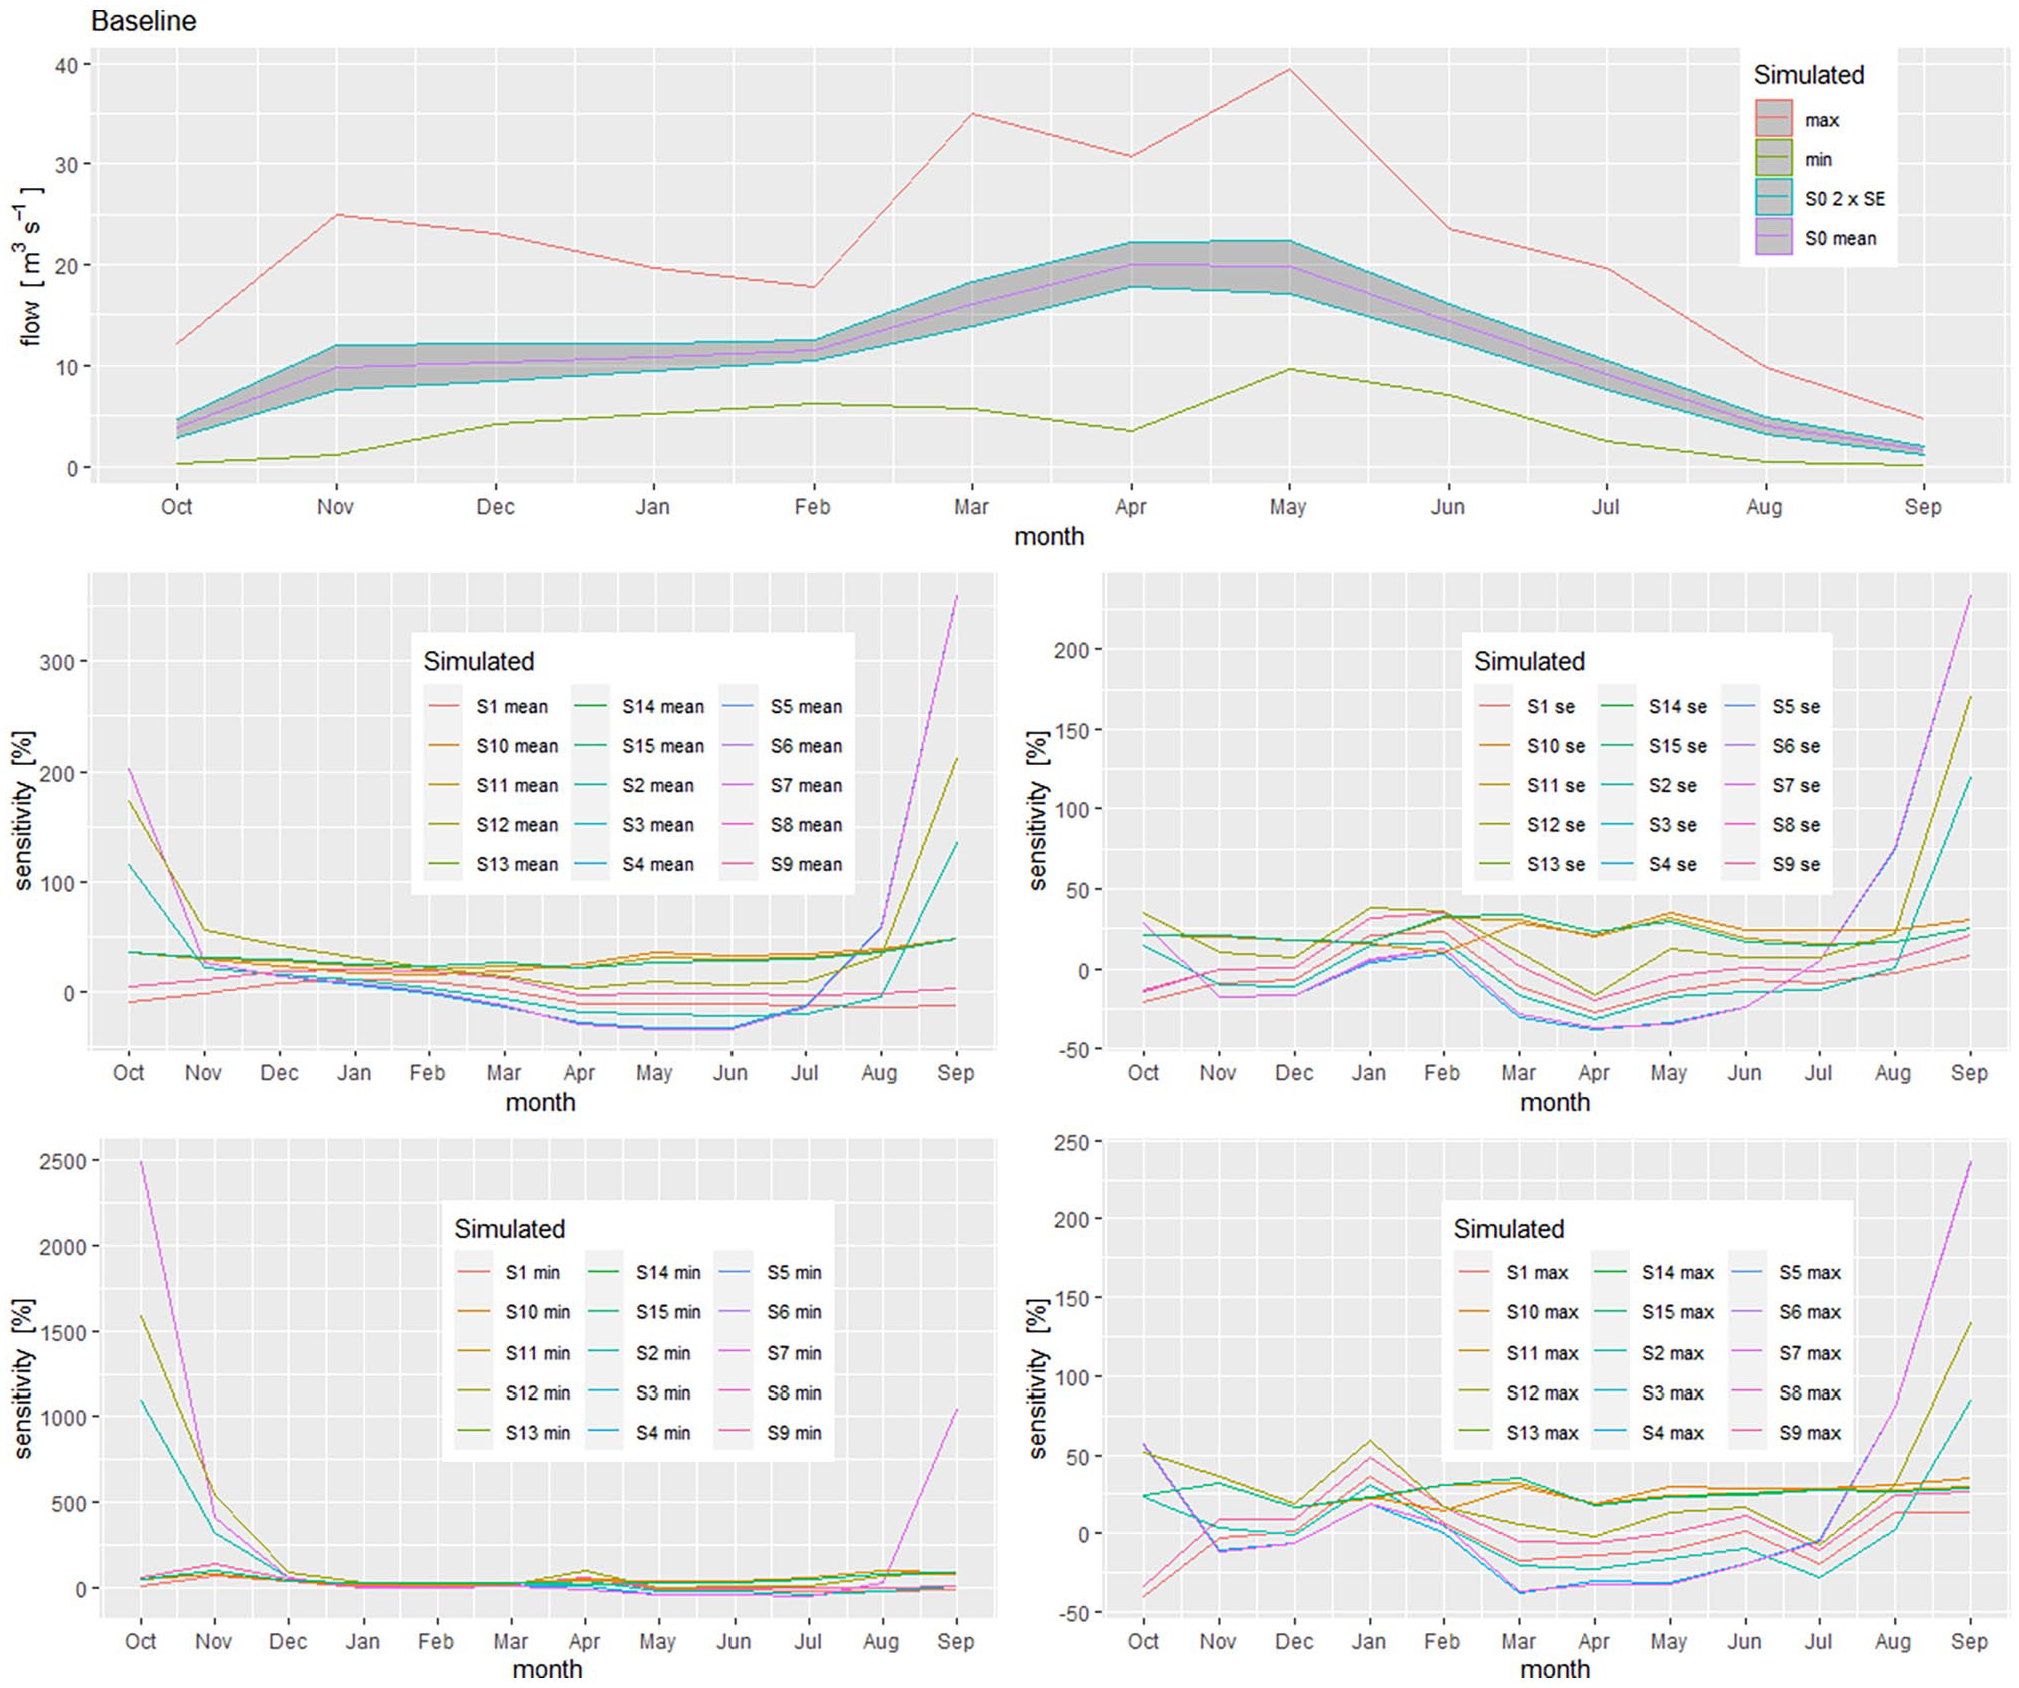
Baseline flow simulations (top) showing mean with 95% based on standard error as well as minimum and maximum monthly discharges. The bottom figures show the sensitivity of the mean, standard error, minimum and maximum flows to the 15 different scenarios discussed in the text.
Combining the climate and vegetation scenarios produces responses in the same groupings, although there are much smaller differences between groups (c), (d) and (f) in the extreme woodland scenario (F1), and in the moderate woodland scenarios (F2) these three groups overlap (Figure 12 and Table 6). In both F1 and F2, the biggest overall impacts on mean simulated flows is in group (b), followed by (a), then (d), (f) and (c), and finally (e). The smallest monthly decreases in F1 are in February to March, and range from 13% to 20% decreases in all groups. Decreases get larger until July in group (f) and S8 (group a), where the monthly simulated mean flow decreases by 62%; until August in groups (d) and (e) (62% and 63% decreases, respectively); and until September in groups (b), S9 (group a), and group (c) (84%, 82% and 78–79% decreases, respectively). The same patterns are observed in F2, but with less pronounced minimum changes in February–March of between 9% and 16%, and inflexion points of 47% in July, 47–55% in August and 62–71% in September. In both vegetation scenarios, the smallest changes in minimum simulated flows compared to the baseline is in March, while the smallest change in maximum flows is in February, and in both cases the decreases get larger away from these points, before getting smaller again after September. In March under F1, scenarios S9 and S12 actually produce small increases in minimum flows, of 4% and 3%, respectively.
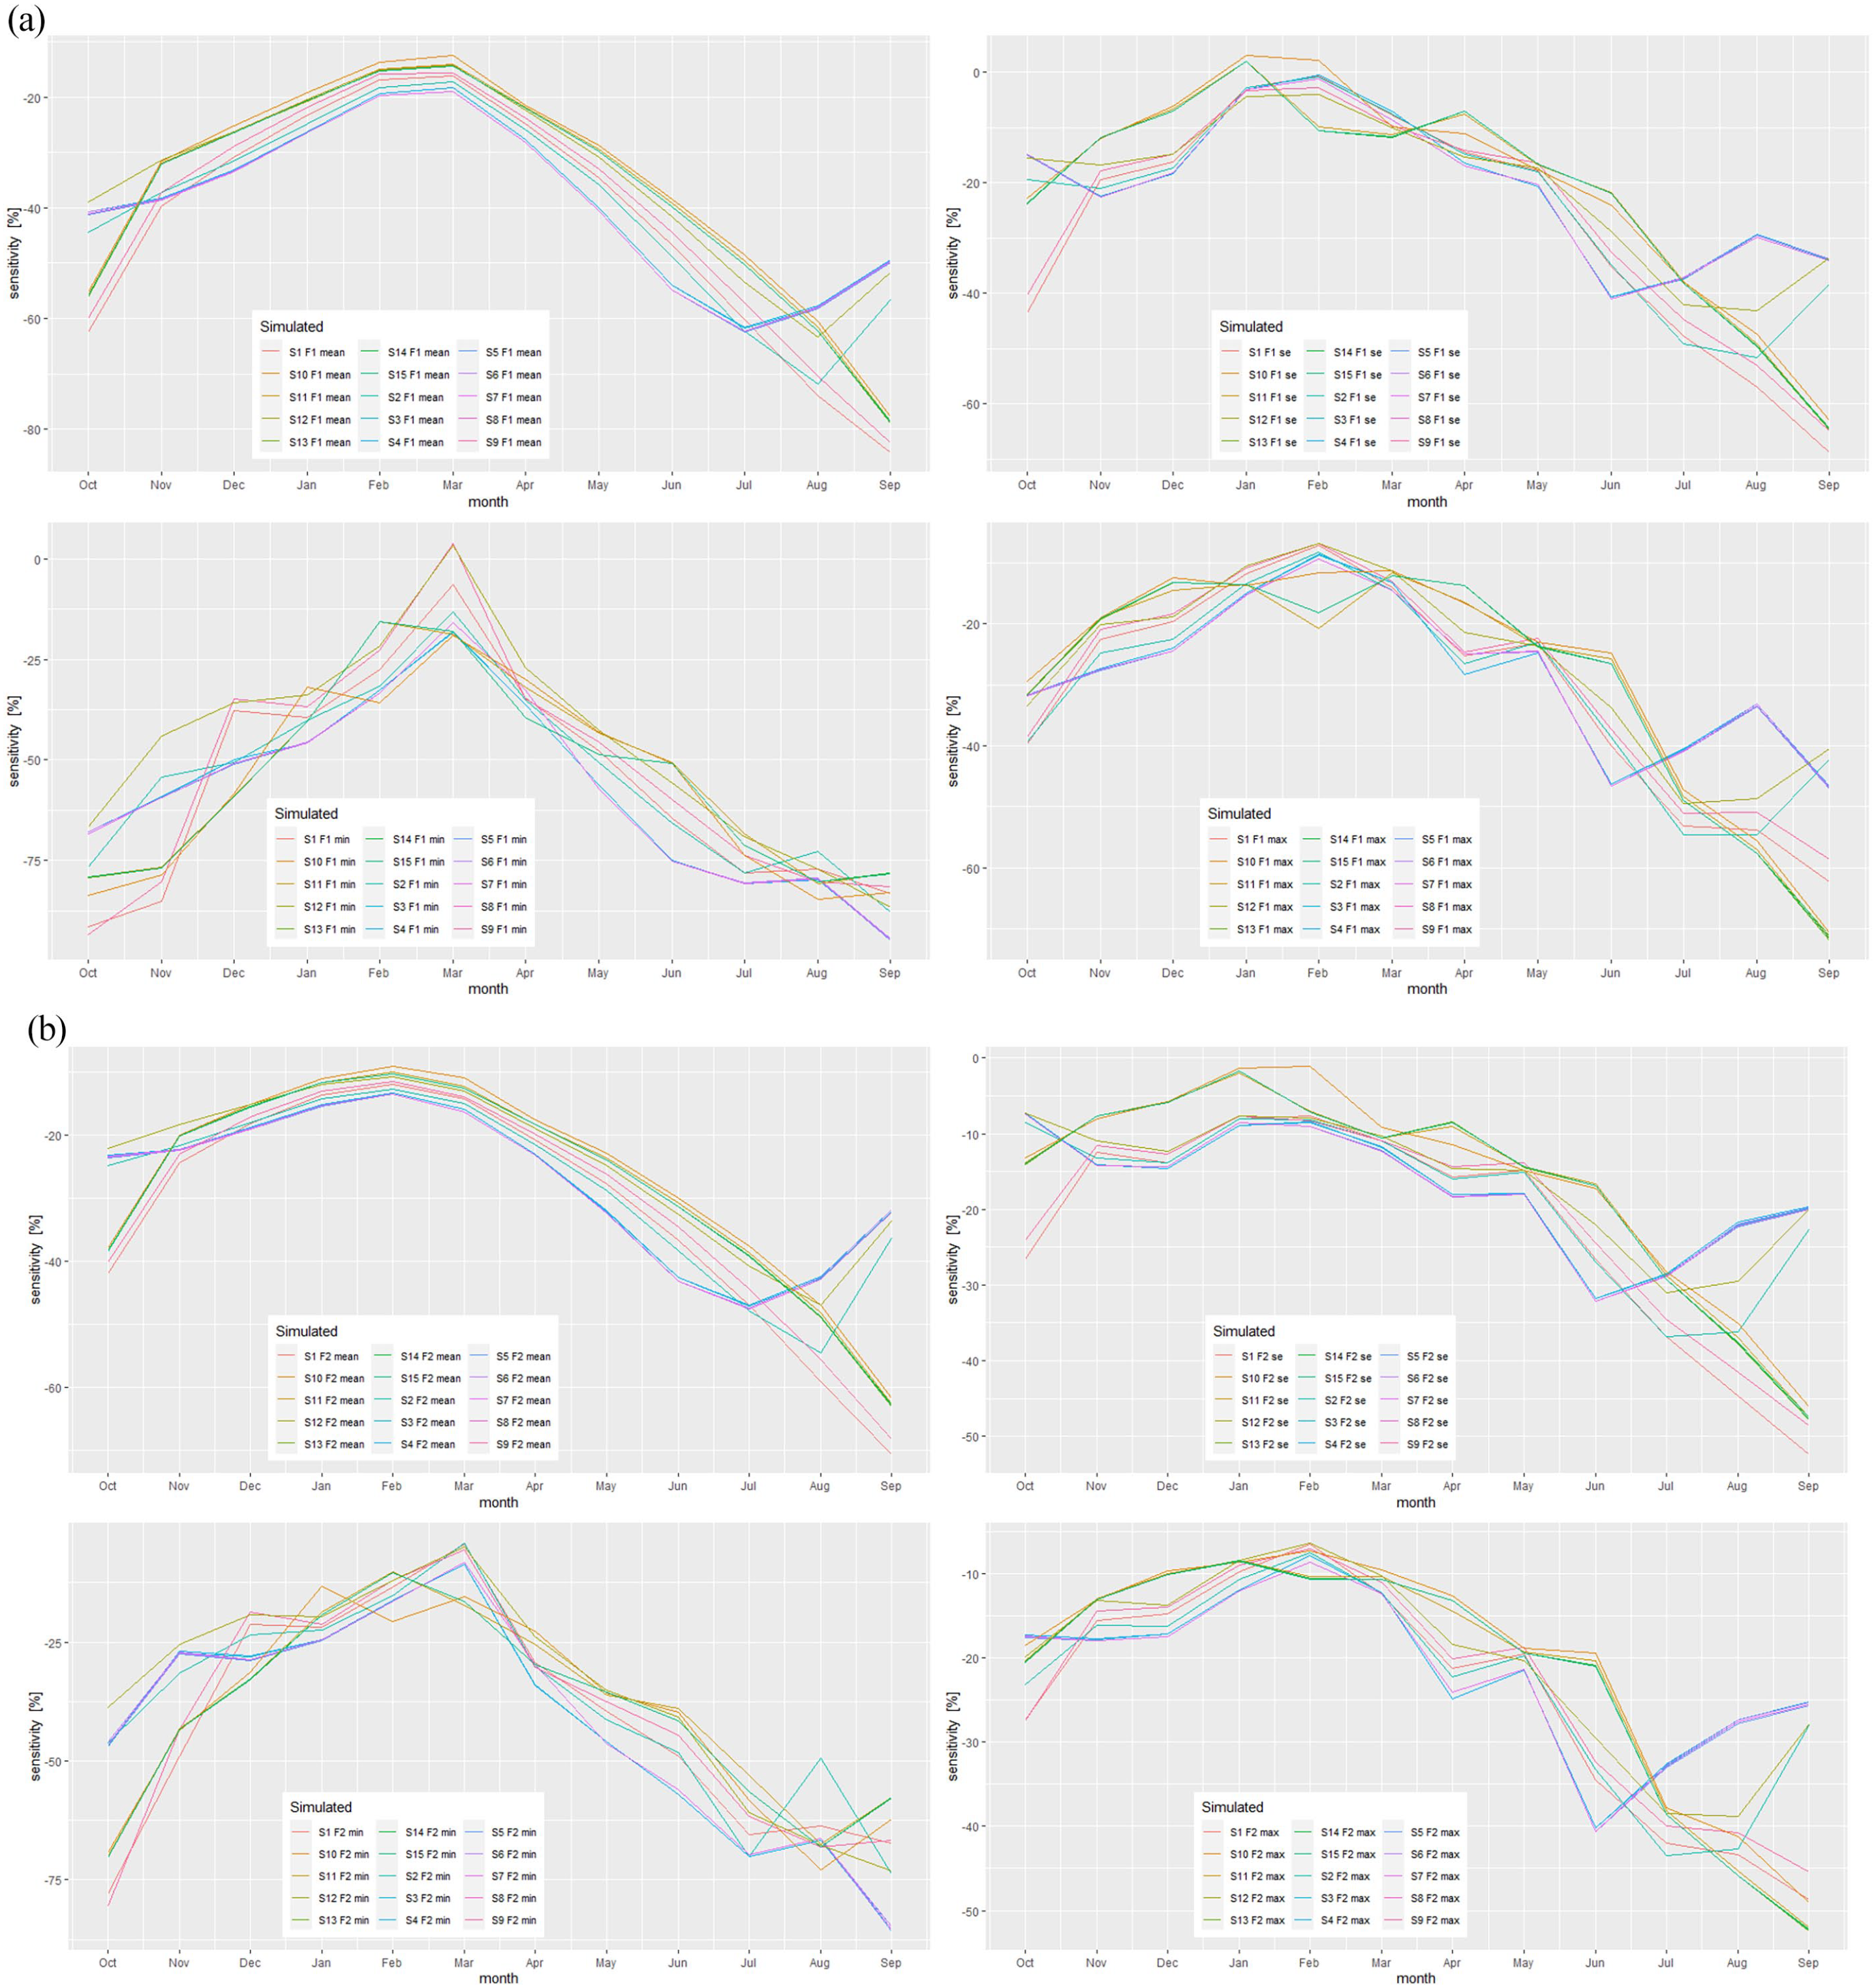
Sensitivity of the different catchment vegetation scenarios to the different climate scenarios: (a) Extreme forested scenario and (b) moderate forested scenario. Sensitivities are relative to the baseline simulations as shown in the upper panel of Figure 11.
Estimated flooding statistics for 10 replicates of 30-year time series of simulated flows under the different climate scenarios.
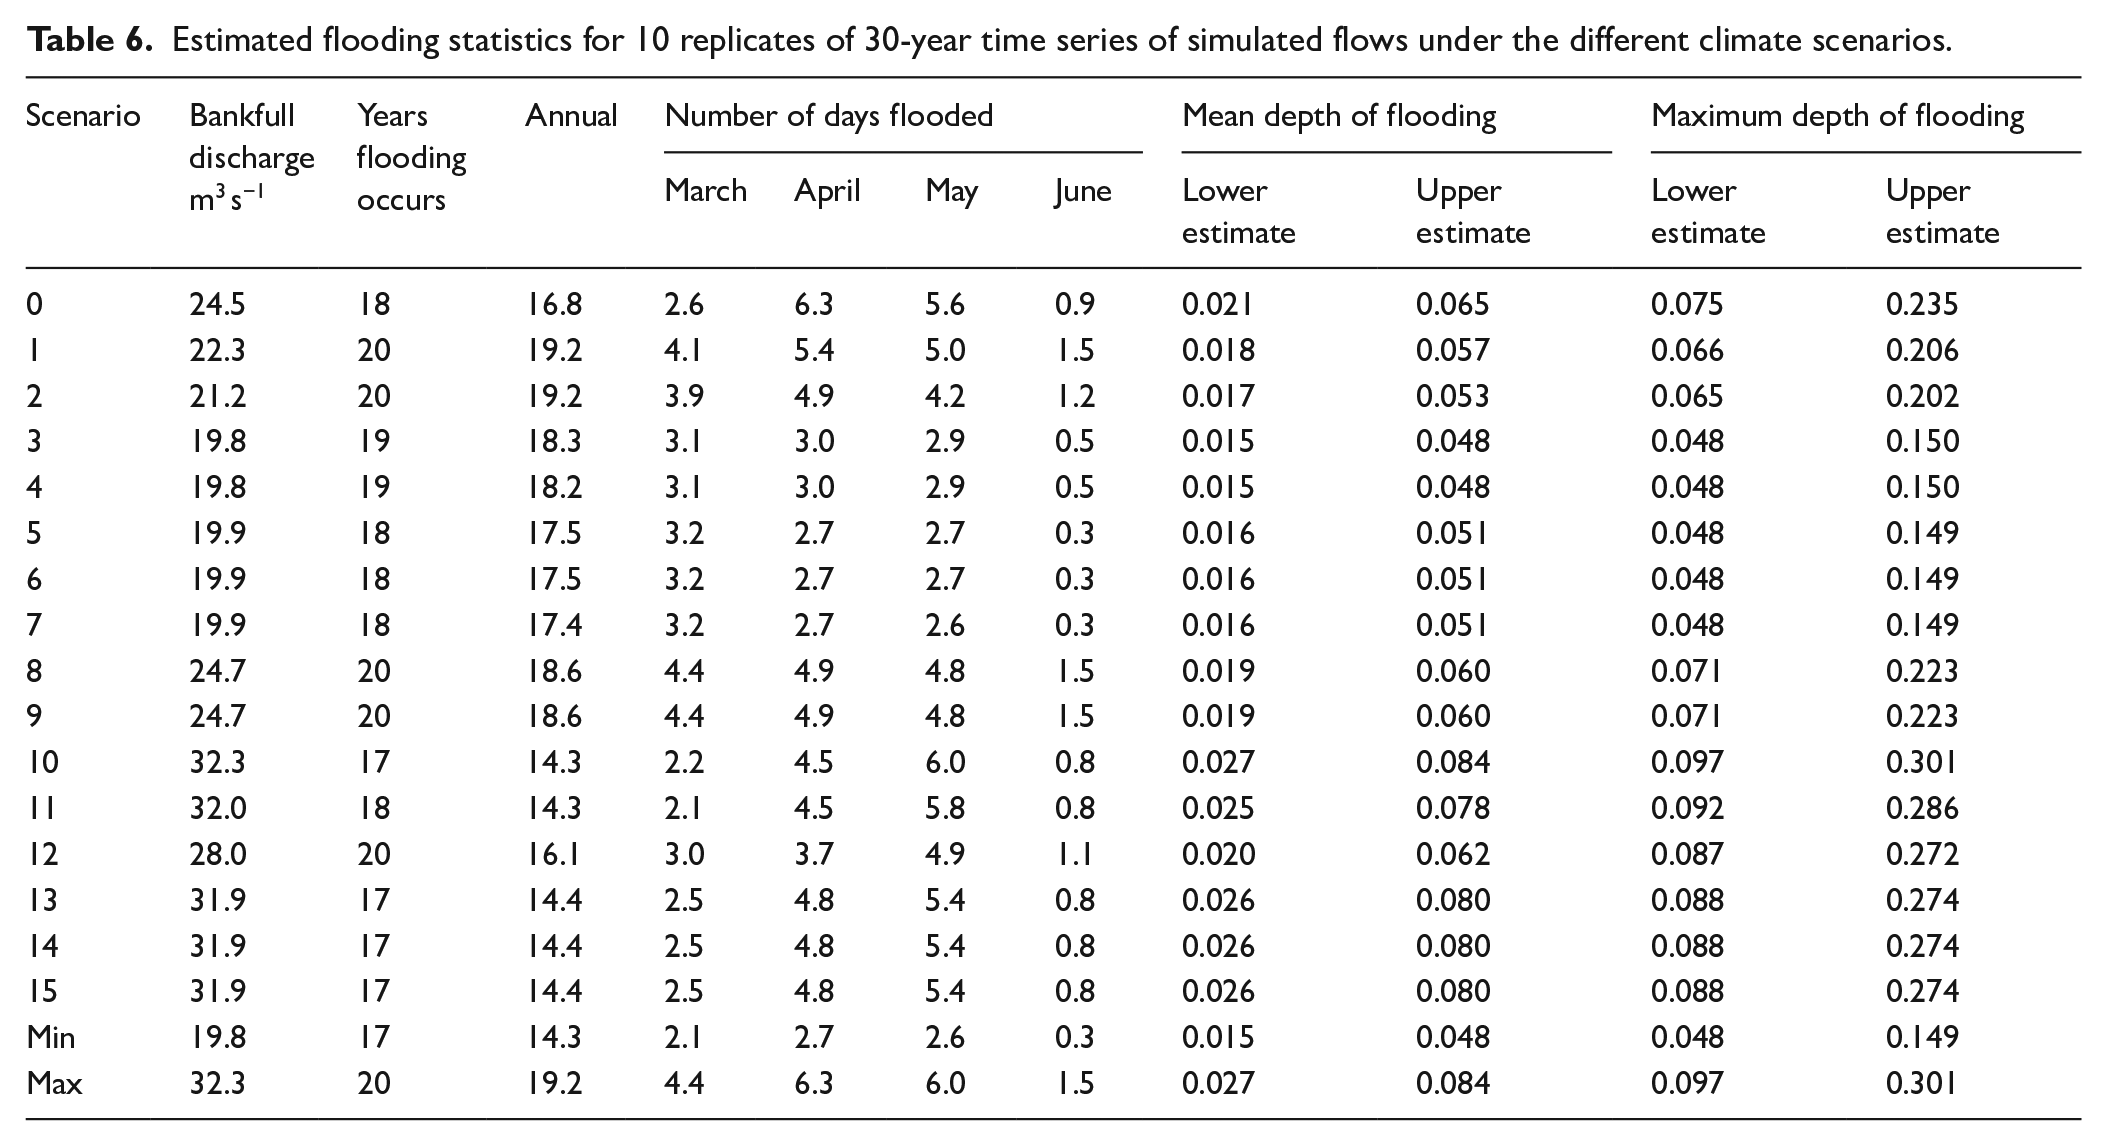
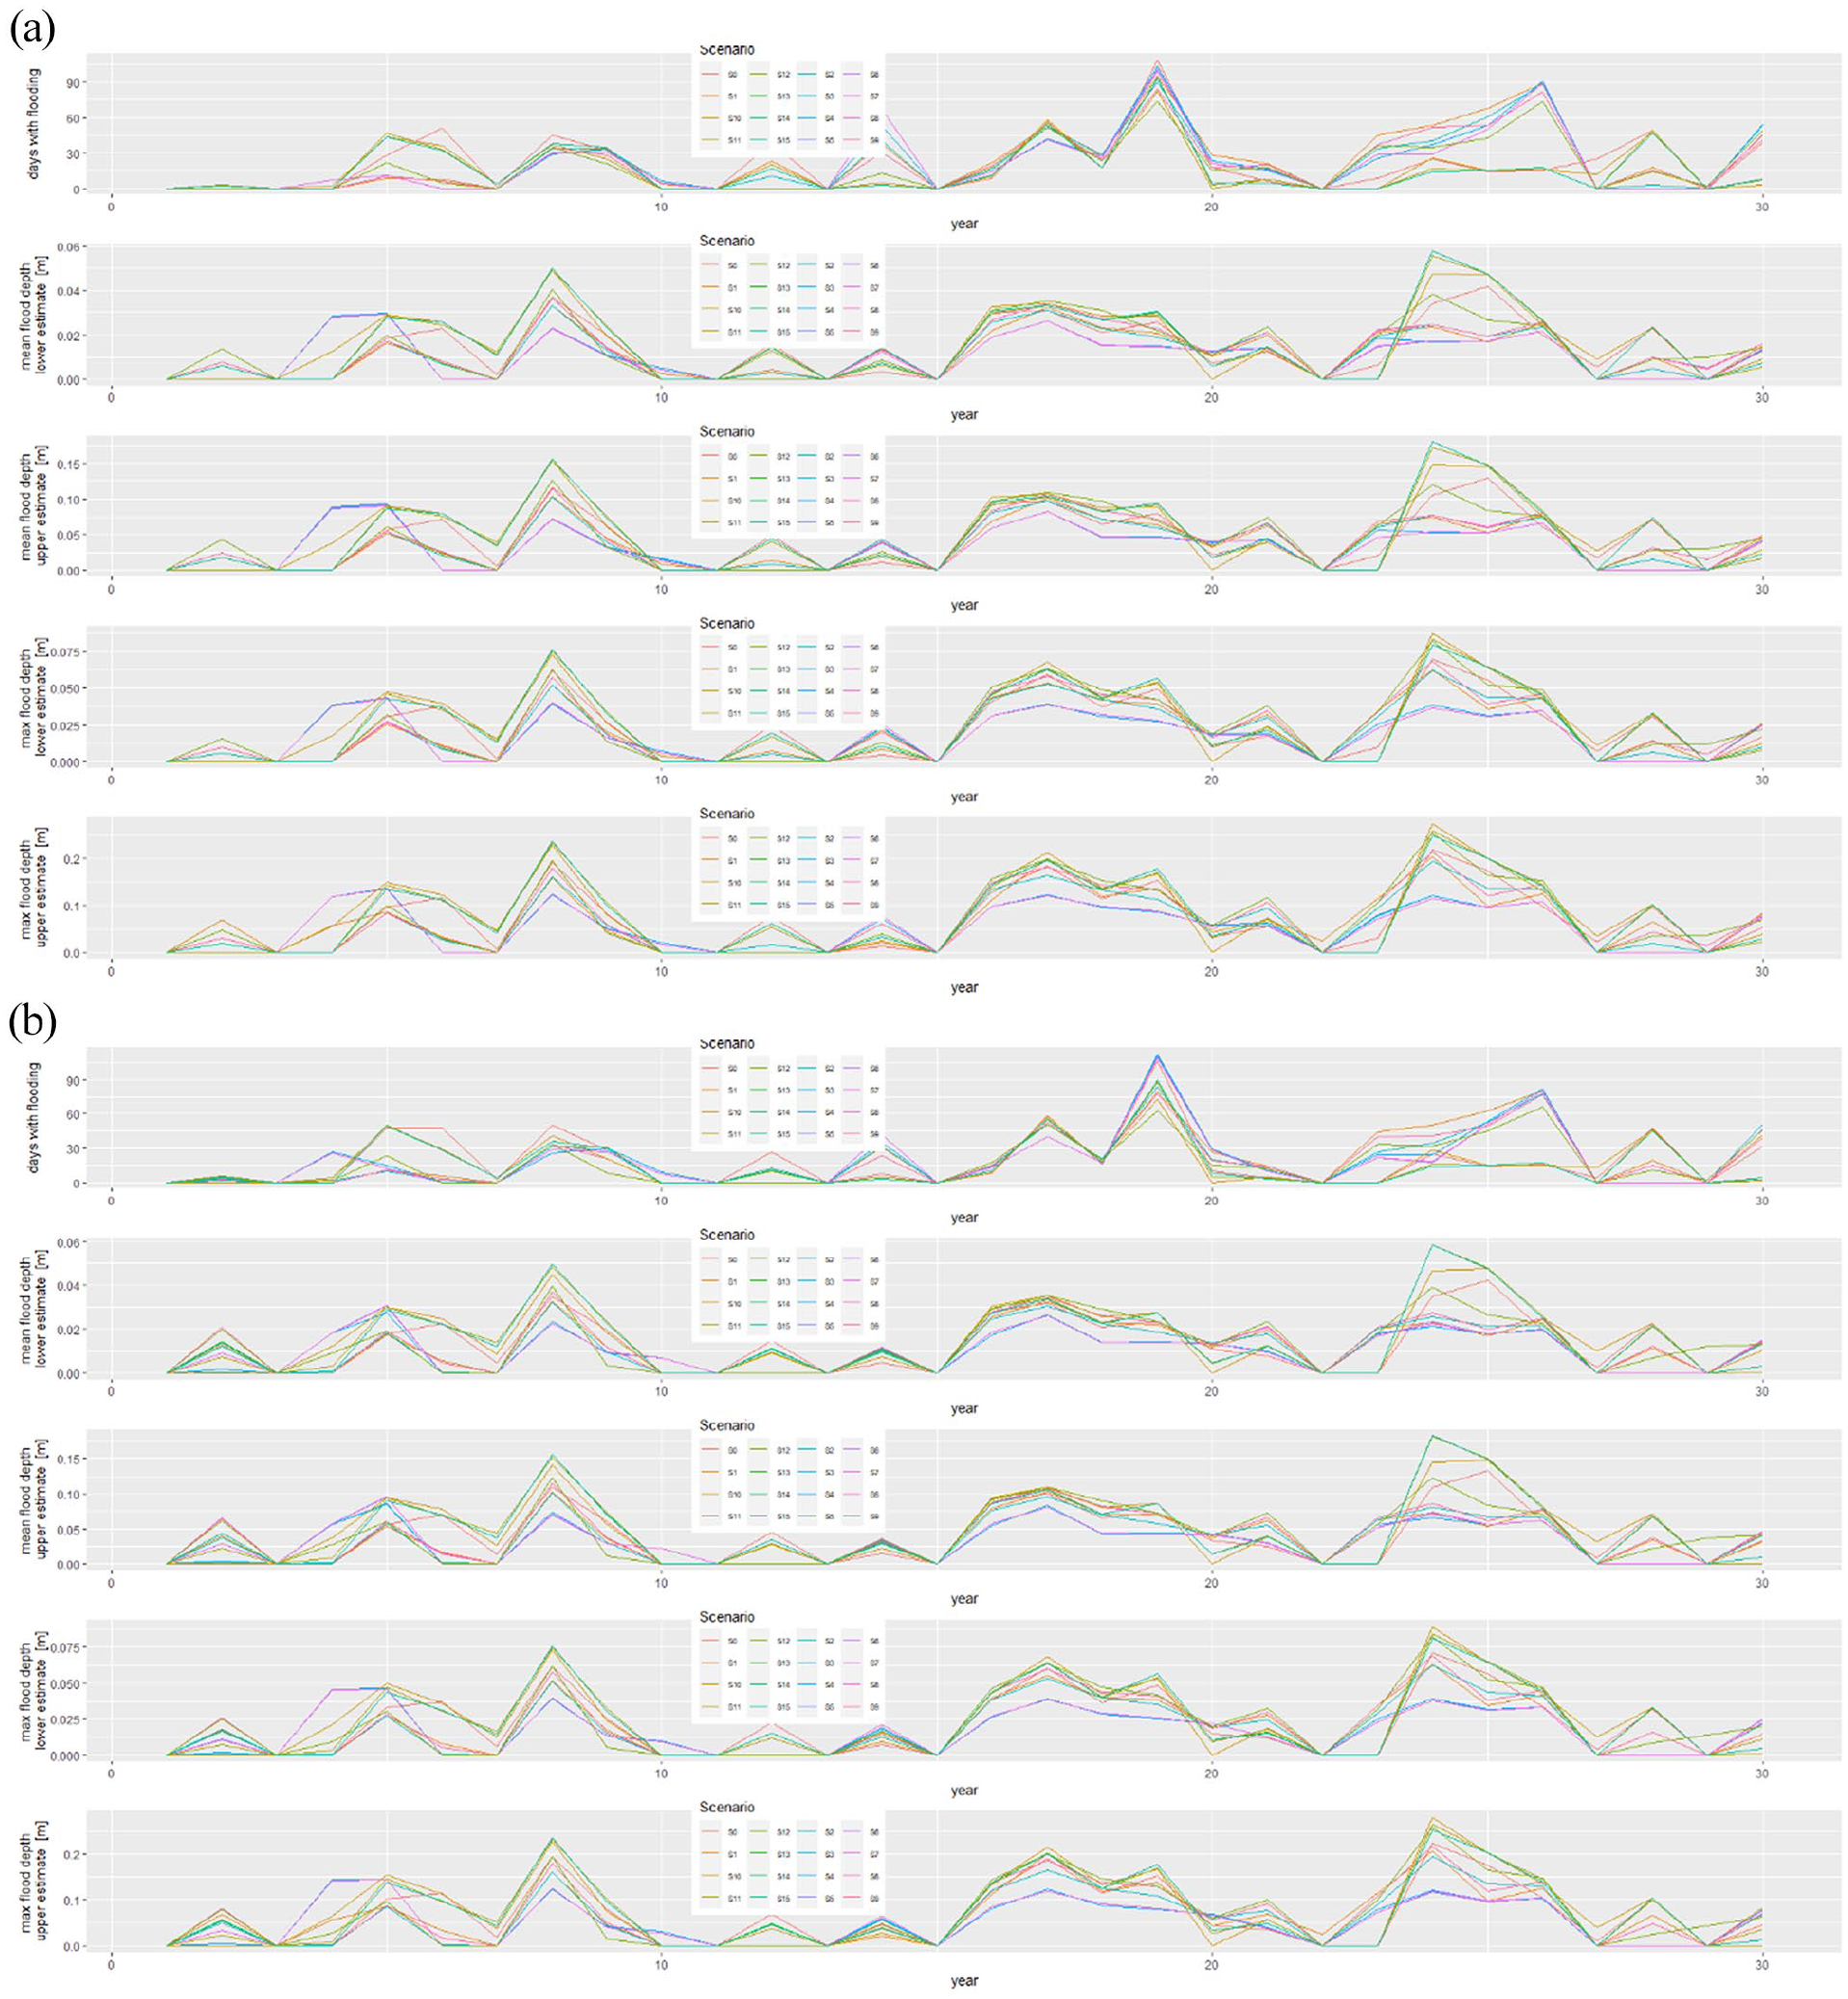
The hydraulic modelling results also produce the same groups as above. Estimated bankfull discharge for the modern baseline is 24.5 m3 s−1 with flooding in 18 out of 30 years and on average 16.8 days of flooding per year, 11.9 days of which are in April and May and 15.4 days in March to June. There is significant interannual variability in the duration of flooding under all scenarios tested (Figure 13 and Table 7). The seasonal timing of flooding also varies dramatically: only 51–52% of flood days in group (f) are in the months of March to June, and this proportion increases to 74%, 84%, 84%, 79% and 93–95% in groups (d), (b), (e), (a) and (c), respectively. In other words, only group (c) has more flooding concentrated in this part of the year than under modern baseline conditions (92% floods from March to June). Estimated mean flood depths in the channel belt range from 0.021 to 0.065 m, and estimated maximum flood depths in the channel belt are 0.075–0.235 m. Lower bankfull discharges than the baseline are estimated for group (f) (19.8–19.9 m3 s−1), group (d) (21.2 m3 s−1) and group (b) (22.3 m3 s−1), but the frequencies and durations of flooding are longer – up to 20 out of 30 years and 19.2 days per year on average in group (b). Flooding is more evenly spread between March and May in groups (a) and (f) and to a certain extent in group (d). Mean flood depths are lower than the baseline (0.015–0.051 m in group (f), 0.017–0.053 m in group (d) and 0.018–0.057 m in group (b)), as are the maximum flood depths (0.048–0.150 m in group (f), 0.065–0.202 m in group (d) and 0.066–0.206 m in group (b)). Higher bankfull discharges than the baseline are simulated for group (a) (24.7 m3 s−1), group (e) (28.0 m3 s−1) and group (c) (31.9–32.0 m3 s−1). Group (a) has more frequent and longer flooding than the baseline (20 out of 30 years for an average of 18.6 days per year); group (e) has more frequent but shorter duration flooding (20 out of 30 years for an average of 16.1 days per year); while group (c) has mostly less frequent and always shorter duration flooding (17 or 18 [S11 only] out of 30 years for an average of 14.3–14.4 days per year). The flooding is relatively evenly spread between March and May for group (a), but becomes progressively later in groups (e) then (c). In the most extreme case of S11, there averaged 2.1 days in March, 4.5 days in April and 5.8 days in May. The estimated flood depths in the channel belt are slightly lower in group (a) than in the baseline. For group (e) the mean estimated flood depth is about the same as the baseline, but the maximum estimated flood depth was higher (0.087–0.272 m). Group (c) had both higher mean (0.028–0.080 m) and maximum (0.092–0.286 m) estimated flood depths compared to the baseline.
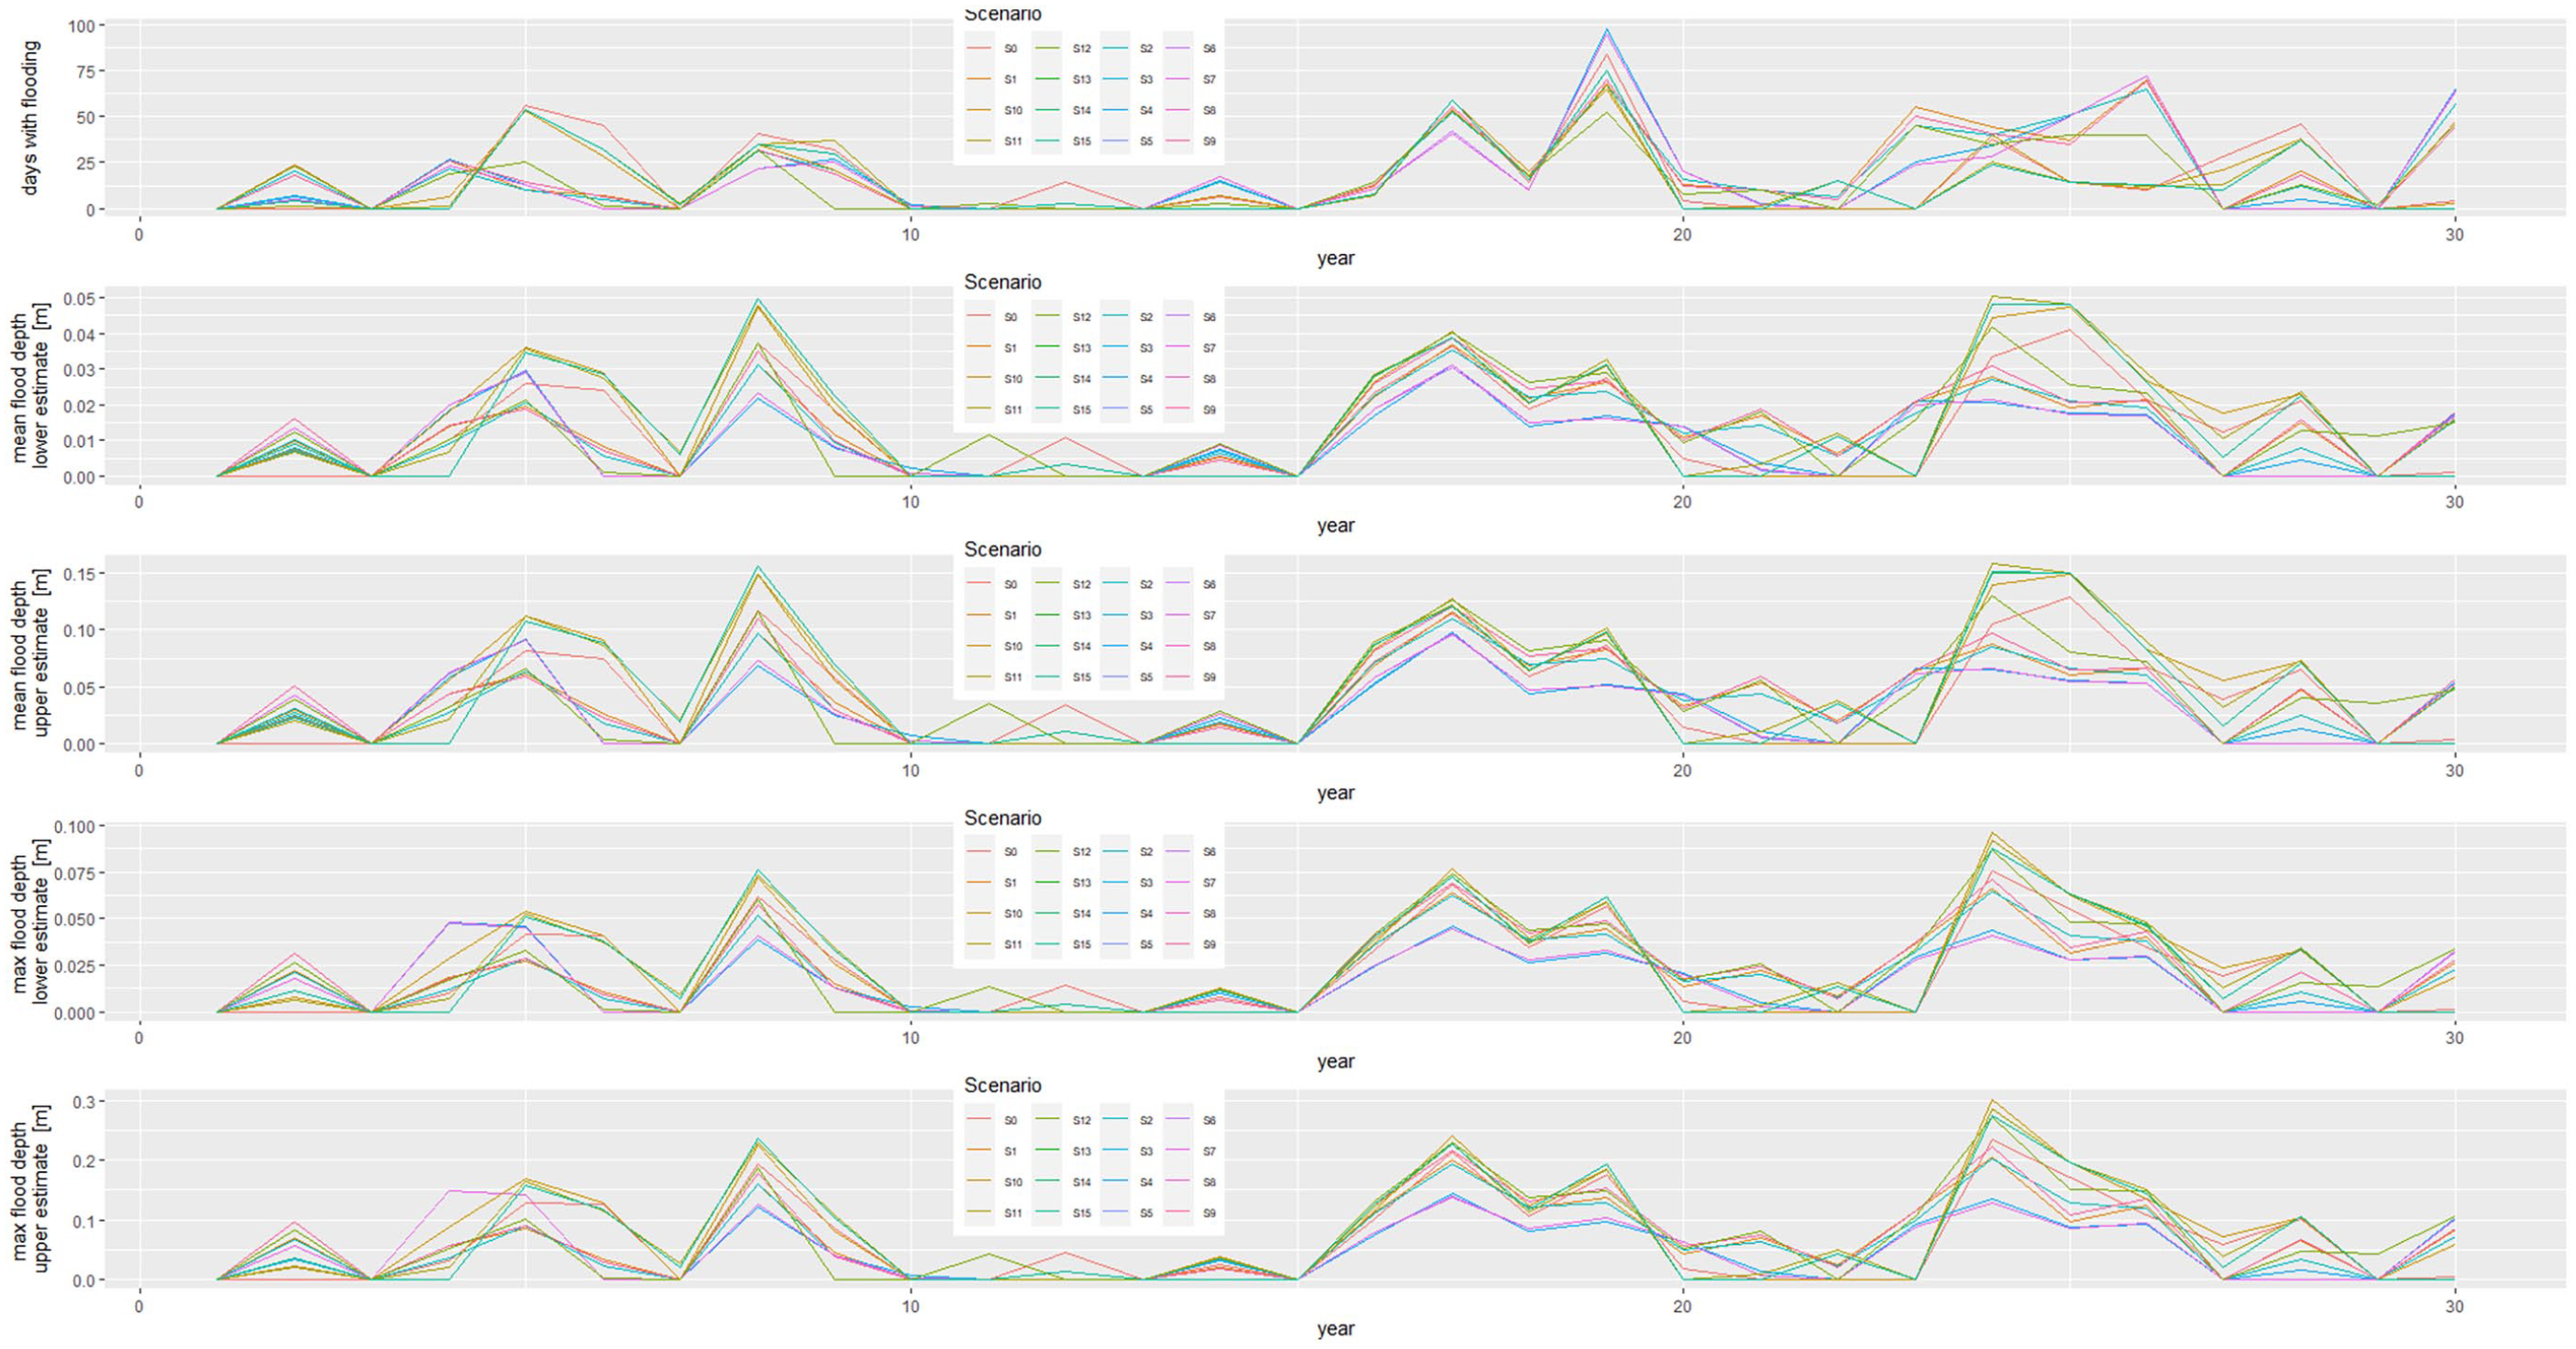
Simulated flooding time series for different climate scenarios. Each time series shows the different responses over a 30-year period in terms of mean number of days flooded, lower and upper estimates of mean flood depth during the period of flooding across the channel belt and lower and upper estimates of maximum flood depth across the channel belt. Further statistics are provided in Table 6.
Estimated flooding statistics for 10 replicates of 30-year time series of simulated flows under the different climate scenarios for the different vegetation scenarios.
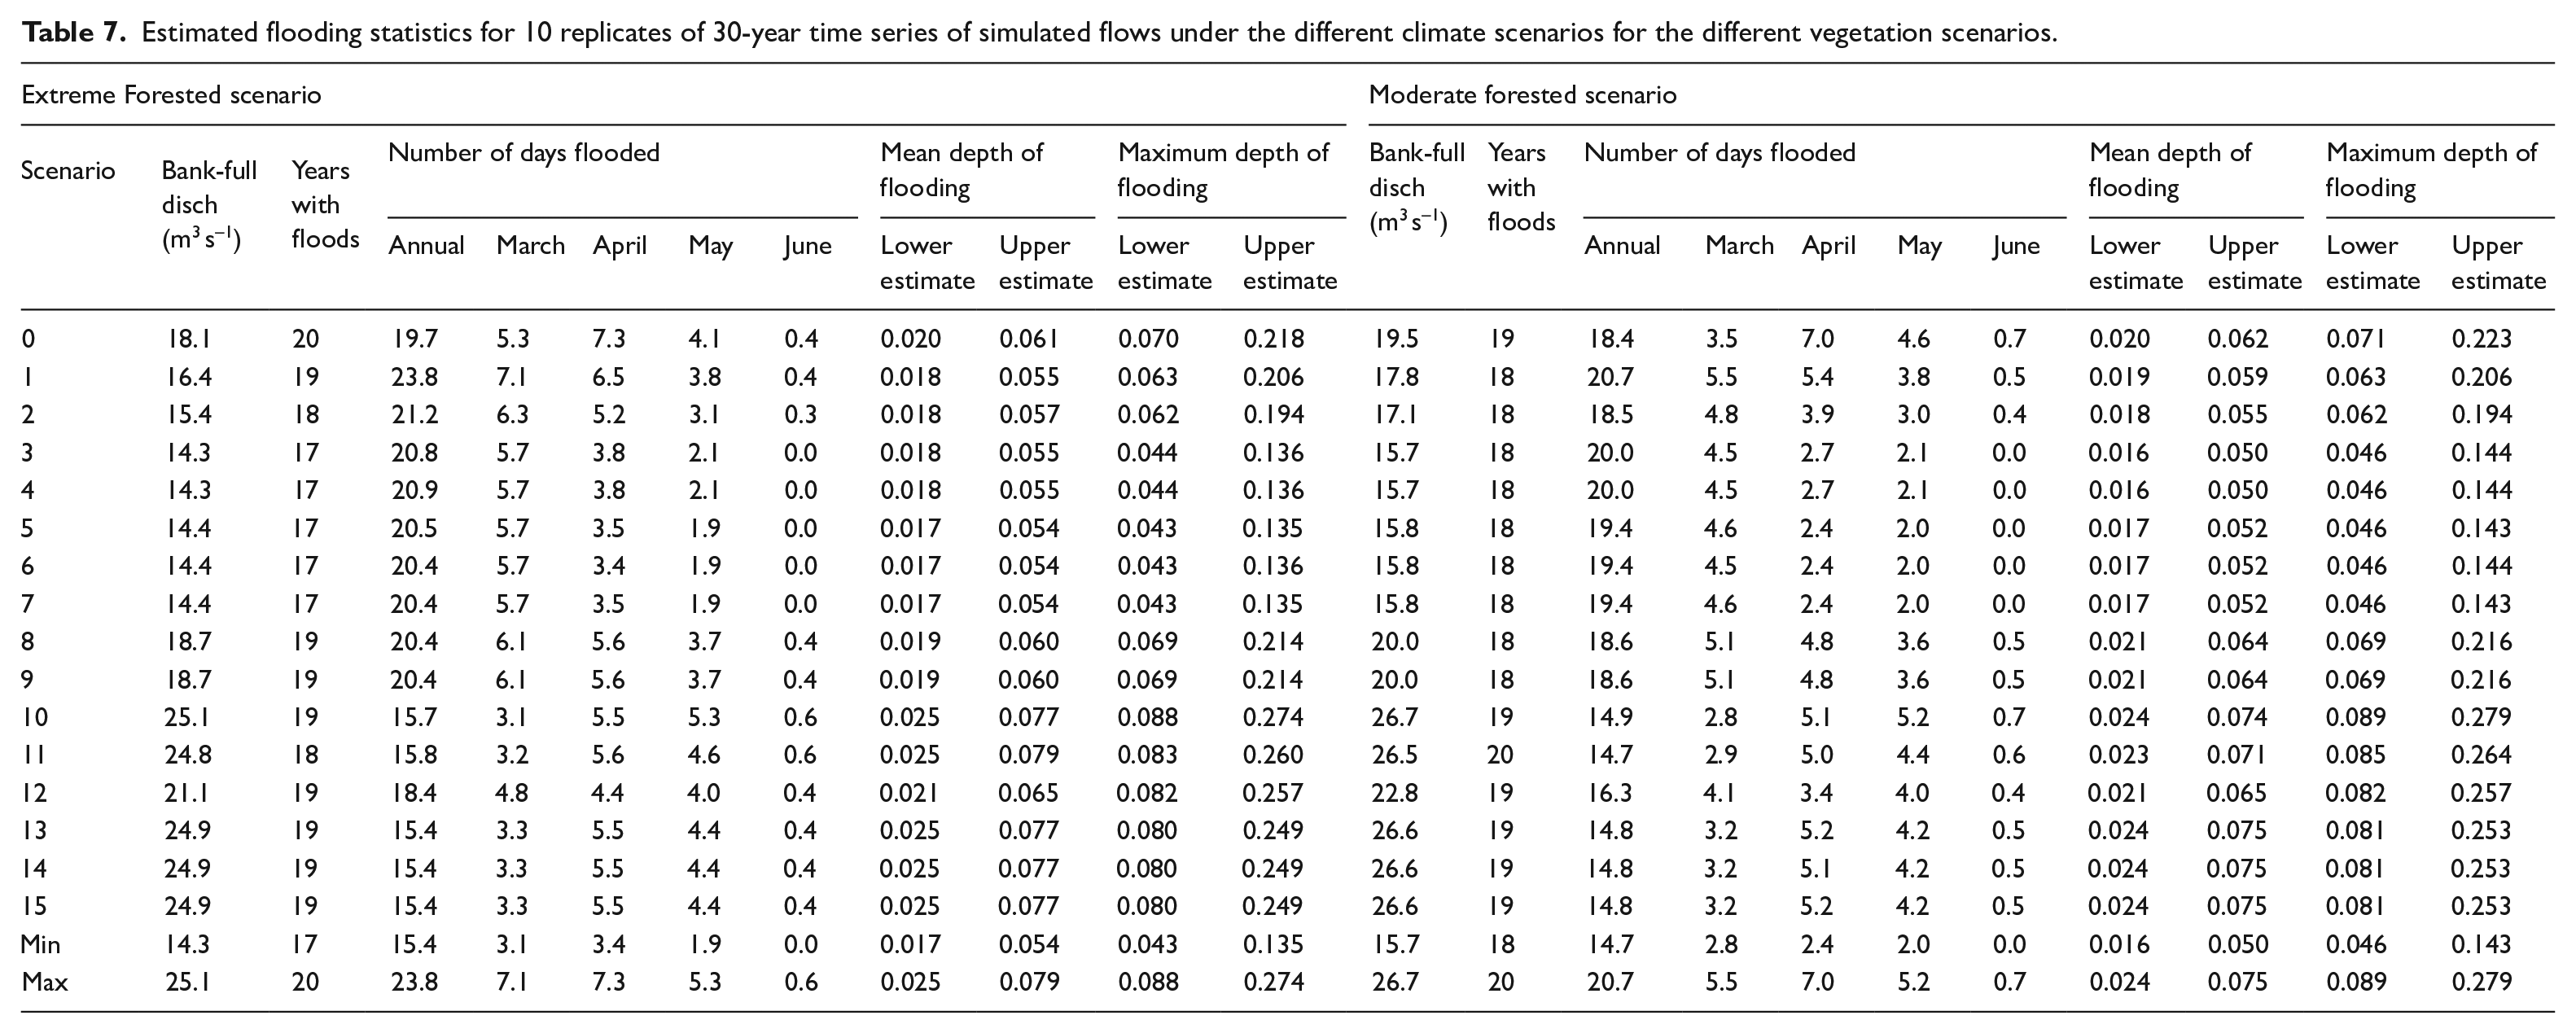
In both vegetation scenarios (Figure 14 and Table 7) groups (f), (d), (b), (a) and (e) produce lower estimated bankfull discharges than the modern flow and vegetation baseline (14.3–14.4, 15.4, 16.4, 18.7 and 21.1 m3 s−1 respectively in F1; 15.7–15.8, 17.1, 17.8, 20.0 and 22.8 m3 s−1 respectively in F2). Flooding is less commonly concentrated in the months of March to June than in the baseline in all cases (F1: 54–55%, 70%, 75%, 77%, 74% and 88–89% in groups (f), (d), (b), (a), (e) and (c), respectively; F2: 46–47%, 65%, 74%, 75%, 73% and 88% respectively) In F1, group (f) floods less frequently (17 years out of 30) but for a longer duration (20.4–20.9 days per year on average). Flooding is more dominantly earlier in the year (5.7 days on average in March, compared to 3.4–3.8 days in April and 1.9–2.1 days in May), with a lower range of mean depths (0.017–0.055 m) and maximum depths (0.043–0.136 m) when compared with the baseline. Group (d) has the same frequency under F1 as the baseline, but a longer average duration (18 years out of 30 but for 21.2 days per year). The flooding is earlier (11.5 days in March and April) but with lower mean (0.018–0.057 m) and maximum (0.062–0.194 m) depths. Groups (b), (e) and (a) have more frequent (19 years out of 30) and longer duration (23.8, 20.4 and 18.4 days per year, respectively) flooding than the baseline. The mean flood depths are slightly lower than the baseline for groups (b) and (a) (0.018–0.055 and 0.019–0.060 m, respectively), as are the maximum flood depths (0.063–0.206 and 0.069–0.214 m, respectively). Group (e) has the same estimate mean flood depth in the channel belt as the baseline (0.021–0.065 m), although it has a deeper range of maximum estimated flow depths (0.082–0.257 m). For group (c), where the estimated bankfull is slightly higher (24.8–25.1 m3 s−1) than the baseline, the frequency is either the same (18 out of 30 years for S11) or higher (19 out of 30 years), but of slightly shorter duration (15.4–15.8 days per year). Flood days are more concentrated in April and May (9.9–10.8 days per year). Both estimated mean (0.025–0.079 m) and maximum (0.088–0.274 m) flood depths are higher than baseline conditions. Under F2, while groups (f), (d), (b) and (a) flood with the same frequency as the baseline (18 years out of 30), they have longer durations of flooding (19.4–20.0 days per year for group (f), 18.5 days for group (d), 20.7 for group (b) and 18.6 days for group (a)), and all have more flood days in March than in April or May, when the peak flooding occurs for the baseline. Both mean (0.016–0.052, 0.018–0.055, 0.019–0.059 and 0.021–0.064 m for groups (f), (d), (b) and (a), respectively) and maximum (0.046–0.144, 0.062–0.194, 0.063–0.206 and 0.069–0.216 m for groups (f), (d), (b) and (a), respectively) flood depths are lower than the baseline. Group (e) floods slightly more frequently (19 out of 30 years) but for a slightly shorter duration (16.3 days per year), and with a distinctive pattern of more days in March and May than in April). Group (c) again has a higher estimated bankfull discharge (26.5–26.7 m3 s−1) and produces more frequent (19 or 20 years out of 30) but shorter duration (14.7–14.9 days per year) flooding than the baseline. As with the baseline, the flooding is more concentrated in April and May (9.3–10.3 days per year on average). These scenarios produce higher mean flood depths (0.071–0.089 m) and higher maximum flood depths (0.081–0.279 m) than the baseline.
Simulated flooding time series for different climate scenarios according to (a) the extreme forested; and (b) the moderate forested scenarios. Each time series shows the different responses over a 30-year period in terms of mean number of days flooded, lower and upper estimates of mean flood depth during the period of flooding across the channel belt and lower and upper estimates of maximum flood depth across the channel belt. Further statistics are provided in Table 7.
Discussion
When interpreting these model results, it should be remembered that peak flows are underestimated by the model for the points where we have data, and it might be necessary to take these simulation estimates as lower bounds of flooding for past conditions. For the different scenarios, bankfull discharge and thus the threshold for flooding ranges from 19.8 to 32.3 m3 s−1, although these thresholds are based on static conditions, and may have differed as the channel belt adjusted to climate or vegetation variability. Ayala et al. (2021) suggested on morphological grounds that flow capacity of the probably Chalcolithic 94/PC1 channel of Boyer et al. (2006) could have been much higher, but it is unlikely that underestimates of peak flows would produce such a disparity, and suggests further work is required to evaluate how the Neolithic channel systems discussed here evolved into the very different later system. A further caveat for the flooding estimates is that, as with the scenarios on which they are based, there are significant uncertainties from the climate and vegetation proxies, so that more specific estimates are impossible until these issues are resolved. For this type of study, it must be remembered that proxies are needed that reflect regional conditions and their spatial variability, so that behaviour of flows across the catchment can be reconstructed. Methods that provide information relating to the immediate area surrounding the site (e.g. Eastwood et al., 2018; Kabukcu, 2018) are unfortunately of little use in this context. Furthermore, much improved seasonal proxies are also required as the interaction of precipitation, temperature and vegetation is critical. However, by using a combined scenario-based approach with multiple methods, it is possible to have a direct estimate of the flow behaviour in the Neolithic Çarşamba and its uncertainty for the first time. The uncertainties on the estimates are broader in the Early and Late phases of occupation compared to the Middle and Final phases, but the modelling allows the estimation of flow behaviours over seasonal, interannual and longer timescales that are compatible with the high resolution sedimentological data now available (Ayala et al., 2017, 2021).
The Palaeoçarşamba would have been an anabranching system that over the Holocene went from being a humid to dryland system (Ayala et al., 2017). The system would have been influenced by alluvial floodplain features created by predominately fine sediments that would have led to the higher capacity for subsurface water storage and therefore mitigating less extreme flooding and spreading out the flow more broadly (Entwistle et al., 2018) as the system matured. This effect can be seen in the sediment record as the more ‘dry’ anastomosing channel types which developed in the period leading up to the Neolithic (Ayala et al., 2021: Figures 2.4–2.6), and is reflected in the range of low-energy deposits seen (Charles et al., 2014; Doherty, 2020). The drying of the system may have been a result of internal feedbacks as sediment was deposited as well as changing climate. The recent high-resolution sedimentological work coupled with the results of the hydrological modelling show scenarios in which flooding, even in the wettest scenarios, is contained within the anastomosing channel belt. The width of the channel belt would have most likely fluctuated between 1 and 2 km, constrained both by the inherited final Pleistocene topography of rolling marl surfaces (Ayala et al., 2017, 2021; Boyer et al., 2006; Roberts and Rosen, 2009), and by the flow funnelled through the sand ridge at Çumra, and by the rate of flow entering from upstream. Transmission losses through the karstic middle reaches of the Çarşamba seem to be significant in disconnecting the mountainous parts of the catchment from the lower lying areas, especially in summer and early autumn.
As well as these interpretations of where the Çatalhöyük landscape was wet, it is also possible to answer when it was wet to a more nuanced level than previously possible. The temporal scale of analysis guides multiple interpretations here. As anticipated conceptually in Ayala et al. (2021), the flow pattern is more spread out through the year as the flow reaches Çatalhöyük, compared to what happens in the mountainous upper catchment. On an event basis, flooding is simulated at many times during the year, and extreme events could be important at any time. Their impacts are likely to have been of shorter duration in the summer and autumn months, compared to the times of higher baseflows in winter and spring, but nevertheless could have affected crops at any time of the year. Seasonally, there could have been major differences throughout the time period of settlement: if group (f) scenarios are correct, flooding could have been only 46–56% of the time in the months of March–June. Under both vegetation scenarios, flooding is more spread out through the year, and only under the group (c) modern vegetation conditions is there more flooding in spring compared to the model baselines. The importance of being able to reconstruct catchment vegetation conditions at a higher resolution is thus critical in reducing the uncertainty in understanding both the amounts and seasonality of flood flows near the site. Over longer timescales, interannual variability is also significant. Simulations suggest that both from year to year there is significant variability, and there may be runs of years with little flooding followed by runs with a lot of flooding each year.
These results have important implications for the resilience of land uses dependent on water availability in the channel belt. Years without flooding or with much lower flows would affect both water availability and nutrient availability for crop growth, as well as the ability to pasture animals in the channel-belt area. Although the emphasis of past studies has been on the landscape as a wet environment (pace Roberts and Rosen, 2009) these results suggest that drought would also have been a critical constraint on activities throughout the settlement period. Over longer time periods, as noted above, it is impossible for the moment to highlight whether there were any specific trends in flow patterns, but it is highly likely that there were variations on decadal scales, that is at shorter timescales than the centennial archaeological phases of occupation, based on broader observations of climate variability in the Mediterranean region (Wainwright and Thornes, 2004). Care should be taken when interpreting the archaeological phases based on cultural material and building structures in relation to environmental variability given that the links between the two sources of evidence are not straightforward (see also Wainwright and Ayala, 2019).
Interpretations of Neolithic land-use practice in the vicinity of the tell site have been driven by interpretations of the nature, location and development of the alluvial landscape (Charles et al., 2014; Roberts and Rosen, 2009; Sherratt, 1980). Initial theories of floodplain soils being sought after were later contested and replaced by interpretations of an environment dominated by extensive and long lasting spring flooding which would have rendered much of the local environment unable to support crops (Roberts and Rosen, 2009). The sedimentological and model results presented here strongly contest this latter interpretation in three ways. First, travel times and transmission losses result in less extreme spring floods that previously suggested, even in the scenarios where these floods are most pronounced. Secondly, the estimated flow discharges are consistently low enough across all the scenarios studied to suggest that the flooded areas would have been more constrained to the 1–2 km belt noted above. Extensive areas would thus have been available for dry farming of cereals away from the channel belt yet still close enough to the settlement for easy access (96% of years in the CRU-TS reconstructions have annual precipitation of at least 250 mm). This interpretation is also consistent with observations of water-table depth in the 1960s (Driessen and van der Linden, 1970), as well as from early modern observations (Altuntaş, 2000; Bildirici, 2000; Erdoğru, 2010). Thirdly, the local relief of islands in the channels combined with the relatively low flood depths across the channel belt would have produced relatively low flow shear stresses, and thus be unlikely to erode plants during the growing periods of crops, and flooding would have been for relatively short periods of time in most years. These interpretations are also compatible for evidence of use of both dry and wet environments in agricultural resources (Bogaard et al., 2021), as well as domesticated and wild animals, and other wild plant resources (Wolfhagen et al., 2020, 2021), and the relative locations of riparian and steppe plants (Collins et al., 2018) although to note their interpretation is based on specific locations in De Meester (1970) which have been superseded by the discussions above.
Conclusions
Although limited by the detail and uncertainty of currently available climate and vegetation proxies, this paper suggests the importance of water resources for the Neolithic population of Çatalhöyük can be understood on a number of spatial and temporal scales. Over the timescale of the settlement overall, it is not possible to suggest whether there were trends in flows as a result of climate or vegetation change, but it is highly likely that there was variability on decadal scales as well as the interannual variability observed in the modelling. As a result, persistent occupation at the site would have required resilience to both flooding and to drought. Seasonal patterns of flooding would have been less marked that has been previously suggested, and the nature of that flooding would have both been relatively shallow, unerosive and often short lived.
By adopting a holistic approach to the hydrological modelling of the Neolithic Çarşamba we have been able to identify the nature and extent of seasonal flooding and its significance within the agricultural year. Without this finely nuanced model, spatio-temporal patterns of land use can only be suggested on the basis of the environmental proxies that have survived in the archaeological record. Here, instead, we have been able to identify the extent and dynamism of the potential water availability essential for the agricultural occupation at the site. The detailed sedimentological reconstructions suggest that the channel belt would have been relatively close to the west of the East Mound during the Neolithic, although further investigations are required to provide more precise interpretations. The balance between a metastable environment of the wetter locations within the channel belt and the more consistently drier conditions further away on the basin floor would have made the landscape ideal for the transitional period of adoption of agricultural practices while relying heavily on the broad spectrum of wild local resources (Charles et al., 2014; Doherty, 2020; Wolfhagen et al., 2020, 2021). It would also have enabled the development of resilient subsistence approaches, taking advantage of the wetter and drier niches available in the riverscape, and may thus have contributed to the longevity of settlement at Çatalhöyük.
This holistic approach has demonstrated that the riverscape is much more than a static view of flooding episodes bringing water and sediments essential to agriculture. The lived experience of the Neolithic population of Çatalhöyük would have been entangled in a much more dynamic ebb and flow of wet and dry conditions which would have affected the possibilities of coexistence with the riverscape at multiple temporal and spatial scales. In order to understand of the role of Çatalhöyük in the adoption of agriculture and the emergence of large and dense population centres this more nuanced holistic approach is essential.
Footnotes
Acknowledgements
We thank Ian Hodder for the opportunity to participate in the Çatalhöyük Research Project. In formulating this paper we had helpful conversations with Lisa and James Baldini, Neil Roberts, Michele Massa and Dan Lawrence. We are grateful to Çağlayan Bal for finding some of the historic documentation; to Ceren Kabukcu, Omer Yeteman and Tuna Kalayci for helping to track down data on climate and flows; and to Chris Orton for help in redrawing figures. Aydın Bektaş at the Turkish Meteorological Office generously provided daily climate data. Neil Roberts also kindly provided access to the Nar data.
Funding
The author(s) received no financial support for the research, authorship, and/or publication of this article.