
Abstract
How did socio-cultural transformation processes change land-use patterns? Throughout the last 50 years, outstanding comprehensive geographic, archaeobiological, and archaeological data have been produced for the area of Oldenburger Graben, Schleswig-Holstein, Germany. Based on this exceptional data set, we are able to study the land-use patterns for a period ranging from the Final Mesolithic until the Late Neolithic (4600–1700 BCE). By application of fuzzy modeling techniques, these patterns are investigated diachronically in order to assess the scale of transformations between the different archaeological phases. Based on nutrient requirements and proposed dietary composition estimates derived from empirical archaeobotanical, archaeozoological, and stable isotope data, the required extent of the areas for different land-use practices are modeled. This information is made spatially explicit using a fuzzy model that reconstructs areas of potential vegetation and land-use for each transformation phase. Pollen data are used to validate the type and extent of land-use categories. The model results are used to test hypotheses on the dynamics of socio-cultural transformations: can we observe a diversification of land-use patterns over time or does continuity of land-use practices prevail? By integrating the different lines of evidence within a spatially explicit modeling approach, we reach a new quality of data analysis with a high degree of contextualization. This allows testing of hypotheses about Neolithic transformation processes by an explicit adjustment of our model assumptions, variables, and parameters.
Keywords
Introduction
The aim of this paper is to gain a deeper understanding of the interaction between humans and the environment during the Neolithic in North-Central Europe. The study focuses on settlements of the Late Mesolithic and Neolithic periods between 4600 and 1700 BCE in a former firth region of the Oldenburg Graben, at the Western Baltic Sea, Germany. The time span considered includes a variety of cultural-historical phenomena such as (a) the partly residential forager societies of the last phase of the Late Ertebölle Mesolithic (Hartz et al., 2007; Sørensen et al., 2018); (b) the mainly residential Funnel Beaker groups (Brozio, 2016; Müller, 2012); (c) potentially more mobile Single Grave Culture societies (Brozio, in press; Schultrich, 2018), as the northern appearance of the Corded Ware phenomenon; and (d) the dagger period groups at the end of the Neolithic (Kühn, 1979; Schwarck, 2018; Vandkilde, 1996). 1 While manifold transformations of the societies are mirrored in changing cultural remains, the impact of these mostly sedentary groups on their environment is still a matter of discussion. By modeling the spatial extent of land-use activities, we aim to assess whether the land-use intensity was so strong that in certain phases the carrying capacity of the natural environment was reached and might therefore be another reason for the occurrence of socio-cultural transformations.
Within our study area, the archaeological documentation, prospection, and excavation activities are among the greatest on a European scale. Thus, the evaluation of components of the subsistence economy based on a comprehensive settlement sample is possible. Based upon estimations regarding settlement sizes and diet, we quantify and map the potential land-use of Neolithic societal groups in order to illustrate how the cultural-historical transformations manifest themselves spatially. The results are compared and validated with pollen data from an off-site archive.
Our approach focuses on transformations phases, which we define as periods where discontinuities and innovations appear in a way that sustainable changes are visible in the archaeological or paleoecological record.
Environmental characteristics of the study area
The research area is part of the Eastern Uplands (Östliches Hügelland; Fränzle, 2004), an area that was formed by moraines of the Weichselian Glaciation. The highest elevation is the Bungsberg (164 m; Figure 1) in the West. The surroundings of the Oldenburger Graben are characterized by a gently rolling ground moraine relief (Meynen and Schmithüsen, 1962), with glacier-induced, formerly calcareous, till deposits. Post-glacial decalcination and subsequent loamification lead to the development of Luvisols (Horn et al., 2006), Cambisols, Gleysols, and Histosols (Fränzle, 2004). In general, there is a tendency of soil acidification in the area that started with the onset of the Holocene.
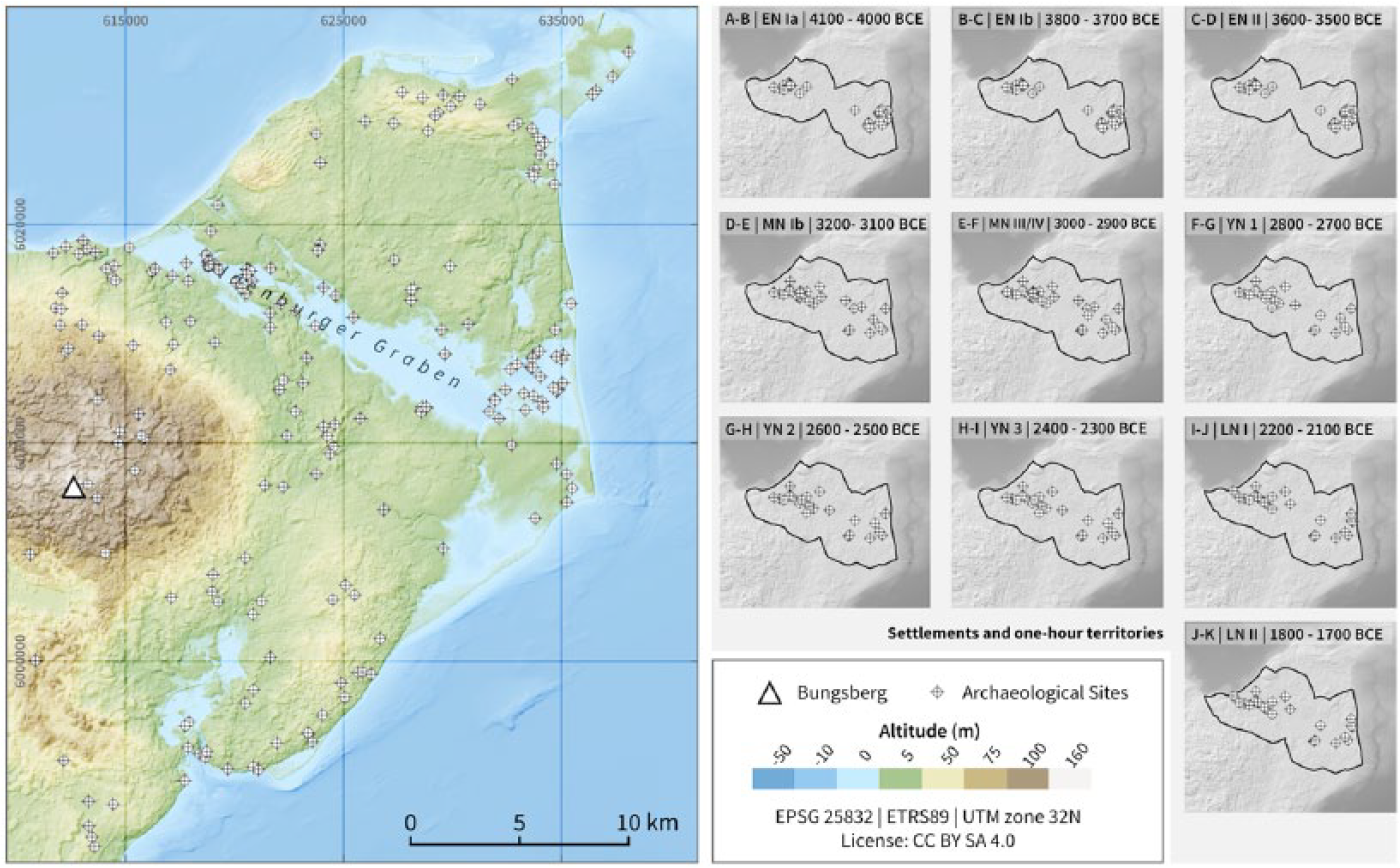
(Left) General overview of the study area; (right) employed Neolithic settlement location for the subsequent analyses with their corresponding 1-h territory. Those periods of cultural change and accompanied transformations are shown, whose model results are given in Figures 4 and 6. Exact amount of settlements is given in Table 1.
The time span considered here is climatically characterized by a transition from the Atlantic (ca. 6800–3800 BCE) to the Subboreal period (ca. 3800–700 BCE; Nelle and Dörfler, 2008: 57 ff.). This transition is characterized by generally decreasing temperatures (Böse et al., 2018: 162) and wetter climatic conditions (Barber et al., 2004; see also for recent discussions Krossa et al., 2017; Warden et al., 2017).
The Oldenburger Graben area, characterized by lakes and swampy depressions, underwent marked changes during the late glacial and early Holocene. Because of postglacial sea-level rise, the late Atlantic shallow firth of the Baltic was flooded from around 6000 BCE onward, with an oscillating rise between 4800 BCE (–4 m a.s.l.) and 2700 BCE (–1.5 m a.s.l.; Jakobsen, 2004). Accompanying coastal erosion caused spit formation that blocked the former bay and lead to the development of a brackish lagoon during the Neolithic. Limnic sedimentation in the western part of the Oldenburger Graben started around 2700 BCE (in the pollen diagram Kleinwessek marked by a decrease of Chenopodiaceae and Hystrix and an increase in Sparganium-type Figure 3; Supplemental Material B available online). In the eastern part, this sedimentation was interrupted by a second marine phase, and was finally cut off from the Baltic Sea around 2500–2000 BCE (Jakobsen, 2004).
Archaeological characteristics of the study area
The Oldenburg Graben has been the focus of Mesolithic and Neolithic research projects since the 1950s because of its exceptionally good preservation conditions for archaeological archives. As a result, the data available for this study is comprised of 63 domestic sites as represented mostly by surface finds (Hoika, 1987; Karnatz, 1987; Mennenga, 2016) and some excavated domestic sites with primarily wet conservation (n = 7) from the Late Mesolithic (Goldhammer et al., 2008; Hartz, 1999) to the Late Neolithic (Brozio, 2016; Brozio et al., 2018; Glykou, 2011; Hartz, 2002; Hoika, 1972, 1986, 1987; Meurers-Balke, 1983).
Within the late Mesolithic and Neolithic societies of the South Cimbrian Peninsula, we observe different societal transformations which are most probably linked to environmental, technological, and ideological changes (Müller, 2013, 2014). We thus identify periods of relative stability (labeled A, B, etc.) that alternate with transformation phases (labeled A–B, B–C, etc.) characterized by increasing discontinuities within the archaeological record.
Thus, the Neolithic socio-cultural groups that are considered here can be related to 10 particular transformation phases, which lead to diverse reorganization of economic and social processes, through the introduction of new social, cultural, and/or material characteristics (Brozio et al., 2012, 2017; Müller, 2013, 2014; Müller and Peterson, 2015; Table 1) 2 :
The late northern foragers with their specialization in aquatic resources had their first contacts ca. 5100 BCE with southern Neolithic groups (Hartz et al., 2011; Klassen, 2004) and developed from 4800 BCE onward a more specialized adaptation to environmental and cultural efforts, expressed in the regular use of pottery. This period (Late Ertebölle, period A) included contacts to farming societies that terminated in transformation phase A–B around 4100 BCE (Andersen, 2000; Glykou, 2011). During a potential supra-regional climate deterioration (Dreibrodt et al., 2010), the widening of the communication networks enhanced the introduction of cultivars and domesticates, and the introduction of adzes as well as flat based Funnel Beakers.
The earliest Funnel Beaker period B was non-monumental; archaeological remains are still sparse. The construction of monumental architecture started with non-megalithic long-mounds around 3800 BCE (Müller et al., 2014) that changed the cultural landscape (phase B–C). Woodland opening due to cattle grazing developed, but arable farming was practiced only sporadically.
The construction of first enclosures and megaliths in period C were still linked with horticultural practices. The subsequent transformation phase C–D is characterized by an increase in such monuments (Dibbern, 2015; Hage, 2016), especially the boom of megalithic graves (Fritsch et al., 2010; Hinz et al., 2012). In addition, an increasing opening of the woodlands takes place (Feeser et al., 2012) around 3600 BCE. This goes along with an extensification of crop growing on large arable fields and the introduction of the ard as an important technological innovation in agriculture (Kirleis & Fischer 2014).
Period D is the main construction phase for megaliths (Hinz et al., 2012; Müller, 1998, 2011). The intensified use of copper tools and the increasingly elaborated ceramic designs are characteristic of supra-regional as well as regional innovations (Klassen, 2001). A regional demographic growth (Brozio, 2016) and a regional to supra-regional increase of weapons in burials (Müller, 2011) around 3200 BCE is apparent. The transformation phase D–E that followed this boom period is characterized by a decline in regional ceramic designs, the end of the construction of megaliths, and the introduction of new supra-regional pottery designs.
During the subsequent centuries (period E), Funnel Beaker communities re-used previously existing megaliths for secondary burials without erecting new ones. The period is characterized by an increase of depositions, in particular axes and adzes, within the landscape.
The end of the funnel beaker societies (period F) is characterized by the occurrence of the Store-Valby style around 3000 BCE as well as the appearance of the phenomenon of the globular amphorae (Brozio, 2016; Hoika, 1987; Klooß, 2008; Müller and Peterson, 2015; Sørensen, 1998).
The appearance of Single Grave groups around 2850 BCE (Hübner, 2005; Schultrich, 2018; Struve 1955) with first barrows for individual burials describes the transformation to differently organized societies (phase F–G).
The early Young Neolithic with the early Single Grave Culture and latest Store-Valby ceramic groups displays in general a boom in new monumental activities (period G). Around 2600 BCE, with the end of the existence of the Store-Valby groups, the reduction in mound building and deposition of the axes phase G–H changed the conditions again (Hübner, 2005).
Since 2500 BCE, the latest Single Grave Groups did practice mainly secondary burials in megaliths or in earlier barrow mounds (period H). In contrast to earlier Corded Ware phases, now the integration of females into the representation of public space is practiced (Furholt, 2016). The increasing Bell Beaker influence (Mertens, 2003) and the introduction of new methods of flint production signifies the transformation to the Late Neolithic (phase H–I) around 2400 BCE.
Since 2300 BCE, the dominance of new methods of flint processing (Höfgen, 2014; Vandkilde, 1996) appears in the form of regionally retouched objects (period I). Supra-regionally, this period displays increasing contact that might be responsible for the starting regional metal production. Around 2200 BCE, the transformation phase I–J is observed: in contrast to the Late Neolithic, an intensification of barrow construction and the dominance of metal production signifies the decreasing role, for example, flint processing played later on.
A complete adaptation to the use of metal takes place in the Bronze Age (period K).
Detailed archaeological chronology, phases of relative stability (A, B, etc.) and transformations (A–B, B–C, etc.) with diet composition as derived from nutrient requirement analysis.
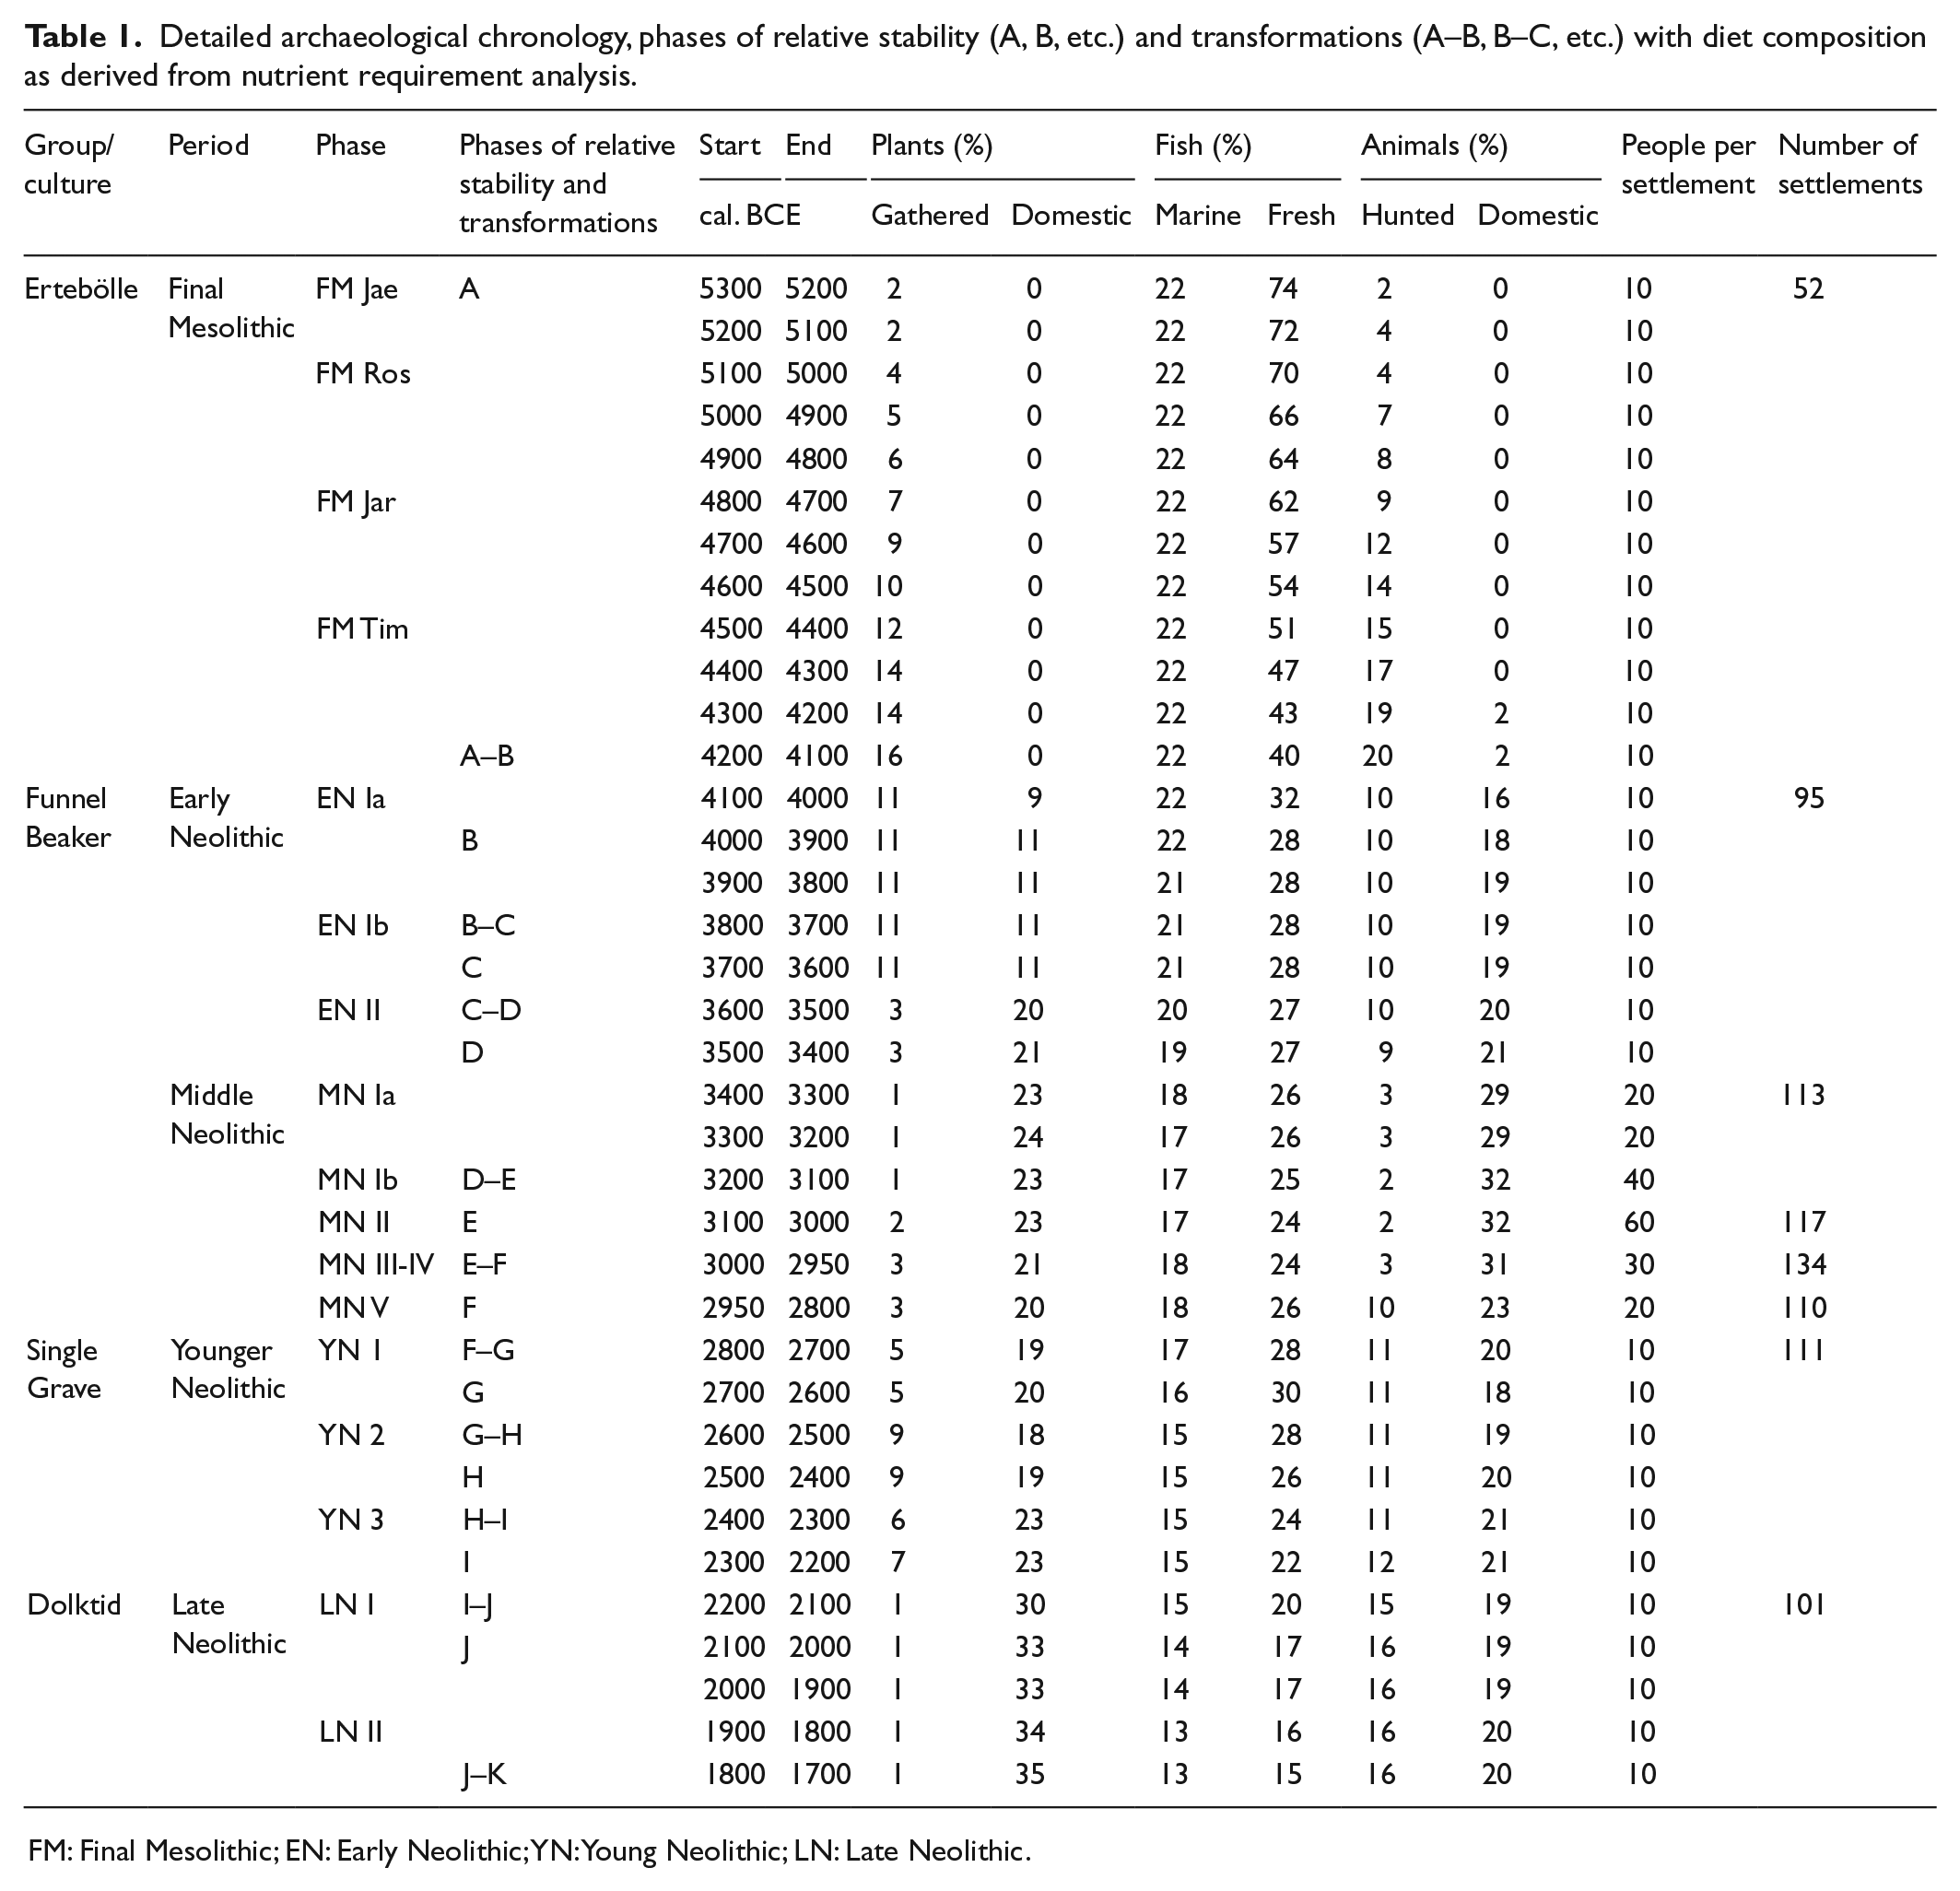
FM: Final Mesolithic; EN: Early Neolithic; YN: Young Neolithic; LN: Late Neolithic.
Methods and data
Extensive archaeological data are available for the Oldenburger Graben area, in particular for the Neolithic period (Figure 1; Table 1).
The available archaeological data derive from the manifold investigations and surveys that covered the whole area (Brozio, 2016; Brozio et al., in press; Glykou, 2011; Goldhammer et al., 2008; Hartz, 1999, 2002; Hoika, 1972, 1986, 1987; Karnatz, 1987; Mennenga, 2016; Meurers-Balke, 1983). The data basis relies on selected domestic sites and includes the results from recent excavations and radiometric dating programs that were analyzed by use of the aoristic method (Johnson, 2004; Mischka, 2004; Ratcliffe, 2000; Ratcliffe and McCullagh, 1998). As the size of the sites in the different periods and phases is known from target excavations of key sites, which enabled also the calculation of population figure, demographic values could be transferred to the test area Oldenburger Graben (Table 1).
To model the required extent of areas for the different land-use practices, nutrient requirements and dietary composition have to be outlined here, since the land-use model is based on the calculation of caloric requirements for the population and settlements. A second precondition for calculating the land-use model is the establishment of a fuzzy model of the potential vegetation and land-use, to enable the linking of certain land-use practices with specific growth conditions for woodlands and distance to settlements. Based on the two components, (a) nutrient requirements and dietary composition assumptions and (b) the fuzzy-vegetation-model, the quantitative reconstruction of land-use is calculated.
Nutrient requirements and proposed dietary composition
A non-trivial problem for the reconstruction of prehistoric subsistence economies is the reconstruction of the relative ratios of the nutritional components. The challenge is that it is not possible to assess to which degree the empirical data (quantities of animal bones, plant species, and their ratios quantities and nutritional components) mirrors the real distribution at a given time. Schibler et al. (1997) already drew attention to this problem during the reconstruction of ‘real’ herd sizes from the bone populations of the alpine lakeshore settlements (cf. Schibler, 2008). Corresponding calibration problems also arise with the evaluation of the vegetation composition based on pollen data, although algorithmic support such as LOVE and REVEALS might offer a solution (cf. Sugita, 2007a, 2007b performed in Diers, 2018; Trondman et al., 2015; and Marquer et al., 2014). From an archaeological point of view, it is also difficult to transform quantities of means of production (if discovered, for example, millstones or slaughtering equipment) into real numbers of existing herds or grain quantities.
In order to escape this dilemma, we employ the FRUITS software which converts stable isotope components into nutritional models. Based on the different stable isotope values of different food components as recorded in human bones, it allows the calculation of proportions of the consumed food components (Fernandes et al., 2014; Fernandes et al., 2012). One example for the application of FRUITS is the Southern Scandinavian Neolithic, where a modeling of nutritional values was carried out for the Falbygden area (Sjögren, 2017). FRUITS is flexible and is able to formulate different conditions, for example, to calculate the stable isotope values of the investigated human (target data) from the different stable isotope signals of, for example, sea fish, cereals, or mammals (i.e. the source values).
These source values rely on modern comparative values, for which intensive studies are available, or from observed differences in prehistoric, non-human bones (Bogaard et al., 2013; Fernandes et al., 2015; Fischer et al., 2007). Although investigations are available to improve the baseline of the analysis, it is still difficult to distinguish between wild and domestic animals or collected and cultivated plants. However, even if the information gained from these isotope analysis are not very specific and on a general level, they are a great help for the relative quantification of different nutrition components.
For the calculation of the food components, 22 radiocarbon datings with additional extra measurements of δ13C and δ15N are used (Supplemental Material A available online). The radiometric dates are distributed mainly between 4000 and 2000 BCE and originate from different ecological zones, so that a differentiation in the exploitation of marine and terrestrial food sources is to be expected. Even if the number of isotope samples with respect to the temporal duration of the investigated developments is small, the results can be considered as robust since no contradictions are visible within the investigated area.
The employed values for stable isotope components for the combined food groups terrestrial animals, freshwater fish, and marine fish are derived from the mean values provided in Terberger et al. (2018). The latter are the adjusted values based upon data published by Fernandes et al. (2015) and Fischer et al. (2007). Since no correction factors are available for the values of plants (as published in Bogaard et al., 2013), we transferred the correction values of the other food components.
A distinction between cultivated and collected plants, as well as between domestic and wild animals, is not possible. Accordingly, percentages of corresponding animal bone compositions and plant inventories, as published in Steffens (2007), Kirleis et al. (2012), and Brozio et al. (in press), are used.
The proportions of domestic versus gathered plants per period are calculated using seeds and fruits from different settlement sites in northern Germany (Kirleis et al., 2012, data from Tables 1 and 2; Brozio et al., in press; Effenberger, 2018; Supplemental Material C available online). The data set shows some limitations, because deposition processes and taphonomic issues vary from site to site depending on (a) different past human activities, (b) preservation conditions, as well as (c) the specific nature of the remains. Thus, the data are harmonized to make it comparable and representative (Supplemental Material C available online).
Fuzzy model of potential vegetation and land use
To identify areas that are most suitable for the different land-use activities, we use a fuzzy rule-based system. The model relates the potential for certain land-use practices to (a) their distance to settlements as well as (b) living conditions for certain forest types. The latter is chosen because vegetation is sensitive to the topographic situation as well as soil characteristics. Besides, thanks to available pollen archives, we are able to test whether the spatial model of forest distribution matches the prevailing conditions of the focused time periods.
Fuzzy logic, introduced by Zadeh (1965), helps to classify data where clear borders are hard to establish. The general idea is that rather than assigning values to a particular class they are assigned a value that measures their degree of belonging to a particular class. This membership degree often ranges between 0 (i.e. the value does not belong to the fuzzy class) and 1 (i.e. the value belongs completely to the fuzzy class; further general information about the methodology are given by, for example, Demicco, 2004 or Klir and Yuan, 1995). Fuzzy methodology, though already quite aged, currently has only a few applications in landscape archaeology; examples range from site location analysis (e.g. Jasiewicz and Hildebrandt-Radke, 2009; Popa and Knitter, 2015), viewshed methods (e.g. Loots et al., 1999) or chronology (e.g. Nakoinz, 2012). We employ the R package FuzzyLandscapes (Hamer and Knitter, 2018), inspired by Jasiewicz (2011), to analyze a raster-based fuzzy rule-based system.
The regional fuzzy classification of forest types is based on locational requirements of certain woodland communities (Figure 2). The input data for this model are soil and sediment information (provided by Landesamt für Landwirtschaft, Umwelt und ländliche Räume Schleswig-Holstein) as well as digital elevation model (DEM, provided by the Landesamt für Vermessung und Geoinformation Schleswig-Holstein; aggregated to 10 × 10 m) with derived geomorphometric parameters including the Saga Wetness Index (Böhner and Selige, 2006) and the slope. Sand, silt, clay, and humus contents are regionalized using a kriging algorithm (Pebesma, 2004) prior to fuzzification. A fuzzy rule-based system is defined using these data to calculate acidity classes (Supplemental Material D available online). Acidity classes and wetness information, derived from the Saga Wetness Index, are combined to a second fuzzy rule-based system, which produces forest type classes according to locational preferences as defined according to Ellenberg and Leuschner (2010), with an adjustment to the study area and the investigated time (Figure 2). The resulting fuzzy sets are spatial representations of the potential suitability for different vegetation units. The suitability for agricultural use is implemented using distance to settlements, as well as soil and wetness information (Supplemental Material D available online). In addition, a ‘light forest’ class is defined which represents a great suitability for mixed oak forest, as derived from the adapted ecogram, and a close distance to the settlements.
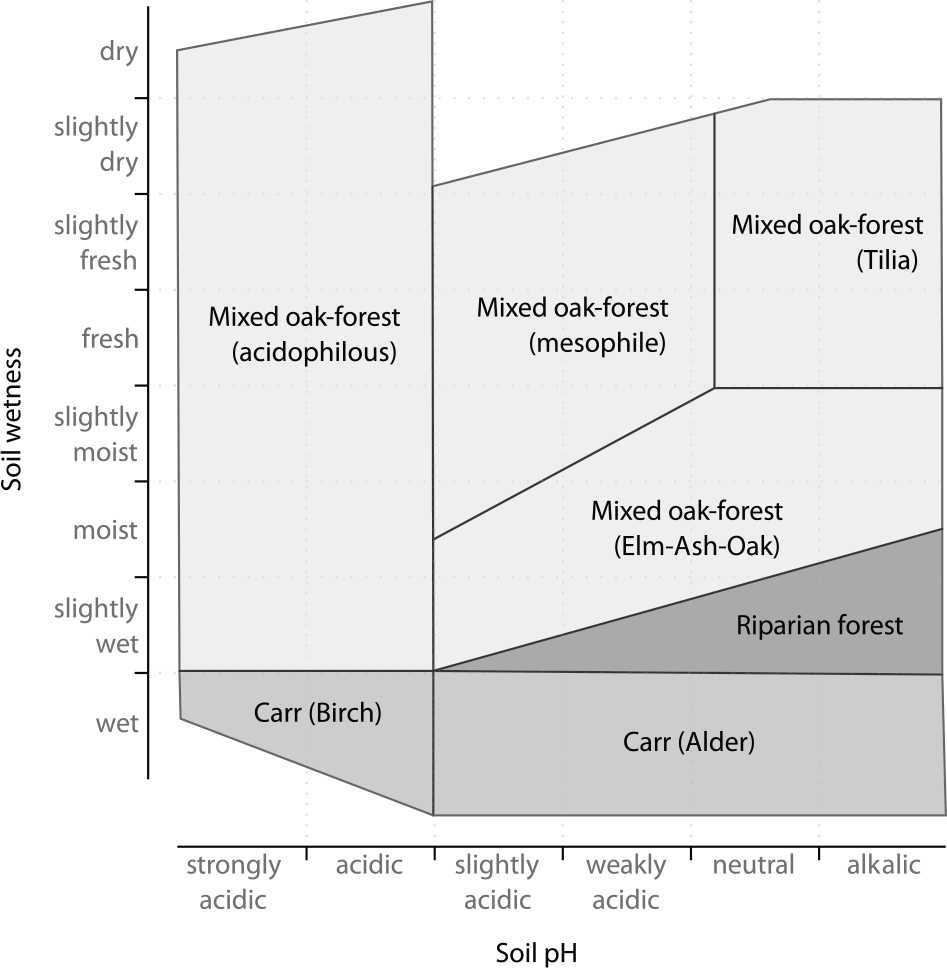
Ecogram for potential Mesolithic and Neolithic woodland, modified and simplified based on Ellenberg and Leuschner (2010).
Pollen data for evaluation of the fuzzy model
In order to assess the quality of the fuzzy vegetation model, we use pollen information. Pollen data from the Oldenburger Graben are available from several on- and off-site analyses (Averdieck, 2004; Kalis and Meurers-Balke, 1998; Meurers-Balke, 1983, 1997; Venus, 2004). As on-site data are of very local explanatory value, we focus this study on the regional pollen record from Klein Wessek by Venus (2004; Figure 3; Supplemental Material B available online). This study was carried out in the 1960s and no 14C-data are available. Thus, the time-depth model is based on regional pollen stratigraphic events, with corresponding temporal uncertainties (cf. Dörfler et al., 2012; Feeser et al., 2012). Since pollen data give a distorted picture of the real vegetation and its quantitative distribution because of variable pollen productivity and transport between species, there is the need for quantification of vegetation if we want to compare it with results of the fuzzy model. Different approaches are available to calibrate pollen data (Mrotzek et al., 2017; Sugita, 1998; Sugita et al., 1999; Theuerkauf and Couwenberg, 2017). Here, we applied the pollen-calibration algorithm of REVEALS (Sugita, 1998) as implemented in the DISQOVER v.09 package (Theuerkauf et al., 2016) with the pollen productivity estimates from Mecklenburg-Vorpommern (PPE_MV2105). The curves show the summed quantified proportion of mesophile arboreal taxa (Quercus, Ulmus, Tilia, Fraxinus, Fagus, and Carpinus) and the summed quantified proportion of light-demanding arboreal taxa (Corylus, Betula, Rosaceae). As a third curve, we included the landscape openness indicator curve that is suggested as independent palynological human impact proxy (Feeser et al., this issue). Here, the predicted spectra score values for the data of Klein Wessek using the result of a principal component analyses (PCA) are used to reconstruct the human impact on the vegetation for northern Germany during the Neolithic and Bronze Age (cf. Dörfler et al., 2012; Feeser and Dörfler, 2015; Feeser et al., this issue, 2012).
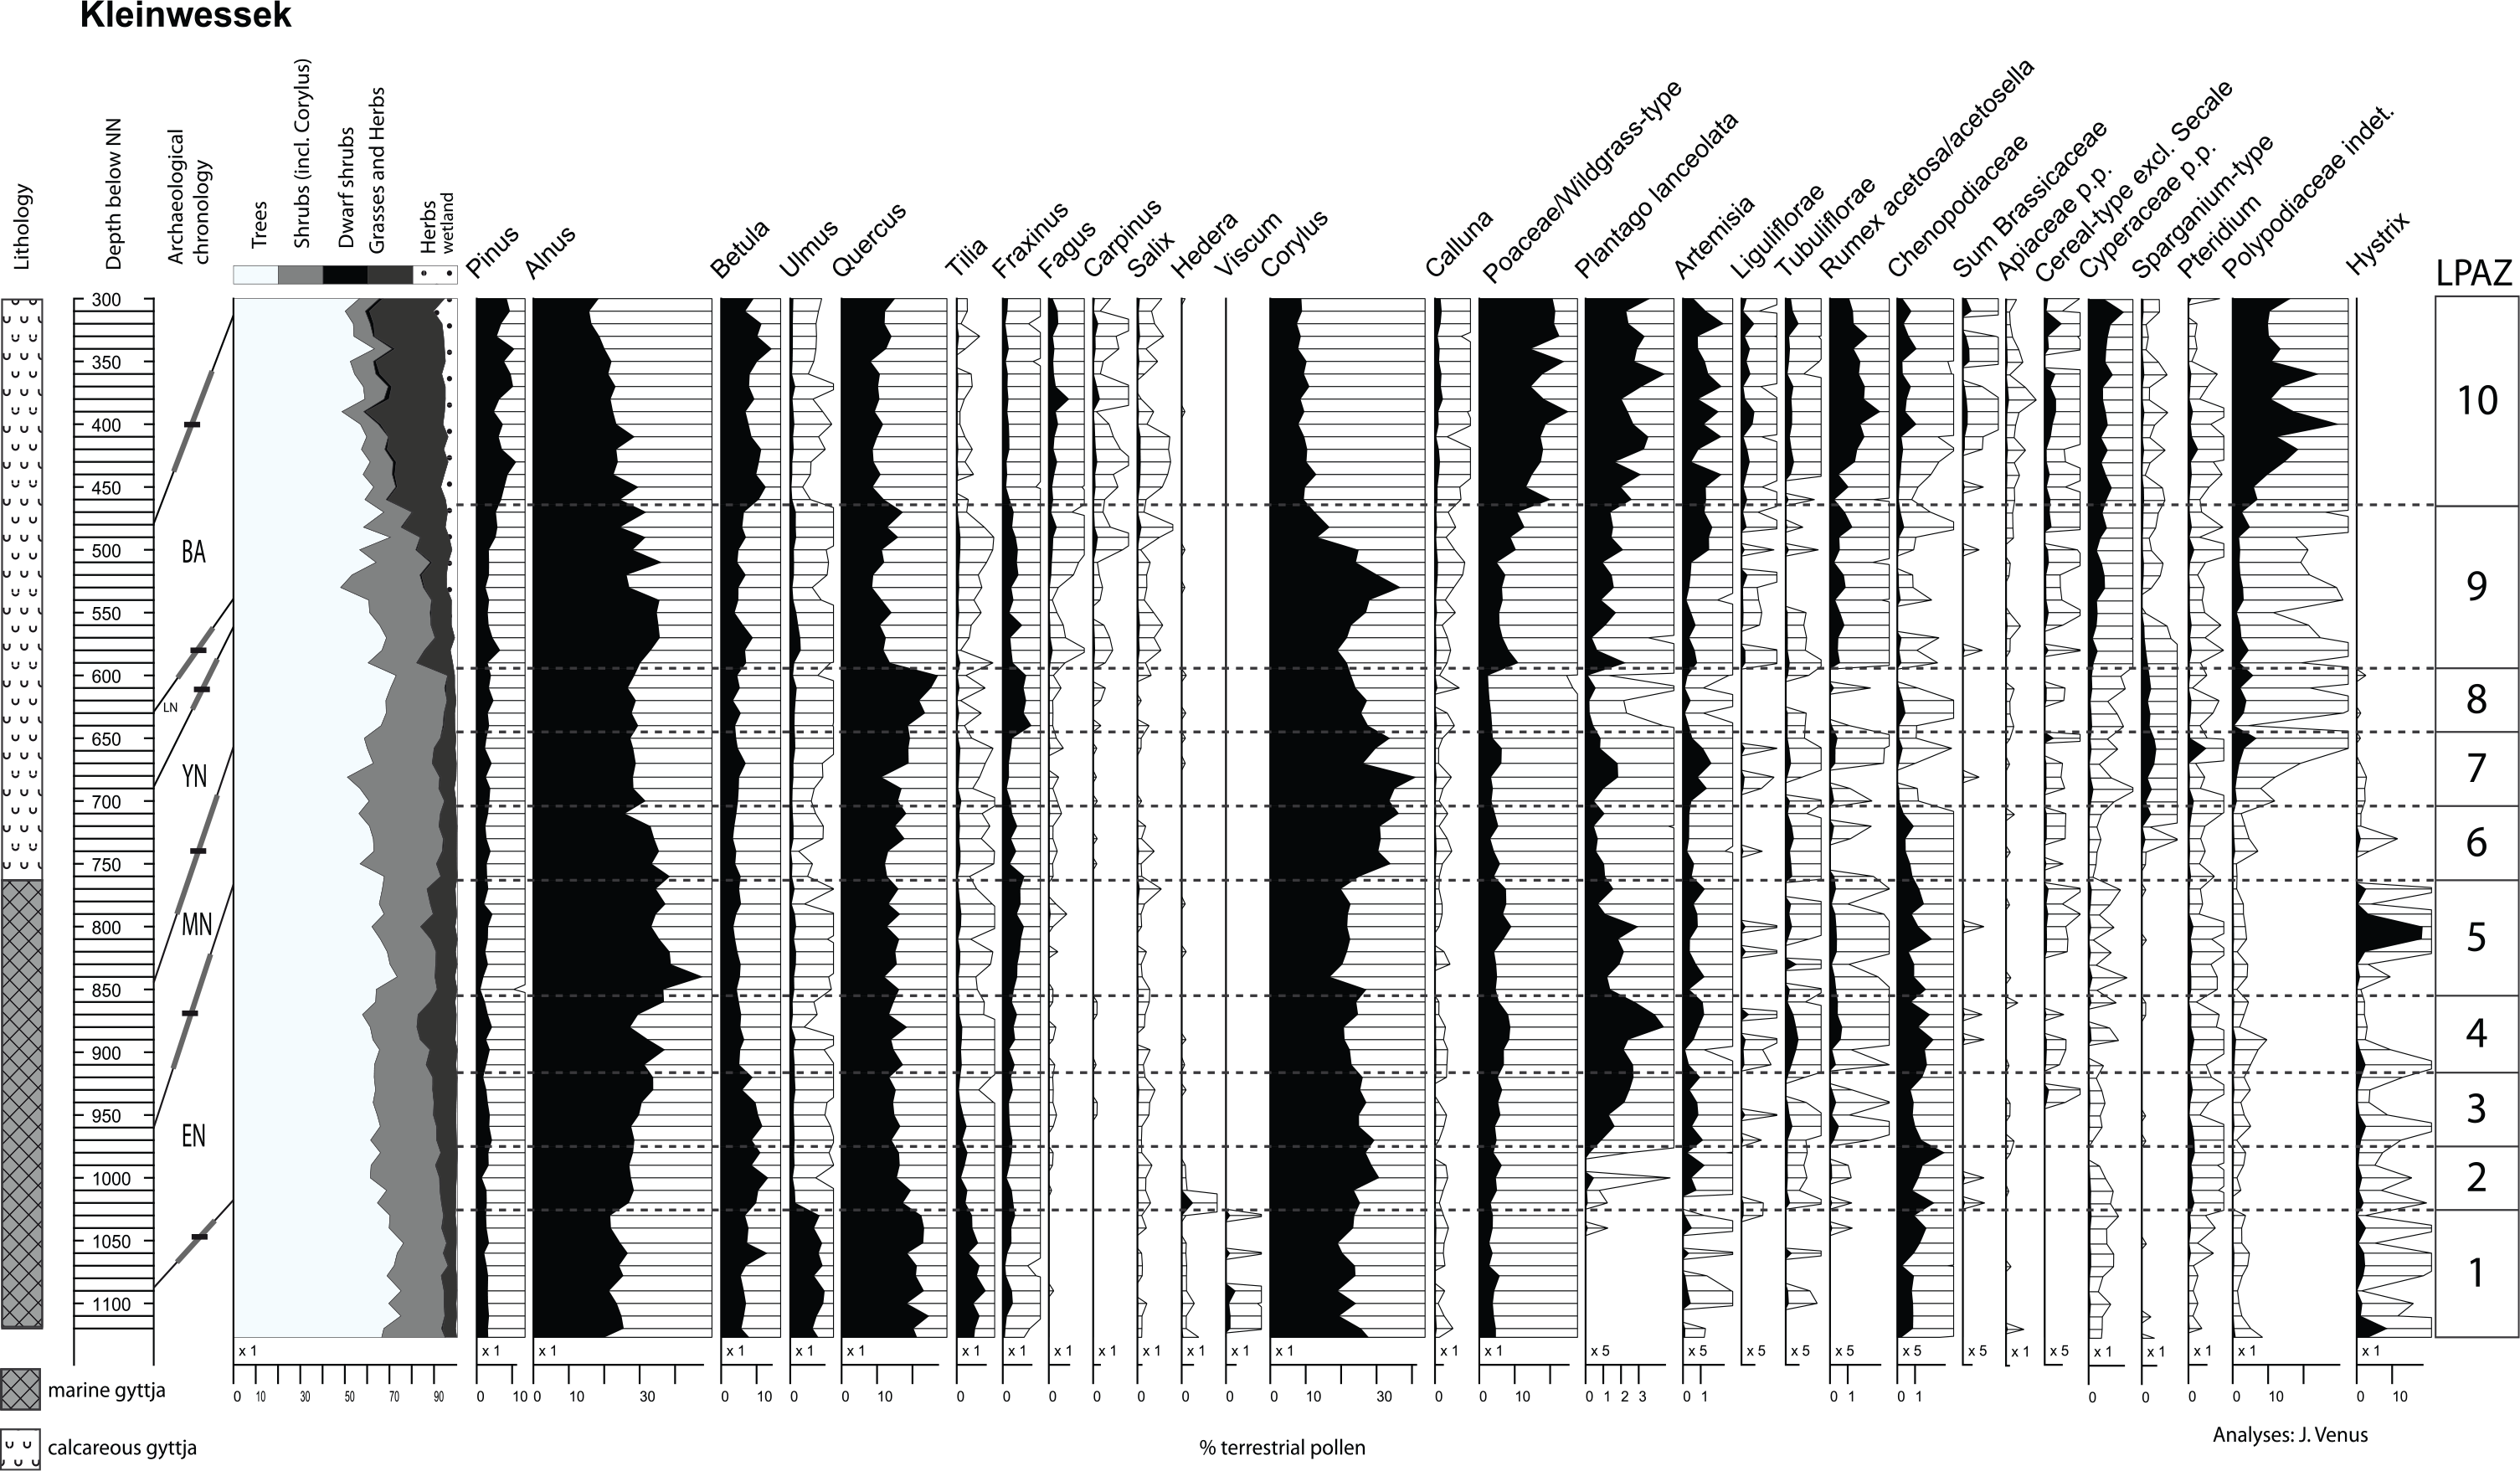
Pollen diagram from Klein Wessek. Relative pollen percentages based on a total terrestrial pollen sum. Chronological estimates indicated depth ranges for the 2 sigma range (thin line), 1 sigma range (thick line), and modeled median age for the beginning and end of the Early Neolithic (EN, 4100–3300 BCE), Middle Neolithic (MN, 3300–2800 BCE), Younger Neolithic (YN, 2800–2200 BCE), Late Neolithic (LN, 2200–1800 BCE), and Bronze Age (BA, 1800–530 BCE).
Quantitative reconstruction of past land use
Because of the fragmentary material remains and complex decision and value systems of past societies, any attempts to quantify past land-use patterns have to be seen as heuristics of past realities, rather than precise reconstructions (cf. Oreskes et al., 1994). We reconstruct past land-use based on the approach published by Hughes et al. (2018) via the R package LandUseQuantifieR (Knitter et al., 2018). Based on an assumption about the general caloric requirement of an individual with an active lifestyle, an assumed household size of five people, and information on population size, the caloric requirements of the settlements are calculated. These values are combined with the data on diet characteristics (see methods ‘Nutrient requirements and proposed dietary composition’) and information on the energy density (kcal/ha) of plants and animals in order to assess the minimum area that is required to fulfill the caloric needs of the population (see Supplemental Material E available online).
To reconstruct the productivity of prehistoric crop growing, we refer to data from a growth experiment on permanent plots at Hambacher Forst with the Neolithic cereals emmer, einkorn, and barley, grown as summer crops in 1979 (Lüning and Meurers-Balke, 1980). Further long-term experiments reveal barley yields of 1000 kg/ha in southern Lower Saxony and 730 kg/ha for eastern Prussia.
The calculations of dietary needs and population size rely on the main components of those crops that were present in the focused time, which are emmer and barley, with an additional minor component provided by the oil plants linseed and poppy. For the gathered plants, crab apple and hazel are taken into consideration. Wild apple was an important staple fruit in the Neolithic (Antolín et al., 2016; Brozio et al., 2014; Cornille et al., 2019; Kirleis, 2018). For reasons of preservation, storage of crab apples most possibly was arranged with dried fruits. Thus, we consider here the caloric values for dried apples, which show a five-fold enrichment in caloric content if compared to fresh fruits. The caloric data are compiled mainly from Souci et al. (2016), where information on nutrient and energy densities of species in the focused time were absent, modern data are used (see Knitter et al., 2018 for nutrient tables and corresponding references as well as Supplemental Material E available online).
Land-use activities are considered to take place in an area that is up to one walking hour distant from the individual sites (Figure 1, right). Distance is based on real-surface distance as calculated using the r.walk algorithm in GRASS GIS. The value of 1 h is variable, but is selected here since it has some empirical and diachronic grounding (e.g. Marchetti, 1994). The individual 1-h settlement territories are considered as zone of activity for the subsequent mapping of land-use types. This is done by selecting all areas that are part of any 1-h territory around the individual settlements. Accordingly, land-use maps are not settlement but area-specific.
Results
Nutrient requirements and proposed dietary composition
The calculations of the nutrition values for the individual periods and phases show (Table 1; Supplemental F available online) that aquatic resources are continuously used with the greatest importance during Mesolithic times. The proportions of collected plants and wild animals show a similar trend (Supplemental Material C available online). The increasing importance of animal resources in the third millennium BCE corresponds to the interpretations from supra-regional studies (cf. Heyd, 2017).
The results from modeling the nutrient requirements are based on the diversity of food sources utilized (Table 1; Supplemental E available online). The calculations for resources including fish, game, and plants based on the nutrient requirement and dietary components data (Figure 5c) suggest various strategies of land use. During the Late Mesolithic, the values show a predominant use of game and collected plants, whereas marine resources play a subordinate role. During the Neolithization phase (B–C), the proportions decrease until a proportionally greater use of marine resources can be observed around 3100 BCE (E). Thus, it becomes clear that not only in the Mesolithic or at the beginning of the Neolithic the exploitation of wild plants, hunting, and fishing was important, but it contributed to food supply much further out into the Middle Neolithic period and beyond, and it was especially incorporated at the time of the enlarged Middle Neolithic Funnel Beaker settlements; this is indirectly confirmed by the frequent occurrence of (radiocarbon-dated) fish weirs, for example, in the Danish record (cp. Oleslyst; Pedersen, 1997). With the end of the Funnel Beaker groups (E–F) and the beginning of the Single Grave groups (F–G), the contribution by wild animals increases significantly again. In contrast, marine resources now occupy less proportions, but wild plants have an increasing importance in the food supply in the centuries of the Late Younger and Late Neolithic (G–H and J).
Fuzzy mapping of potential vegetation
The results of the fuzzy-based vegetation reconstruction show a domination of the area by mixed, oak dominated forest (dense and light forest; Figures 4 and 5a). Throughout the transformation phases, the entire area along the Oldenburger Graben is available for human appropriation as mirrored by the varying extent of light forest and agricultural land. Potential agricultural land is most extensive in the eastern part of the depression (Figure 4). Patches of very moist conditions, as represented by mires or birch dominated forests, occur frequently, and only prohibit environmental utilization in the southeastern part of the research area (Figure 4).
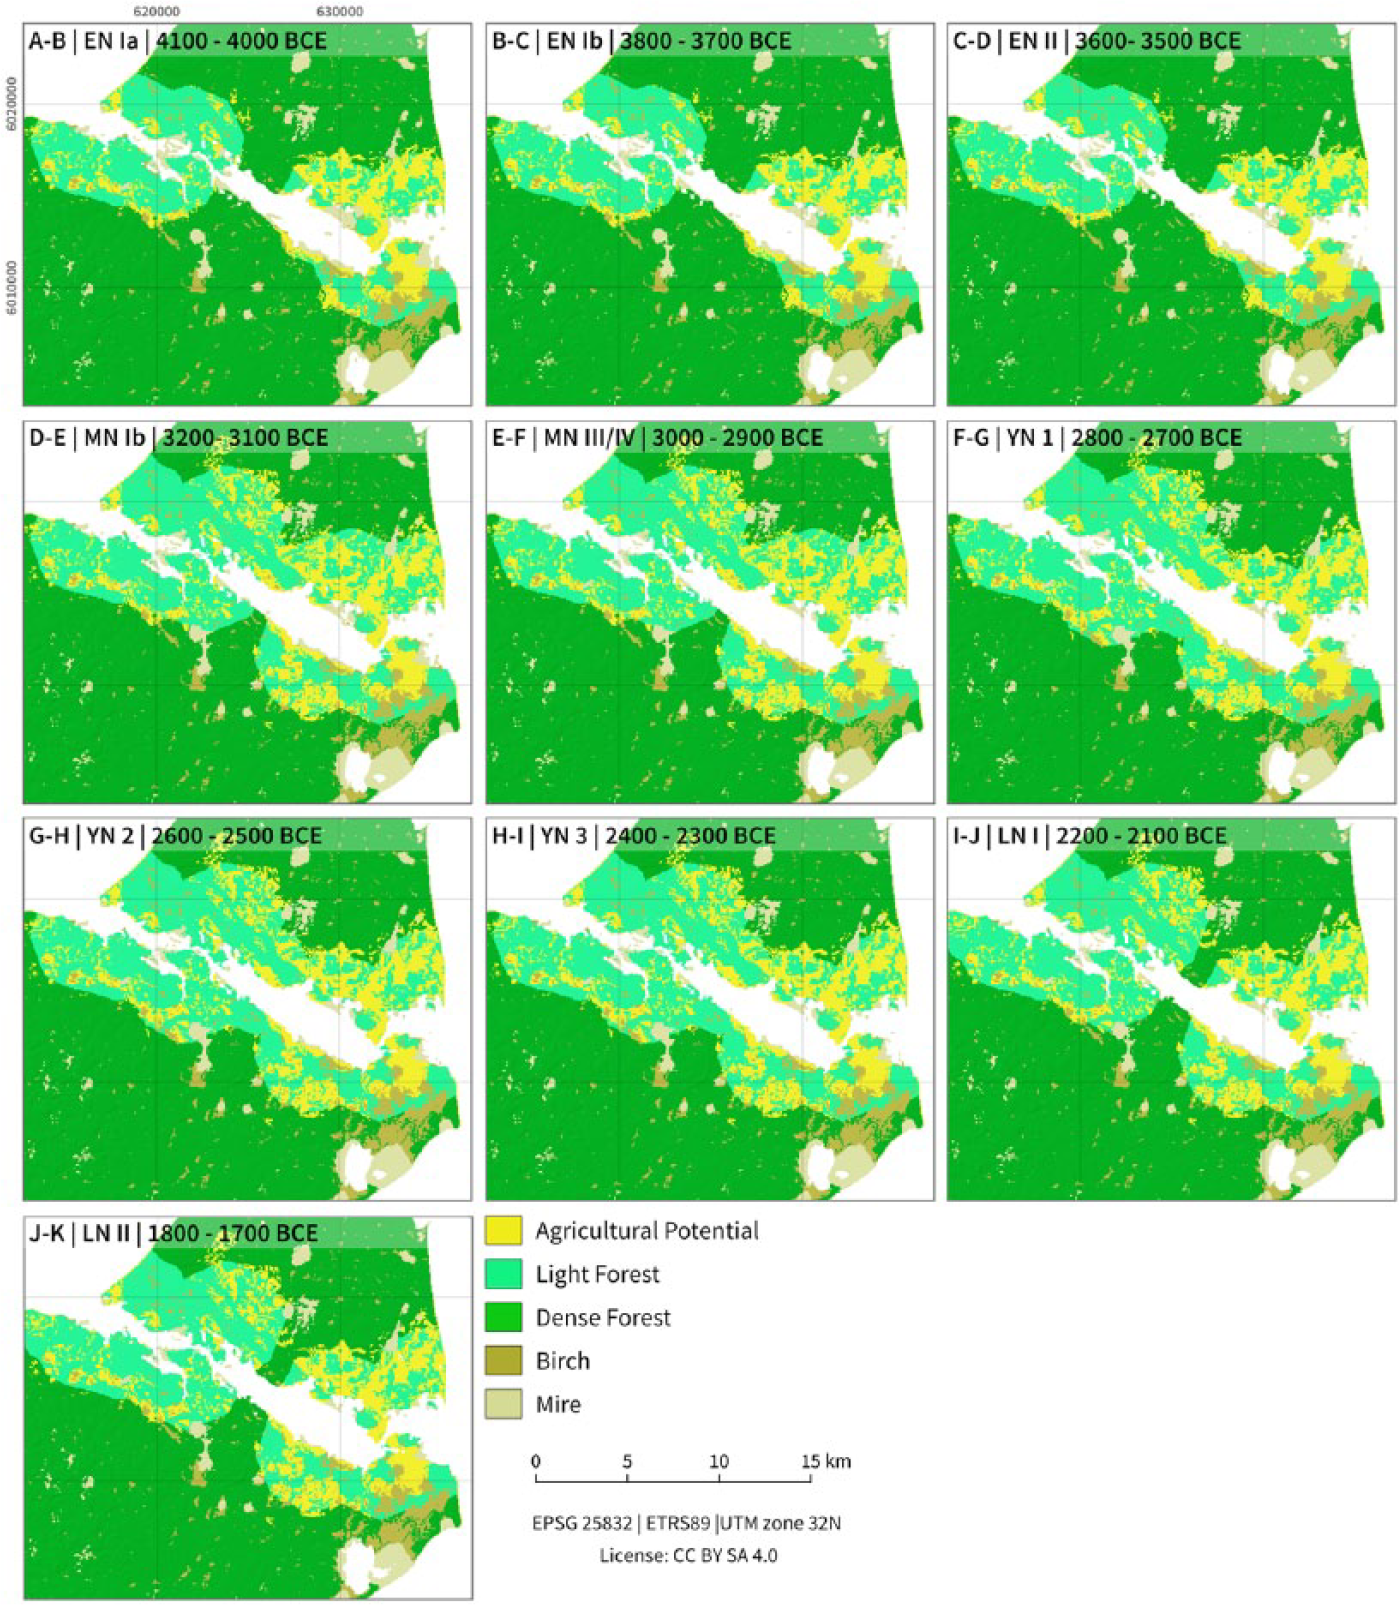
Results of the fuzzy model of potential vegetation. Shown are phases of cultural change and accompanied transformations (coastline is reconstructed as explained in Supplemental Material G available online; utilized number of settlements as outlined in Table 1).
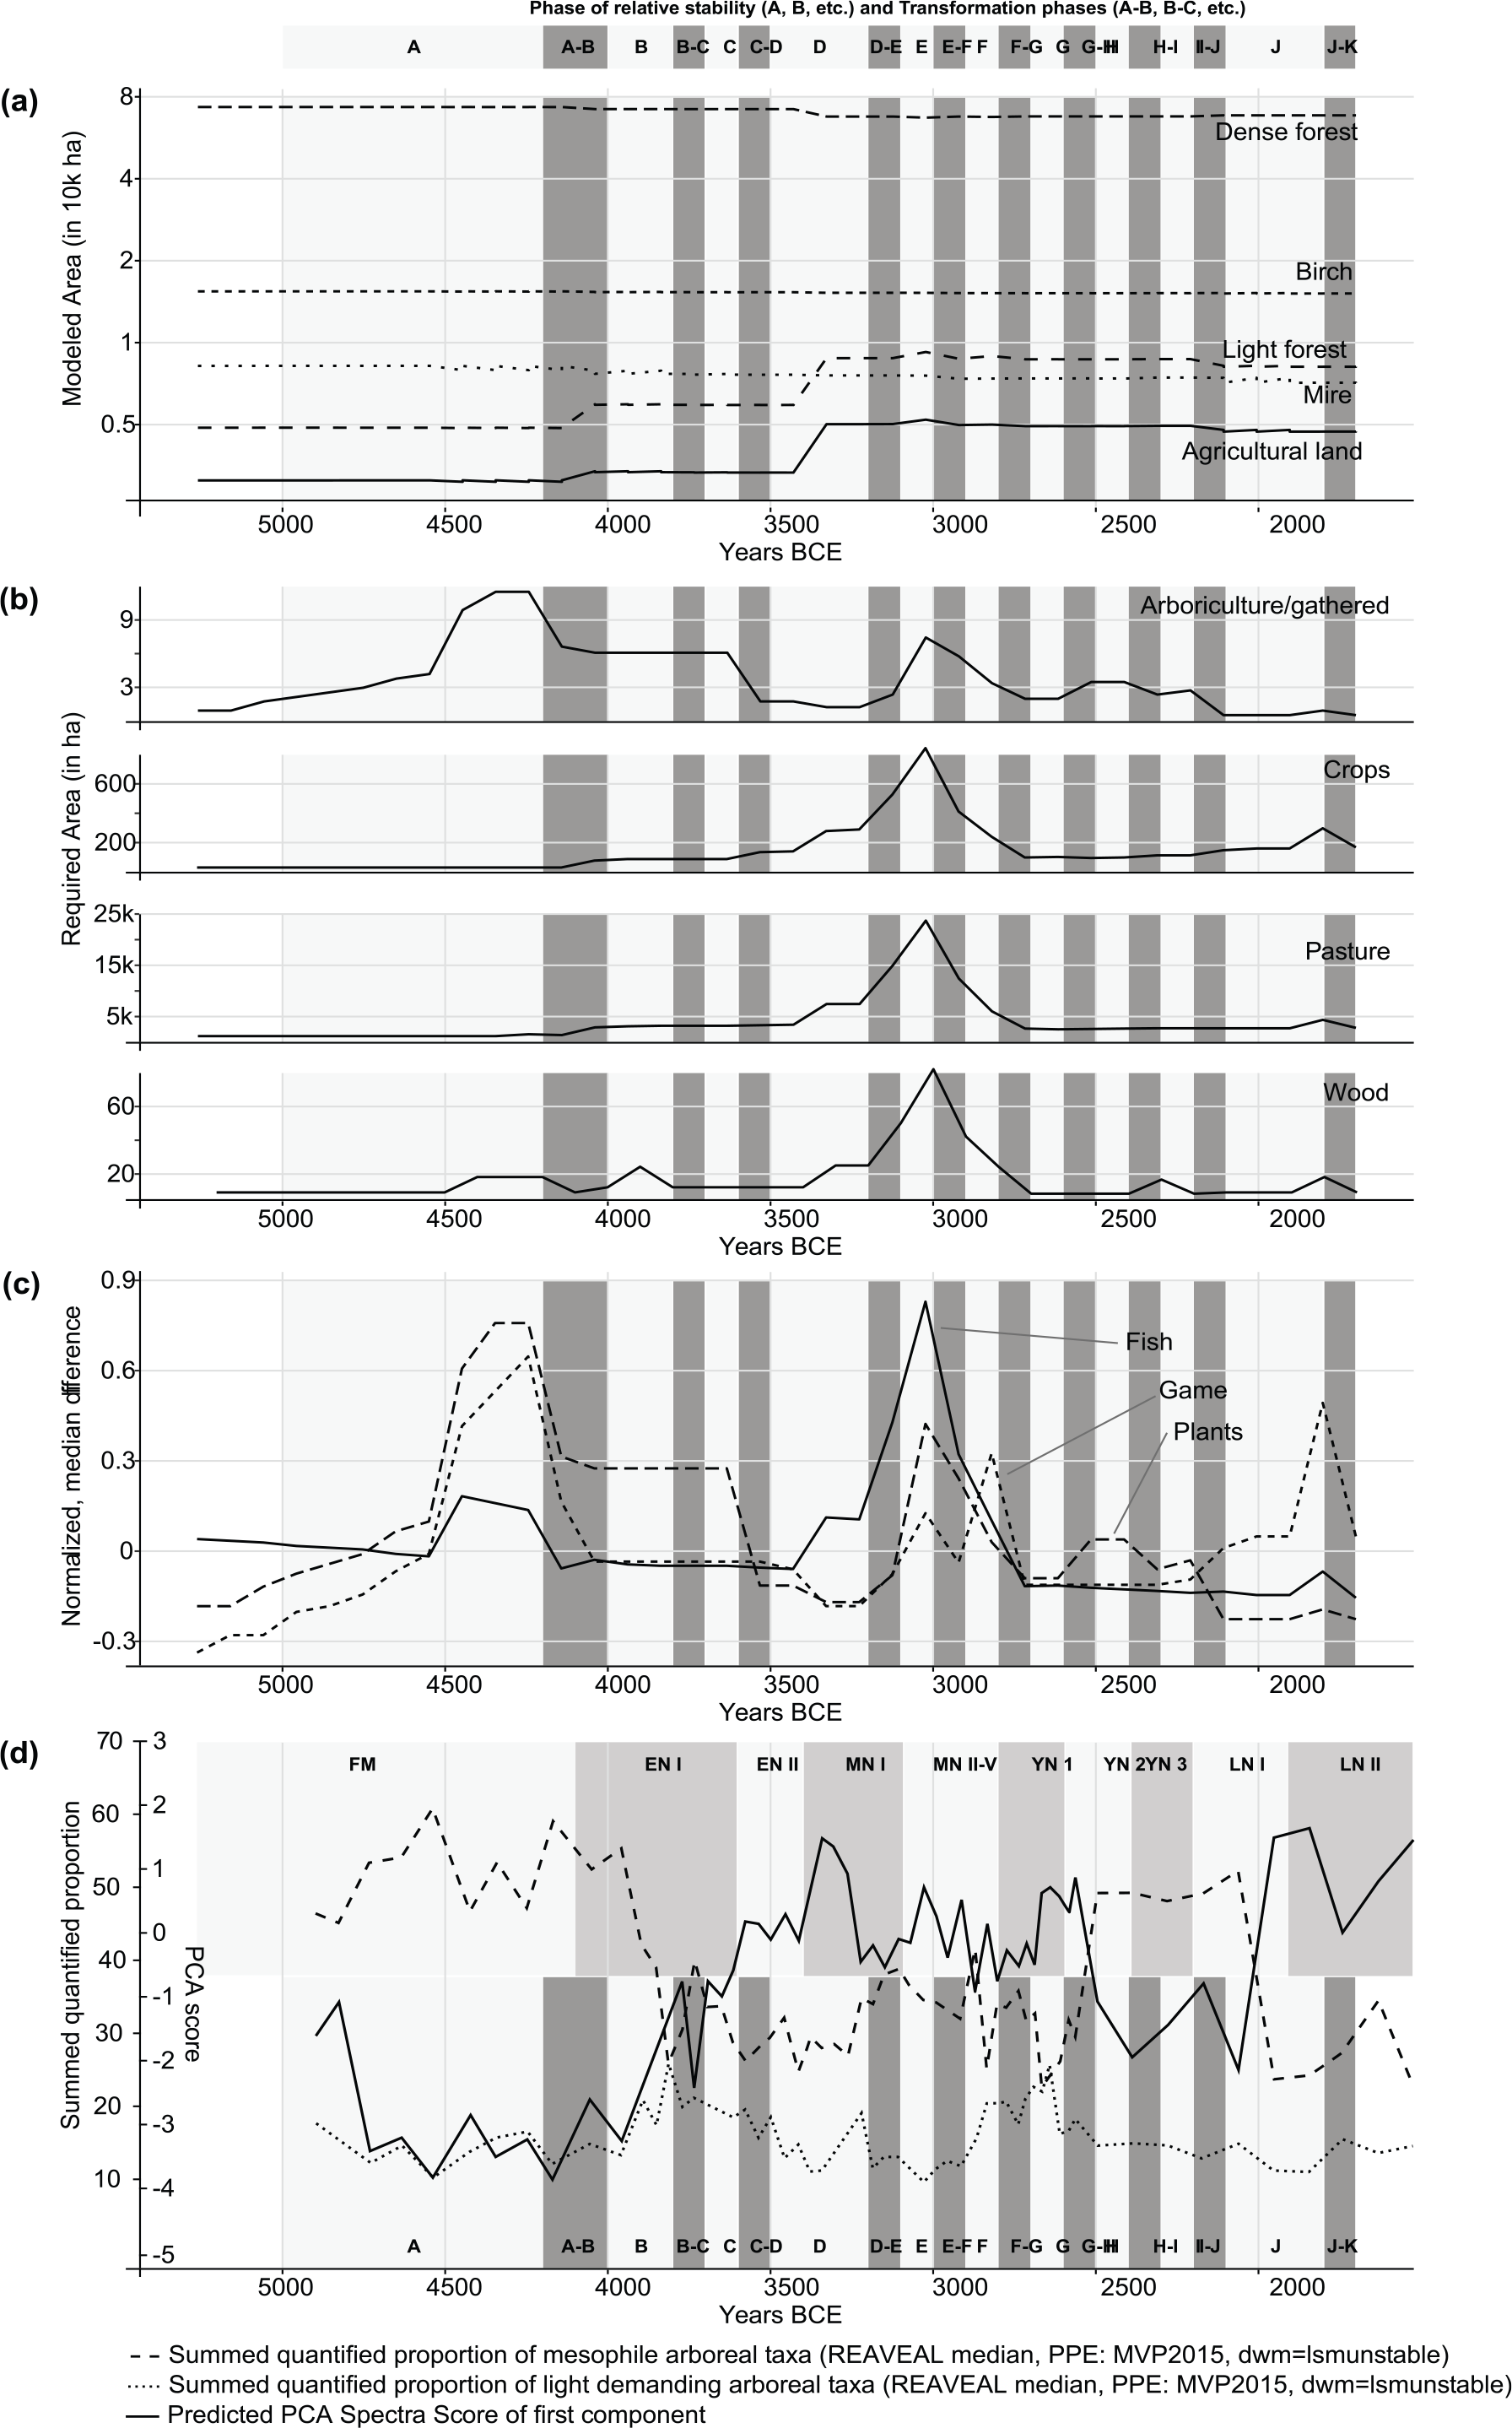
(a) Results of fuzzy vegetation reconstruction in comparison to pollen record showing change in modeled areas through time; (b) results of the quantitative reconstruction of past land-use throughout the Neolithic showing the area requirements for land-use practices over time; (c) results of the quantitative reconstruction of amounts of gathered plants and hunted animals over time; (d) human impact on the vegetation quantified by PCA using the pollen record of the Klein Wessek site (based upon data of Venus, 2004).
Pollen information
The REVEALS data give an estimate of the area covered with dense forest and with light forest from 5000 to 1000 BCE. Changes in dense woodland (Figure 5d, dashed curve) during the Early Neolithic I (A–B, B–C) are obvious: Values of around 55% decrease to about 30% on the wider surrounding of the Klein Wessek coring site. At the same time, open woodland/light forest (Figure 5d, dotted curve) increases from about 15% to more than 20%. During the Early Neolithic II (C–D, D–E), these values slowly shrink indicating an even more open landscape with little forest cover during the first half of the Middle Neolithic I (D–E). This is also represented in the fuzzy model that shows a steep increase in the ‘light forest’ area (Figure 5a). After 3300 BCE, a strong regeneration of dense woodland indicates decreasing human pressure on the woodland and woodland regeneration that might be explained by a change in the settlement organization (from disperse to agglomerated). This is supported by the decreasing values of the PCA results (Figure 5d, black curve) which also reflect decreasing human influence. From ca. 3200 BCE onward, human impact on the vegetation increases again, which can be interpreted as a phase of economic growth. A similar increase at around the same time is well recorded in pollen diagrams from the wider region (Feeser et al., 2012). In most pollen profiles, however, landscape openness decreases distinctly after ca. 3100 BCE to reach a minimum at around 3000 BCE. This lull is also evident in other paleoenvironmental records (Feeser et al., this issue). At Klein Wessek, however, no corresponding lull is obvious. This points at the regional divergent development in the Oldenburger Graben. The undulating curves during the Middle Neolithic II-V (E–F) show short variances with an average woodland cover of 35% and an increasing amount of light woodland during the Middle Neolithic Y and Younger Neolithic I (F–G, G–H, H–I, I–J). A strong transformation is recorded in the pollen record after 2600 BCE when dense woodland recovers and the human pressure decreases rapidly. This effect lasts for nearly 400 years until in the Late Neolithic I (J, J–K) an inverse trend shows shrinking woodland cover and increasing human pressure. Similar evidence from northern Germany indicates that this strong increase in human impact on the vegetation is not restricted to the Oldenburger Graben, but is of supra-regional importance (Feeser et al., this issue).
Quantitative reconstruction of past land-use per transformation phase
The calculation of areal requirements for the land-use activities ‘crops’, ‘pasture’, ‘wood’, and ‘arboriculture/gathered’ shows that the research area is not intensively used during the focused periods (Figures 5b and 6). With the exception of the Middle Neolithic periods and their great population number, only a fraction of the available area is used (cf. Figure 5b and d).
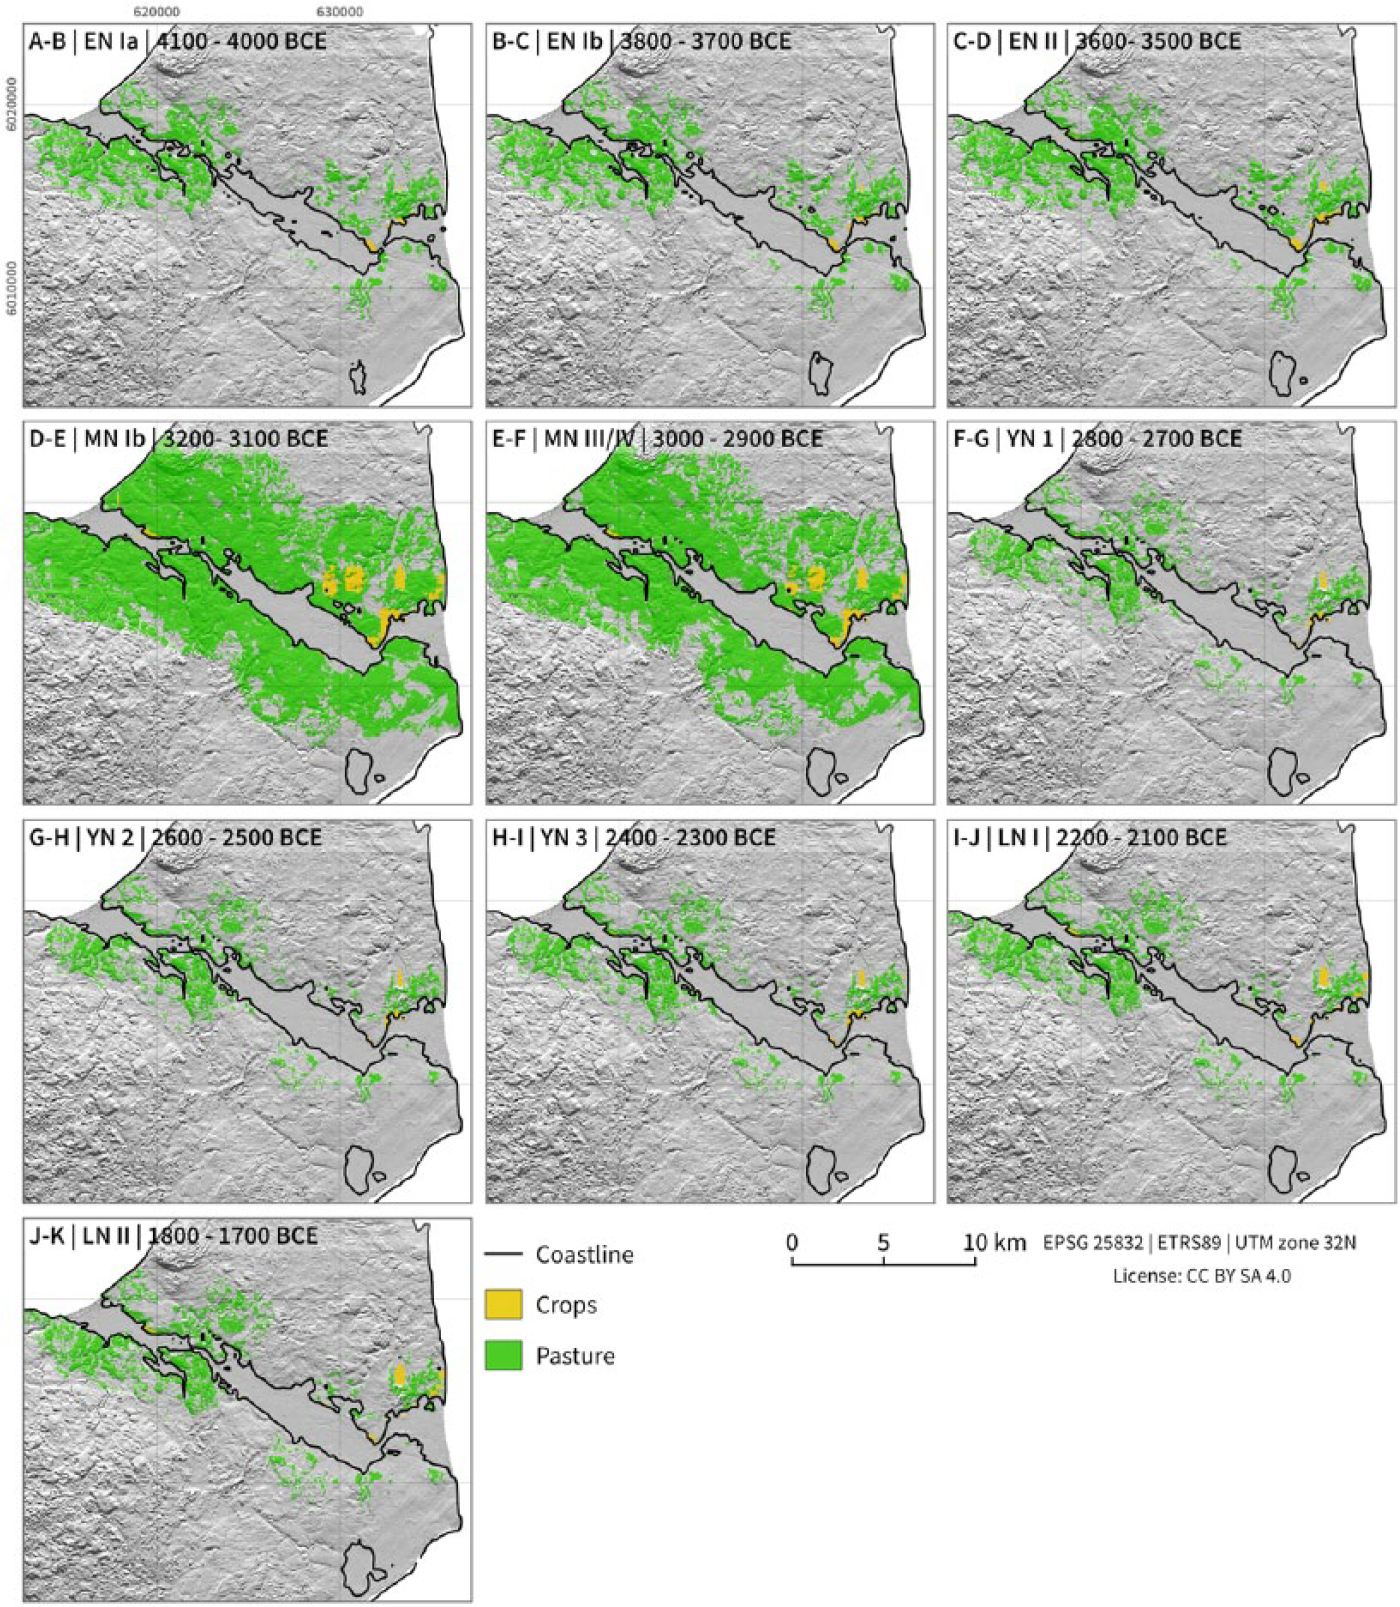
Modeled areas of land-use practices. Because of the small areal demand of wood and arboriculture, these are not mapped. Shown are periods of cultural change and accompanied transformations (coastline is reconstructed as explained in Supplemental Material G available online; utilized number of settlements as outlined in Table 1).
In general, the modeled land-use in the research area is allocated in two main areas: (a) primarily the former outer firth of the eastern Oldenburg Graben, an area well suited for the cultivation of field crops, and (b) the western Oldenburg Graben. The use of the area is reflected, above all, in the extensive pasture farming (Figure 6).
The last phase of the Mesolithic (A) is characterized by the subsistence form of a gathering–hunting–fishing economy. With the transformation phase of the Neolithization from 4100 BCE (A–B) onward, this aspect of resource use slowly begins to lose importance, whereas the areas necessary for crop cultivation, pastures, and managed woodland/arboriculture begin to increase in phase B (Figure 5b). At the end of the period (D–E) between 3600 and 3100 BCE, the area required for the growing of cultivars, pastures and managed woodland/arboriculture reaches its peak, and the area required to cover the needs of gathering also increases expressively again. Around 3100 BCE, a decline of the required areas in comparison to the Early Neolithic level can be observed until the beginning of the Single Grave culture groups (F–G). Although in the period of the Single Grave groups the areas of the gathering and/or managed woodland/arboriculture increased as well, a slight increase of the necessary areas for the cultivation of crops, pastures and managed woodland can be observed with the beginning of the Dagger Groups (I–J).
Discussion
The results of the land-use quantification help to gain insights into the dynamics of resource requirements and areal demands. The land-use modeled here is based on archaeological data estimating the density and size of settlements, and economic data representing the ratio of the individual food components. The model obtained is compared with vegetation data, which basically confirm the modeled development.
With respect to the simplifying assumptions and limited input data, that is, a digital elevation model and soil data, the fuzzy model of vegetation characteristics performed well. If compared with the pollen data, these correspond for the Early Neolithic I phases. For the Early Neolithic II and Middle Neolithic I, the palynological data according to Figure 5d suggests an increase in woodland opening, while in the fuzzy model, the land-use components remain more or less on the former Early Neolithic I level. For the Middle Neolithic Ia, both data sets fit perfectly, showing an increase of landscape openness. In the model, the opening of the landscape increased until ca. 3000 BCE. The decrease in land openness afterward is also visible in the increase of light woodland for the Middle Neolithic V within the pollen record. However, the reverse picture with increased woodland density in Younger Neolithic 2 as well as for the Late Neolithic I as suggested by the pollen data account for a re-opening of the woodlands that is hardly visible in the fuzzy model. 3
Since the fuzzy model is built upon information on settling intensity from the archaeological record (Figure 1), it fits better to the archaeological information and derived dynamics in the nutrient requirement calculations. This might offer interesting opportunities to integrate palynological and archaeological data, in order to gain a better understanding of the relevance of different archives or data sources for the assessment of the impact of human activity on the environment.
Since detailed information on individual settlements is only available for some places, the results are not site-specific but aggregated. Accordingly, the spatial distribution of different land-use areas for the Oldenburger Graben depicted in Figures 5b and 6 reflects only a theoretical scenario and should only be used comparatively to investigate diachronic dynamics. If we compare the land-use mapping based on the fuzzy results with the material culture, the Neolithic dynamics are well illustrated. Further empirical data, especially on the economic characteristics of the individual sites will help to produce more realistic, spatially explicit results. The phase (B) of Neolithization from 4100 BCE, whose phenomena were already apparent in the Mesolithic, from 5100 BCE onward through imports (Hartz et al., 2011), and the occurrence of domesticated pigs (Krause-Kyora, 2011) in the study area Oldenburger Graben, is deeply connected with the great environmental potential of the firth region. Here, various habitats are allocated side by side in a relatively small region. Thus, multiple resources are available from marine, lacustrine, and terrestrial environments. The occupation of the inland allowed small-scale intensive crop growing in the direct vicinity of the farmstead. Most probably, in particular, those marshy areas that underwent seasonal flooding were increasingly used for cattle pasture (Rickert, 2007). Marine resources, game, and wild plant food were used to a variable extent and declined during the course of the Early Neolithic I (Figure 5c). The increasing construction of megalithic graves in the distribution area of the Funnel Beaker groups, which can be observed supra-regionally, and the simultaneous opening of the landscape from 3600 BCE (D–E) onward, indicates a population growth (Hinz et al., 2012), which requires a larger area for the cultivation of crops, pastures, and wood extraction. In addition, marine resources are increasingly used again. This is a period in which, analogously, increased domestic site activity and the development of villages such as Oldenburg-Dannau LA 77 (Brozio, 2016) lead to a greater diversity of the food resources utilized. At the beginning of the third millennium (3100 BCE in the pollen record), there is an overall decline in the areas required. This is a period in which strong socio-cultural changes can be observed in the form of Store-Valby groups (Davidsen, 1978) and the emergence of Single Grave groups (Hübner, 2005). These phenomena are associated with a stronger differentiation into smaller group sizes and smaller domestic sites in the form of hamlets (Müller, 2012; Müller, 2013). The required areas are reduced to sizes reached between 4100 and 3600 BCE, during the phase of Neolithization and inland development (B–C). In contrast, from 2200 BCE, with the introduction of retouched flint objects (I–J), in particular, the flint sickles (Jensen, 1994; Kühn, 1979), an increase in the area for arable crops can be observed. This is also supported by pollen evidence and supra-regional participation in networks for the distribution of metal (Schultrich, 2014; Vandkilde et al., 2017) can be observed.
Since the model is sensitive to the input data as well as threshold selection, we refer to them only in terms of a relative comparison between the different phases and methods. From the empirical data, for example, there is a strong bias in the archaeobotanical data because oil plants and apples are underrepresented. This is because of different taphonomy and use in different contexts, if compared with cereals that are the main components in charred assemblages. Thus, the caloric calculations can only partly be supported by our empirical data, but follow the assumption that the cereal component delivers the main caloric input (emmer, barley, and some einkorn) and is added to a minor content from the Early Neolithic I onward by oil plants. For the estimation of the content of gathered plants, a wide variety of edible species is considered which exceeds the common gathered plants such as apple or hazel. Among the wild gathered plants, there are those with starch rich seeds such as the Polygonaceae, Chenopodiaceae, and some wild Poaceae. Other species deliver micro-nutrients or vitamin C, like the berries in the genus Rubus (cf. Kirleis et al., 2012). These aspects could not yet be integrated into the model. With respect to land-use, the gathering of wild plants in the Neolithic took place at small-scale openings in the dense woodlands and at the woodland edge, where conditions for the growth of light-demanding species are suitable. While intentional woodland management of hazel was suggested already for Mesolithic times, for crab apple, careful management might be considered from the Neolithic time period onward, which may have required/consumed minor space in the vicinity of the farmstead and village (Kirleis, 2018; Klooß, 2015: 331). This shows that additional on-site studies with strong empirical background and sound material, and best from different archives providing multiple assemblages, are necessary for a further qualification of the resulting values from the land-use model. Further empirical data, especially on the economic characteristics of more individual sites will help to produce more realistic, spatially explicit results.
The population sizes extrapolated on the basis of the sizes of the excavated settlement sites provide particular uncertainties in the models presented. Within the Middle Funnel Beaker culture, the first settlements exhibited especially greater numbers of inhabitants, in contrast to the otherwise excavated individual farms which are known, and this has an effect on the overall calculation. Even if a certain contradiction seems to exist (the ‘expansion’ is not shown in the pollen analysis, but this can also be attributed to the reduction of the visible impacts because of the local population agglomerations), the peak is also confirmed by the 14C curve sum calibration (Feeser et al., this issue; cf. Dörfler et al., 2012; Feeser et al., 2012, 2015). Discrepancies between pollen-analytically and archaeologically achieved data show the key issues where more data have to be collected, or different interpretations of data have to be developed. As the pollen record as an off-site record reflects the wider region, this may also play a role, especially when the utilized (available) sample of archaeological material is considered.
Conclusion
The results from the modeled quantitative reconstruction of land-use show that the Late Mesolithic and Neolithic transformation processes in general have only an insignificant effect on the size of areas that are effected by the land-use patterns in the research area. Nevertheless, changing patterns of land-use occur because of different subsistence technologies and social patterns to organize subsistence as both an economic and a social practice with impact on the environmental conditions.
In the Early Neolithic, the land area required for the gathering of wild plants declines. The by far largest areas in the Neolithic were required for domestic animal breeding, which in the model are named ‘pastures’ and which include areas for browsing in light forest and in the seasonally flooded marshland adjacent to the firth. Areas for crop growing show limited extension, while wood extraction has the least area requirement.
The most obvious transformation of land-use with respect to land requirement is that the proportion of required land increases with regional demographic growth in municipal forms of organization in villages up to 3000 BCE (D–E), and decreases again with the development of smaller groups in the MN V and the Younger Neolithic (F/F–G). Although transformations are considered to have a significant influence on the forms of social organization and imply different social behavior (such as jointly created monumentality, organization of village communities, development of new ideologies like warrior ideology, and individualization or the formation of specialist for flint production), the land-use practices for subsistence farming in the long run remain on a continuous level with regard to the areas used. The socio-cultural changes therefore have only a minor impact on the land-use in relation to the subsistence economy. They are represented by the formation of a ritual cultural landscape structured most of all visible by monuments.
In principle, it can be concluded that the carrying capacity of the investigated regional landscape was not reached at any time. This insight indicates that the social organization of the economy and the cultural development of Neolithic societies are decisive for the social changes in the transformation phases. The results highlight the necessity to analyze other well researched areas in a similar way. Also for other Neolithic and Chalcolithic societies, analyses have shown that postulated environmental shortages related with subsistence economies were overestimated. Thresholds were hardly reached and the carrying capacity was never exceeded to such extent as it was originally postulated (cf. Tripolye, Ohlrau et al. 2016; Dal Corso et al., this issue).
Supplemental Material
2_Supplemental_Material_A – Supplemental material for Transforming landscapes: Modeling land-use patterns of environmental borderlands
Supplemental material, 2_Supplemental_Material_A for Transforming landscapes: Modeling land-use patterns of environmental borderlands by Daniel Knitter, Jan Piet Brozio, Walter Dörfler, Rainer Duttmann, Ingo Feeser, Wolfgang Hamer, Wiebke Kirleis, Johannes Müller and Oliver Nakoinz in The Holocene
Supplemental Material
2_Supplemental_Material_B – Supplemental material for Transforming landscapes: Modeling land-use patterns of environmental borderlands
Supplemental material, 2_Supplemental_Material_B for Transforming landscapes: Modeling land-use patterns of environmental borderlands by Daniel Knitter, Jan Piet Brozio, Walter Dörfler, Rainer Duttmann, Ingo Feeser, Wolfgang Hamer, Wiebke Kirleis, Johannes Müller and Oliver Nakoinz in The Holocene
Supplemental Material
2_Supplemental_Material_C – Supplemental material for Transforming landscapes: Modeling land-use patterns of environmental borderlands
Supplemental material, 2_Supplemental_Material_C for Transforming landscapes: Modeling land-use patterns of environmental borderlands by Daniel Knitter, Jan Piet Brozio, Walter Dörfler, Rainer Duttmann, Ingo Feeser, Wolfgang Hamer, Wiebke Kirleis, Johannes Müller and Oliver Nakoinz in The Holocene
Supplemental Material
2_Supplemental_Material_D – Supplemental material for Transforming landscapes: Modeling land-use patterns of environmental borderlands
Supplemental material, 2_Supplemental_Material_D for Transforming landscapes: Modeling land-use patterns of environmental borderlands by Daniel Knitter, Jan Piet Brozio, Walter Dörfler, Rainer Duttmann, Ingo Feeser, Wolfgang Hamer, Wiebke Kirleis, Johannes Müller and Oliver Nakoinz in The Holocene
Supplemental Material
2_Supplemental_Material_E – Supplemental material for Transforming landscapes: Modeling land-use patterns of environmental borderlands
Supplemental material, 2_Supplemental_Material_E for Transforming landscapes: Modeling land-use patterns of environmental borderlands by Daniel Knitter, Jan Piet Brozio, Walter Dörfler, Rainer Duttmann, Ingo Feeser, Wolfgang Hamer, Wiebke Kirleis, Johannes Müller and Oliver Nakoinz in The Holocene
Supplemental Material
2_Supplemental_Material_F – Supplemental material for Transforming landscapes: Modeling land-use patterns of environmental borderlands
Supplemental material, 2_Supplemental_Material_F for Transforming landscapes: Modeling land-use patterns of environmental borderlands by Daniel Knitter, Jan Piet Brozio, Walter Dörfler, Rainer Duttmann, Ingo Feeser, Wolfgang Hamer, Wiebke Kirleis, Johannes Müller and Oliver Nakoinz in The Holocene
Supplemental Material
2_Supplemental_Material_G – Supplemental material for Transforming landscapes: Modeling land-use patterns of environmental borderlands
Supplemental material, 2_Supplemental_Material_G for Transforming landscapes: Modeling land-use patterns of environmental borderlands by Daniel Knitter, Jan Piet Brozio, Walter Dörfler, Rainer Duttmann, Ingo Feeser, Wolfgang Hamer, Wiebke Kirleis, Johannes Müller and Oliver Nakoinz in The Holocene
Footnotes
Acknowledgements
The research was conducted and financed in context of the Collaborative Research Center 1266 ‘Scales of Transformation – Human–environmental interaction in prehistoric and archaic societies’ of the German Research foundation (DFG, German Research Foundation – project number 2901391021 – SFB 1266). We want thank the two anonymous reviewers for their comments and remarks that helped to clarify and improve this paper.
Funding
The author(s) received no financial support for the research, authorship, and/or publication of this article.
Supplemental material
Supplemental material for this article is available online.
Notes
References
Supplementary Material
Please find the following supplemental material available below.
For Open Access articles published under a Creative Commons License, all supplemental material carries the same license as the article it is associated with.
For non-Open Access articles published, all supplemental material carries a non-exclusive license, and permission requests for re-use of supplemental material or any part of supplemental material shall be sent directly to the copyright owner as specified in the copyright notice associated with the article.