
Abstract
Descriptions of regional climate expression require data from multiple lakes, yet little is known of how variation in records within morphometrically complex lakes may affect interpretations. In northeast Ontario (Canada), this issue was addressed using records of pollen, pigments, and diatoms in three sediment cores from two small boreal lakes spanning the last ~6000 years. Pollen analysis suggested warm conditions between ~6000 and ~4000 cal yr BP, coherent with previous assessments from boreal eastern Ontario and western Quebec. Analysis of phototrophic communities from fossil pigments and diatom valves suggested relatively eutrophic conditions with lower lake-levels during this interval. Generalized additive model trends identified significant regional changes in pollen assemblages and declines in pigment concentrations after ~4000 cal yr BP consistent with cooler and wetter climate conditions that resulted in regional lake oligotrophication and increased lake levels during the late-Holocene. Despite contemporaneous changes in pollen and pigment biomarkers across lakes, cores collected from adjacent basins of the same lake (Green Lake) did not show similar trends in fossil pigments likely reflecting preferential deposition of clay-rich allochthonous material in the deeper central basin and suggesting that regional signals in climate may be complicated by lake- or basin-specific catchment processes.
Keywords
Introduction
The complex connections between variations in climate systems, nutrient influx, and phototroph production in lakes is an area of increasing research (Glibert, 2020; Jeppesen et al., 2010; Moss et al., 2011; O’Neil et al., 2012; Salk et al., 2019; Sinha et al., 2019). Recent increases in primary production in the absence of local human disturbances are particularly worrisome and suggest that warmer temperatures, and associated factors (e.g. deep-water anoxia), or increased precipitation and subsequent nutrient loading, are important drivers of bloom formation (Favot et al., 2019; Paerl and Paul, 2012). Paleolimnological studies have attempted to elucidate these connections by quantifying changes in limnological parameters during past periods of climate warmth, such as the mid-Holocene of North America (Renssen et al., 2009, 2012; Ritchie et al., 1983; Viau et al., 2006). This warm period has been used as a near-future analog for predictions of the effects of atmospheric warming, even though forcing mechanisms differ between the two warming regimes (i.e., solar insolation during the middle Holocene versus modern increases in atmospheric greenhouse gases; Renssen et al., 2009, 2012). The degree and duration of mid-Holocene warming was asynchronous across North America where western Canada and USA experienced warmer and more arid conditions earlier in the Holocene than did eastern regions where there was less extreme warmth and more humid conditions (Shuman and Marsicek, 2016; Viau and Gajewski, 2009). General patterns of North American Holocene environmental change have been described using compilations of prior research (Briner et al., 2016; Marsicek et al., 2018; Shuman and Marsicek, 2016; Viau and Gajewski, 2009; Viau et al., 2006), but there are considerable gaps in regional representation and uncertainty of how representative lake-specific reconstructions may be of regional climate.
The mid-latitude boreal forest of northern Ontario, Canada, is particularly under-represented in studies of Holocene climate, despite its importance as a boundary region between major climate systems (Prentice et al., 1991; Shuman and Marsciek, 2016; Viau and Gajewski, 2009; Viau et al., 2006). The region is relatively undisturbed compared to the areas that surround it, but the forest and its abundant freshwater systems are highly sensitive to anthropogenic warming and eutrophication (Goldblum and Rigg, 2005; Poesch et al., 2016; Price et al., 2013). Recent studies from northwest Ontario suggest warm and dry conditions (Moos and Cumming, 2011, 2012) that were accompanied by regionally-low lake levels (Karmakar et al., 2015a; Laird and Cumming, 2008, 2009; Moos et al., 2005) and increased overall phototrophic production (Karmakar et al., 2015b; Moos et al., 2009) between ~8500 and ~4500 cal yr BP (calendar years before present). Palynological studies from northeast Ontario and nearby western Quebec, however, have described a delayed warm period during ~7500–4000 cal yr BP (Ali et al., 2008, 2009; Carcaillet et al., 2001; Elmslie et al., 2020; Larochelle et al., 2018; Liu, 1990). Assessments of hydroclimate of this region are more variable, but a period of warm and relatively dry conditions, followed by increases in effective moisture after ~6000 cal yr BP, has been inferred in northeast Ontario (Elmslie et al., 2020; Liu, 1990). These interpretations agree with broad-scale reconstructions of North American hydroclimate that suggest wet conditions during the middle Holocene in eastern regions (Prentice et al., 1991; Shuman and Marsicek, 2016; Viau and Gajewski, 2009).
Historical changes in phototrophic community composition and production during the Holocene are poorly understood in northeast Ontario, as some phototrophic records do not align with inferred or reconstructed climate conditions (e.g., Elmslie et al., 2020). Specifically, pigment-inferred increases in primary production have been associated with regional decreases in temperature (Elmslie et al., 2020), in contrast with numerous studies inferring higher phototroph production during warm intervals (Boudreau et al., 2005; Karmakar et al., 2015b; Moos et al., 2009; Moser et al., 2002) and evidence that warmer temperatures typically result in outbreaks of cyanobacteria and algae (Paerl and Paul, 2012). Elmslie et al. (2020) hypothesize that the deposition of carbonate-rich clay materials from the surrounding landscape (Boreux et al., 2017) complicated the response of phototrophic communities during the warm and wet middle Holocene c. ~6000 cal yr BP. Such interactions between climate and catchment processes have been noted by previous studies but are difficult to separate using a single lake basin (Fritz and Anderson, 2013; Renner et al., 2014; Simpson and Anderson, 2009; Zhang et al., 2018).
Here we examined pollen, pigment, and diatom records that span the last ~6000 cal yr BP in two small, headwater, boreal lakes that are separated by ~130 km, but which occupy similar small, elevated drainage basins. The study lakes were selected to minimize the effects of variations in watershed, hydrological, and catchment characteristics and to better isolate overall trends in regional climate and lake-production over millennia. We also compared cores from two contrasting basins within a single lake to evaluate how morphometric complexity of lakes may influence sedimentary expressions of regional climate systems. Together, this study attempted to: (1) determine if there are regional trends in phototroph community composition and production in hydrologically simple first-order lakes associated with middle and late-Holocene climate change in this region, and; (2) determine how analysis of cores from different basins within a single lake might influence interpretation of historical processes.
Methods
Study sites
Hogsback Lake (48°19′20″ N, 82°26’43″ W) and Green Lake (49°11′56″ N, 81°17′1″ W) are two small headwater lakes located in the boreal forest of northeastern Ontario, Canada (Figure 1). Both lakes are circumneutral, have low concentrations of dissolved organic carbon (DOC), and high transparency (Table 1). Hogsback Lake is oligotrophic, whereas Green Lake is mesotrophic, but both have limited macrophyte growth. Neither lake receives hydrological inputs through channelized inflows, while Hogsback Lake has one small outlet (Figure 1). Both lakes support populations of lake trout (Salvelinus namaycush). The surrounding geology of Hogsback and Green lakes is composed of metamorphosed Precambrian granites overlain by Quaternary eskers that elevate the lakes above the surrounding landscape. The Green Lake esker is further overlaid with secondary glacial tills deposited by local Cochrane re-advance glaciation at ~8200 cal yr BP (Frey, 1976; Godbout et al., 2019). Hydrologically, both lakes likely receive substantial groundwater additions to maintain their water levels at relatively high elevations atop their eskers (Boureux et al., 2017), although detailed information regarding the groundwater of these lakes is lacking. Vegetation cover is primarily composed of jack pine (Pinus banksiana) and paper birch (Betula papyrifera) on the upland eskers, with white and black spruce (Picea glauca and P. mariana) in the lowland areas. There are also occurrences of balsam fir (Abies balsamea), eastern larch (Larix laricina), and eastern white cedar (Thjua occidentalis). The watersheds of Hogsback and Green lakes are small and are presently undisturbed (Table 1). These sites are separated by ~130 km and experience a humid continental climate (Köppen Dfb), with warm summers and long, cold winters. Climate data from Timmins, Ontario (Figure 1), shows a mean annual temperature of ~1.8°C and ~830 mm of mean annual precipitation over the 1981–2010 period (Environment Canada, 2020).
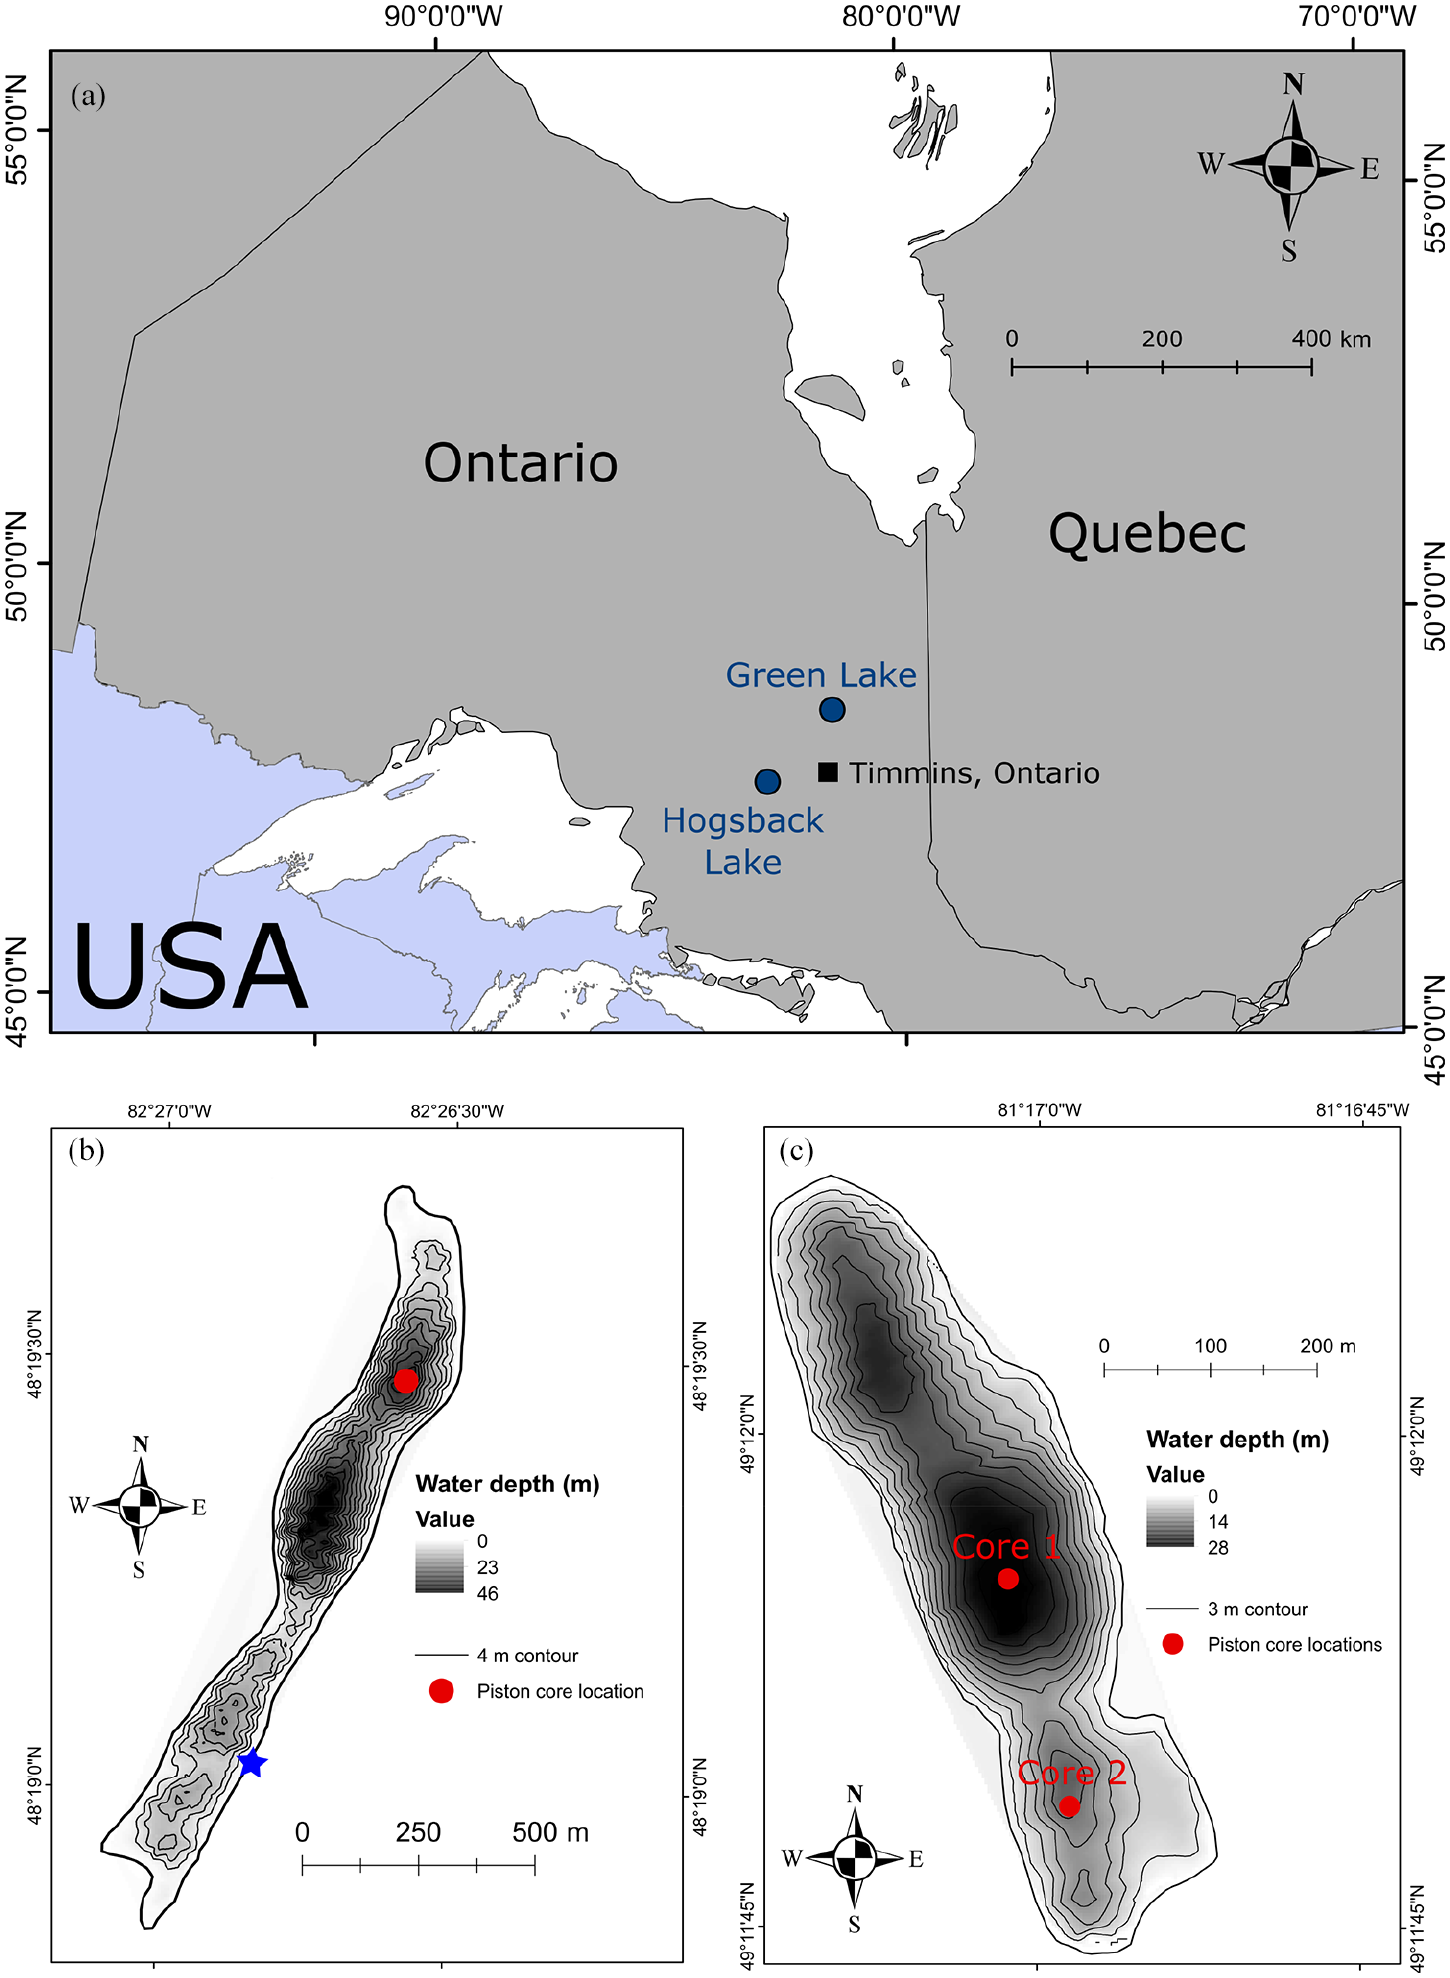
(a) The locations of Hogsback Lake and Green Lake in northeast Ontario, Canada, in relation to Timmins, Ontario. White space is open water, dark gray is Canada, light gray is the USA. (b) Bathymetric map of Hogsback Lake with four-meter contours. Piston coring location is noted by the circle. The star denotes the location of the lake’s outflow. (c) Bathymetric map of Green Lake with three-meter contours. Locations of Green Lake Core 1 (North) and Green Lake Core 2 (South) are noted by the circles.
Physical and chemical variables of Hogsback Lake and Green Lake.
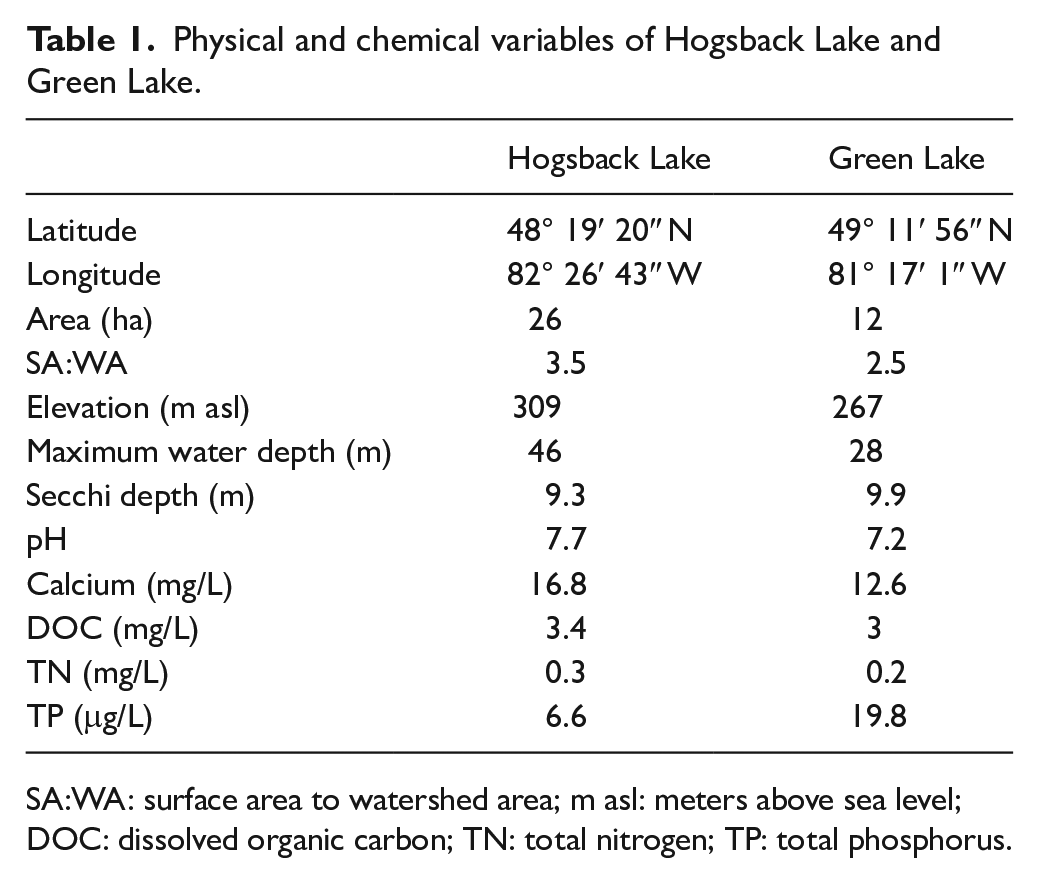
SA:WA: surface area to watershed area; m asl: meters above sea level; DOC: dissolved organic carbon; TN: total nitrogen; TP: total phosphorus.
Core collection
Bathymetric data from Hogsback and Green lakes were collected using a Garmin GPS-Map Sounder connected to a Toughbook computer running the Bathymetric Automated Survey System (B.A.S.S.) software v. 2.4 (Levec, 2001). Data points were converted into bathymetric maps using ArcMap 10.6 (Esri, 2018). A Livingstone square-rod piston corer (internal diameter = 5.1 cm; Glew et al., 2001; Wright, 1967) was used to collect three sediment cores from the lakes in June 2017. Coring was done from an anchored platform that used lowered aluminum support casings to limit flexing of the coring rods during sediment collection. The first drive of each piston core sequence targeted the sediment-water interface to ensure minimal loss of sediment. A core composed of finely laminated sediment was collected in three sections at a depth of ~38 m from the northern basin of Hogsback Lake (Figure 1). Its total length was ~230 cm (Supplemental Figure S1). Green Lake Core 1 was collected from the deep central basin of the lake at a depth of ~28 m and was ~290 cm in total length (Figure 1; Supplemental Figure S2). This core was collected in four sections and contained layers of laminated clay that were interspersed with more organic-rich material. Green Lake Core 2 composed of massive organic sediments was collected in six sections from a depth of ~17 m from the southern basin of Green Lake (Figure 1) and was ~460 cm in total length (Supplemental Figure S3). Piston core sections were wrapped in plastic for transport to the Paleoecological Environmental Assessment and Research Laboratory (PEARL) at Queen’s University. Core sections were split; one half was sectioned into 0.5-cm intervals for 14C, loss-on-ignition (LOI), sedimentary pigment, and diatom analyses, whereas sub-samples for pollen analysis were taken from the second half following μXRF core scanning for elemental composition (Gushulak, 2020). Initial LOI and diatom data were used to construct full core sequences that were confirmed with μXRF analysis. Sampling resolution (see below) was greater than any overlapping or missing sediment material between individual cores in any sequence in this study.
Geochronology
Geochronologies were established for each core using woody macrofossils and pollen samples concentrated for 14C dating at LacCore (University of Minnesota, St. Paul, Minnesota) using the method of Brown et al. (1989). Activity of 14C was measured using accelerator mass-spectrometry (AMS) at Lawrence Livermore National Laboratory (Livermore, California). A Bayesian age-depth model was created for each core sequence (i.e., the Hogsback core, Green Lake Core 1, and Green Lake Core 2) using the IntCal13 14C calibration curve (Blaauw and Christen, 2011; Reimer et al., 2013) and default settings described in Goring et al. (2012) in the rBACON package (v. 2.3.8; Blaauw and Christen, 2011) of R (R Core Team, 2019).
Pollen analysis
Sediment was subsampled in 1-cm3 plugs every 4 cm for pollen analysis of the Hogsback Lake core (57 samples) and Green Lake Core 1 (73 samples). A pollen preparation method similar to that of Bennett and Willis (2001) was used, although digestion in hydrofluoric acid was not performed as only two pollen samples were taken from highly inorganic layers of Green Lake Core 1. Two exotic Lycopodium tablets (batch no. 1031; concentration = 20,848 spores per tablet) were added to each subsample and carbonaceous material was dissolved using 10% hydrochloric acid treatment. Following deflocculation in 10% warmed (~80°C) potassium hydroxide, the remaining sediment was sieved through 10-μm mesh before acetolysis and mounting in silicon oil onto microscope slides. Pollen grains and spores were counted and identified on a Leica DMRB microscope at 400× or 1000× magnification. A minimum of 400 grains were counted for each interval and were identified using palynological references for northeast North America (Bassett et al., 1978; Kapp et al., 2000; McAndrews et al., 1973) and a reference collection of pollen slides from the Fowler Herbarium, Queen’s University.
Loss-on-ignition and sedimentary pigment analysis
Loss-on-ignition (LOI) analysis was performed at the same resolution as pollen analysis in the Hogsback Lake core and Green Lake Core 1 and at every 8 cm (57 samples) along Green Lake Core 2 following the methods of Heiri et al. (2001). Sediments from the same intervals were freeze-dried for high performance liquid chromatography (HPLC) analysis using an Agilent model 1100 HPLC photodiode array detector at University of Regina’s Institute of Environmental Change and Society (IECS). The spectrophotometer was calibrated using commercial (DHI Denmark) and local pigment standards (Leavitt and Hodgson, 2001). Pigment analysis followed the methods described by Leavitt and Hodgson (2001) and the resulting concentrations were reported as nmoles pigment gram−1 organic matter (Leavitt et al., 1994). HPLC analysis included chlorophylls along with their main degradation products and changes between the ratios of labile precursor chlorophyll a to stable product pheophytin a (Chla:Pheoa) were used to help assess the degree of pigment preservation throughout the cores (Leavitt and Hodgson, 2001). Pigments that were detected and could be assigned to taxonomic groups included alloxanthin (cryptophytes), diatoxanthin (primarily diatoms), fucoxanthin (siliceous phototrophs, some dinoflagellates), chlorophyll b (chlorophytes), lutein-zeaxanthin (chlorophytes + cyanobacteria), echinenone (total cyanobacteria), canthaxanthin (Nostocales cyanobacteria), myxoxanthophyll (colonial cyanobacteria), and okenone (purple sulfur bacteria). β-carotene was used to represent total primary production (Leavitt and Hodgson, 2001).
Diatom analysis
Sediments offset by 1-cm from the intervals used for LOI and pigment analysis were subsampled for diatom analysis in all three cores. Sediment subsamples were prepared with the method outlined in Battarbee et al. (2001). Following acid digestion and neutralization, the siliceous slurries were spiked with a solution of microspheres (concentration = 2.0 × 10⁷ spheres ml−1). Samples from Green Lake cores 1 and 2 received 1 ml of stock solution while samples from the Hogsback Lake received 2 ml (see Gushulak, 2020 for concentration data). Siliceous remains were then mounted on glass coverslips, dried and fixed to glass microscopy slides. Diatoms were counted in transects along slides until a minimum of 400 valves was reached. Diatom counting and identification were performed at 1000× magnification using a Leica DMRB microscopy with an oil immersible Fluotar objective (NA = 1.3) and an oil immersible condenser (NA = 1.3). Diatom valves were identified to the lowest possible taxonomic resolution (species or strain) using standard taxonomic references (Cumming et al., 1995; Krammer and Lange-Bertalot, 1986, 1988, 1991a, 1991b).
Numerical analyses
Generalized additive model (GAM) trends were used to identify periods of temporal change in fossil pollen, pigment, and diatom data. Pollen and diatom abundance data were simplified using principal components analyses (PCA) performed using the vegan package v. 2.5-5 (Oksanen et al., 2019) of R prior to modeling. PCAs were selected as species turnover rates in both assemblages were minor, providing a strong basis for modeling. Only taxa which appeared at >1% relative abundance in at least two intervals of each core were included in the analyses. Relative abundance data were square-root transformed prior to analyses (Legendre and Gallagher, 2001). PCA axis-1 and -2 scores were extracted from the ordinations and used to create GAMs with Gaussian error distributions (Simpson, 2018). Modeling of individual pigment concentrations was based on gamma error distributions that are more appropriate for concentration data (Mushet et al., 2020; Simpson, 2018). All GAM trends were based on estimated calibrated 14C age produced from age-depth models and used time as the single covariate to determine temporal changes in the PCA axis-1 and -2 scores or pigment concentrations. Thin-plate regression splines and restricted maximum likelihood (REML) procedures were used to determine the degrees of freedom in each model (Simpson, 2018; Wood, 2017). The first derivatives of fitted GAM trends were evaluated at regular time intervals throughout the cores to estimate periods of significant temporal change in the biological proxies. As the slope of the GAM trend may change, multiple points in time were selected to detect changes in slope that are nonzero and significant (Bennion et al., 2015). All models were created and tested in the mgcv v. 1.8–28 (Wood, 2020) package of R.
Results
Geochronology
Core sediments in all lakes were well consolidated and exhibited minimal loss during core collection due to a controlled release of overlying water during core extrusion. Consequently, the top of the first drive of each piston core, was assumed to be −67 cal yr BP (2017 CE), the year of core collection. Given the millennial focus of the study, the top of the core, rather than 210Pb-dated sediments, was assumed to be an adequate tie-point for estimation of core chronology. Further, any samples younger than 0 cal yr BP were removed from analysis to limit potential bias in the uppermost core samples and interpretations are limited for the last ~1000 cal yr of our cores.
The age-depth model for the Hogsback Lake piston core sequence was generated from eight pollen 14C ages and one woody macrofossil 14C age (Table 2). The model showed a near-linear age-depth relationship with no reversals or hiatuses in sedimentation and estimated a basal date of ~6300 cal yr BP (Figure 2). Eight 14C ages measured from concentrated pollen samples were used to generate the age-depth model for the Green Lake Core 1 sequence (Table 2). The model showed a near-linear relationship between age and depth to ~225 cm and a corresponding age of ~5000 cal yr BP, beyond which there were small changes in age-depth model slope (Figure 2). A basal date of ~6300 cal yr BP was also estimated by this model. Nine 14C ages from concentrated pollen samples and three 14C ages from woody macrofossils were used to create the age-depth model for the Green Lake Core 2 sequence (Table 2). The age-depth model was nearly linear, although the slope of the relationship increased slightly below ~340 cm depth (Figure 2). The base of core was estimated to be ~6200 cal yr BP.
Summary of AMS 14C dating for the Hogsback Lake core, Green Lake Core 1, and Green Lake Core 2. Analyses were performed on isolated pollen grains or woody macrofossils*. Core depths are sampled interval mid-depths. Cal yr BP refers to the mean age estimated by the Bacon age-depth model for that interval.
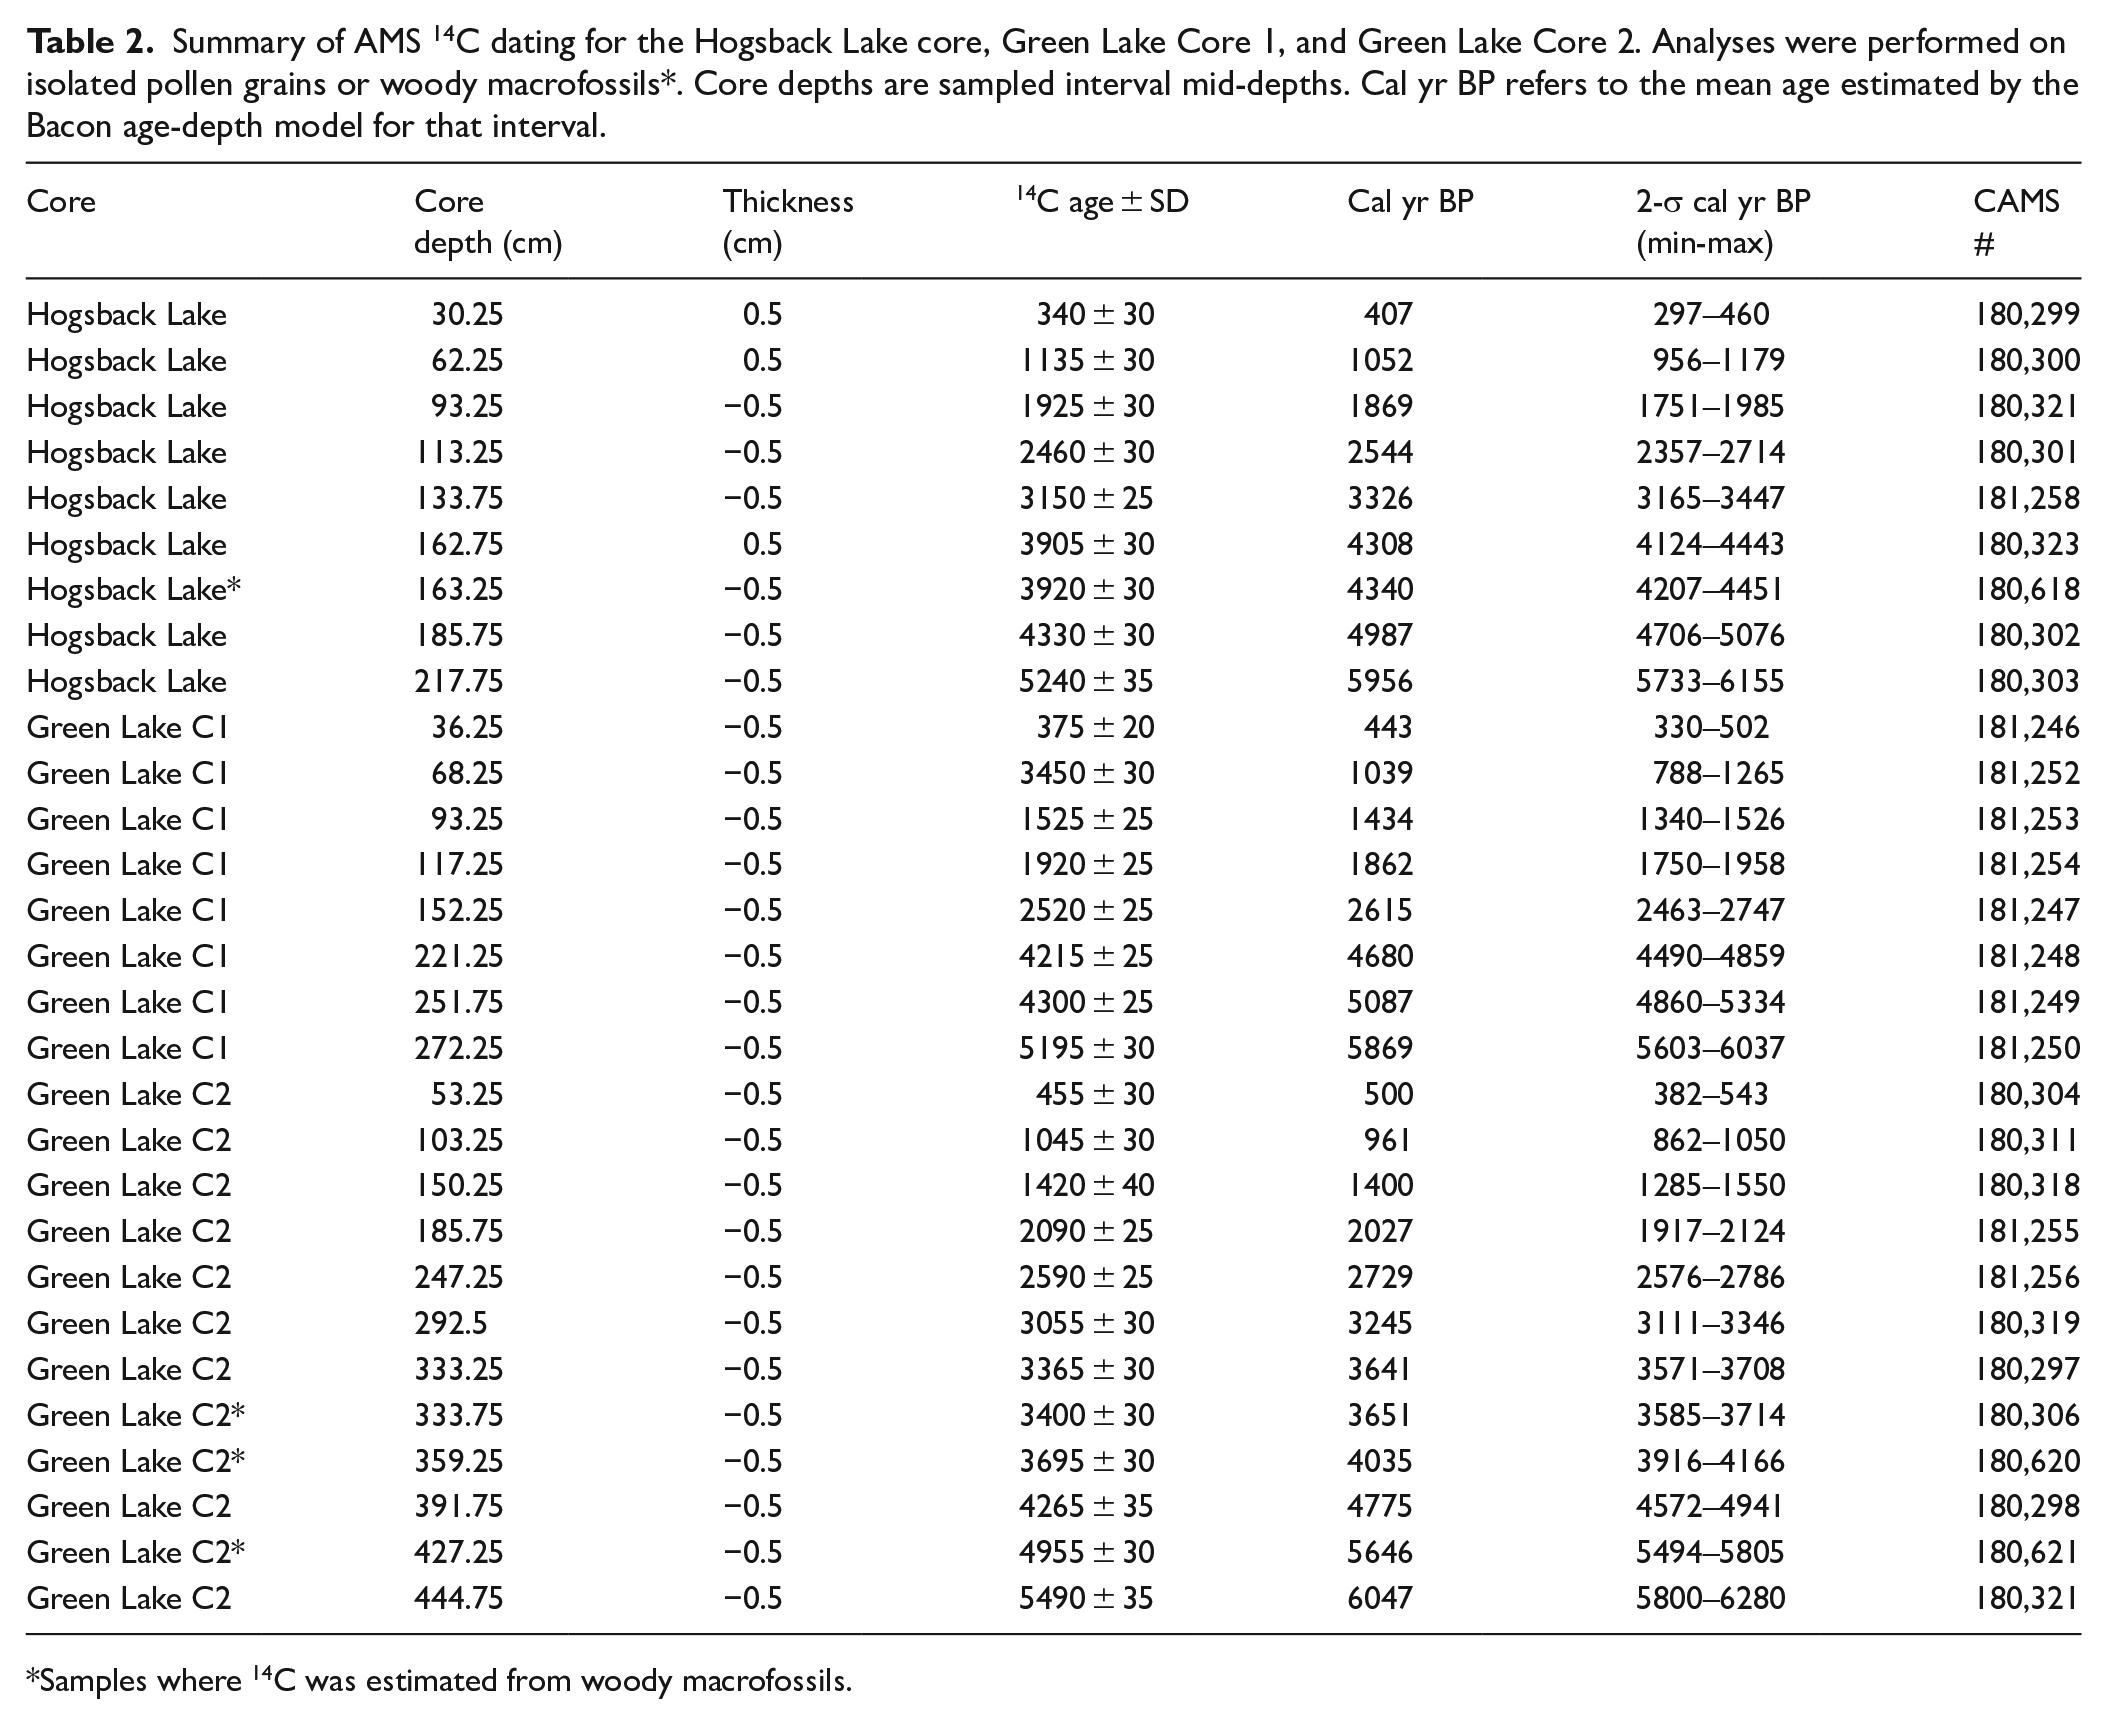
Samples where 14C was estimated from woody macrofossils.
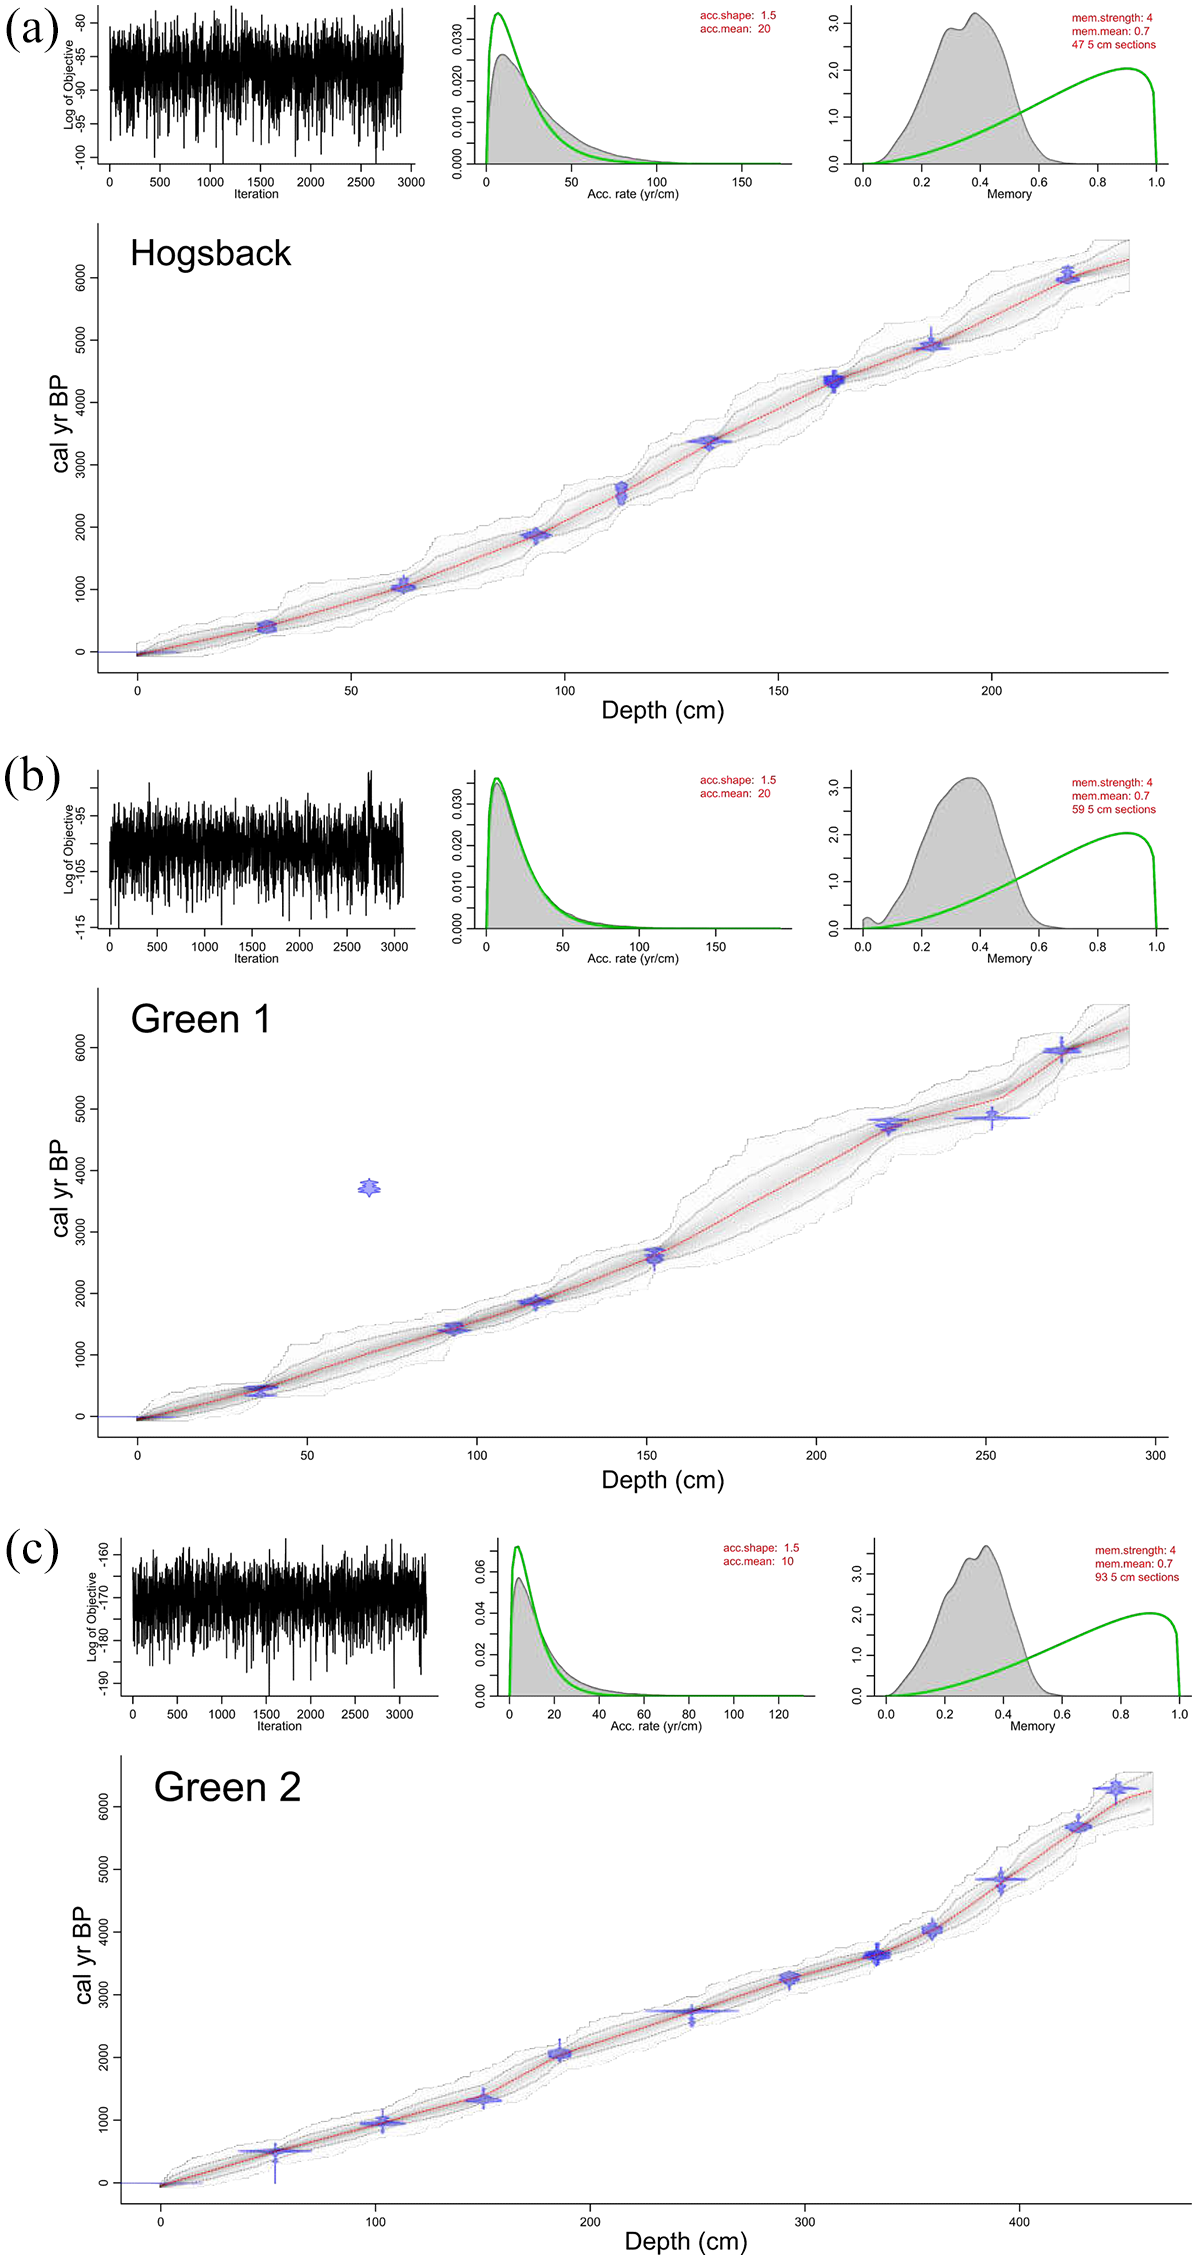
Bayesian age-depth relationships modeled by Bacon based on 14C ages of pollen and woody macrofossils for (a) the Hogsback Lake core, (b) Green Lake Core 1, and (c) Green Lake Core 2. For all plots: top-left panel shows Markov Chain Monte Carlo model iterations; top-middle panel shows prior (line) and posterior (shaded) sediment accumulation rate distribution; top-right panel shows prior (line) and posterior (shaded) distribution of model memory; bottom-panel shows calibrated 14C ages and the age-depth model. Shaded areas of the age-depth models represent 95% confidence intervals of the weighted mean age (center dotted line).
Pollen analysis
Pollen analysis revealed similar patterns in Hogsback and Green lakes (Figure 3). In both lakes, there were low abundances of Picea and Betula combined with high abundances of Pinus subgenus Pinus from ~6300 to ~4000 cal yr BP. There were also high abundances of Pinus subgenus Strobus and Cupressaceae during this time, but abundances of these latter two taxa were higher in Hogsback Lake than in Green Lake. Pollen abundances changed at ~4000 cal yr BP with declines in P. subg. Strobus and Cupressaceae and increases in Betula and Picea. This pattern was accompanied by varying abundances of P. subg. Pinus up to ~2000 cal yr BP (Figure 3). The last ~2000 cal yr showed further increases in Picea and declines in P. subg. Strobus and Cupressaceae. There were declines in Betula from previously high abundances during ~2000–1000 cal yr BP, but this taxon increased over the last ~1000 cal yr (Figure 3). The relative abundance of Abies also increased at both sites over the last ~2000 cal yr. There were small increases in Ambrosia-type and other non-arboreal pollen in the topmost intervals of both cores.
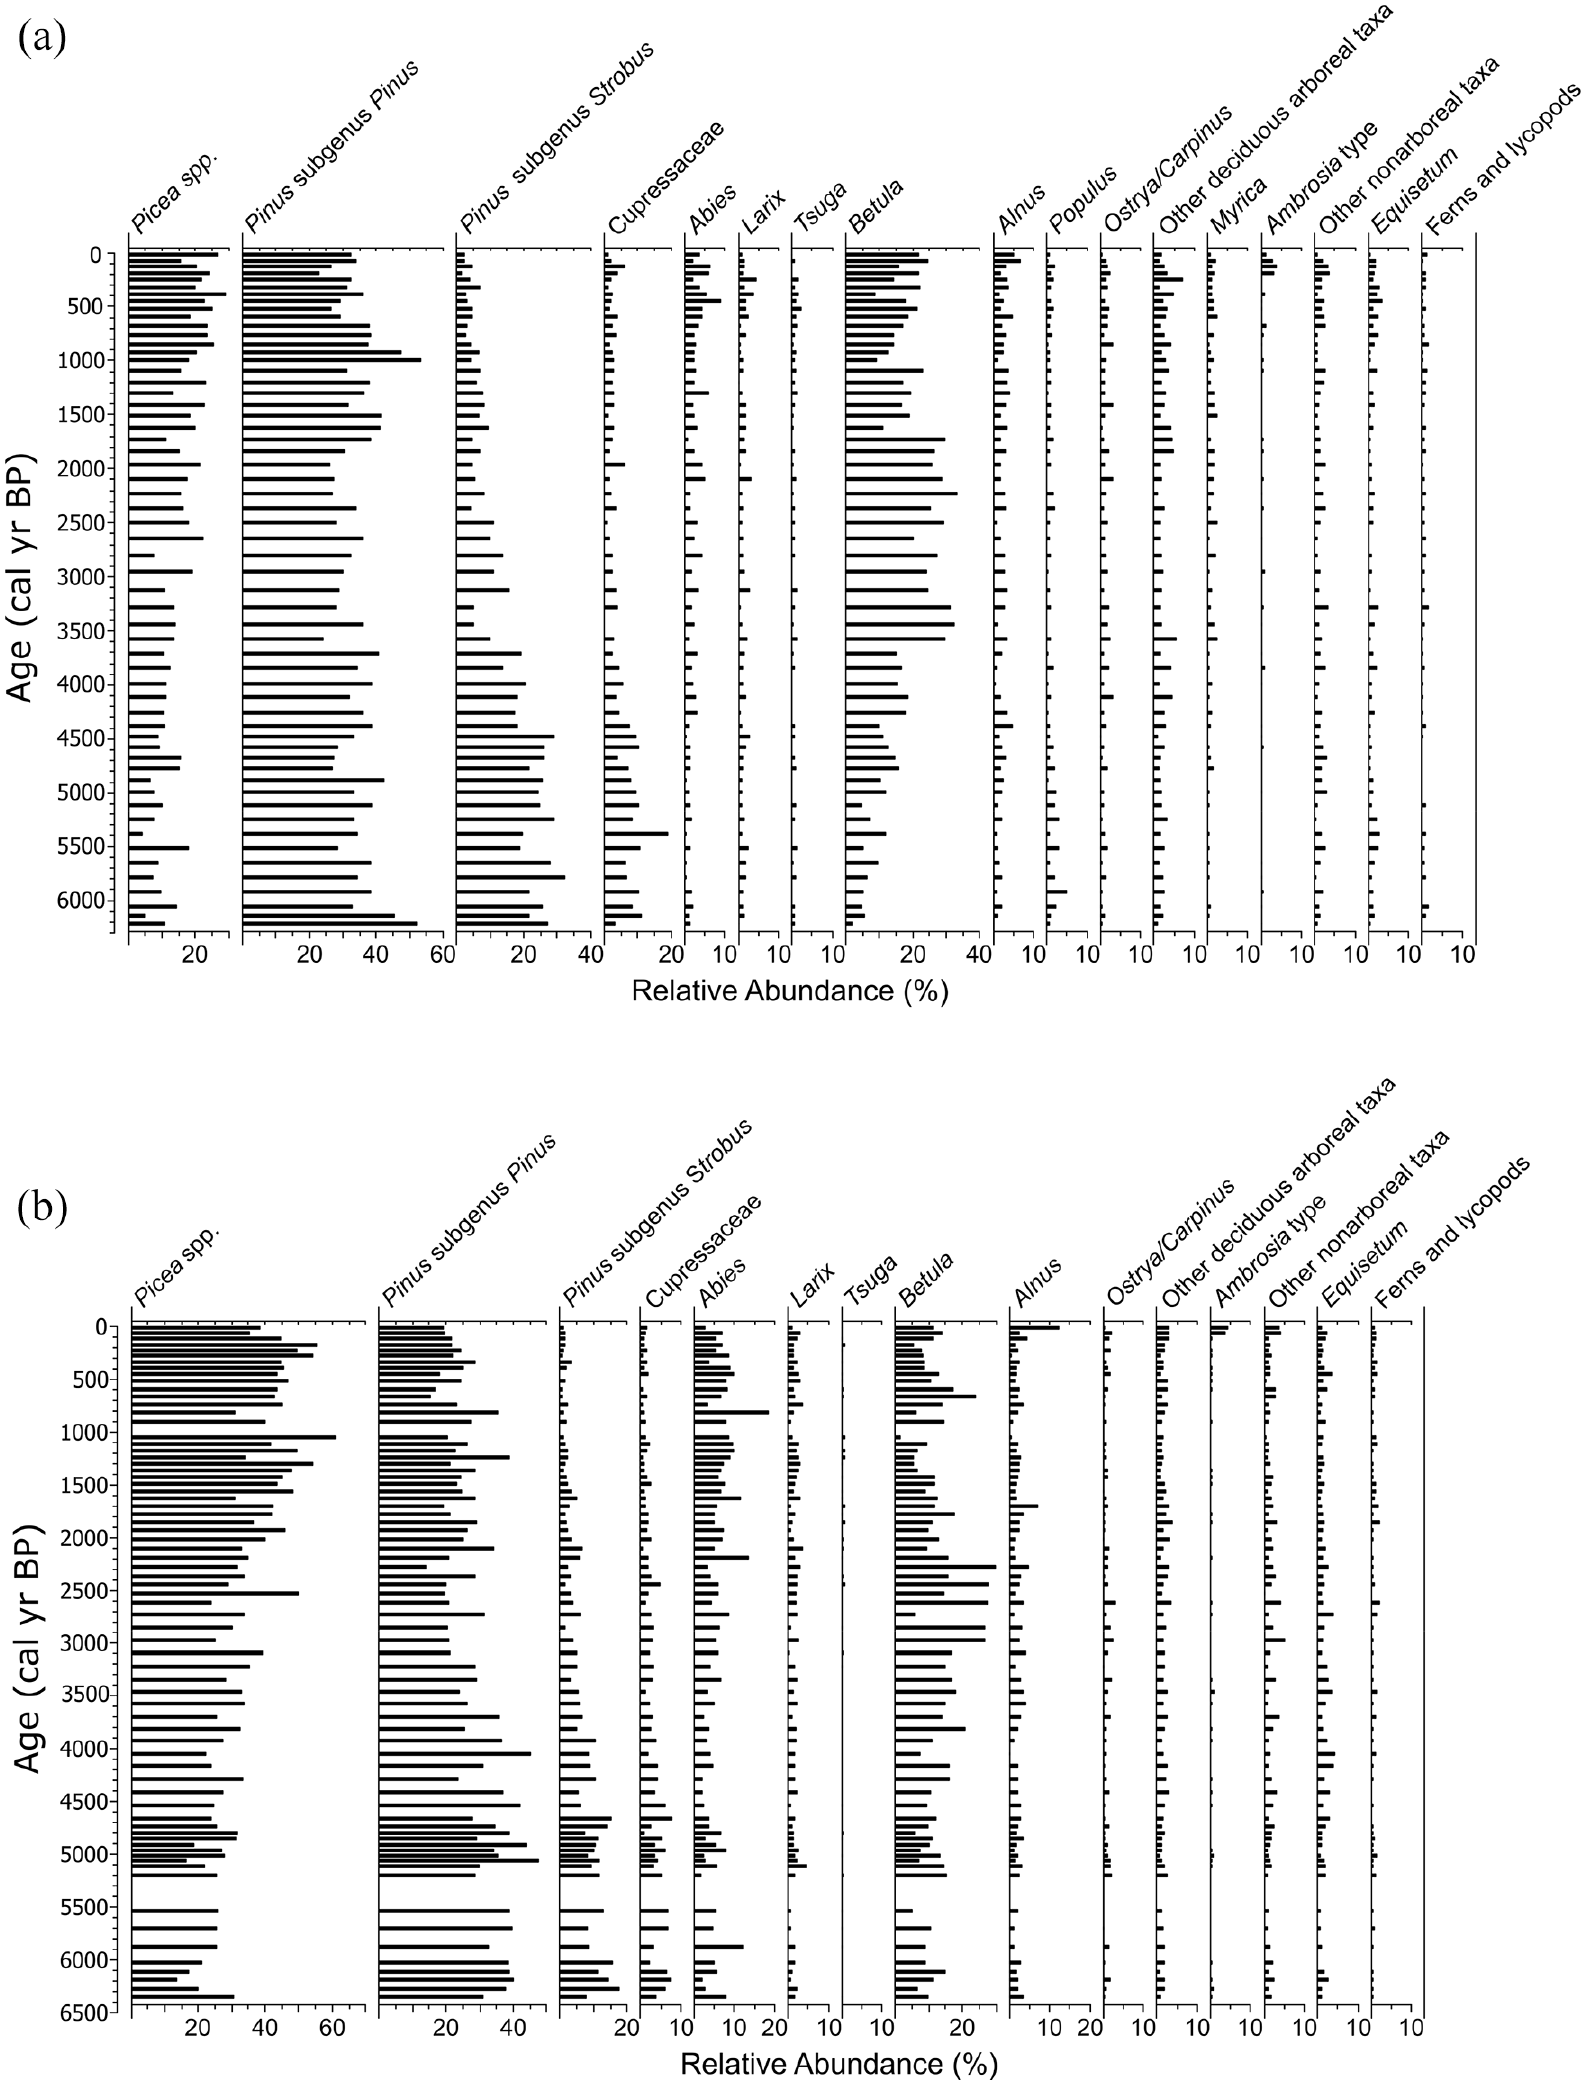
Relative abundances of common (>2%) and grouped pollen taxa from (a) Hogsback Lake and (b) Green Lake Core 1 plotted by age (cal yr BP).
Pollen PCA axis-1 and -2 scores were used in GAMs to delineate periods of significant change in pollen abundances over time. These trends in pollen composition suggested that assemblages in Hogsback and Green lakes changed significantly over much of the Holocene record (Figure 4). At Hogsback Lake, first-derivative extractions of the PCA axis-1 model showed that scores changed significantly between ~5000 and ~3000 cal yr BP, while significant changes in trend occurred in the PCA axis-2 model during ~6000–5000 cal yr BP and during ~2500–1000 cal yr BP (Figure 4). Similar changes occurred in the GAMs of Green Lake pollen PCA scores, where axis-1 scores changed significantly throughout most of the record, while the axis-2 model scores changed significantly at ~4000 cal yr BP and between ~2500 and ~1500 cal yr BP (Figure 4).
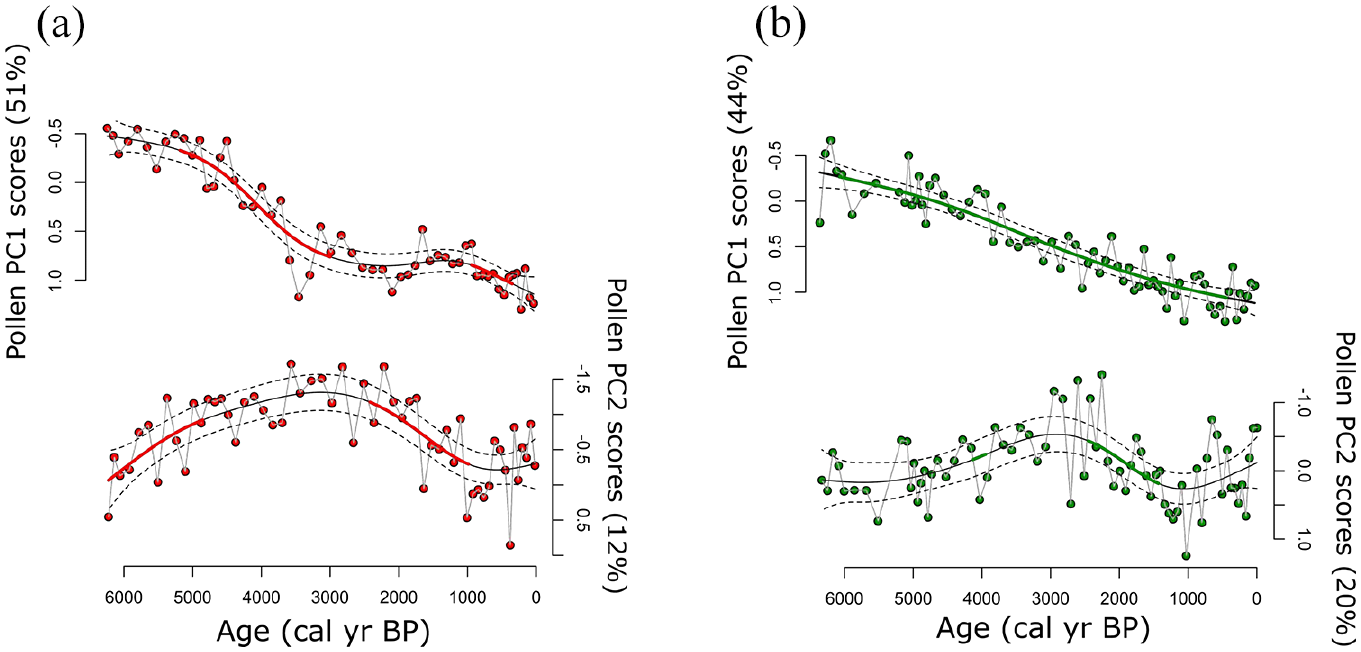
Pollen PCA axis-1 and axis -2 scores with fitted generalized additive model (GAM) trends for (a) Hogsback Lake and (b) Green Lake Core 1 modeled and plotted against 14C age (cal yr BP). In all plots the solid line represents the trend of the model fit, dotted lines are 95% confidence intervals, and the bold line indicates areas of significant model slope changes through time.
Pigments
HPLC analysis revealed similar trends in pigment concentrations for Hogsback Lake and Green Lake Core 2, while those of Green Lake Core 1 were markedly different (Figures 5 and 6). The pigment preservation index (Chla:Pheoa) was generally stable throughout both the Hogsback Lake core and Green Lake Core 2, but was highly variable in Green Lake Core 1 (Figure 5a and c). In Hogsback Lake and Green Lake Core 2, concentrations of β-carotene (all phototrophs) were relatively high from ~6300 to ~4500 cal yr BP (Figure 5a and c). Concentrations of lutein-zeaxanthin (chlorophytes, cyanobacteria) were also high during this interval in Green Lake Core 2 and were contemporaneous with relatively high concentrations of cyanobacterial pigments (i.e., echinenone, canthaxanthin, myxoxanthophyll). However, concentrations of lutein-zeaxanthin did not reach their highest sustained concentrations until ~4000–2000 cal yr BP in Hogsback Lake. Sustained high concentrations of alloxanthin (cryptophytes) and diatoxanthin (diatoms) also occurred in Hogsback Lake between ~4000 and ~2000 cal yr BP and were mirrored by relatively similar high concentrations of these pigments in Green Lake Core 2 (Figure 5c). Cyanobacterial pigment concentrations were low during ~4000–2000 cal yr BP in Green Lake Core 2, but concentrations of echinenone and canthaxanthin were variable over this time period of Hogsback Lake (Figure 5a). Concentrations of all pigments in Hogsback Lake and Green Lake Core 2 began to decline at ~2000 cal yr BP reaching minimal values at ~1000 cal yr BP. Pigment concentrations increased in the final ~1000 cal yr of Hogsback Lake and Green Lake Core 2, but generally did not reach the high concentrations seen earlier in the core. In contrast, myxoxanthophyll levels (colonial cyanobacteria) in Hogsback Lake increased by ~500% at in very recent sediments before returning to low values (Figure 5a).
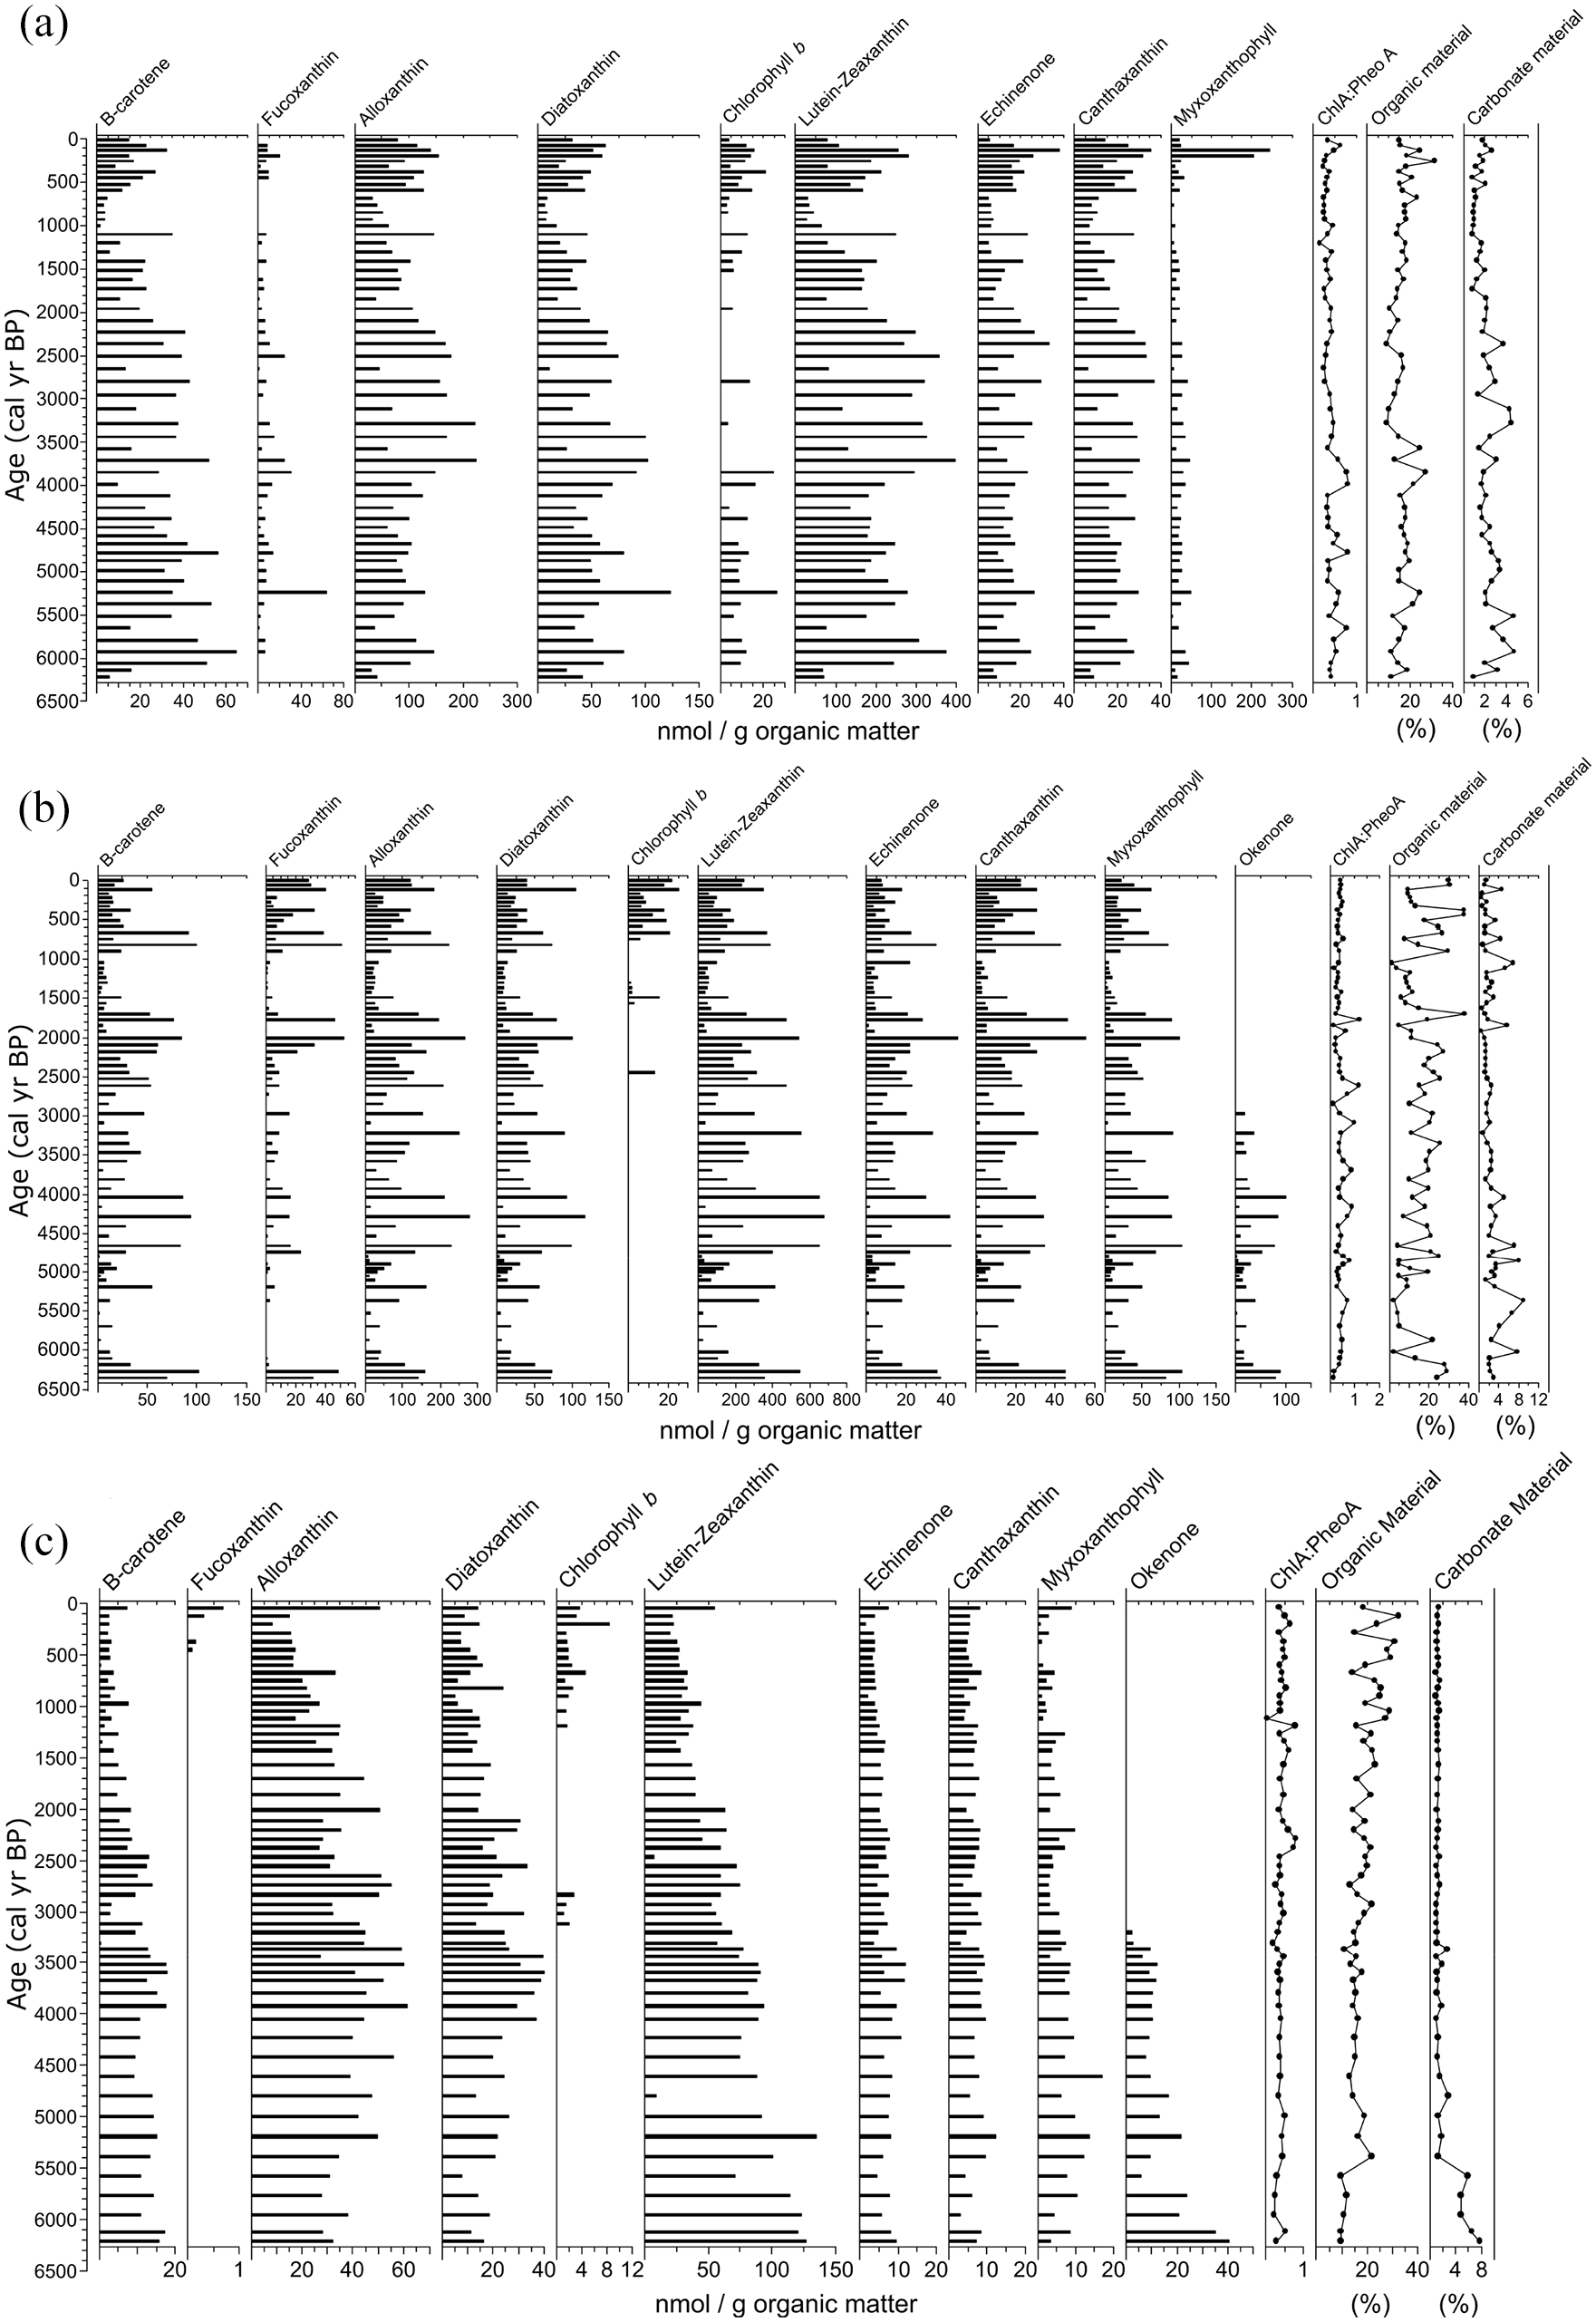
Concentrations of photosynthetic pigments (nmoles pigment gram−1 organic matter) in (a) Hogsback Lake, (b) Green Lake Core 1, and (c) Green Lake Core 2. Concentrations are plotted by age (cal yr BP). The chlorophyll a-to-phaeophytin a ratio and the percentage of organic and carbonate material in the cores are also presented. Pigments presented here are representative of total algal production (β-carotene), siliceous algae (fucoxanthin), cryptophytes (alloxanthin), mainly diatoms (diatoxanthin), chlorophytes (chlorophyll b), chlorophytes + cyanobacteria (lutein-zeaxanthin), total cyanobacteria (echinenone), Nostocales cyanobacteria (canthaxanthin), colonial cyanobacteria (myxoxanthophyll), and purple sulfur bacteria (okenone).
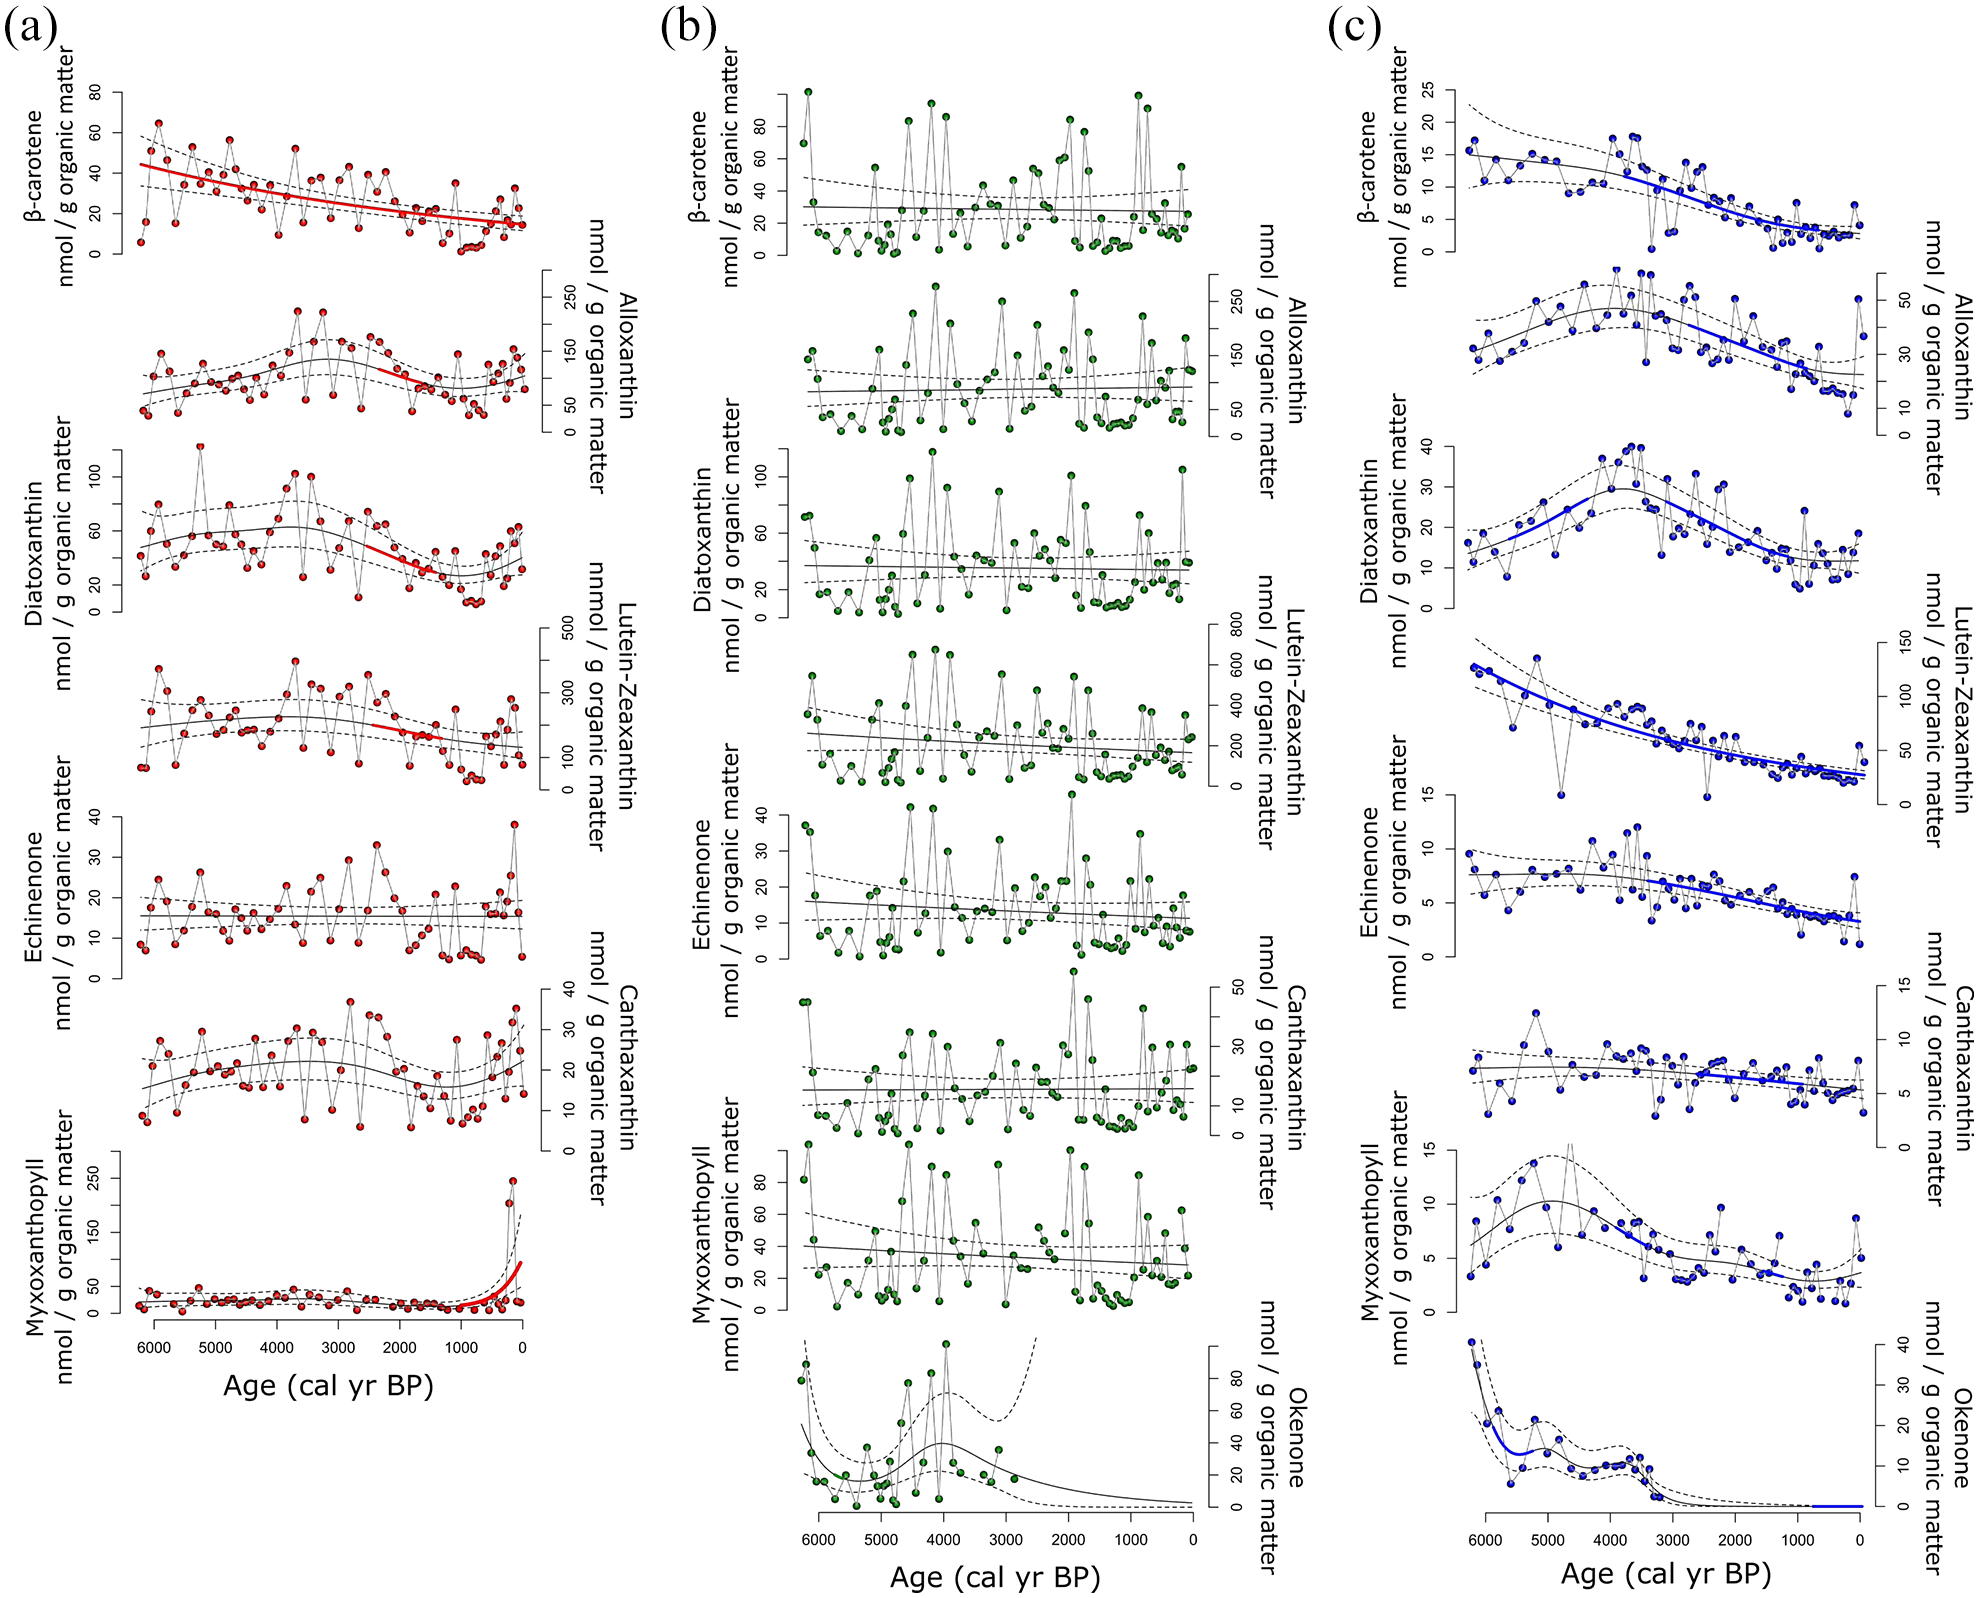
Individual pigment concentrations with fitted generalized additive model (GAM) trends from (a) Hogsback Lake, (b) Green Lake Core 1, and (c) Green Lake Core 2, modeled and plotted against 14C age (cal yr BP). In all plots the thin solid line represents the trend of the model fit, dotted lines are 95% confidence intervals, and the bold line indicates areas of significant model slope changes through time. Pigments presented here are representative of total algal production (β-carotene), cryptophytes (alloxanthin), mainly diatoms (diatoxanthin), chlorophytes + cyanobacteria (lutein-zeaxanthin), total cyanobacteria (echinenone), Nostocales cyanobacteria (canthaxanthin), colonial cyanobacteria (myxoxanthophyll), and purple sulfur bacteria (okenone).
Pigment concentrations in Green Lake Core 1 did not follow the trends observed in the other cores. Instead, concentrations varied through time, increasing when the sediment was more organic and decreasing in areas of increased inorganic material (Figure 5). Notably, high basal concentrations of okenone from purple sulfur bacteria declined until the biomarker was no longer detected after ~3000 cal yr BP (Figure 5b). This trend was also seen in Green Lake Core 2 where high values of this pigment declined from ~6200 cal yr BP to trace values at ~3200 cal yr BP (Figure 5c).
Fitted GAM trends of pigment concentrations showed similar patterns between Hogsback Lake and Green Lake Core 2, while no significant periods of change were recorded for any pigment from Green Lake Core 1 (Figure 6). In Hogsback Lake, concentrations of β-carotene declined significantly throughout the sediment record. Alloxanthin, diatoxanthin, and lutein-zeaxanthin concentrations showed similar trends, with non-significant increases before ~3500 cal yr BP and significant declines after ~2500 cal yr BP. The only significant change in cyanobacterial biomarkers in Hogsback Lake was a marked increase in myxoxanthophyll levels after ~1000 cal yr BP (Figure 6). In Green Lake Core 2, first derivative extractions of fitted GAM trends showed that concentrations of lutein-zeaxanthin declined significantly throughout the sediment record, while concentrations of β-carotene and myxoxanthophyll also declined significantly after ~4000 cal yr BP. Changes in fitted GAM trends also suggested significant declines in alloxanthin, diatoxanthin, echinenone (total cyanobacteria), and canthaxanthin (Nostocales cyanobacteria) after ~3000 cal yr BP in Green Lake Core 2. Okenone concentrations declined significantly between ~6000 and ~5200 cal yr BP and were then present at only trace levels after ~3500 cal yr BP (Figure 6).
Diatoms
The diatom assemblages of Hogsback and Green lakes exhibited higher variability between the three sediment cores than did pollen or pigment profiles (Figures 7 and 8). Diatoms in Hogsback Lake sediments were composed primarily of planktic taxa throughout the entire sediment record. There were high abundances of Aulacoseira subarctica, with lesser abundances of Aulacoseira ambigua, Staurosirella pinnata and low abundances of Discostella stelligera between ~6300–4000 cal yr BP (Figure 7). There were also low abundances of Stephanodiscus parvus during this time. After ~4000 cal yr BP, relative abundances of A. subarctica declined, while abundances of D. stelligera and other centric planktic taxa increased. These trends continued until ~200 cal yr BP when abundances of araphid pennate plankton, including Asterionella formosa and Fragilaria nanana, began to increase, while D. stelligera, and particularly Aulocoseira spp., declined (Figure 7). Abundances of Lindavia intermedia also increased during this time. On the basis of fitted GAM trends, diatom PCA axis-1 scores increased significantly throughout most of the sediment core of Hogsback Lake (Figure 8). The model of axis-2 scores, however, showed significant increases in axis scores only after ~1000 cal yr BP (Figure 8).
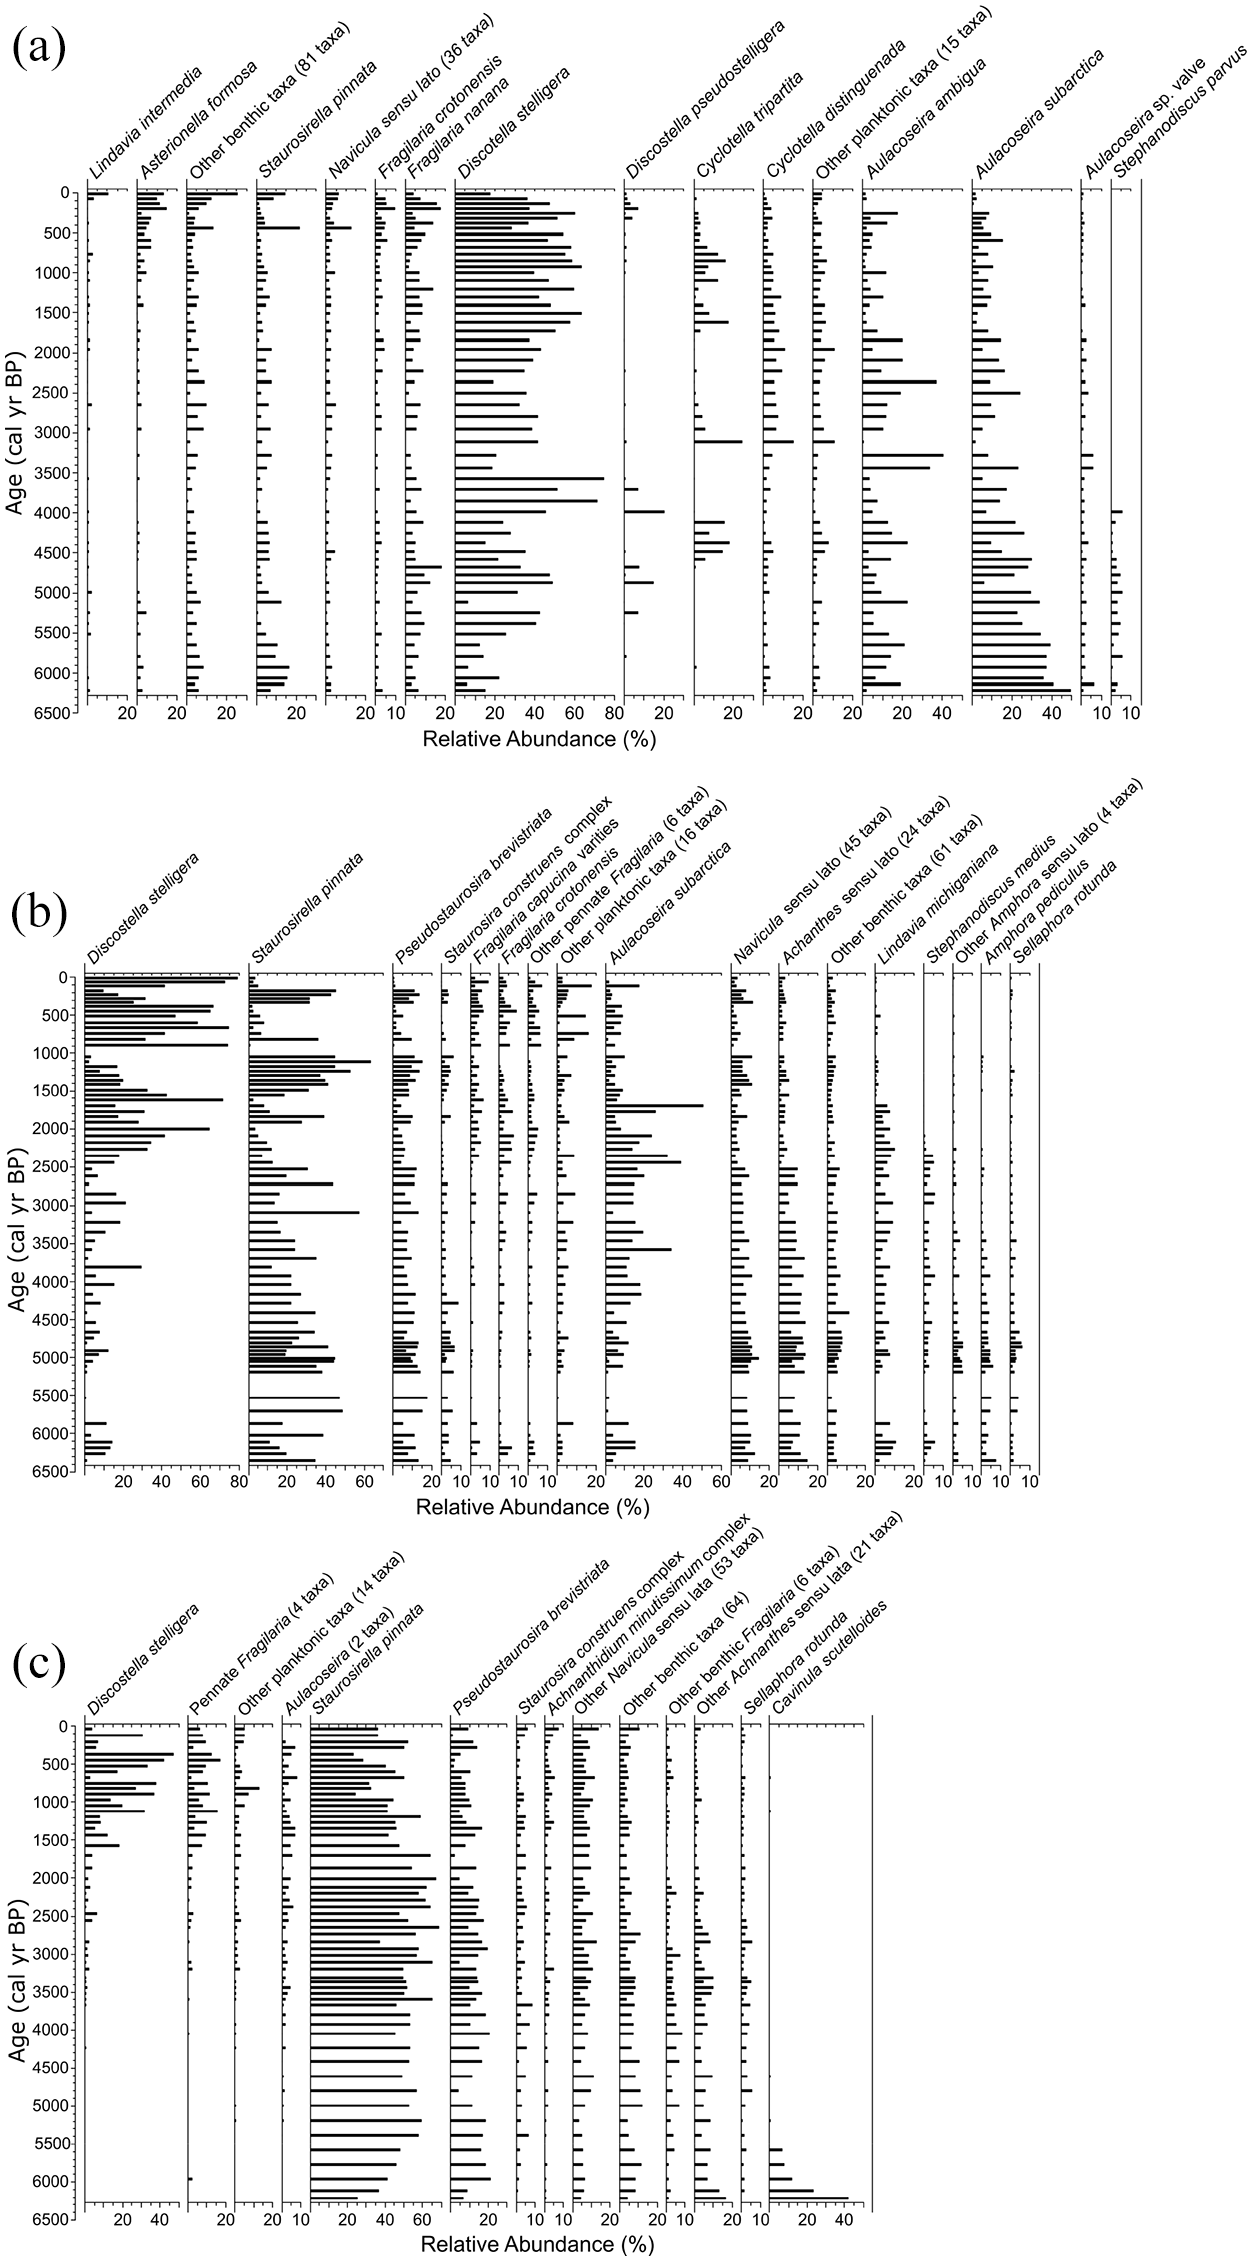
Relative abundance of common (>5% relative abundance) and grouped diatom taxa in the (a) Hogsback Lake core, (b) Green Lake Core 1, and (c) Green Lake Core 2 plotted by age (cal yr BP).
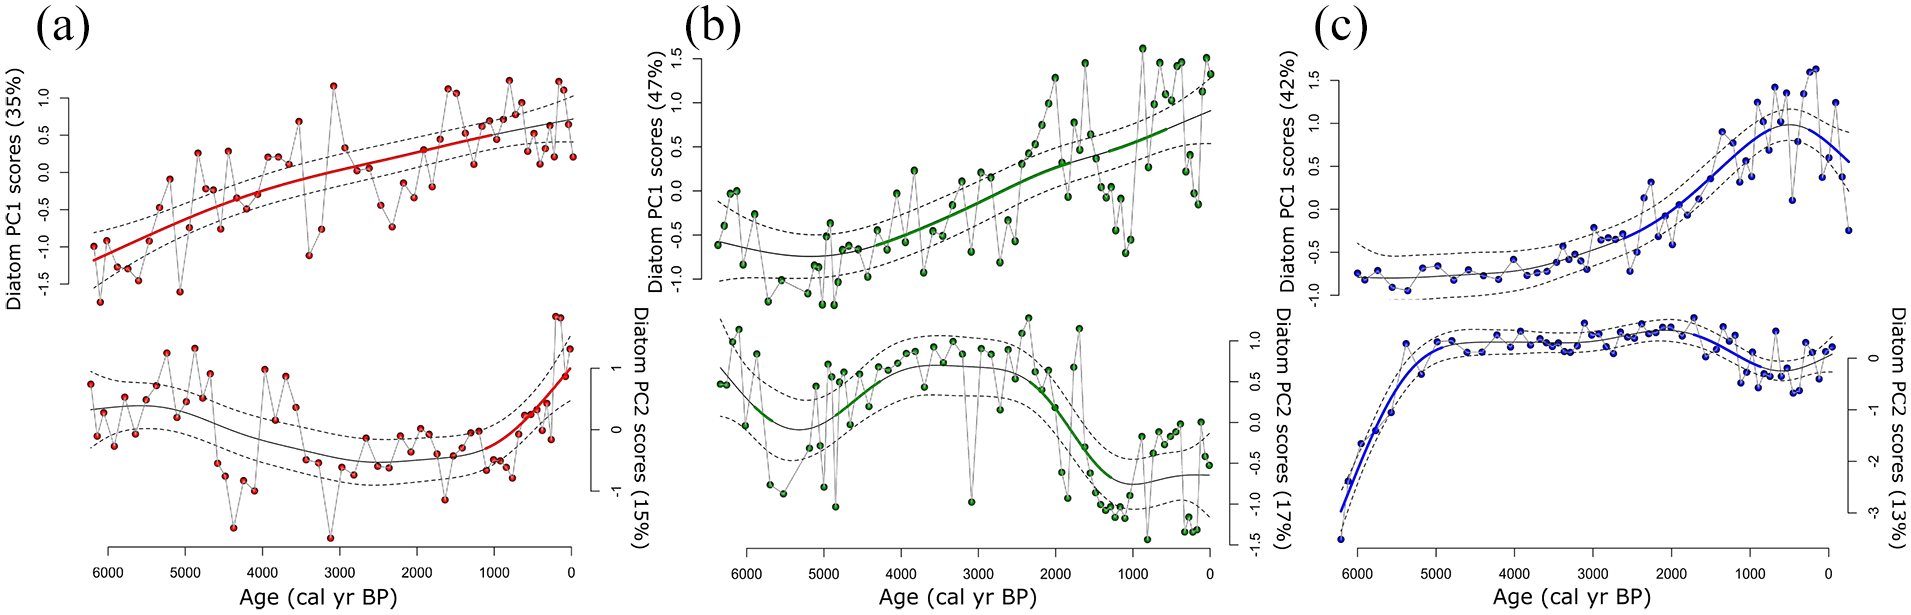
Diatom PCA axis-1 and -2 scores with fitted generalized additive model (GAM) trends for (a) Hogsback Lake, (b) Green Lake Core 1, and (c) Green Lake Core 2 modeled and plotted against 14C age (cal yr BP). In all plots the thin solid line represents the trend of the model fit, dotted lines are 95% confidence intervals, and the bold line indicates areas of significant change through time.
The diatom flora of Green Lake Core 1 was primarily composed of small benthic fragilarioid (primarily S. pinnata) taxa alongside relatively high abundances of other benthic taxa during ~6300–4500 cal yr BP (Figure 7). Benthic taxa abundance generally decreased between ~4500 and ~2500 cal yr BP alongside increases in planktic taxa including A. subarctica and Stephanodiscus medius. Abundances of D. stelligera also increased between ~4000 and ~1500 cal yr BP. During the most recent ~1500 cal yr, there were alternating periods of high abundances of S. pinnata and D. stelligera in Green Lake Core 1 sediments (Figure 7). First derivative extractions of the diatom PCA axis-1 scores fitted GAM trend suggested significant changes in the diatom assemblage during ~4500–1000 cal yr BP (Figure 8). Significant changes were also detected in the diatom PCA axis-2 fitted GAM trend between ~5000 and ~4000 cal yr BP and between ~2500 and ~1500 cal yr BP (Figure 8).
The diatom flora of Green Lake Core 2 had high abundances of Cavinula scutelloides between ~6200 and ~5500 cal yr BP (Figure 7). This taxon was replaced by S. pinnata and Pseudostaurosira brevistriata during ~5000–2000 cal yr BP (Figure 7). Planktic diatoms, including D. stelligera and pennate Fragilaria taxa, increased thereafter before declining at ~500 cal yr BP (Figure 7). The fitted GAM of diatom PCA axis-1 scores showed significant increases between ~3000 and ~1000 cal yr BP and significant decreases afterwards (Figure 8). The fitted GAM of diatom PCA axis-2 scores showed significant changes in the assemblage at ~5000 cal yr BP and between ~2000 and ~1000 cal yr BP (Figure 8).
Discussion
Similar pollen assemblages in Hogsback and Green lakes suggest a warm climate between ~6000 and ~4000 cal yr BP in northeast Ontario based on high abundances of P. subg. Strobus pollen during this time. The palynological results of this study agree with others of the region (Elmslie et al., 2020; Liu, 1990) and suggest that the climate became cooler and effectively wetter based on declines in P. subg. Strobus and increases in Picea after ~4000 cal yr BP. These climate changes resulted in regional lake oligotrophication based on declining concentrations of ubiquitous pigments in sediments of the two lakes. Despite similarities in phototroph records across lakes, discrepancies in pigment concentrations within the Green Lake cores suggest basin-specific differences in deposition of inorganic material from overlying tills, likely due to contrasting basin morphometries. These patterns suggest that regional climate signals may be overridden or complicated by basin-specific catchment input.
Middle and late-Holocene climate of northeast Ontario
Age-depth models suggest that the sediment records of Hogsback and Green lakes encompassed the past ~6300 cal yr BP. This result is surprising as previously published core analyses from northeast Ontario (Elmslie et al., 2020; Liu, 1990) and western Quebec (Ali et al., 2008; Larochelle et al., 2018) suggest basal dates of ~7500–8200 cal yr BP. Those cores agree with the known deglaciation history of the region (Roy et al., 2011; Veillette, 1994) and suggest that the earliest ~2000 cal yr of sediment were not collected from Hogsback and Green lakes. In the present study, core collection was halted by densely packed sediments that the piston coring device could not penetrate, despite the use of support casings. Difficulty in recovering the deepest sediments may reflect input of dense materials from the local eskers leading to well-compacted bottom sediments. Despite the limited temporal coverage of the present study, robust insights are possible on the effects of regional climate variation in these lakes.
Pollen in sediments from Hogsback Lake and Green Lake Core 1 displayed very similar patterns of change, both in terms of the timing of compositional changes and in fitted GAM trends of PCA axes scores (Figures 3 and 4). Pollen assemblages from both cores contained high abundances of P. subg. Strobus and Cupressaceae pollen and low abundances of Picea between ~6300–4000 cal yr BP. Here, we interpret Cupressaceae pollen to be primarily representative of Thuja as opposed to Juniperus (Yu, 1997) based on the occurrences of Thuja macrofossils and stomata being found in other sediment cores of this region (Elmslie et al., 2020; Liu, 1990), the previous climate assessments of those studies and others in northeast Ontario and the surrounding regions (Ali et al., 2008; Elmslie et al., 2020; Liu, 1990), and the modern range of Thuja occidentalis (eastern white cedar; Thompson et al., 1999a, 1999b). The pollen assemblages suggested a warm climate in northeast Ontario during between ~6300 and 4000 cal yr BP (Elmslie et al., 2020; Larochelle et al., 2018; Liu, 1990), after which major regional climate change must have occurred to result in declines in P. subg. Strobus and Cupressaceae and increases in Picea and Betula in the Hogsback core and Green Lake Core 1 past ~4000 cal yr BP (Figure 3). The agreement between sites separated by ~130 km signifies that changes in pollen assemblages represented regional climate change as opposed to catchment-specific effects at this time.
Fitted GAM trends based on pollen PCA axes scores were similar in Hogsback and Green lakes (Figure 4). Trends in the PCA axis-1 scores of both lakes are most likely due to the decreases in P. subg. Strobus and Cupressaceae pollen and increases in Picea over time, coherent with decreasing temperatures over the middle and late-Holocene (Ali et al., 2009; Elmslie et al., 2020; Larochelle et al., 2018; Liu, 1990). GAM trends based on pollen PCA axis-2 scores also showed similar trends due to increased abundances of Betula between ~4000 and ~2000 cal yr BP (Figures 3 and 4). The pollen assemblage changes suggest increasing effective moisture in the region after ~4000 cal yr BP based on the similar taxa used in the direct boreal Holocene hydroclimate reconstructions of Viau and Gajewski (2009).
Ali et al. (2009) interpreted changes in fire frequency in western Quebec to be partly controlled by a rising water table after ~4000 cal yr BP. A similar mechanism likely occurred in the catchments of Hogsback and Green lakes as the water-level of these esker lakes are likely regulated by the groundwater (Finney et al., 2012). Depressed groundwaters prior to ~4000 cal yr BP are consistent with our interpretation of the co-occurrence of Thuja and P. subg. Strobus between ~6000 and ~4000 cal yr BP as the former taxon would have thrived in wet marshy soils created immediately following water table decline and would be excluded as lake levels rose and inundated soils (see below; Liu, 1990). Concurrently, stands of P. subg. Strobus could grow effectively on the drier soils of the upland eskers (Jacobson, 1979; Larochelle et al., 2018; Liu, 1990). Cooler and effectively wetter conditions after ~4000 cal yr BP, as indicated by increases in Picea (Shuman and Marsicek, 2016; Viau and Gajewski, 2009) would have restricted the growth of both taxa by restricting the range limit of P. subg. Strobus and removing habitat space for Thuja.
Further declines in P. subg. Strobus pollen (Larochelle et al., 2018), declines in Betula (Payette and Frégeau, 2019), and increases in Picea suggest that the climate of northeast Ontario became cooler over the last ~2000 cal yr BP, and signify the onset of modern boreal conditions (Viau et al., 2006). In addition, there were small but noticeable increases in Ambrosia-type and other non-arboreal pollen (including Poaceae) in the most recent sediments of both lakes (Figure 3) that reflect regional forest clearance by Europeans (McAndrews and Boyko-Diakonow, 1989). Although both Hogsback Lake and Green Lake now exist in relatively undisturbed watersheds, the Ambrosia-type pollen signal suggests that areas within, or close to, the watersheds were likely logged in the past.
Phototroph response to climate during the past 6000 cal yr
Alongside regional trends in pollen assemblage changes, concentrations of sedimentary pigments revealed several coeval trends in phototroph community composition and production over the middle and late-Holocene of northeast Ontario. These synchronous patterns were evident for sedimentary pigments from Hogsback Lake and Green Lake Core 2, both in terms of concentrations (Figure 5) and periods of significant change (Figure 6), although there were overall higher concentrations of pigments in Hogsback Lake (Figure 5), likely due to the poorer preservation environment of Green Lake Core 2 (Leavitt and Carpenter, 1990). However, these common trends were not reflected in pigment concentrations of Green Lake Core 1 (Figures 5 and 6). Marked differences in historical interpretations from two basins in a single lake are likely related to differences in local morphometry of the basins (e.g. steeper slopes at Core 1 site; Figure 1) and suggest that investigators must be careful about interpreting records environmental change from lakes with complex basin morphometry (see below).
High concentrations of β-carotene in the Hogsback Lake core and Green Lake Core 2 signify elevated primary production during ~6300–4000 cal yr BP in northeast Ontario (Leavitt and Hodgson, 2001). Similarly, high concentrations of lutein-zeaxanthin (chlorophytes + cyanobacteria) in Green Lake Core 2, combined with the presence of cyanobacterial pigments (echinenone, canthaxanthin, myxoxanthophyll), suggests that the phototroph community contained abundant cyanobacteria that would have thrived in the warmer conditions of the middle Holocene (Figure 5; Horn and Uhlmann, 1995; Watermann et al., 1999; Yan et al., 2017). This warmer climate resulted in relatively eutrophic conditions between ~6000–4000 cal yr BP, similar to other mid-Holocene eutrophication trends recorded in boreal lakes within central and northwest Ontario (Boudreau et al., 2005; Karmakar et al., 2015b; Moos et al., 2009). Diatom data further supports this interpretation, with high abundances of A. subarctica in Hogsback Lake and Stephanodiscus species in both lakes; taxa symptomatic of meso-eutrophic conditions (Figure 7; Cumming et al., 2015). Elevated primary production would also be expected to enhance the deep-water anoxia needed to support obligately anaerobic purple sulfur bacteria that produced okenone during ~6300–4000 cal yr BP (Figure 5). This anoxia may have resulted in internal nutrient loading from the sediment which would have enhanced the eutrophic conditions in Green Lake (Søndergaard et al., 2003).
Concentrations of β-carotene declined significantly in Hogsback Lake and in Green Lake core 2 after ~4000 cal yr BP (Figure 6) alongside the cooling climate (Elmslie et al., 2020; Liu, 1990; Viau et al., 2006) signifying the onset of climate-mediated regional oligotrophication. Concentrations of alloxanthin (cryptophytes) and diatoxanthin (diatoms), however, rose to maximum values at ~4000 cal yr in Green Lake Core 2 and at ~3500 cal yr BP in the Hogsback Lake core (Figure 6). Lutein-zeaxanthin concentrations (chlorophytes, cyanobacteria), but not those of cyanobacteria-specific biomarkers, also increased during this time in Hogsback Lake (Figure 5), likely representing an increase in chlorophyte production at this site (Brock et al., 2006). Coeval increases in alloxanthin and lutein-zeaxanthin between ~4000 and ~3000 cal yr BP were also recorded by Elmslie et al. (2020) who suggest that longer periods of thermal stratification may have favored formation of metalimnetic blooms of flagellate green algae and cryptophytes instead of surface blooms of cyanobacteria (Leavitt and Carpenter, 1990). It is more parsimonious, however, to assert that cooler temperatures after ~4000 cal yr BP decreased cyanobacteria production as these organisms are better adapted to warmer conditions (Horn and Uhlmann, 1995; Watermann et al., 1999; Yan et al., 2017). In addition, declines in A. subarctica abundance at Hogsback Lake, and the extirpation of Stephanodiscus taxa at both sites (Figure 7), suggest declining nutrient levels in Hogsback and Green lake after ~4000 cal yr BP (Cumming et al., 2015) that could have hindered cyanobacterial production after ~4000 cal yr BP (Davis et al., 2009). Although concentrations of cyanobacterial pigments increased slightly in Hogsback Lake during this interval, fitted trends of echinenone and canthaxanthin GAMs did not reveal significant changes in these pigments (Figure 6). Considering the relatively low concentrations of these biomarkers compared to contemporaneous increases in lutein-zeaxanthin, diatoxanthin, and alloxanthin, cyanobacterial production did not likely increase substantially at this time and, instead, may vary slightly due to centennial changes in preservation environment in the late-Holocene (Leavitt and Carpenter, 1990).
Oligotrophication would have also increased deep-water oxygen concentrations and led to elimination of obligately anaerobic sulfur bacteria (as okenone) after ~3500 cal yr BP in Green Lake Core 2 and after ~3000 cal yr BP in Green Lake Core 1 (Figures 5 and 6). The asynchronous loss of okenone in Green Lake cores is consistent with reduction in anoxic conditions first in the shallow southern basin before occurring in the deeper central basin several centuries later (Figure 1). These increases in deep-water oxygen concentrations may have also reduced any internal nutrient loads from the sediments further reinforcing the oligotrophication of Green Lake during the past ~3000 cal yr BP (Itoh et al., 2003; Massé et al., 2002).
Changes in climate may have led to regional variation in lake levels after ~4000 cal yr BP. High abundances of benthic diatom taxa in both Green Lake cores suggest relatively low water-levels between ~6300 and ~4000 cal yr BP (Karmakar et al., 2015a; Laird and Cumming, 2008, 2009; Moos et al., 2005). A transition from a primarily benthic diatoms to a more planktic assemblage occurred at ~4000 cal yr BP in Green Lake Core 1 (deeper basin) and at ~2000 cal yr BP in Green Lake Core 2 (shallower basin) and is consistent with either an increase in lake level (Karmakar et al., 2015a; Laird and Cumming, 2008, 2009) or a reduction in light penetration (Gushulak and Cumming, 2020; Kingsbury et al., 2012). We infer that increased water-levels are more likely to have restricted deep-water communities, as oligotrophication (see above) should have increased water-clarity and provided additional benthic habitat for phytobenthos, contrary to observed declines in benthic diatoms (Gushulak and Cumming, 2020; Kingsbury et al., 2012). Increases in effective moisture because of cooler temperatures between ~4000–2000 cal yr BP (Shuman and Marsicek, 2016; Viau and Gajewski, 2009) would have likely raised water levels high enough for the observed increases in planktic taxa in Green Lake Core 1 followed by a similar rise in Green Lake Core 2 ~2000 cal yr later. In addition, increases in water-levels after ~4000 cal yr BP would have likely resulted in lower water retention times in Hogsback and Green lakes which would have reduced the amount of nutrients available for the phototroph community (Karmakar et al., 2015b; Moos et al., 2005, 2009). Therefore, higher lake-levels and -volumes during the middle Holocene also contributed to regional oligotrophication alongside declines in temperatures.
Concentrations of all pigments in the Hogsback Lake core and Green Lake Core 2 declined to minimum values between ~1000 and 500 cal yr BP (Figures 5 and 6) in agreement with further declines in regional temperatures (Elmslie et al., 2020; Larochelle et al., 2018; Liu, 1990). Concentrations of myxoxanthophyll increased substantially in the most recent sediments of Hogsback Lake (Figure 5) contemporaneous with increases in Ambrosia-type pollen (Figure 3). We infer that logging may have resulted in a pulse of nutrients into Hogsback Lake causing the spike of colonial cyanobacteria. These changes also align with a sudden shift in diatom assemblages (Figure 7), although the specific environmental cause of this species change is uncertain and requires further high-resolution study. However, the absence of similar patterns in the most recent sediments of the Green Lake cores suggest that the changes in Hogsback Lake represent local disturbances rather than regional climate forcing.
Deposition of inorganic matter in Green Lake
Similarities in pigment concentrations between Hogsback Lake and Green Lake Core 2 suggest regional oligotrophication occurred through the late-Holocene in northeast Ontario. In contrast, pigment concentrations of Green Lake Core 1 (deeper basin) were highly variable, showed no significant change in pigment GAMs, and did not follow trends in the other cores (Figures 5 and 6). Instead, sediments of Green Lake Core 1 contained multiple layers of carbonate-rich clay that were likely sourced from the clay-rich till that overlies the Green Lake esker (Supplemental Figure S2; Boissonneau, 1966; Frey, 1976; Godbout et al., 2019). The deposition of these inorganic layers has interrupted the deposition or preservation of sedimentary pigments like other sites in the region (e.g. Charland Lake; Elmslie et al., 2020) likely by reducing the organic material content while creating a highly oxygenated, poor preservation environment at the time of deposition (Leavitt and Hodgson, 2001). Diatoms were detected within these clay layers which suggests that despite the influx of carbonate material into the lake, alkalinity was not so great as to have caused significant diatom dissolution. Clay layers were not observed in the Hogsback Lake core (Supplemental Figure S1), due to its location away from the limit of these carbonate-rich tills, or in Green Lake Core 2 (Supplemental Figure S3; the shallower basin) despite the occurrence of the material in the local watershed. This suggests basin-specific influence from the catchment is responsible for the deposition of the clay layers in Green Lake Core 1.
The central basin of Green Lake (Core 1) is surrounded by steep slopes (Figure 1) while the south basin (Core 2) is surrounded by more gently sloping sides (Figure 1). We suggest that when the clay material entered Green Lake it was preferentially deposited into the deeper central basin due to the differences in morphometry and depths of the basins (Blais and Kalff, 1995; Davis et al., 1984). The releases of the clay material from the watershed were likely triggered by heavy precipitation events over the middle Holocene which could weather the relatively undeveloped landscape of northeast Ontario during that time (Liu, 1990; Prentice et al., 1991; Shuman and Marsicek, 2016). Overall declines in these clay layers through the late-Holocene are likely due to increased paedogenesis across the region (Olsen et al., 2010).
The hypothesis of differential deposition among basins makes the presence of a large clay layer between ~1500 and ~1000 cal yr BP is particularly interesting as there were no obvious markers of climate variability that could have induced variable deposition at this time. In addition, the clay band is contemporaneous with high abundances of small benthic fragilarioid taxa (e.g., S. pinnata) and decreases in the centric planktic taxon D. stelligera (Figure 7). Introduction of clay into the water column should have increased turbidity and decreased light transmission thereby limiting phytobenthic growth, despite the increases in benthic fragilarioids (Cantonati et al., 2009; Gushulak and Cumming, 2020; Kingsbury et al., 2012) which are also known to succeed in turbid, light-limited conditions (e.g., Bradshaw et al., 2000). Consequently, we infer that clays deposited between ~1500–1000 cal yr BP may represent the effects of internal sediment slumping and redeposition of clay-rich sediments from intermediate depths where small fragilarioid taxa normally thrive (Kingsbury et al., 2012; Rühland et al., 2003) to more central locations (e.g., focusing). Such a discontinuity may also explain the erroneous 14C date that was sampled from this core depth in Green Lake Core 1 (Figure 2b) and likely resulted in overall lower diatom production due to light-limitation. As the shallower basin of Green Lake (Core 2) is surrounded by gentle slopes, deposition of dense inorganic materials from the watershed or the basin slopes was more unlikely, resulting in pigment records which track changes in climate and nutrient levels over the Holocene.
Conclusions
Coeval periods of significant change in pollen assemblages in widely separated lakes reveal a coherent signal of regional climate change in northeast Ontario during the middle and late-Holocene. Specifically, high temperatures from ~6300 to ~4000 cal yr BP occurred concomitant with high concentrations of sedimentary pigments suggesting that warming favored relatively eutrophic conditions. Subsequent cooler and effectively wetter conditions in the late-Holocene resulted in regional oligotrophication and increased lake levels, as inferred through pigment concentrations and diatoms. Synchronicity between periods of significant change in fitted GAM trends of pigment concentrations across lakes show that declines in phototroph production were likely tied to changes in regional climate over the late-Holocene.
Analysis of sedimentary pigments from Green Lake Core 1 highlights the importance of local catchment effects on paleolimnological records. Periodic deposition of inorganic clay-rich material throughout this core appears to have overridden the regional patterns of phototroph production recorded in the Hogsback Lake and Green Lake Core 2. Differences in catchment slope and aspect may have played a critical role in altering phototrophic response to climate variation. This differential response among lakes and basins shows the need for careful site selection in paleolimnological investigations to ensure that the degree of catchment influence can at least be qualitatively assessed.
Supplemental Material
sj-pdf-1-hol-10.1177_09596836211025972 – Supplemental material for Basin-specific records of lake oligotrophication during the middle-to-late Holocene in boreal northeast Ontario, Canada
Supplemental material, sj-pdf-1-hol-10.1177_09596836211025972 for Basin-specific records of lake oligotrophication during the middle-to-late Holocene in boreal northeast Ontario, Canada by Cale AC Gushulak, Peter R Leavitt and Brian F Cumming in The Holocene
Supplemental Material
sj-pdf-2-hol-10.1177_09596836211025972 – Supplemental material for Basin-specific records of lake oligotrophication during the middle-to-late Holocene in boreal northeast Ontario, Canada
Supplemental material, sj-pdf-2-hol-10.1177_09596836211025972 for Basin-specific records of lake oligotrophication during the middle-to-late Holocene in boreal northeast Ontario, Canada by Cale AC Gushulak, Peter R Leavitt and Brian F Cumming in The Holocene
Supplemental Material
sj-pdf-3-hol-10.1177_09596836211025972 – Supplemental material for Basin-specific records of lake oligotrophication during the middle-to-late Holocene in boreal northeast Ontario, Canada
Supplemental material, sj-pdf-3-hol-10.1177_09596836211025972 for Basin-specific records of lake oligotrophication during the middle-to-late Holocene in boreal northeast Ontario, Canada by Cale AC Gushulak, Peter R Leavitt and Brian F Cumming in The Holocene
Footnotes
Acknowledgements
The authors thank the Ontario Ministry of Natural Resources and Forestry for access to Greenwater Provincial Park. We thank Maya Grantier, Jessica Heck (LacCore, University of Minnesota), and Tom Brown (Lawrence Livermore National Laboratory) for sample preparation and 14C dating, Kate Laird (Queen’s University) for help with diatom identification, and Deirdre Bateson (University of Regina) for aid with HPLC analysis. Graham Mushet and Monica Fisher are thanked for their assistance in the field. Pollen data is available on the Neotoma database. Pigment and diatom data is available from the corresponding author upon request. This research was based on samples collected from Canada’s Treaty 9, the territory historically occupied and cared for by Ojibway and Oji-Cree peoples of the Anishinaabe nation.
Funding
The author(s) disclosed receipt of the following financial support for the research, authorship, and/or publication of this article: This project was funded by NSERC Discovery grants to PRL and BFC, an NSERC PGS-D scholarship to CACG, and with support from The W. Garfield Weston Foundation Fellowship Program, a program of the Wildlife Conservation Society Canada funded by The W. Garfield Weston Foundation. Pigment analysis was supported by the Canada Foundation for Innovation and Province of Saskatchewan.
Supplemental material
Supplemental material for this article is available online.
References
Supplementary Material
Please find the following supplemental material available below.
For Open Access articles published under a Creative Commons License, all supplemental material carries the same license as the article it is associated with.
For non-Open Access articles published, all supplemental material carries a non-exclusive license, and permission requests for re-use of supplemental material or any part of supplemental material shall be sent directly to the copyright owner as specified in the copyright notice associated with the article.