
Abstract
In archaeology, change in material culture is viewed as indicating social or cultural transformation and is the basis of our typo-chronological classification of phases and periods. The material culture from northern Germany reveals both quantitative and qualitative changes during the Bronze Age. At the same time, there is also evidence for ‘boom and bust’ cycles in population density/size, as indicated by changing human impact on the environment in several Bronze Age palaeoenvironmental records. These demographic fluctuations may relate to the observed changes in social phenomena in aspects of ideology, technology, food production and habitation. For example, innovations in food production, such as the adoption of new crops and agricultural techniques, could have led to population growth. While usually viewed by archaeologists as a ‘negative’ development, population stress or collapse may have favoured the emergence of new cultural phenomena. In order to test the cause-and-effect relationship between population dynamics and sociocultural change, we synthesise the archaeological evidence – qualitative and quantitative information from settlements, deposition finds (hoards), burials, material culture and architectural remains – for the Bronze Age in northern Germany, mainly Schleswig-Holstein, and compare it with the boom and bust pattern seen in the palaeoenvironmental record. The synchronicity of changes at ca. 1500 BC and ca. 1100 BC reflects the relationship between phases of major sociocultural transformation in the archaeological datasets and booms and busts in the palaeoenvironmental record of the region seen as a proxies for palaeo-demography. This sets the stage for a better understanding of the transformation of practices and relationships in the Bronze Age communities of the region.
Keywords
Introduction
Transformation
In modern sociology, change is defined as a shifting in the structure of the social system (Weymann, 1998: 14). A. Weymann distinguishes three levels of social change: the macro-, meso- and micro levels. While the macro level covers the entire area of social and cultural structure or society, the meso level refers to groups, institutions and communities that represent a part of that society, and the micro level refers to individuals and their activities (Weymann, 1998). This classification can be easily transferred to prehistory. Anthony Giddens’ definition of change refers to material and persons (object) or a community (situation) within a certain time frame (Giddens, 1995). The time factor is important in his definition of social change, because from a prehistoric point of view, social development is subject to permanent change. Contrary to Giddens (1995) and Weymann (1998), W. Jäger argues that the principles of change are not universal, but epoch-specific (Jäger, 2005: 161). It is therefore necessary to define the period under consideration, and at the same time to include a larger time frame, allowing comparisons of different scales of societal change and transformation. Often such change is seen as reaction of social systems to disturbances or crises, whether caused internally or externally. Such reactions can be very different. While a crisis can be overcome or, alternatively, lead to collapse, a transformation is mostly a slow transition, after which something completely new comes into existence. In political science, the term transformation is regarded as a generic term for changes that include system change or systemic change (Merkel, 2010: 66). According to J. Tainter, a collapse, in contrast, can trigger among other things a decrease in expansion, a decline in population, a simpler social structure, less social differentiation, a loss of specialisation or a decrease in centralization (Tainter, 1988: 193).
In archaeology, commonly qualitative change in material culture is used to define cultural change (e.g. the transition from Tumulus Culture to Urnfield Culture). However, social change might also be expressed by quantitative changes in the material culture (Müller and Kneisel, 2010: 776; Shennan, 2000), for example, the number of grave goods per grave or the emergence of urn graves. Besides social practices, however, economic and demographic changes also have to be considered. Quantitative changes might relate to varying productivity, access to resources and/or economic surplus of societies. At the same time, an increasing population number might result in an increase in the number of archaeological artefacts without changing individuals’ behaviour (Shennan, 2000). Only the sum of observations and the intensity of change at the individual levels allow an assessment of change within a society. However, the deposition of archaeological finds does not take place with the same regularity, and it is influenced by a number of different source filters or biases (Herzog and Mischka, 2010). Therefore, quantitative analyses of archaeological finds can be used as proxies for social change if potential biases and drivers are considered and discussed. Nevertheless, independent data are essential for comparison with archaeological data. Palynological (Dörfler et al., 2012) data or geoarchaeological investigations (Dreibrodt et al., 2010) allow the examination of larger areas, even though Bronze Age settlements in the north are scarce.
In the following, we will use cultural inventories to observe the intensity of change at different levels in the Nordic Bronze Age of Schleswig-Holstein for an assessment of change within this society. For this purpose, it is important to define the levels and to assess their significance with regard to change. We aim at comparing quantitative and qualitative changes in the archaeological record to identify and characterise such phases of intense sociocultural change. Besides the analyses of the material culture regarding J. Tainter’s triggers for collapse, we can record human pressure on the landscape by independent proxies from palaeoenvironmental datasets. In order to evaluate potential biases and to estimate the relation between change and demography, we compare the archaeological results with evidence for population dynamics as discussed by Feeser et al. (in press).
Period of research: Bronze Age transformation
In case of the European Bronze Age, generally two major cultural transitions are discussed, characterised by distinct cultural changes throughout Central Europe. The first one occurs with the disappearance of the first massive, metal-working Únětice groups around 1600/1500 BC (Figure 1. map). This end is contemporaneous with the widespread occurrence of rich burials with bronze objects in northern Europe, that is, the area of the Nordic Bronze Age, and probably is related to changes in southern exchange networks (Kneisel, 2013a; Kneisel et al., 2012; Kristiansen and Larsson, 2005; Vandkilde, 2017: 164) with the start of the Middle Bronze Age around 1550/1500 BC. The second is the transition to practicing cremation burials, including the adoption of the urn grave custom and the appearance of large urn fields in the landscape, around 1300/1200 BC in central Europe which defines the beginning of the Late Bronze Age (Falkenstein, 2011; Ruppenstein and Lochner, 2013). In the area of the Nordic Bronze Age, similar changes in burial practices are apparent around 1100 BC and mark the beginning of the Younger Bronze Age. Instead of new urn fields, the same small cemetery area as in previous periods was used until the beginning of the Iron Age.
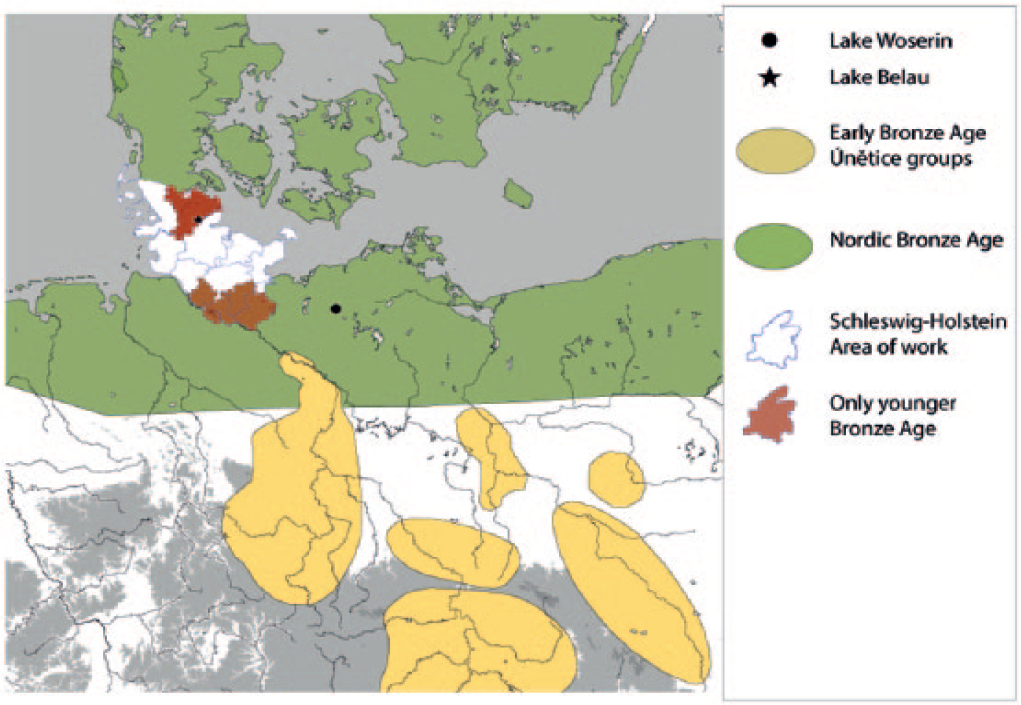
Overview of the mentioned cultural units and the lake Belau.
Area of research: Northern Germany
In this article, we focus on the Bronze Age in Schleswig-Holstein (1750–500 BC), which is subdivided into Periods I through VI or an Older (1750–1100 BC) and a Younger Bronze Age (1100–500 BC). The Older Bronze Age begins in the north not before 1750 BC, more probably not until 1700 BC (Ethelberg, 2000: 143; Vandkilde, 1996: 174), although there is an overlap period with the Sögel-Wohlde horizon that starts earlier. In order to create a uniform transition from the Late Neolithic data, 1750 BC was chosen as the beginning of the Older Bronze Age for the calculation (see Brozio et al., in press).
Schleswig-Holstein lies at the northern end of a transect used to investigate the transformation processes during the Bronze Age from north to eastern Central Europe within the framework of the CRC 1266. The research area is located on the periphery of three macroscale phenomena: the Nordic Bronze Age and the Early Bronze Age Únětice groups in the north and the emergence of the Urnfield circles of the Late Bronze Age in the south. Because of the peripheral location of Schleswig-Holstein, early metal forms from 2100 BC are missing, unlike in southeastern Scandinavia (Vandkilde, 2017). However, the influences of the Urnfield circle can be grasped on a local level, especially in the southern part of the Schleswig-Holstein. The investigations in Schleswig-Holstein are the first of the intended investigations along this transect from Northern Europe to Lesser Poland comparing archaeological and environmental data.
Materials and methods
Data sources
The data set for the Older Bronze Age of Schleswig-Holstein was taken from books authored by Aner, Kersten, and Willroth (Aner and Kersten, 1979, 1991; Aner et al., 2011; Kersten and Willroth, 1993; Kersten et al., 2005). While we have completed the data collection for hoards, sickles and the number of graves for Schleswig-Holstein as a whole, for the other artefact groups, we have as yet inventoried the finds collections of 8 out of 12 districts (Nordfriesland, Dithmarschen, Rendsburg-Eckernförde, Plön, Segeberg, Ostholstein, Steinburg, Lübeck). Although data from missing districts will increase the number of finds, we do not anticipate a major temporal shift, as these districts are located in the same general area as the already surveyed districts of Segeberg and Rendsburg-Eckernförde. For the Younger Bronze Age, all finds from Schleswig-Holstein have been inventoried, based on the catalogue compiled by Jens-Peter Schmidt (1993).
The settlement structure of Bronze Age Schleswig-Holstein is very difficult to grasp. For the Older Bronze Age, 13 sites are known, with a total of 10 securely dated houses (Donat, 2018; Effenberger, 2018; Meier, 2013b). Schmidt (1993: 18) listed 66 sites for the Younger Bronze Age. This number has undoubtedly doubled in recent years, thanks to systematic investigations. Typical for the Younger Bronze Age settlements are storage pits or pit areas. House structures are even rarer than they are for the Older Bronze Age. Only eight Younger Bronze Age settlements have secure radiocarbon dates (Effenberger, 2018; Kneisel et al., 2013; Meier, 2013a). Since both settlement features and houses with multiple dates are represented in the sum calibration, this curve is of little help. Well-studied sites with several houses, such as Brekendorf or Todesfelde, lead to an increase in the number of settlements, but the radiocarbon database remains too small to draw any conclusions yet. For a better understanding of the settlements in Schleswig-Holstein, it is necessary to look to neighbouring areas. Therefore, the sum calibration of settlement sites from Mecklenburg-Western Pomerania was used for comparison. Based on 19 sites, a much more even distribution is visible in the curve.
Only a few 14C dates are available for the sum calibration of inhumation (11) and cremation burials (3) in Schleswig-Holstein. Data from Mecklenburg-Western Pomerania were added to extend the database. As it has only recently become possible to date burnt bone (Olsen et al., 2011), from this supplementary region, only one date is available for cremations; for inhumations, seven dates could be used (Kneisel et al., 2013, including unpublished data).
As mentioned above, hoards from all parts of Schleswig-Holstein have been inventoried. For a better understanding of the amount of bronze buried in these deposits, and hence the value of the hoards over the entire period, the number of sites would have to be compared with the weight of the metal. However, since weight data are not given consistently, we had to abandon this line of enquiry. The same applies to gold, iron and imported (bronze) objects, which are represented in the graphics by the number of pieces, rather than weight. Note that the axes, swords and daggers were recorded from the beginning of the Early Bronze Age, while the sickles include those from the Late Neolithic and combine those made of flint and those made of bronze although bronze sickles do not occur before Period II and flint sickles disappear with the start of the Bronze Age so far they are datable (J-P Brozio, personal communication, 2018; Sommerfeld, 1994).
For the cooking pits, 30 14C dates from several sites in northern Europe are available (Kneisel et al., 2013; Meier, 2013a; Schmidt, 2012). Due to the small amount of data from Schleswig-Holstein (two sites), those from Mecklenburg-Western Pomerania (one site) were also included, counting only alignments and structures outside settlements. Numerous other sites are known, but not yet published.
Data calculation – Aoristic
Different data qualities are available for the analysis. A distinction is made between qualitative and quantitative data. The qualitative data represent the initial and final occurrence of cultural phenomena, artefact groups or the use of new resources. A representation of qualitative data always remains rather imprecise, since the beginning of an artefact type does not necessarily include its widespread distribution (see Figure 5). Quantitative data include archaeologically dated objects as well as 14C data, which is given as a sum calibration. Since there are very few sites, in most cases, it was decided not to combine individual settlements or sites. Furthermore, while the number of artefacts and burials dated per period from the above-mentioned regions of Schleswig-Holstein is available, the dating accuracy is variable. Each period of the Nordic Bronze Age (Periods II–VI) encompasses around 200 years (1500–500 BC) with Period I extending slightly longer, 250 years (1750–1500 BC). If the artefact classification comprises several periods, the time span is correspondingly longer than 200 years. The authors are aware that individual periods begin or end earlier than the dates given for the 250 or 200 year time slots here, but this uncertainty is accepted in favour of a better handling of the data, since in large parts of this period even the 14C data are rarely more accurate than ±100 years (Hornstrup et al., 2012; Kneisel, 2013c).
‘One way to engage more effectively with temporal uncertainty is for us to make the best of all our available temporal information, however fuzzy’ (Bevan et al., 2013). To calculate the frequencies for a diachronic graph, the ‘aoristic’ statistical method was used. With the help of the aoristic method, inaccurately dated artefacts or features can be quantified and converted into relative frequency curves (Bevan et al., 2013; Mischka, 2004 (with detailed description of the method); Ratcliffe 2000: 671, Figure 1). The aoristic allows artefacts from different dated time periods such as ‘Bronze Age’, ‘Older Bronze Age’, ‘Period I–II’, ‘Period Ib’ and 14C dates to be represented together in one curve. The data were divided, using the aoristic method, into 100-year slots. In this way, coarser dating, such as the Late Bronze Age (1100–500 BC, n/6), can be compared more precisely with specific periods like early Period IV (1100–1000 BC, n/1). The data are then summed to create a frequency curve. For the following interpretation, it must therefore be taken into account that the archaeological data include different time spans and dating accuracies. The data calculation for the palaeoenvironmental curve is described in the article by Feeser et al. (in press). In a second step, the synchronicity of different individual curves of material culture or curves which indicate a strong influence on the sociocultural framework are marked in similar way to the boom and bust of the palynological data (Feeser et al., in press) although the analysis was carried out independently! These phases defined by strong changes in the respective cures are marked in the figures with bars.
Selection of archaeological proxies
The material culture of the studied time periods consists of a very large number of artefacts, varying in types and frequency between the Older and Younger Bronze Age. The material culture also operates at different levels. Ideally, artefact groups were chosen that were in use during the entire Bronze Age. The material for study was selected at three levels – micro, meso and macro – and can be assigned to four categories – settlement structure, exchange, technology and ideology. Funeral rituals represent the micro level and are a part of the ideology category; although the funeral rite often follows a common practice, it affects singular individuals within the society. Artefact groups reflecting technological change, such as weapons (daggers, swords) or tools (sickles, axes), and hoard deposition practices make up the meso level of analysis and are related to the categories technology and ideology. These artefacts and depositions are connected with special social groups inside a society. Finally, the emergence of certain new raw materials (bronze, iron) and changes in settlement structure (house size, frequency) were analysed across the whole Nordic Circle and thus represent the macro level. Unfortunately, too little data were available to also include the category subsistence on the basis of artefacts; this material can only be considered on a qualitative scale. In this article, quantitative data are defined by the amount of finds and sum calibration of radiocarbon data. In this article, quantitative data refer to the number of finds and the sum calibration of radiocarbon data. Since often only few radiocarbon dates are available for sum calibration, corresponding data from the neighbouring region of Mecklenburg-Western Pomerania were added. The connection between data categories and identifying change are worth a brief discussion.
Settlement
Profound changes in settlement structure reflect a change in social structure. The conglomerations or dispersions of single farmsteads, or changes in house construction and house size, are associated with different social concepts and are therefore well suited for an analysis of social change through the category settlement (e.g. Artursson, 2009: 239; Ethelberg, 2000; Kristiansen, 2006).
Exchange
The use of non-local resources shows a link to supra-regional exchange networks. Foreign types and imported finds can be regarded as gradients for exchange relationships and networks, depending on how far away the actual place of production was. The use of the new resource metal during the Bronze Age not only points to exchange but at the same time reflects fundamental social changes (Müller, 2013). In that sense, only the local production of bronze or iron could be seen as a technological change (see below). Since most iron finds are imported, they are used as proxy for exchange. Bronze and the import of copper and tin are also signs of exchange, but since not all bronze artefacts are available and weight data are largely missing, bronze is not used in this article.
Technology
The use of new tools for harvesting (sickles) or construction (axes) and the use of new weapons are examples of technological changes (Falkenstein, 2009: 163; Jockenhövel, 1997: 195–196). In part, the new artefacts appear along with the new material bronze. Bronze sickles and the bifacial retouched flint sickles represent new types of a traditional harvesting tool, different just in shape and material. Swords and daggers are completely new forms (e.g. Arnoldussen and Steegstra, 2016; Bunnefeld, 2012). Local bronze production on a larger scale is proven from period IV onwards (Jantzen, 2008).
Ideology
Different features that belong to the ritual sphere of a community are grouped together for the category of ideology. The first of these are burial rites, whose changed rituals can prove societal change (Feeser and Furholt, 2014; Kristiansen, 2006). For Schleswig-Holstein, it is possible to record the total number of barrows, primary and secondary burials in mounds and flat graves. The urn graves were not recorded individually, but are included in the total number of burials. The Bronze Age hoards are also placed in the ritual sphere. These hoards have been variously interpreted as groups of items that had been purposefully hidden and not retrieved or as soothing ‘gifts to the gods’ in times of crisis (Hänsel and Hänsel, 1997; Hansen, 2002). Cooking pits are also connected with the ritual sphere since they occur not only in settlements but also frequently in linear alignments in the vicinity of burial mounds (May, 2009; Meier, 2013a; Schmidt, 2005). Their appearance marks a change in ritual and societal practice.
In previous studies, single proxies were usually investigated for their demographic dynamics or two proxies were compared with each other, mostly climate and population (Armit et al., 2014; Capuzzo et al., 2018; Lillios et al., 2016; Meller et al., 2015). A common approach in recent years has been the analysis of 14C data and sum calibrations (e.g. Hinz et al., 2012; critical: Meadows and Contreras, 2014; Shennan, 2013). All these studies were able to show changes, but the investigations are largely limited to the Neolithic. As argued by W. Jäger, the principles of change are not universal, but specific to epochs (Jäger, 2005). With the rise of metal, completely new structures emerged which led to the development of elites in the Early Bronze Age in Central Europe and in the Older Bronze Age in the north (Kristiansen and Larsson, 2005; Müller, 2012; Müller and Czebreszuk, 2010; Willroth, 1999), a development that seems to be reversed with the introduction of the urn grave custom. Within the Bronze Age, the decisive changes occurred on various levels, such as the introduction of the new material bronze at the beginning of the Bronze Age, the change in burial customs at the transition to the Late Bronze Age or the emergence of iron and increased foreign goods towards the end of the Bronze Age. To show … ‘consistent pattern of fluctuation in human impact through time, which ties in with archaeological evidenced patterns where these are available’ (Shennan, 2000: 831), it is necessary to compare not only the micro-, meso- and macro level but also different variables on one level. Since, as Shennan already remarked (Shennan, 2000), only the cultural inventory of past epochs is available to us, it seems reasonable to the authors to combine different aspects of the micro-, meso- and macro level, which represent either the whole society or only parts of it. Not every individual, for example, receives a burial just as not everyone has an axe. The archaeological material is subject to constant change, which is the basis of our chronological periodization. However, if different aspects within a society change at the same time, statements about the degree of change became possible after the definition of A. Weymann (1998).
Results
Cultural change is reflected in material culture at different micro-, meso- and macro levels. A comparison of these levels with regard to settlements, exchange, technology and ideology quantitatively (Figures 2–4) and qualitatively (Figure 5) resulted in different peaks and troughs. After a comparison of the different biases, these fluctuations can be interpreted as cultural expansion and regression phases (see in the following). Based on time slices, the following results of the changes can be seen.
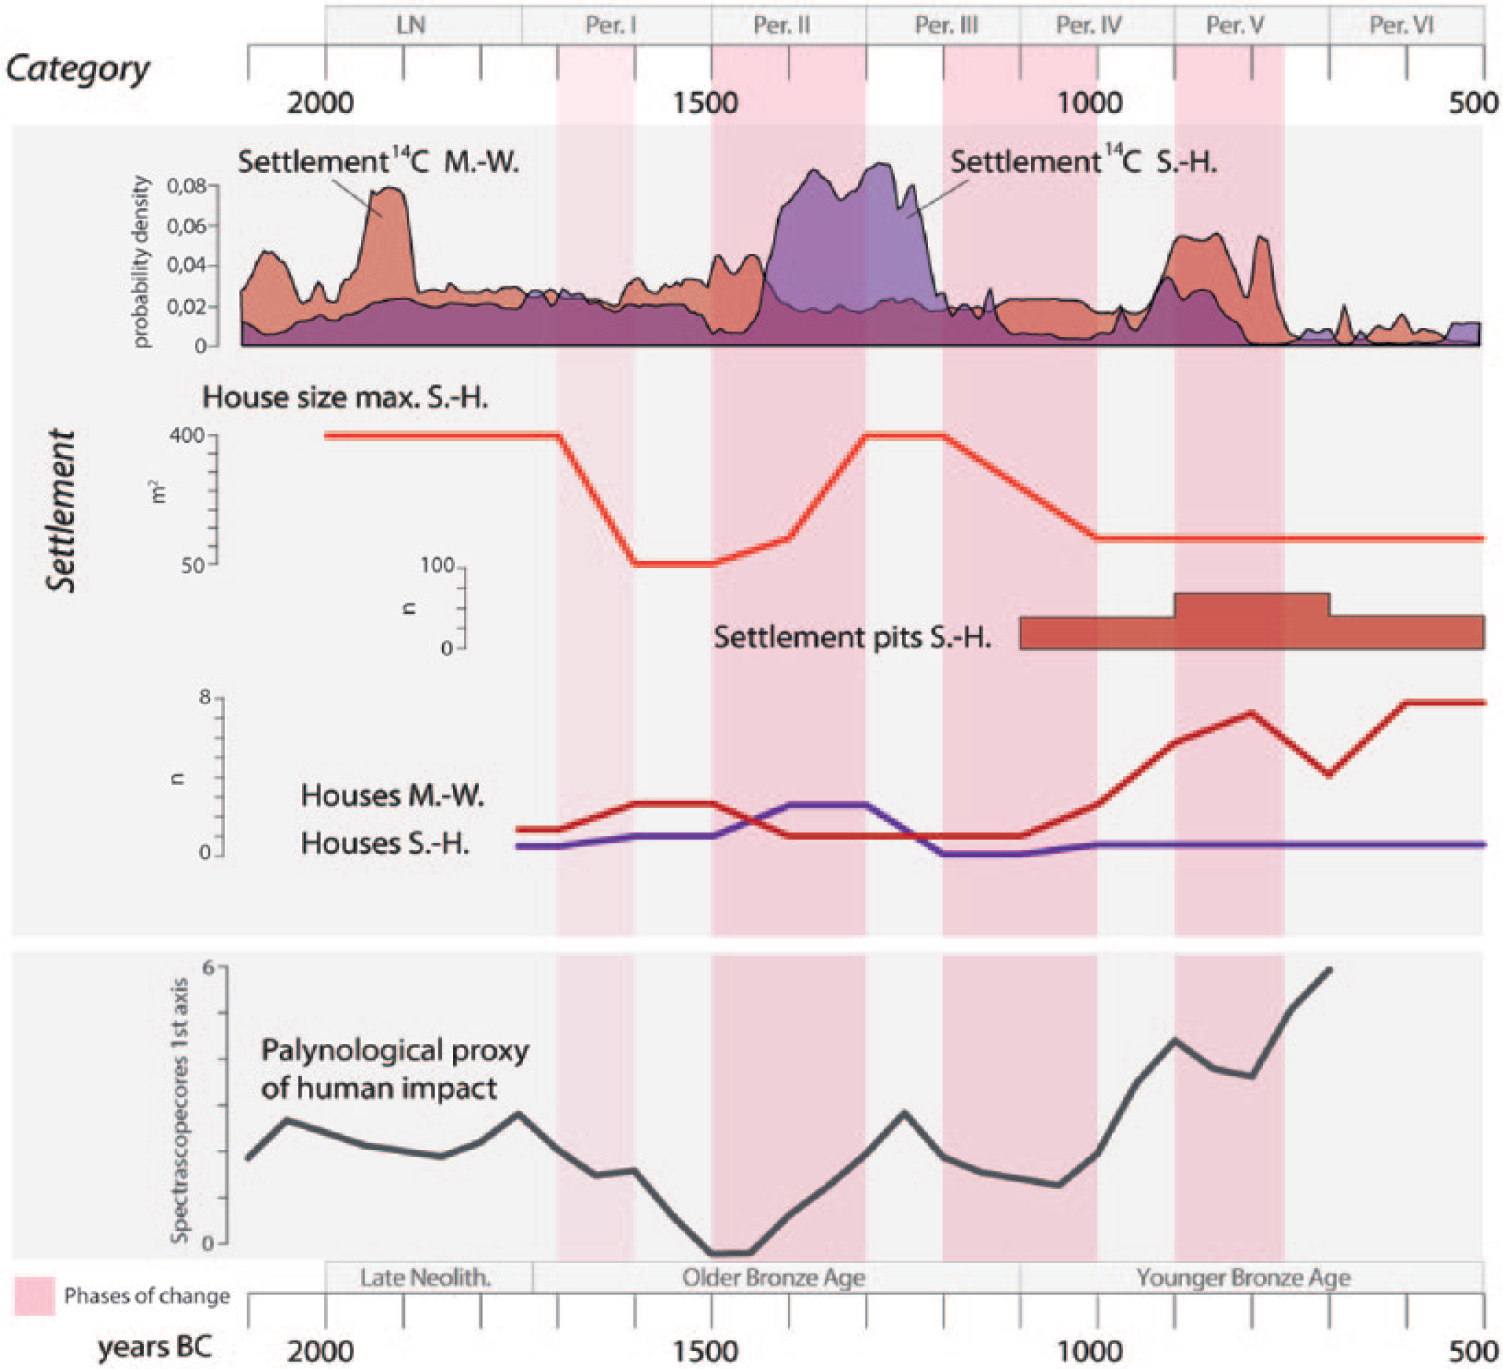
Quantitative data from settlements in Schleswig-Holstein and Mecklenburg-Western Pomerania.
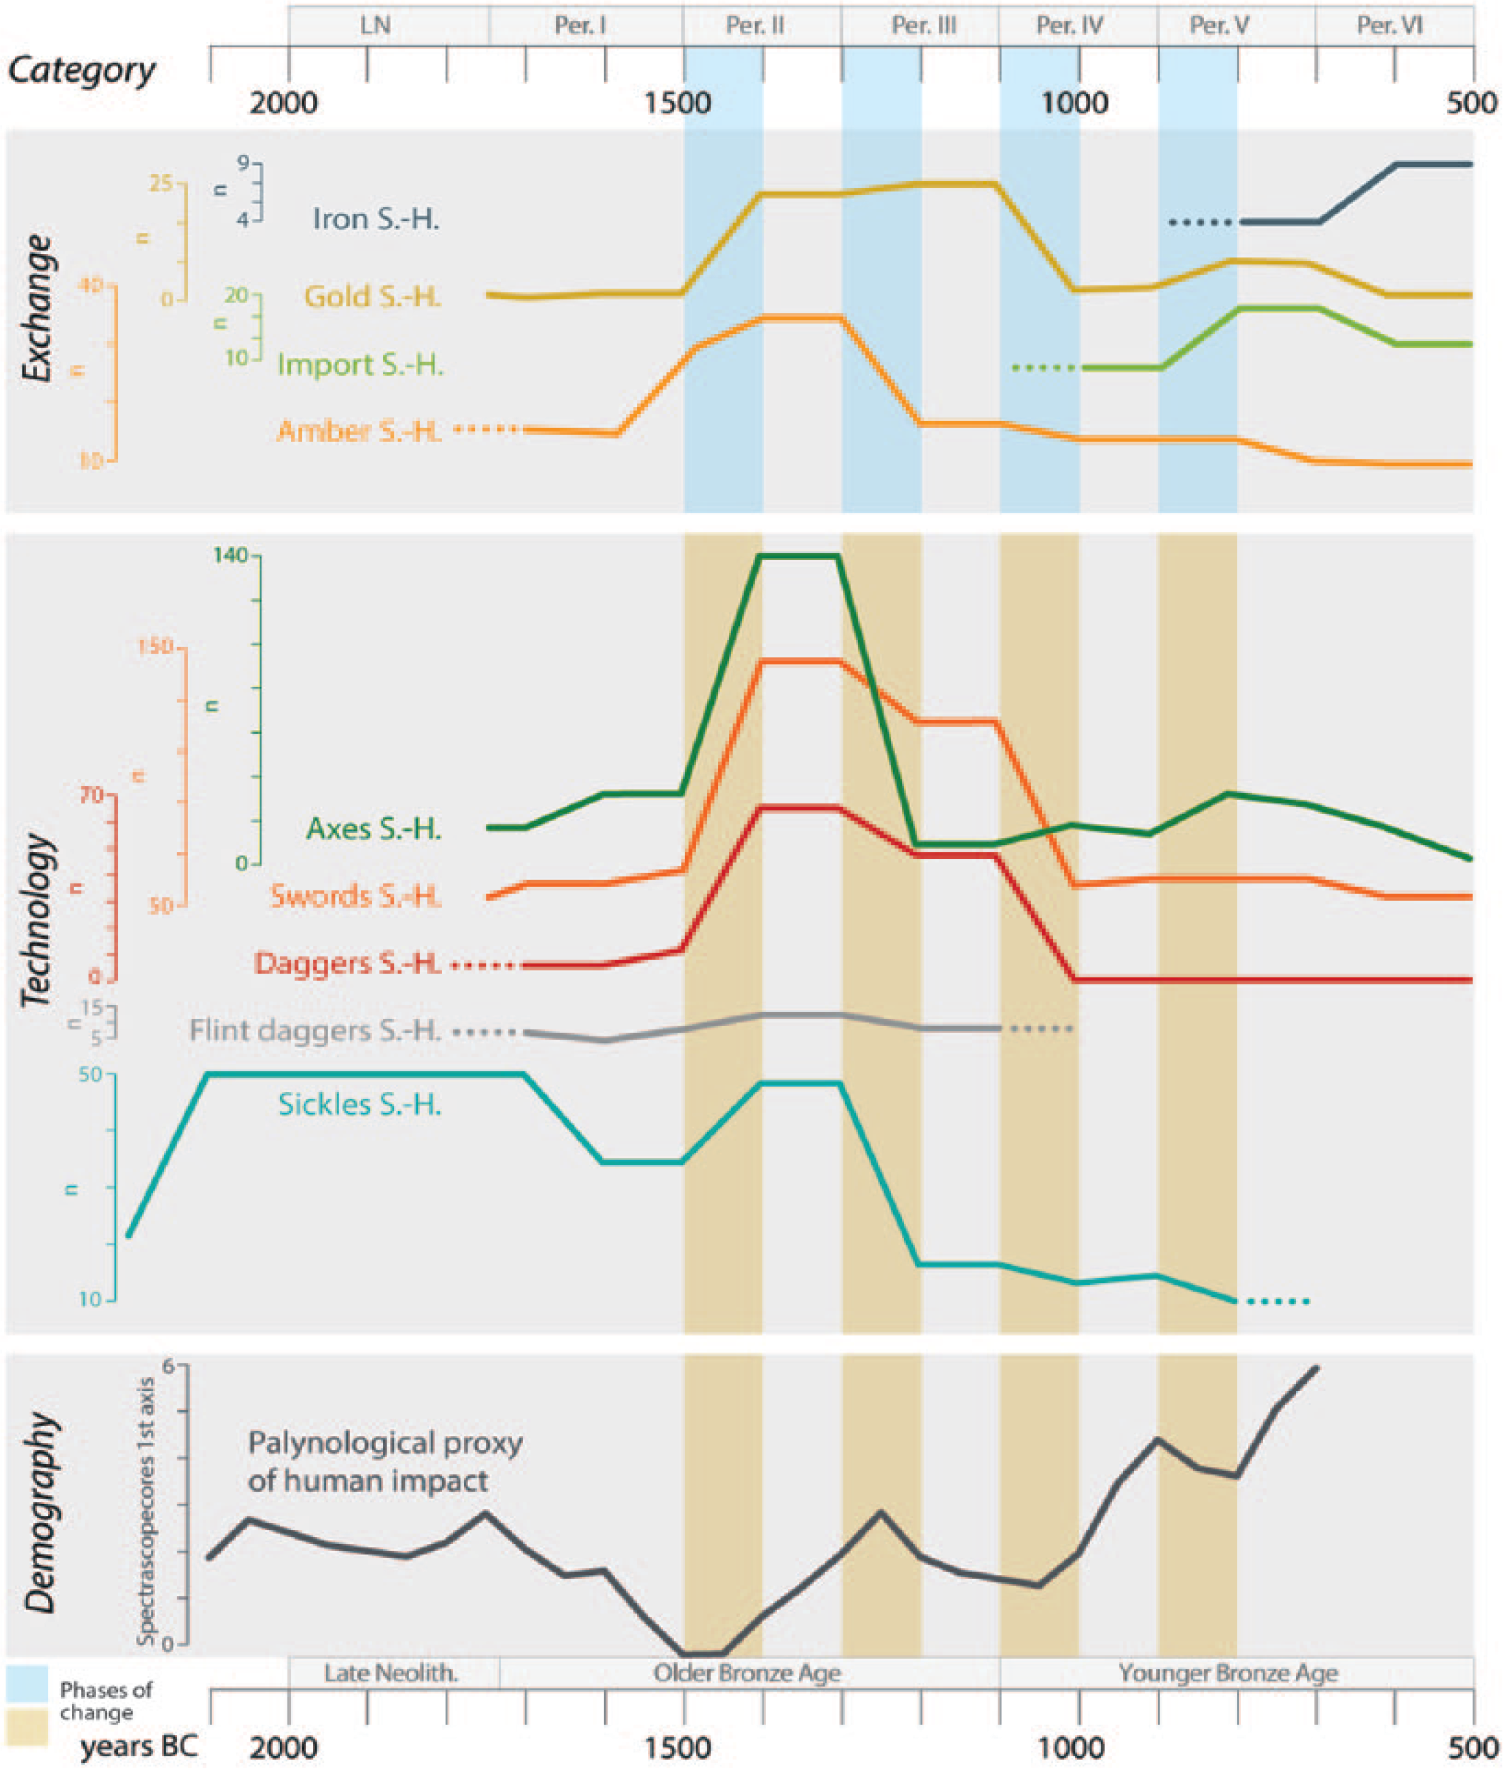
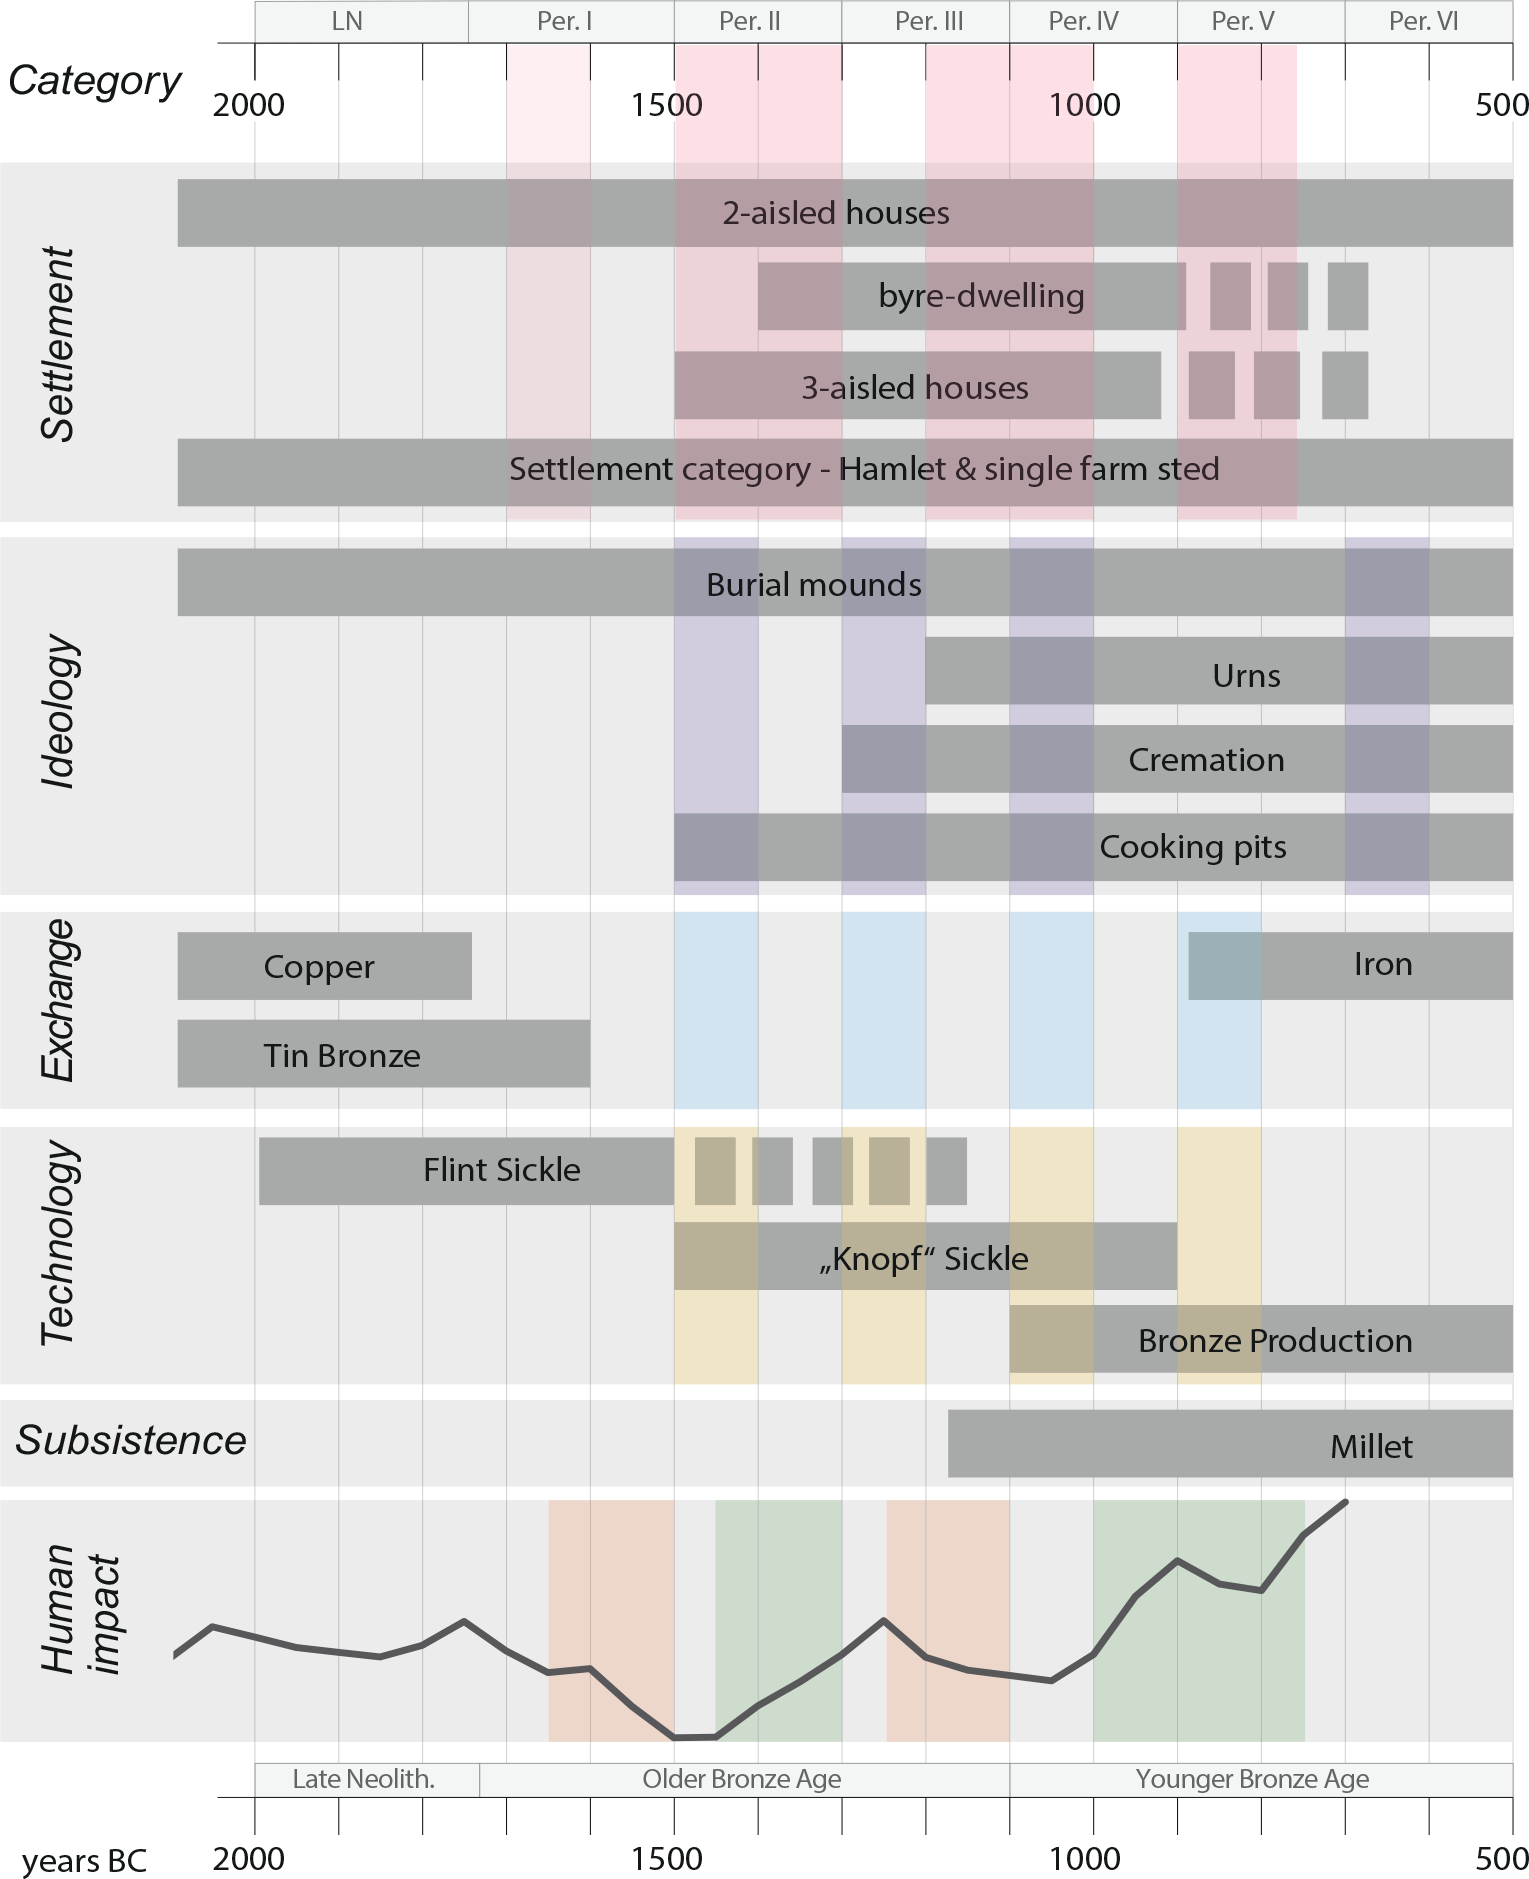
Quantitative data from material culture in Schleswig-Holstein.
Quantitative data from material culture in Schleswig-Holstein and Mecklenburg-Western Pomerania.
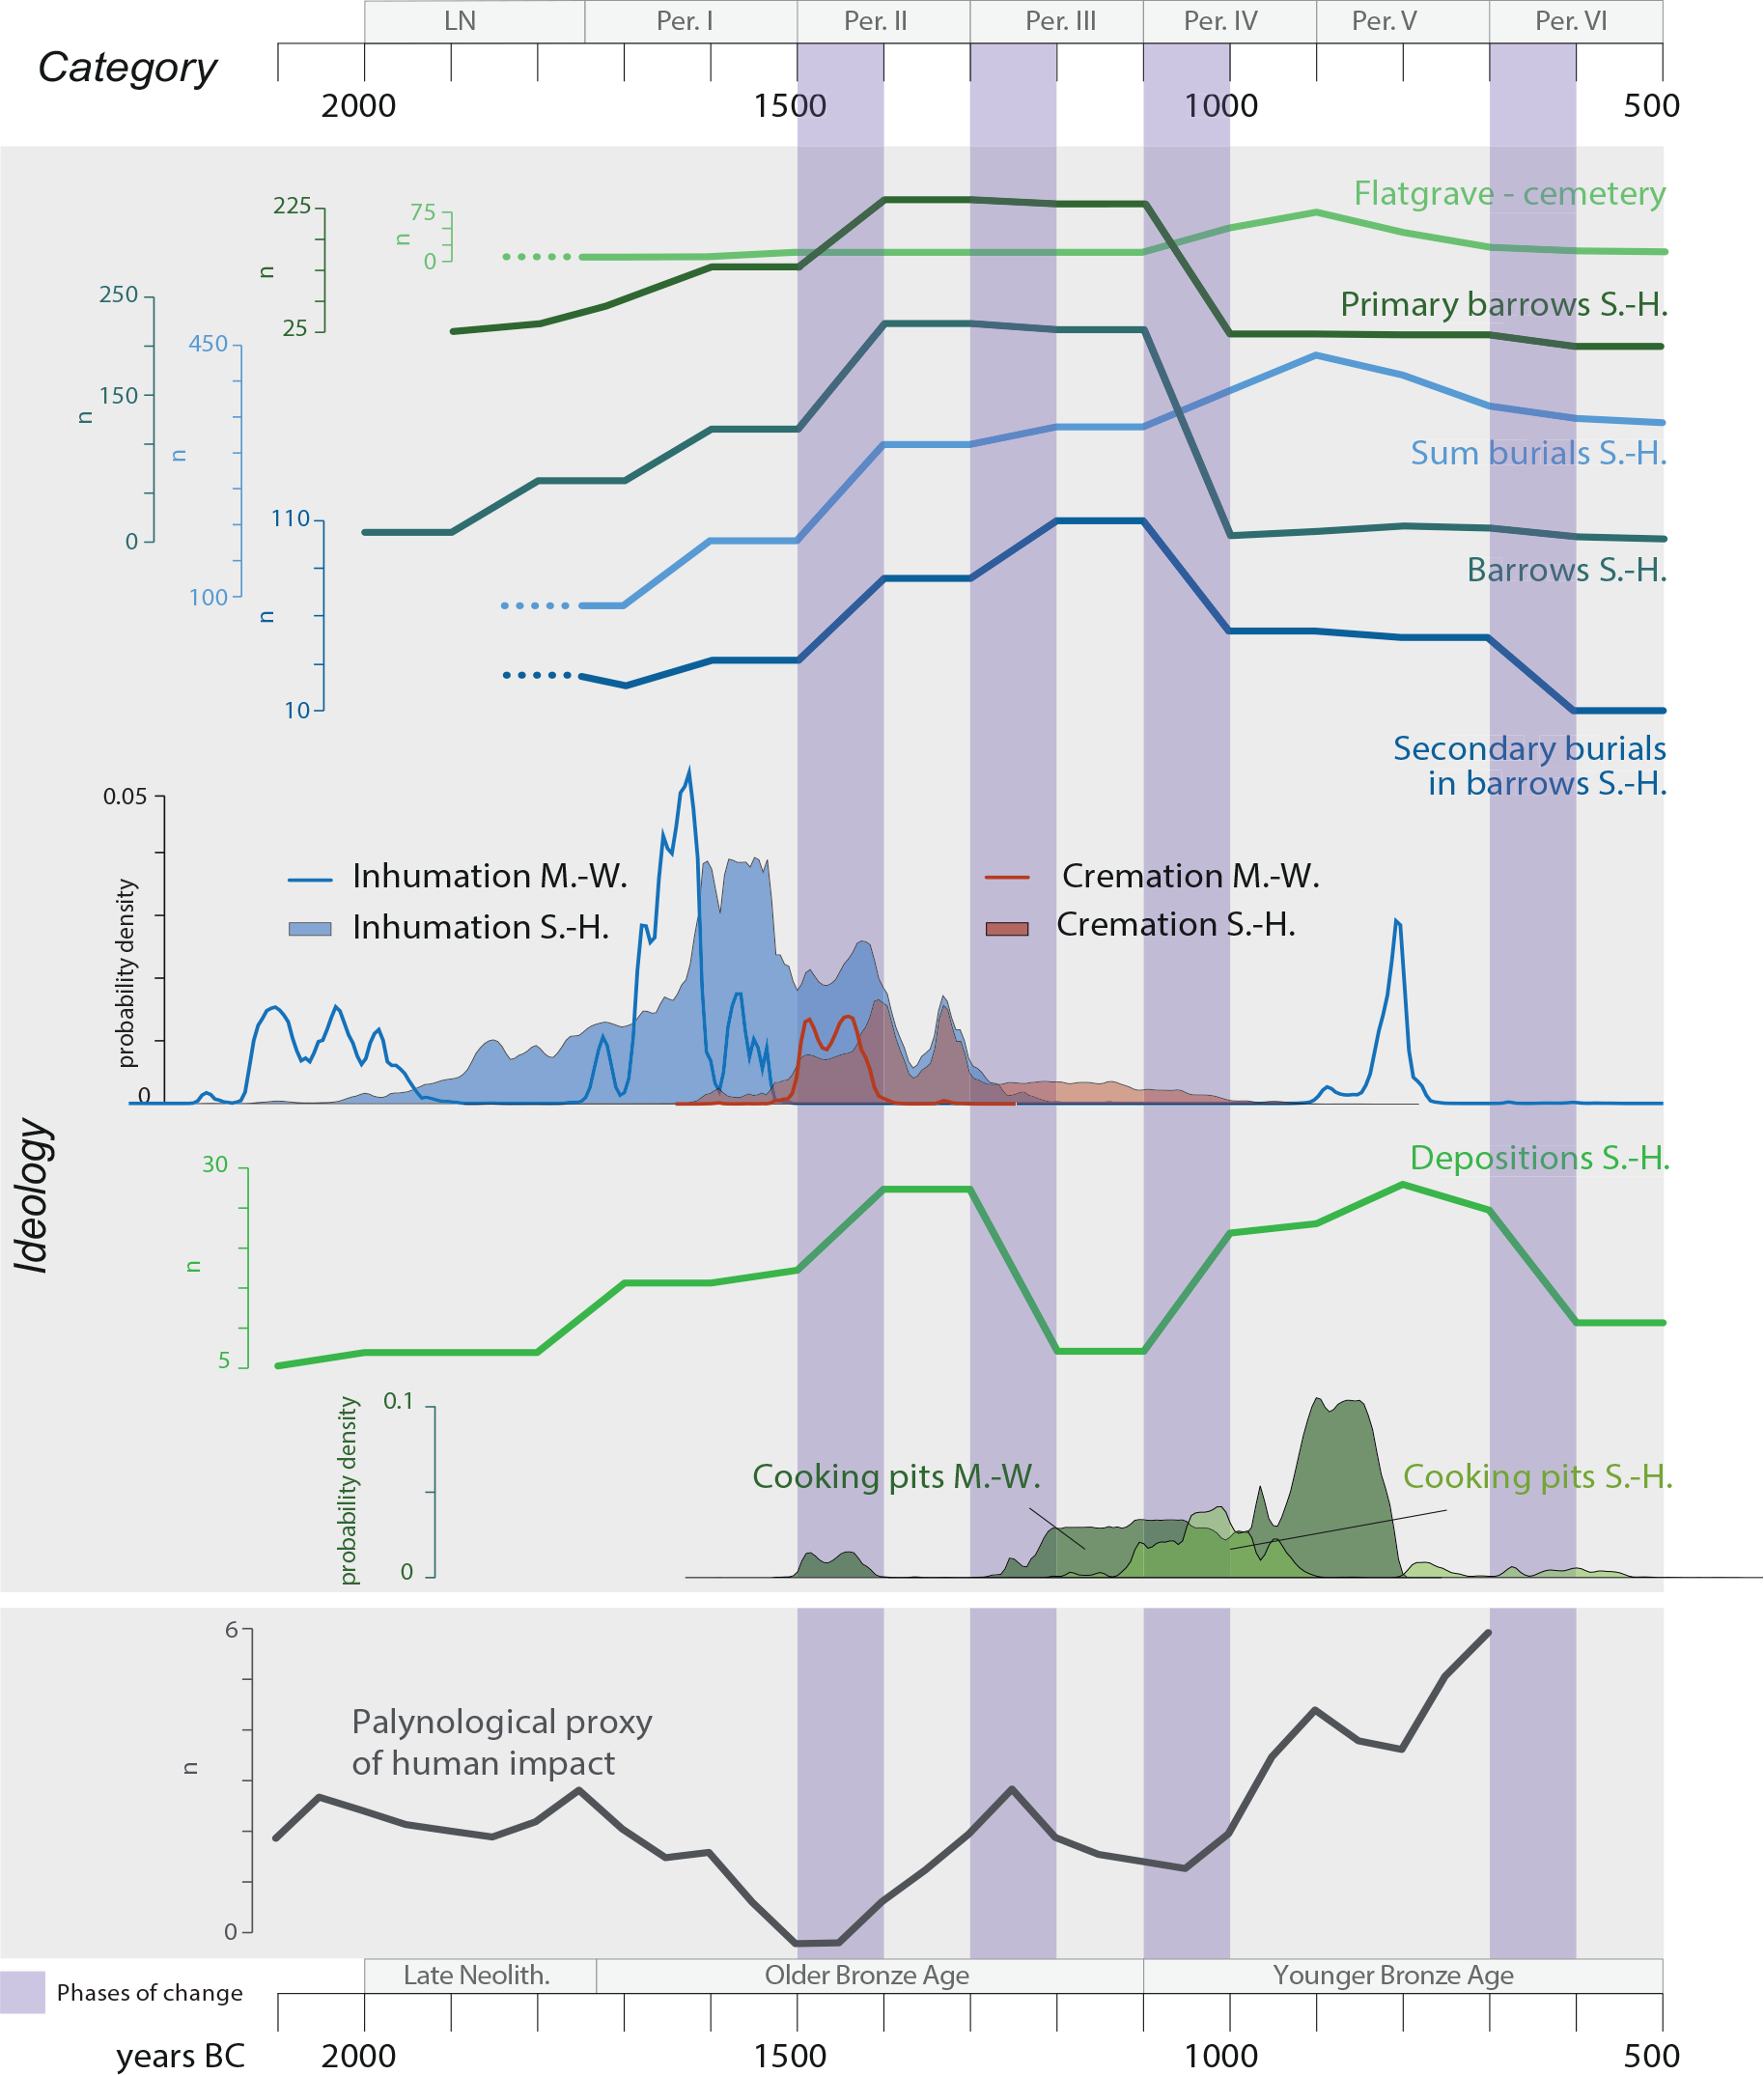
Qualitative data from material culture and demography in Schleswig-Holstein and Mecklenburg-Western Pomerania.
The Bronze Age record starts in Period I (1750 BC). During this period in Mecklenburg-Western Pomerania, the maximum house size decreases sharply, while the number of houses rise (Figure 2). The number of (flint) sickles also decreases and bronze objects are still scarce (Figure 3). The record of hoard depositions has increased shortly before and stays at a medium level during Period I (Figure 4). Regarding the burial rites, we see a clear increase in numbers of barrows erected, and the absolute number of inhumations reaches a maximum in the sum-calibration curve of dated graves. At the end of Period I, the practice of cremation starts in our research area according the sum-calibration curve. Interestingly, the indicators for human pressure on the landscape start to decrease distinctly during Period I around 1600 BCE.
With the start of Period II (1500 BC), strong changes occur. In the sum calibration, the number of settlements increases steeply after a short minimum. During this phase in Schleswig-Holstein, the maximum house size increases again with a slight increase in house numbers. The strongest change can be seen in the records of technology: axes, swords, daggers and sickles. All these bronze objects reach their maximum number over the course of Period II. At the same time, according to the few 14C dates, the prevalence of inhumation burials recedes and cremations reach their maximum. The number of barrows increases strongly and also the number of hoard depositions reach their highest level. From the pollen record, this period seems to be a continuous phase of expansion with clear indication for ongoing landscape opening and increasing human pressure. Maxima in the curves of gold and amber speak to a high degree of exchange and, together with bronze objects, for a need of prestige display.
Shortly after the transition to Period III (after 1300 BC), the trend of increasing human pressure on the landscape is reversed. This is accompanied by a strong decrease in both number of houses and sum calibration of dated houses as well as the house size after 1200 BC. Many curves show a clear decrease during Period III like the number of bronze objects (e.g. axes, sickles), amber objects and the number of hoard depositions. The practice of inhumation completely disappears. New barrows were still built, but secondary burials in mounds became more usual. The cremated bodies were buried in coffins. With the beginning of Period III, cooking pits become common, also indicating an ideological change. Thus, the Older Bronze Age is not a monomorphic phase, but one of very different cultural expressions and settlement intensities providing hints to social and cultural changes.
With the transition to the Younger Bronze Age und the start of Period IV (1100 BC), the trends of Period III end and something new seems to develop. In the pollen records, a strong increase in human pressure is recorded around 1050 BCE. Millet as a new crop plant appears and allows for new aspects of subsistence (Figure 5). The use of cooking pits, common in the first half of Period IV, decreases sharply according to the few dated sites. In Mecklenburg-Western Pomerania, there are more houses than before that date to this period, but house size has decreased. Indications for exchange and the availability of bronze objects is weak, but this might also be due to ideological changes as the modification of burial rites effects the chance of detecting bronze objects. The increasing number of deposits may indicate a high availability of bronze that now also is processed locally as well as an increased willingness to or need for offering or a population growth.
In Period V (900–700 BC), just a few changes are visible. Gold and other import objects are found more often and hoard depositions still increase slightly as well as the number of axes. In the environmental record, a short regression or bust phase starts with Period V around 900 BCE for some one hundred years. At the same time in Mecklenburg-Western Pomerania, the number of houses increases in the sum calibration, reaching its maximum. In the second half of Period V, settlement indicators start to decrease. This marks the transition to the Iron Age in Central Europe. Heath, previously a local phenomenon, spread. Little is reflected of this boom in the human impact curve in the archaeological record as the Bronze Age with its specific burial practices come to an end and new practices and objects evolve.
With the beginning of Period VI (700 BC), most curves decrease except that of the number of iron artefacts and houses in Mecklenburg-Western Pomerania. The burials in urn cemeteries continue and weapons are found again. For this period, the palaeoecological record was not analysed. Thus, peaks and troughs in proxies of change from different spheres are visible in the Younger Bronze Age.
Interpretation and discussion
The so far described results of the quantitative and qualitative data analysis need to be discussed and interpreted according to their relevance for societal change and transformations.
Settlement
The data considered for changes in the settlement system include sum calibrations of 14C data from settlements, maximum house size and number of settlement pits from Schleswig-Holstein, as well as the aoristic distribution of Bronze Age houses from Schleswig-Holstein and Mecklenburg-Western Pomerania (Figure 2). At the beginning of Period I, after 1750 BC, house size decreases significantly, before it increases again around 1400 BC. Coinciding with this increase, the 14C sum calibration of the houses from Schleswig-Holstein shows a clear maximum. A comparison with the aoristic house distribution curve shows that the number of known houses does not increase, but, rather, decreases. Thus, the maximum of the 14C data probably reflects the intensive research and dating undertaken by the Academy Mainz project ‘Älterbronzezeitliche Siedlungen in Schleswig-Holstein’ (Effenberger, 2018; Meier, 2013b). The number of Younger Bronze Age houses is largely driven by the greater number of houses in Mecklenburg-Western Pomerania (Schmidt, 2013: 121, Figure 1), but also supported by the peaks of the sum calibration of both areas after 900 BC.
As the dataset is quite small for Schleswig-Holstein, the inclusion of the neighbouring areas of the Nordic region to increase the size of the database assists in the discussion of the produced curves. A compilation of house sizes by Donat (2018) for Denmark, Schleswig-Holstein and Mecklenburg-Western Pomerania (Figures 6 and 7) shows a picture that is similar to our observations. House sizes (mostly of three-aisled houses) increase from about 1500 BC by a factor of two to three, only to fall again sharply in the Younger Bronze Age. In the catalogue compiled by P. Donat, the Late Bronze Age house of Borgdorf-Seedorf is missing, which, according to J.-P. Schmidt, has an inner surface area of more than 370 m2 (Schmidt, 1993: 168 Cat.-No. 491). This would have changed the curve. Recent investigations have shown, however, that the original size of the house was about 150 m2, the remainder being a cultural layer (Veronika Klems, personal communication, 2019). Thus, as suggested by P. Donat, all houses of the Younger Bronze Age decrease in house size.
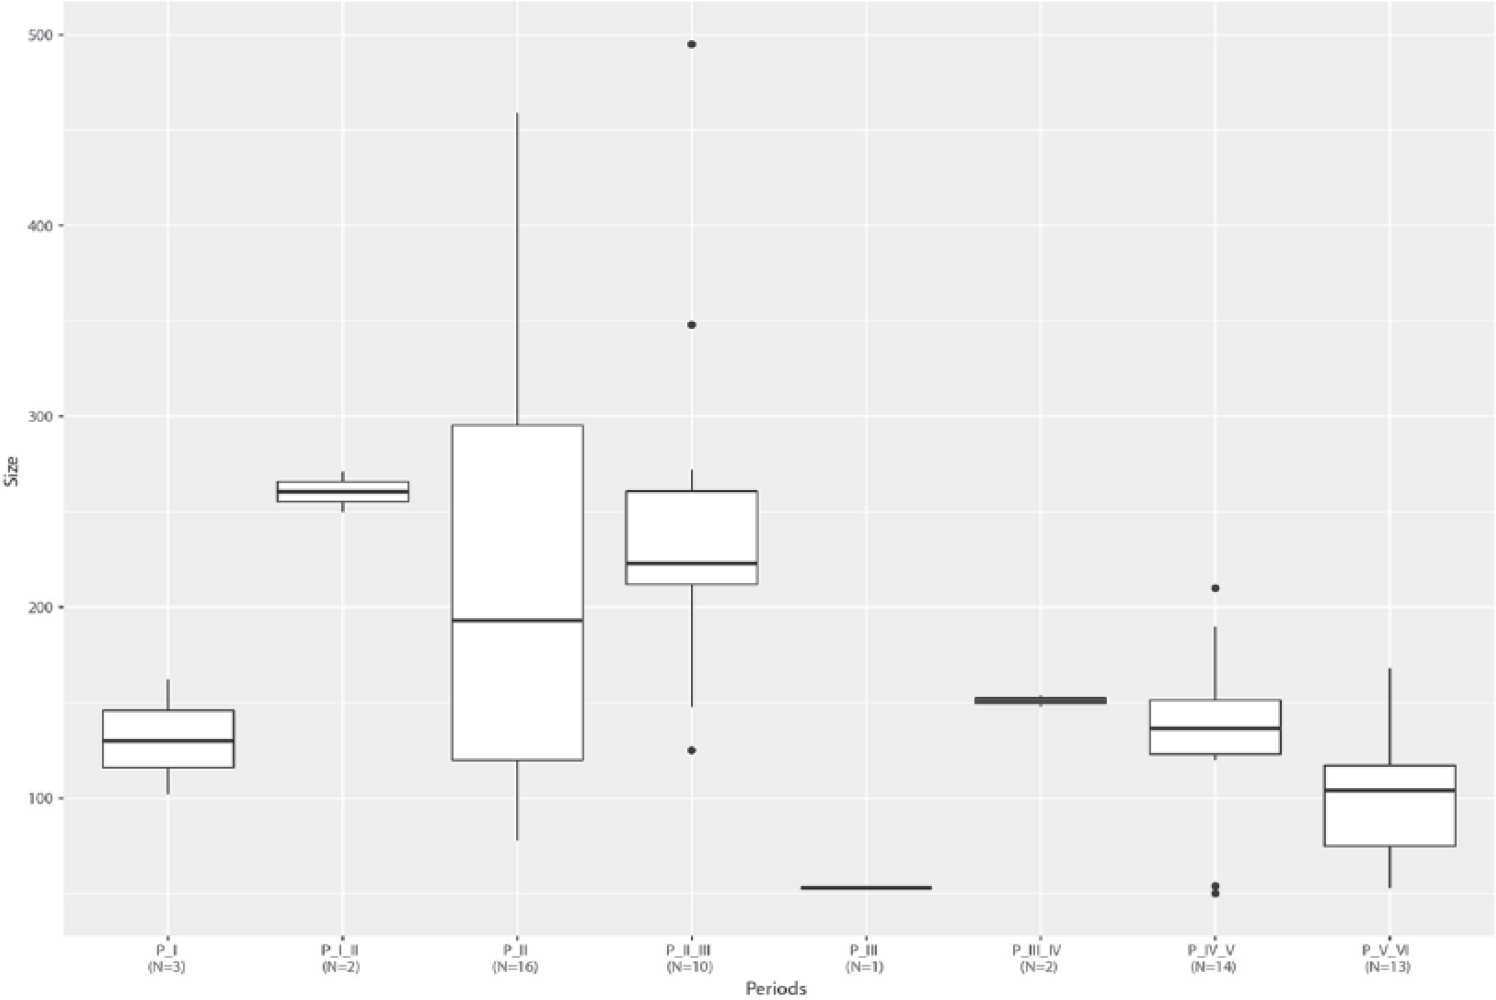
Box plots for the distribution of house sizes (sqm) during the Bronze Age.
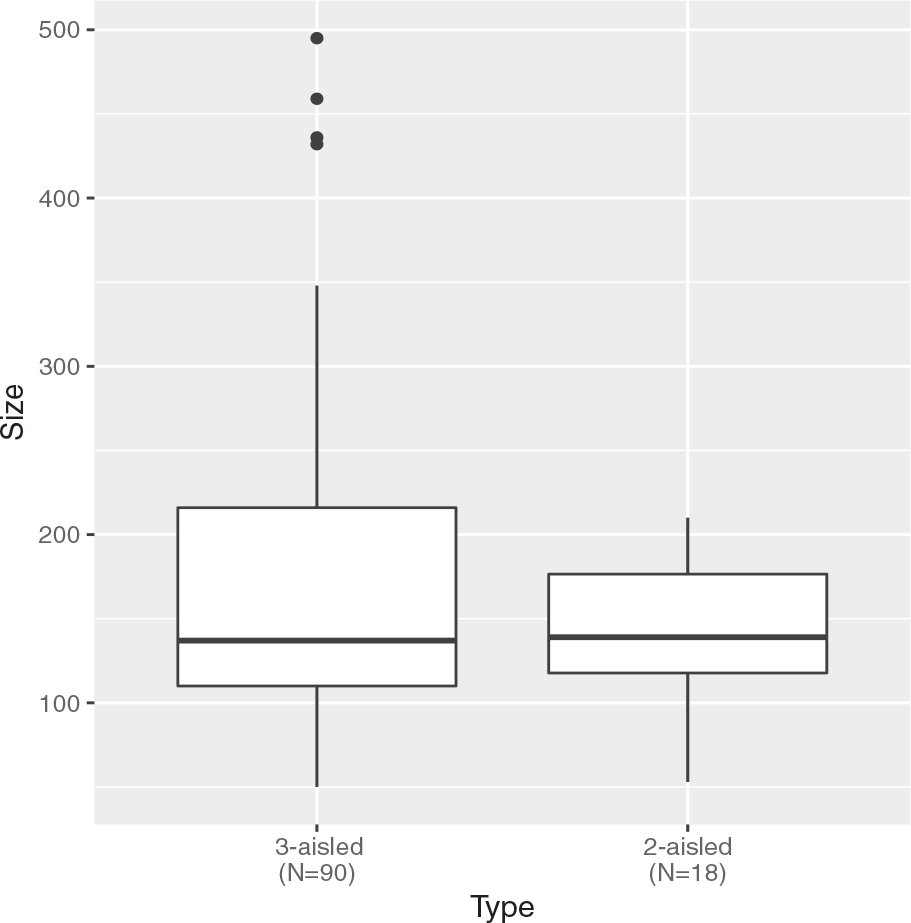
Box plots for the distribution of house sizes (sqm) according to house construction.
For southern Scandinavia, including Sweden, Kristian Kristiansen has created a model concerning house evolution from the Late Neolithic through the Bronze Age (Kristiansen, 2006: 192). Large houses emerge from ca. 2100 BC onwards and shrink again around 1300 BC. The increase in house size coincides with the development of the three-aisled house and the byre dwelling in Schleswig-Holstein. In contrast, the three-aisled house construction in Mecklenburg-Western Pomerania remains an exception throughout the Bronze Age (Schmidt, 2013: 121, Figure 1). In the north, early dates for three-aisled houses are available from Højgård, southern Jutland and Norway for Period I of the Bronze Age and for the Late Neolithic II (Bech and Rasmussen, 2018: 35, Figure 2.7). The enlargement of the interior of houses from 150 m2 at the beginning of the Older Bronze Age of Northern Europe to almost 500 m2 in Period II/III (e.g. Højgård XXXI or Brdr. Gram IV; Ethelberg, 2000: 183, Figure 22) coincides with a change in the dwelling structure and the organisation of the household. According to K. Kristiansen, the sudden increase in the size of houses is because of an upper class striving for monumentality, which also finds expression in the construction of monumental burial mounds (Kristiansen, 2006: 185). With the end of the use of oak coffins and large barrows in the 11th century BC, monumental house construction disappears (Bech and Rasmussen, 2018: 39). At the same time, the great variance in house size starting in Period II is a sign of the decreasing importance of norms and principles for house construction based on tradition and social rules. With stabling occurring inside the house (byre dwelling), a different subsistence strategy came into being.
For Schleswig-Holstein, the few data available so far prove that social change took place in relation to settlement structures after 1500 BC. Around 1200 BC, a decrease in the size of houses and a simultaneous increase in the number of houses is observed. A comparison between northern and southern Jutland does not show a uniform picture. While the decrease in house size and increase in the number of settlements is visible in Northern Jutland at the transition from Period III to IV (Bech and Rasmussen, 2018: 42, Figure 2.11), in southern Jutland, Schleswig-Holstein and Mecklenburg-Western Pomerania, the transition does not appear until the end of Period IV at the transition to Period V.
The decrease in house size from 1200 BC onwards is followed by an increase in the number of settlement pits, beginning around 1100 BC. As a new element of subsistence in the Late Bronze Age (from 1100 BC), especially in the southern part of the study region, the so-called storage pit fields appear, which have their parallels in the region of Lusatia, in eastern Germany (Bönisch, 2010: 65, 2012: 123). This change at the beginning of the Late Bronze Age seems to be less sharp in Denmark, where byre dwellings and the three-aisle house structure continue into the Younger Bronze Age (Bech and Rasmussen, 2018: 38 Figure 2.8; Donat, 2018: 219). An increase in the number of houses contemporaneously occupied with a decrease in house size, as seen in Northern Europe, may reflect a change in subsistence strategy without a change in population size. The storage pit areas, such as the ‘Grote Heesen’ site, near Hamburg, with more than 800 pits (Schmidt, 1993: 19 Cat. No. 142; 162), nevertheless testify to a change in storage management. Likewise, the reduction in house size is also connected with a change in lifestyle and, with it, a change in social structure. In contrast to the Central European change, which takes place around 1300 BC, the change in the north seems to occur later, over the course of Period IV. The increasing number of houses and pits and the contemporaneous peak in the sum calibration of settlements indicate an expansion at the transition of Period IV to V.
The results for the settlement patterns are very uneven and phases of change are very different in time on the curves. All curves are also based on a small amount of data. In our opinion, the size of the houses is the most crucial regarding societal change and also produces the most reliable curve; the four phases are therefore oriented towards its fluctuations. Accordingly, transformations can be observed for Schleswig-Holstein between 1500/1300 BC and 1200/1100 BC when house size and sum calibration change. In Period I and Period V, the changes are not so clear or are only visible in Mecklenburg-Western Pomerania.
Exchange
The aoristic calculation of the distribution of gold and amber artefacts, and, for the Younger Bronze Age, of imports and iron artefacts (Figure 3) are available to track changes in supra-regional networks of exchange and trade. The graphs of numbers of gold and amber artefacts both show a peak in the Older Bronze Age and another, much lower peak, in the 9th century BC along with an increase in imports and the arrival of the first iron artefacts in the north. The curve would have been different if we had used the weight of the finds instead of their frequency, since there are massive arm rings during the Late Bronze Age, while the Early Bronze Age types consist often of spiral rings made of wire (Kaul, 2014: 885; Knoll et al., 2014: 791, Figure 2; Pahlow, 2006). It is interesting to note that gold artefacts remain stable in their values based on frequency over the entire period of the Older Bronze Age in contrast to most of the other curves in the article. A similar curve is only visible in the frequency of the burial mounds. This is likely due to the fact that these two curves are connected, as will be explained below.
The number of imports rises in Period V after 800 BC, with the transition from the Urnfield circle to the southern Hallstatt period and Iron Age. The import finds refer to foreign types of southern origin such as pins, swords, axes, knifes and cauldrons; between Period IV and V, their provenience shifts from southeastern Europe to Central Europe (Schmidt, 1993: 138; Schmidt and Segschneider, 2014).
The iron finds of Period V are few (knifes, lancets, pin) and are predominantly imported, therefore counting in the category exchange with one exception of a unique piece from Schleswig, which possibly originates from local production (Schmidt, 1993: 140, cat-no. 771). In Period VI, mainly iron pins were found (Schmidt, 1993: 140, cat-no. 771), of which types refer to southern origins though the exact place of production is difficult to estimate. However, this raises the question why the imports decline again after the end of period V. Parallel to the decrease in import finds, the local imitation of southern types increases from period V onwards (Schmidt, 1993: 138). We know from Denmark that from Period VI onwards, local types of iron appeared. In Schleswig-Holstein, the local type spectrum is replaced with artefacts being adapted to the Central European type spectrum and imports come from further south (Schmidt, 1993: 139). Imitated foreign forms are therefore no longer referred to as import finds in Period VI. Here, partly mechanisms from outside of our research area rather than intrinsic social or population change are responsible for what we observe as new resources and technology. Existing networks bring wealth centres such as Albersdorf on the west coast of Schleswig-Holstein into contact with iron in Period V. This is changing in period VI, in which new connections are formed along the moraine in eastern Schleswig-Holstein (Schmidt, 1993, map 92). This shift of the find distribution can also be observed in other artefacts (e.g. Kneisel 2012–2013: 49).
Amber artefacts are only an indirect indicator of exchange relations. The raw material occurs as a natural resource on the west coast of the Jutland peninsula. The occurrence of Baltic amber in Central and southern Europe is linked to its origin in the north. Accordingly, large quantities of amber in local graves would suggest less trade to the south and vice versa (Bech and Rasmussen 2018: 83; Jensen, 1965; Kneisel, in press). The amber curve behaves completely differently from all the other curves of material culture. The frequency of amber in graves decreases at the end of Period II, that is, with the end of the Middle Bronze Age in Central Europe. With the beginning of the Central European Later Bronze Age (from 1300 BC) and Early Iron Age (from about 800 BC), the demand for amber in southeastern Europe increased considerably and probably led to a reduction of amber in archaeological contexts in the north (Kneisel, 2013b: 166, Figure 12.10). Already at the beginning of Period II, the amount of amber artefacts decreases in comparison to the Neolithic amber hoards (Ebbesen, 1995) and the Northern Alpine finds from the Middle Bronze Age (Bankus, 1998). Another, albeit very small, drop in the curve is seen at the beginning of Period VI, when rhombic amber beads are part of standard male dress in southern Germany (Kossack, 1959).
In the different curves related to exchange, four phases of change in the wider networks can be observed. They are not connected with population change but with changes in contacts to the south and a change of regional centres of wealth accumulation.
Technology
For the category technology, all curves are based on the aoristic distribution of frequencies. Bronze axes and sickles replace the existing stone and/or flint types. Thus, for example, the curve of the sickles comprises both bifacially retouched flint sickles and bronze sickles (Figure 3). Only five flint sickles of unsure dating are represented in the whole of Bronze Age Schleswig-Holstein (Sommerfeld, 1994: cat.-no. 1, 9, 23). Bronze sickles first appear with the Ostenfeld type in Period II (Sommerfeld, 1994). From the Younger Bronze Age onwards, archaeologists once more see coarse flint sickles (e.g. from the Danish Islands, Jensen, 1997; or Netherlands van Gijn, 2010: 55), which were not considered here. In Schleswig-Holstein, in contrast to other regions, sickles are documented not only from hoards and single finds but also, and in the same frequency, from graves. Nevertheless, they are an artefact group which occurs only rarely in Period III, in contrast to daggers, swords or gold artefacts. Obviously, sickles did not have the same significance as these prestige goods.
Swords, representing a new type of weapon associated with a new fighting practice as well as a prestige good, are mostly documented from Period I onwards in hoards (Bunnefeld, 2014; Kristiansen, 1984). Because of the aoristic calculation, the sword curve begins around 1750 BC, but of the reliably dated swords none are to be found before 1600 BC in Period Ib (Bunnefeld, 2016; Vandkilde, 1996). Around 1500 BC, with the beginning of Period II, there is a clear increase in the number of finds, and they now predominantly come from burial contexts (Bunnefeld, 2016: 190).
The increase in the number of different artefact types made of metal as successors of stone tools proves that technological changes coincided with increased access to bronze and the emergence of a social elite who richly endowed their graves. Especially, the shape of the curve for swords, which in contrast to axes and daggers are not a tool per se, seems to be more linked to the barrow (see Figure 4) and gold curve than that of the other tools. In contrast to sickles and axes, swords and daggers are still found in large numbers in graves until Period III. Only with the beginning of Period IV does the number clearly decrease, accompanied by a change in the burial ritual towards flat graves. Since these curves are widely linked to the frequency of grave monuments, the influence of the changed burial ritual serves as a bias. With the emergence of urn graves in the Younger Bronze Age, large-format grave goods are only rarely incorporated and the number of grave goods decreases.
The use of new tools, the development of weaponry, and their deposition in high numbers in the graves after 1500 BC mark changes not only in technology but also in the burial custom. Some types are no longer part of collective depositions as hoards but became individualised in the graves. This can be clearly interpreted as social change to a more individualised ownership of the metal objects. The increasing number of artefacts in general might be partly a result of the strengthening of a particular social class and their rising effort in richer equipped graves. Contrastingly, an increasing amount of tools in hoard depositions (also single depositions) as axes can be seen as a proxy for an increase in the number of people involved in depositing and might be an evidence for a rising number of people in that area.
Again, four phases of cultural change are visible in the curves of technology and they are strongly connected to social change. Technological change became visible with the start of Period II and the replacement of stone tools by metal types. In the Late Bronze Age, however, the four artefact groups behave differently. Axes rise in frequency again over the course of Period V, while metal sickles increase slightly at the transition from Period IV to V.
Ideology
The curves shown here for the category ideology (Figure 4) concern grave construction and the treatment of the dead, as well as hoard deposition finds and usage of cooking pits. Sum calibrations of 14C dates are available for the treatment of corpses and for cooking pits. The other curves are based on the aoristic distribution of frequencies.
The curve of monumental burial mounds rises from 1800 BC onwards, and it remains constant for Periods II and III (see also Brozio et al., in press, Figure 2). It is not until the 11th century BC that the number of barrows declines. Primary burials (with urns) in burial mounds are common until the end of the Bronze Age, especially in Dithmarschen (Schmidt, 1993, map 7). Usually, these Younger Bronze Age burial mounds are smaller than the Older Bronze Age ones, but exceptions, such as the barrows of Albersdorf (Schleswig-Holstein), Seddin (Brandenburg) or Lusehøj (Fyn, Denmark), prove that the monumental construction method was still in use sporadically as late as Period V (May, 2002; Schmidt, 1993; Thrane, 1984; Thrane and Madsen, 2004). If we compare the curve of the primary barrows with that of the secondary burials in mounds, we see that though the number of barrows erected remains roughly the same, there are more secondary burials in Period III; this is also reflected in the steadily rising curve of the number of burials. Secondary burials in barrows are also common in Periods IV and V. From about 1000 BC onwards, more and more flat (i.e. non-barrow) cemeteries are found, where the urns are buried separately from the mounds (Kneisel, 2018: 196, Figure 15). The increase in numbers of burials in the Younger Bronze Age and the increase in frequency of urn fields apart from the mounds both happen with start of the transition from Period IV to V.
The sum calibrations for inhumation and cremation burials show a large overlap, which begins at the earliest around 1600 BC and lasts until 1200 BC according to the three dated cremation graves in Schleswig-Holstein. For Denmark, the database contains more dates (n = 59). The 14C data prove the beginning of the cremation custom there around 1450 BC (Kneisel et al., 2013; Olsen et al., 2011). Based on the sum calibration of the 14C data for Denmark, it has been concluded that inhumation goes out of use at the latest around 1000 BC (Kneisel et al., 2013). In accordance with the (more extensive) Danish data, our analyses show a start of the change in burial customs at the transition between 1500 and 1400 BC. For the younger part of the Bronze Age, the curve is not meaningful, as no data are available. Thus, the slow change to cremation takes place slightly earlier than in southern Germany (Falkenstein, 2011, 2017: 84, Figure 7). Cremation in the Neolithic is not unusual but also not very common. From archaeological dating, cremation starts quite early in the Bronze Age but only becomes customary in Period III, and the custom of burial in oak coffins and burial mounds is still retained. However, the sum calibration shows an early peak already in Period II, where also the only dated cremation from Mecklenburg-Western Pomerania is placed (H Raese, personal communication, 2019). The change in burial custom is a slow transformation process with several steps: from inhumation in oak coffins (barrows) to cremation in oak coffins (barrows), followed by cremation pits and graves near or in barrows and then urn fields separated from barrows. Although slow, the end of the process represents a completely new custom. Contrastingly, the transition from barrow to urn graves can be described as a sharp change within the burial ritual at the transition of Period III to IV.
In Schleswig-Holstein and Mecklenburg-Western Pomerania, alignments or groupings of cooking pits, used as ritual fire pits, start to appear close to grave mounds and besides settlements around 1400 BC, in the middle of Period II. The earliest such contexts come from Naschendorf, Mecklenburg-Western Pomerania (Schmidt, 2012). The cooking pits show a peak at the beginning of the Younger Bronze Age, around 1100 BC, when the custom of burial in barrows and oak coffins slowly disappears. Other investigations also show that, for Denmark, the use of cooking pits post-dates 1500 BC and that individual sites with such pits can have a very long duration of use of up to 1000 years (Kruse and Matthes, in press). Such features are documented well into the Iron Age (Bo Henriksen, 2005; Honeck, 2009), but 14C dates from this period are missing for Schleswig-Holstein. These large places with over hundred pits in an alignment reflect a change in social behaviour and feasting practice apart the settlements as a repetitive custom.
The deposition of hoard finds is a phenomenon that becomes obvious at the transition from the Neolithic to the Bronze Age and shows a strong increase in the 16th century BC, followed by a decrease and then another increase, back to similar values, in the 12th century. Paralleling the curve of sickles and axes (both of which are part of depositions), the number of hoard deposits in Period III declines. According to this curve, hoards are mainly found during Periods II and V. The hoard depositions reflect ritual activities, but in combination with the increasing inclusion of tools like sickles and axes also in the graves, they might also reflect a population growth.
Cultural change is best understood at the ideological level. The differences in grave construction between a mound measuring 20 m in diameter and a small urn grave are immense. The organisation to build a barrow, the amount of work involved, and the number of grave goods are clear evidence of differences that can only be explained by a social change. The continuous increase in the number of burials, however, could speak in favour of an increase in the population if the social limits for a burial had not changed. While in the Older Bronze Age we assume only a certain social class is interred in graves, the number of people who receive a burial continues to rise into the Iron Age. This also shows an ideological change.
With regard to the ideological category, four phases of change can be worked out. A clear coincidence between all levels can be seen in the first phase and third phase, while the other two phases mark rather weak changes.
Palaeoecological data
As we have so far tried to quantify the degree of cultural change in the fields of settlement, exchange, technology and ideology, we are now going to compare and discuss these results with quantitative data about subsistence and human impact derived from palaeoecological records. The basis of the latter approach is the assumption that the intensity of human impact on the landscape is linked to human population density. The environmental curve in Figures 2, 5 and 8 is based on the values of the first axis of a principal component analysis (PCA) of the pollen record of the two sites, Lake Belau and Lake Woserin (Figure 1). The green and red columns represent boom and bust phases identified by comparison of environmental data, indicators for soil erosion, and 14C sum calibration of north-western Central Europe settlements (Feeser et al., in press).
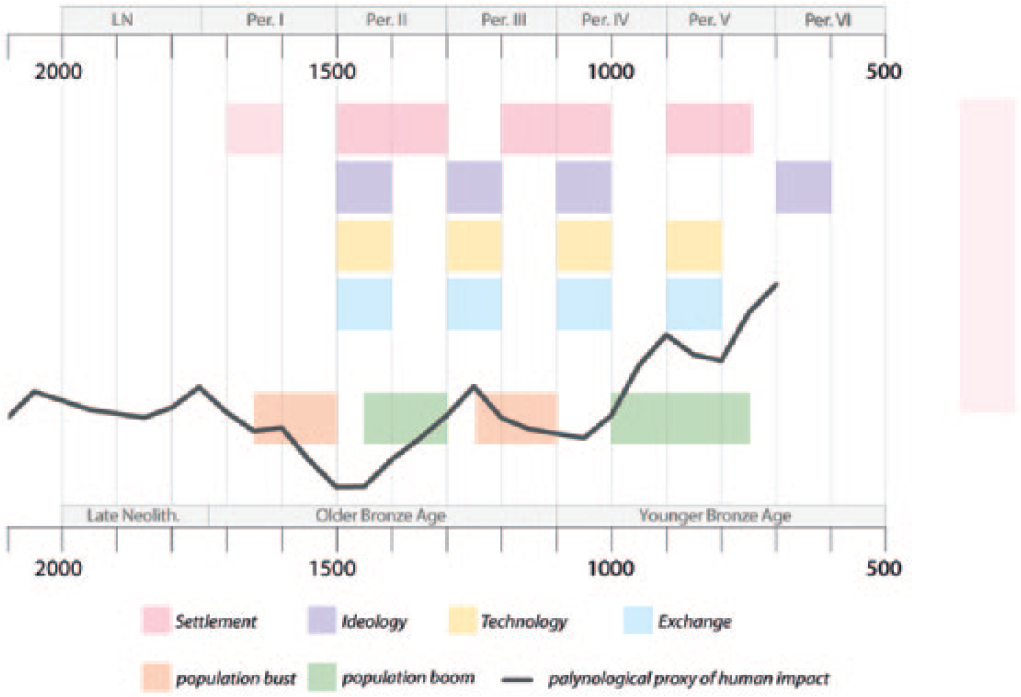
Comparison of the different phases of change.
During Period I, the indicators for human pressure on the landscape decrease stepwise with a trough after 1500 BC. This is followed by a continuous phase of expansion in the pollen record, indicating an ongoing opening of the landscape and increasing human pressure. After the start of Period III, the human pressure on the environment decreases again. At the transition from the Older to the Younger Bronze Age around 1050 BC, the curve rises again, which can be interpreted as a strong population growth. In this time, millet appears as a new crop and allows for new aspects of subsistence. With the start of Period V around 900 BC, a short regression or bust phase for some one hundred years is visible again. Heath, previously a local phenomenon, spread. Little is reflected of this boom in the archaeological record as the Bronze Age with its specific burial practices come to an end and new practices and objects evolve.
If we compare the palaeoecological boom and bust phases with the cultural phases of change detected so far in the discussed material culture (Figure 8), we can clearly see some corresponding patterns. The changes visible in settlement occur at least partly parallel to the human impact curve and the population density derived from it. The number of houses, the change in house sizes and the emergence of changed settlement structures follow the fluctuations of the calculated demographic curve. It should therefore be noted that changes in settlement behaviour appear to be directly related to population size. This is particularly visible in the sharp uptrend from 1450 BC. More people require more living and working space, agricultural areas and so on, and this involves higher pressure on the landscape. The concurrent increase of settlements and grave monuments can also be observed for Denmark in the pollen record (Bech and Rasmussen 2018). However, the changes in the material culture show a different pattern that corresponds to the peaks and troughs of the human impact curve in-between the palaeoecological boom and bust phases (Figure 5). As argued above, the chosen material culture represents changes on a micro-, meso- and macro level.
At each beginning of a boom phase and each end of a bust phase, changes in the material culture could be observed. When the pressure on the landscape is at its lowest around 1500 BC and shortly before it rises again, the type of burial changes, hoards and bronzes increase, and monumental burial mounds are erected again. Vice versa, when the pressure on the landscape reaches its maximum value around 1250 BC, tools and hoard depositions decrease again and only the monumental burial and prestige goods are maintained. The ‘elite’ are continuing with their way of burial. The reduction in house surface area and the number of hoards takes place earlier, possibly because of material scarcity as could also be proven in Thy, northern Jutland (Bech and Rasmussen 2018). Again, the human impact decreases, and at its lowest point at the beginning of Period IV ca. 1100 BC, the monumental burial custom and the addition of prestige goods also end. The number of hoards and graves begins to rise again, and cooking pits appear. Exchange networks shift with the beginning of Period V, while axes increase again together with a slight decrease in the human impact curve. The appearance of certain artefacts or burial rites at the beginning of such a period of upheaval seems to suggest the role of a trigger. With this analysis, we have defined several likely indicators for social change in the less distinct phases and societal change in the strongly pronounced phases around 1500 BC and 1100 BC and the most important triggers for the Schleswig-Holstein Bronze Age.
Conclusion
The correspondence between social/societal change on one hand, and demographic boom and bust phases as evidenced in palaeoecological records on the other hand, can be confirmed best at the macro level. The change that took place around 1500 BC is not limited to Schleswig-Holstein, but can be traced in some areas throughout the Nordic Circle and is a reaction to the collapse of the northern Únětice groups. The free access to the new material metal, the increase in population and the evolving social stratification find their expression in monumental buildings of both graves and houses. At the micro- and meso level, change is taking place in a different way. These levels emerge consistently shifted to the demographic boom and bust phases and the curve of the human impact. Connected with the peaks and troughs of human impact on the landscape is the change in material culture, burial and hoard deposition. These changes in the inventory and social customs seem to trigger an altered pressure on the landscape. The alterations are particularly visible at the beginning of the Bronze Age and at the transition to the Late Bronze Age, which is not unexpected. But the smaller changes in-between are of particular interest. Prestige goods show few changes in the second demographic bust phase, but tools and hoards decline. Monumental constructions continue to be built, but the grave ritual is already changing from inhumation to cremation. The changes in the second demographic boom phase, from 1000 BC onwards, are characterised by an almost complete renunciation of monumental architecture and a decline in the number of tools and prestige goods. The renewed increase in the number of hoards and new settlement structures with storage pit fields, accompanied by a general increase in the number of burials and settlements, are evidence of a slow social change which is not directly linked to the southern changes of the Urnfield Circles. On one hand, the burial custom of cremation seems to change already slightly earlier; on the other hand, the big changes in material culture occur later, around 1000 BC.
Overall, the increase in the amount of burials and settlements accords well with the population proxies from the palaeoenvironmental data. Prestige objects and barrows, however, are subject to different social mechanisms and were kept maintained over a longer period. The reduction in house surface area and the number of hoards takes place earlier. This study shows that some archaeological proxies are suitable for an interpretation of population growth and that, in order to understand social change and its mechanisms, it is necessary to compare proxies at different levels and in different categories. Only in a synthesis of a large number of indicators do changes in the structure of the social system become visible. This study is a first step towards understanding the Bronze Age transformation processes in Schleswig-Holstein between two major cultural impact zones with the help of material culture and palaeoenvironmental data.
Importantly, the changes seem to take place at different paces. The first change can be seen as relatively rapid. It is initiated by slow transitions in period I, but only after 1500 BC clear maxima appear in our proxies. The second change around 1100 BC is much more gradual and should be understood more as a reduction than an increase. It started partly already in Period III. The archaeological data show a slow change, more of a transformation around 1100 BC, while the increase in Period II corresponds to a sudden cultural expansion phase.
Footnotes
Acknowledgements
This article is based on close cooperation between the subclusters D3, F2, F3 and C1 of SFB 1266, funded by the Deutsche Forschungsgemeinschaft (DFG, German Research Foundation–project number 2901391021–SFB 1266). We would like to thank all participants most sincerely for their intensive and constructive collaboration and discussion. Special thanks go to the editors and organisers of this special issue and to Carsten Reckweg for the graphic realisation of the illustrations. We would like to thank Dragana Filipović for her constructive help in planning the article and Suzanne Needs-Howarth and Sarah Martini for the proofreading. Jan Piet Brozio also deserves our gratitude for the provision of the sickle and hoard frequency from the late Neolithic and the lively discussion for the selection of the archaeological proxies.
Funding
The author(s) received the following financial support for the research, authorship and/or publication of this article: this study was funded by the Deutsche Forschungsgemeinschaft (DFG, German Research Foundation, Projektnummer 2901391021 – SFB1266).