
Abstract
Sporopollenin is a complex biopolymer which is the main component of the pollen grain exine and is partly composed of the aromatic compounds para-coumaric acid (pCA) and ferulic acid (FA). These compounds absorb ultraviolet-B radiation (UV-B, 280–315 nm), and their abundance in pollen and spores has been shown to increase in response to increased UV-B flux. Here, we show that the relative abundance of UV-B-absorbing compounds (UACs) measured using Fourier Transform Infrared Spectrometry (FTIR) in modern pollen of autumn-pollinating Cedrus atlantica trees increases in response to summer UV-B flux. This relationship was observed in native Moroccan samples (r2 = 0.84, p < 0.0001), but not across a larger environmental gradient including non-Moroccan samples (r2 = 0.00, p = 0.99). For non-Moroccan samples of known provenance, the abundance of UACs is similar to the abundance of UACs found in samples from their place of origin. The FTIR spectra of these samples also closely resemble the FTIR spectra of samples from their place of origin. This unexpected finding suggests there could be a heritable component to UAC production possibly associated with epigenetic memory, an important adaptive mechanism in conifers. Our results indicate that the relative abundance of UACs in Cedrus atlantica pollen could be used as a proxy to reconstruct historic summer UV-B flux in Northwest Africa during at least the Holocene and Late Glacial period while also highlighting how UV-B proxies should be established using pollen samples from specimens growing in their native range or environment.
Introduction
Plants require sunlight to function, but too much exposure to ultraviolet-B radiation (UV-B, 280–315 nm) can have a damaging effect. For example, UV-B can cause damage to DNA, lipids, membranes, genomes, stunt plant height and leaf area; alter leaf thickness; increase susceptibility to attack by insects and disease; reduce competitive ability; cause malformation of pollen and reproductive sterility; alter biodiversity; and affect nutrient cycling (Benca et al., 2018; Caldwell and Flint, 1994; Caldwell et al., 1998; Hollosy, 2002; Manning and Tiedemann, 1995; Ries et al., 2000; Rozema et al., 1997). UV-B may also affect photosynthetic activity through damage to Photosystem II and RuBisCO activity (Teramura and Sullivan, 1994; Tevini and Teramura, 1989), although this is debated (Allen et al., 1998). In response, plants have developed several repair and defence mechanisms to protect against UV-B exposure, including the production of UV-B-absorbing compounds (UACs). These compounds are present across different plant tissues, for example, epidermis layer, lignin, leaf tissues and pollen, and are thought to provide a screening mechanism to prevent UV-B radiation from penetrating into the mesophyll layers of plant leaves (Caldwell et al., 1998; Hollosy, 2002; Rozema et al., 1997; Sancar and Sancar, 1988; Taylor et al., 1997; Tevini et al., 1991).
In pollen, para-coumaric acid (pCA) and ferulic acid (FA) are the primary UACs which are the main phenolic component of the highly resistant biopolymer sporopollenin, which remains intact after fossilisation (Bergen et al., 2004; Blokker et al., 2005, 2006; Brooks and Shaw, 1978; Havinga, 1967; Hemsley et al., 1996; Wehling et al., 1989; Wiermann et al., 2001). The production of UACs in pollen has been shown to increase in direct response to increased UV-B exposure; therefore, pollen offers the potential for use as a historical UV-B proxy due to its long-term preservation in geological archives (Blokker et al., 2005, 2006; Fraser et al., 2011; Lomax and Fraser, 2015; Lomax et al., 2008; Rozema et al., 2001a, 2001b, 2002; Willis et al., 2011). Instrumental records of solar UV-B and stratospheric ozone only date from the 1920s and 1970s, respectively (Staehelin et al., 2002), so biological proxies may provide data on UV-B flux over longer timescales which could highlight natural variations and cycles in ozone concentrations and UV-B radiation reaching the Earth’s surface (Rozema et al., 2001a). In addition, as changes in UV-B and ozone may affect atmospheric circulation and influence climate (Haigh, 2001; Rottman, 1999; Shindell et al., 2001), UV-B reconstructions could improve our understanding of the linkages between UV-B flux, ozone concentrations and climate change (Jardine et al., 2016; Magri, 2011).
There are generally two approaches to determining the chemical composition of pollen in respect to measuring UACs: thermally assisted methylation–pyrolysis–gas chromatography–mass spectrometry (THM-GC-MS), which provides semi-quantitative results and improved identification of specific compounds within pollen (e.g. Blokker et al., 2006; Seddon et al., 2017; Willis et al., 2011), and Fourier Transform Infrared Spectrometry (FTIR), which determines the relative abundance of UACs within pollen (e.g. Fraser et al., 2011; Jardine et al., 2016; Lomax et al., 2008). Because FTIR methods are unable to resolve individual ions, THM-GC-MS methods should be used in conjunction with FTIR methods to confirm the presence of target compounds (e.g. Watson et al., 2007).
Both THM-GC-MS and FTIR techniques have been used to determine UV-B flux from pollen. For example, Lomax et al. (2008) reconstructed changes in UV-B flux and ozone concentrations using FTIR from Lycophyta spores for Greenland between 1907 and 1993 and found strong similarities between UACs in spores and instrumental records of UV-B. Willis et al. (2011) used THM-GC-MS on Pinus sylvestris pollen to reconstruct a 9500-year record of changing UV-B flux at Fjell lake, Sotra, Norway, which shows bi-millennial fluctuations. Fraser et al. (2011) demonstrated the impact of shaded environments on UAC production in Lycopodium annotinum spores using FTIR, where UACs decreased by 7.4% in fully shaded areas compared with non-shaded areas. Jardine et al. (2016) also used FTIR to demonstrate that spatial variation in pollen geochemistry is correlated with latitudinal solar irradiance gradients. Based on this relationship, the authors were able to reconstruct past solar irradiance at Lake Bosumtwi in Ghana using Poaceae pollen, with changes in pollen chemistry linked to orbital precessional cycles. However, as the response to increased UV-B radiation varies by species (Rozema et al., 2005), the use of plant phenolics for a UV-B proxy should be determined for specific plant species (Blokker et al., 2006).
In this study, we examine the response of UACs in pollen of the climatically sensitive montane conifer Cedrus atlantica (Endl.) Manetti ex Carriere (Atlas cedar), which is native to Morocco and Algeria across a latitudinal range between 30° and 40°N. The species’ natural altitudinal range spans 1400–2600 m a.s.l., while climate conditions also vary across its range, for example, precipitation varies between 400 and 1400 mm/yr (Bell et al., 2017; Farjon, 1990; Ilmen et al., 2014; Linares et al., 2011; Rhanem, 2011). Cedrus atlantica requires long hours of sunlight and is intolerant of dense shade, although it is most abundant on North and Northwest facing slopes which reduce impacts of solar radiation (Benabid, 1982; Farjon, 1990). Cedrus atlantica is an autumn-pollinating species, and pollen develops during the summer months. Accordingly, we hypothesise that UACs in Cedrus atlantica pollen should reflect summer UV-B flux. The species is well represented in pollen spectra from Holocene sequences in the Middle Atlas and Rif Mountains (e.g. Campbell et al., 2017; Cheddadi et al., 2016) and also recorded in Pleistocene deposits (e.g. Rhoujjati et al., 2010), making it well suited for historic UV-B reconstructions.
One of the key steps in developing pollen as a UV-B proxy is investigating whether UV-B flux can be determined from UAC abundance across altitudinal and latitudinal gradients (Rozema et al., 2009). Here, we present the first data of UAC abundance in modern untreated Cedrus atlantica pollen, measured using FTIR on samples collected from native trees in the Middle Atlas and Rif Mountains, Morocco (Figure 1), and from planted trees in several European and one North American location. We additionally analyse a small number of samples with THM-GC-MS to confirm the presence of UACs in Cedrus atlantica pollen.
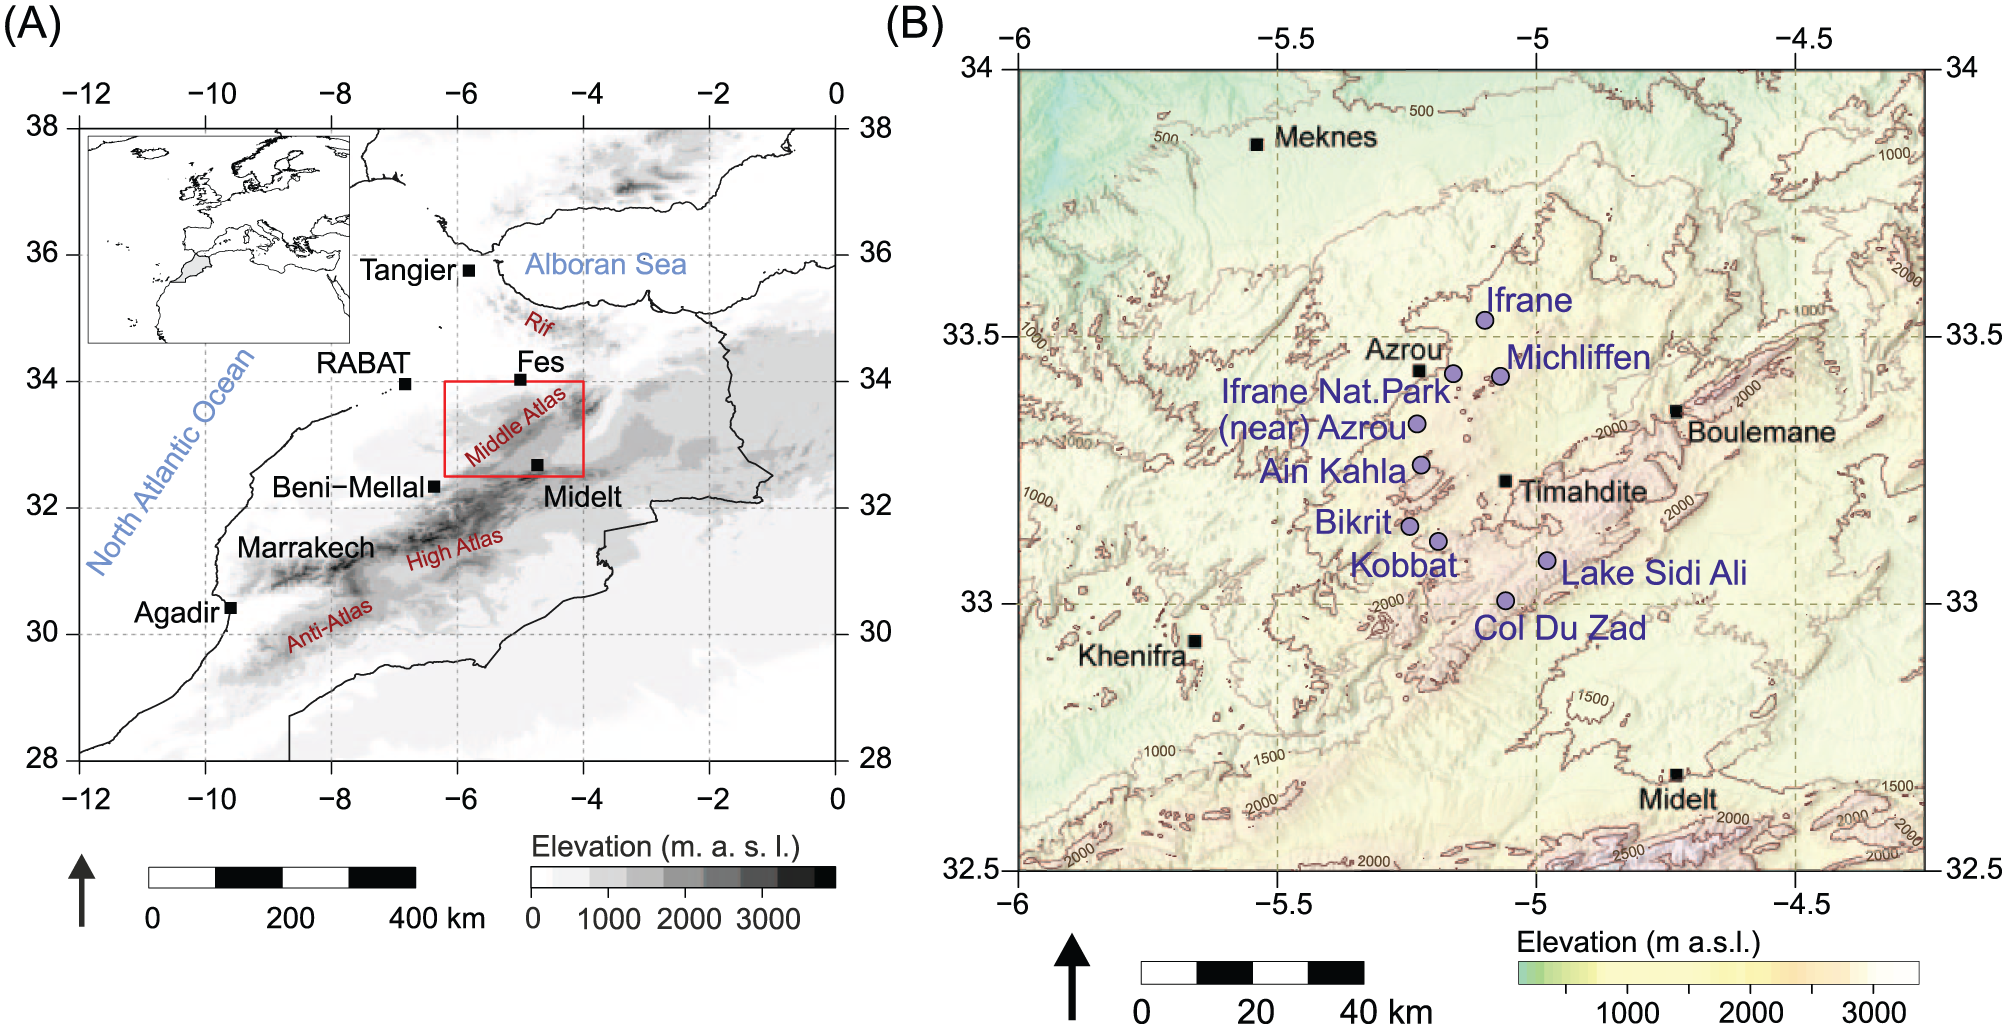
(A) Map of Morocco and (B) core sampling area in the Middle Atlas. Circles indicate sampling locations. Maps based on topographic data from US Geological Survey (2017).
We use FTIR to determine the relative abundance of UACs, which we compare with environmental variables thought to influence surface UV-B radiation, for example, latitude and altitude (Madronich et al., 1995, 1998), as well as against a global UV-B radiation (glUV) dataset (Beckmann et al., 2014). We hypothesise that UAC abundance in pollen will increase at lower latitudes and higher altitudes and where UV-B flux is higher. We furthermore investigate differences in the response of UACs to UV-B flux in native samples versus non-native (arboretum/botanical garden) samples, which could have important implications for modern calibration studies and the development of a UV-B proxy.
Methods
Sample collection
Pollen samples were collected from individual Cedrus atlantica trees across the Middle Atlas, Morocco (n = 72) and the Rif Mountains, Morocco (n = 4), with additional samples from Spain, France, UK and USA (n = 19). Samples were collected in September and October 2015, except Westonbirt (UK) samples which were collected in 2014. A ‘pollen sample’ consists of pollen grains from multiple strobili from an individual tree. Several pollen samples (from different trees) were collected in each location (Table 1). Detailed information about each sampled tree is available in Online Supplementary Material. Strobili were picked from exposed branches, placed into paper envelopes on site and later freeze-dried in the Geography Laboratories at The University of Manchester. Pollen grains were extracted by vigorous shaking of the strobili and collected in sieves. Non-pollen contamination was removed by visual inspection, and grains were stored in glass vials at 4°C.
Information on sampling locations used in this study, including provenance for samples outside Morocco (where known).
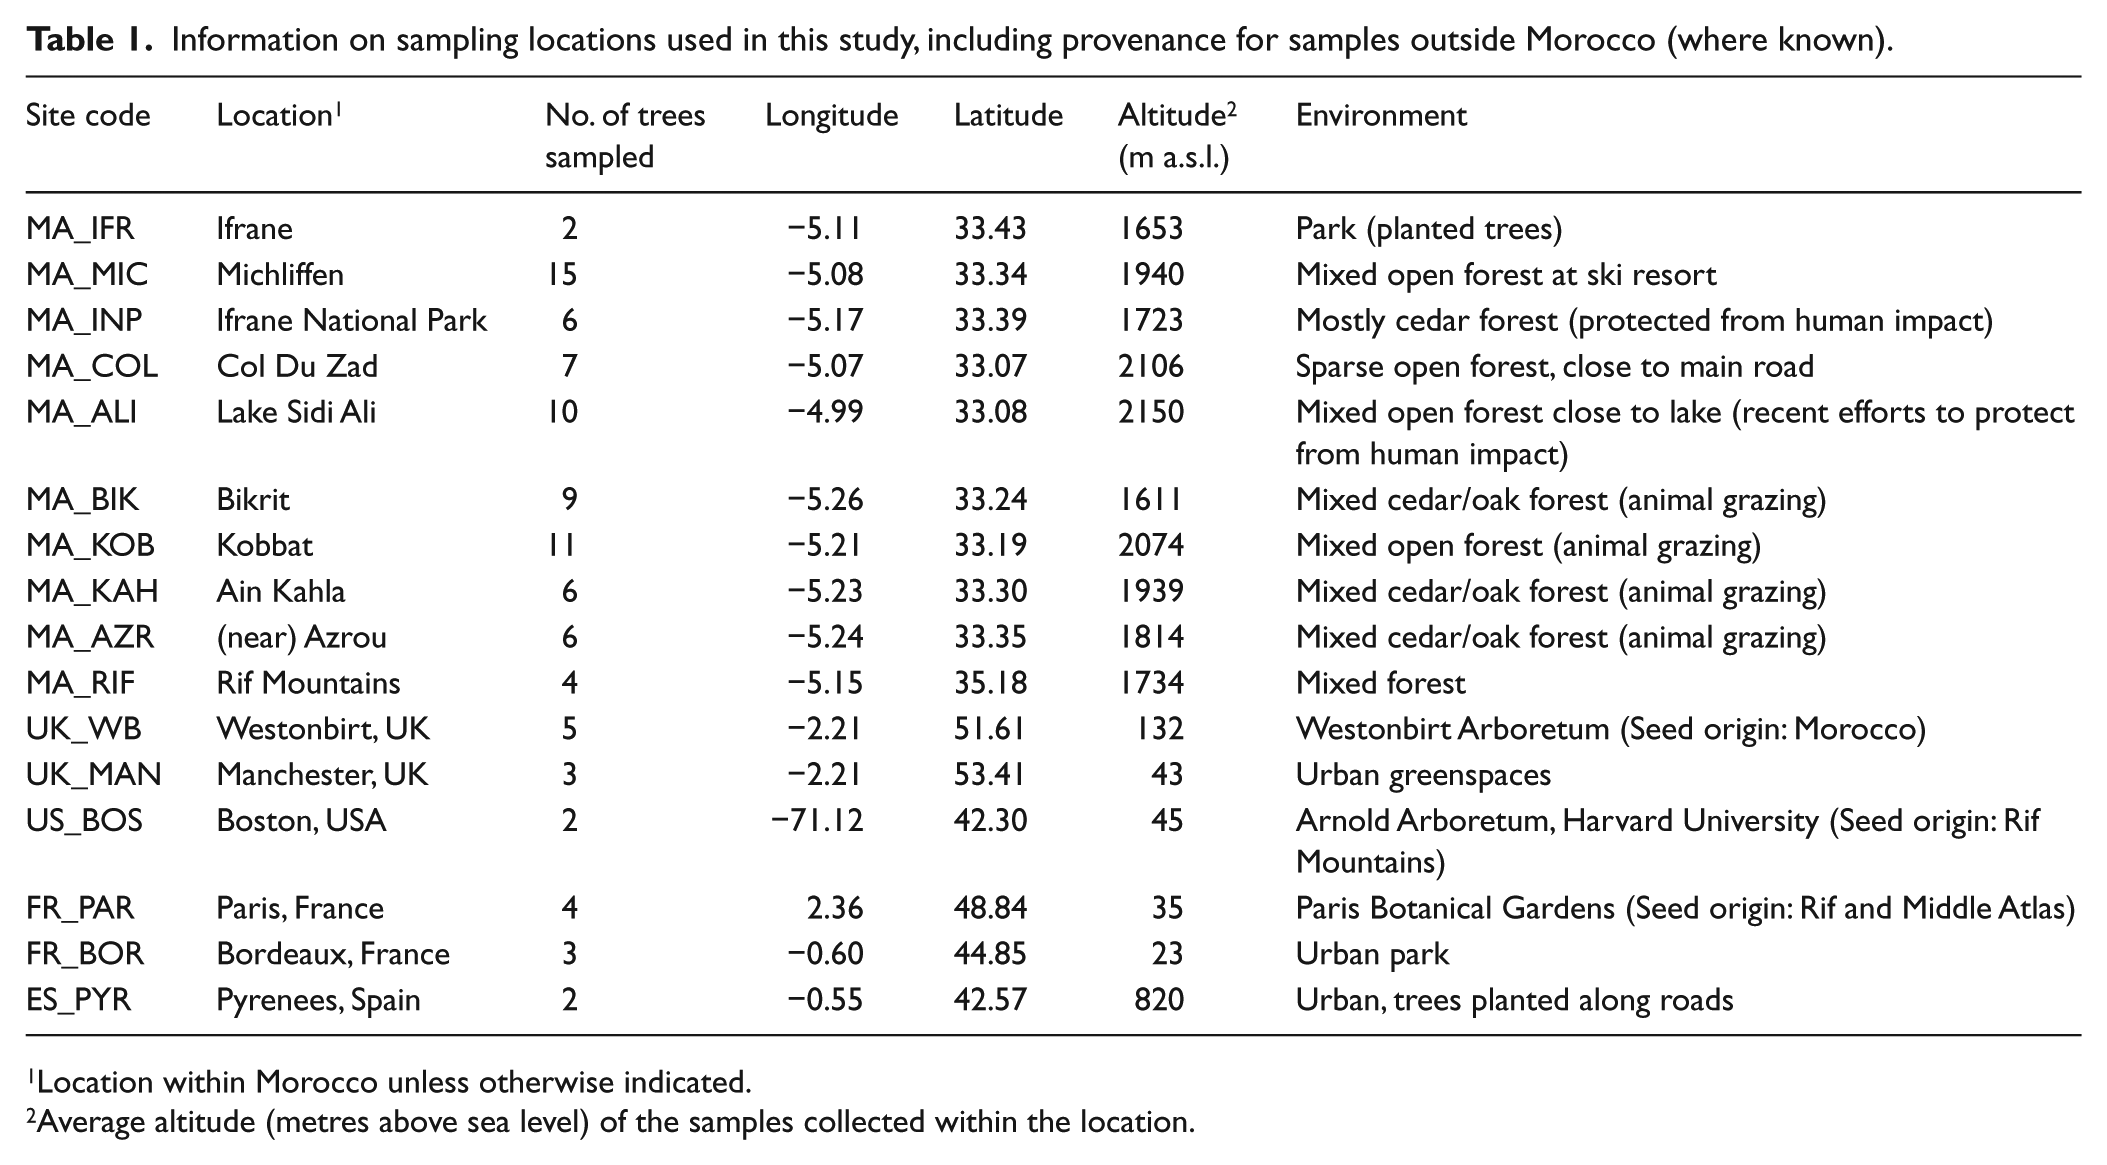
Location within Morocco unless otherwise indicated.
Average altitude (metres above sea level) of the samples collected within the location.
THM-GC-MS analysis
To confirm the presence of pCA and FA in Cedrus atlantica pollen, six untreated samples were analysed using THM-GC-MS using an HP-Agilent 6890 GC with an HP-Agilent 5973 Mass Selective Detector (MSD), following Blokker et al. (2005) and Seddon et al. (2017). The GC system was equipped with an Optic 3 PTV-injector (ATAS GL, Veldhoven, The Netherlands) and a PAL Combi robotic auto sampler (ATAS GL) at the University of Bergen. A total of 200 pollen grains were transferred into small quartz pyrolysis tubes and left overnight in a drying oven. Prior to pyrolysis, samples were wetted with a reagent solution comprising 0.4 µL of tetramethylammonium (TMAH) (C4H12N+) and 1.6 µL of methanol (CH3OH) for thermally assisted hydrolysis and methylation, and 0.1 µL of nonadecanoic acid (CH3(CH2)17COOH) to provide an internal standard (Seddon et al., 2017). THAH is used to decrease secondary pyrolysis reactions (Blokker et al., 2005), while methanol is added to dilute the TMAH (Seddon et al., 2017). Samples were heated at 70°C for 2 h to ensure penetration of the solution into the pollen grains.
THM-GC-MS oven settings followed the settings of Blokker et al., (2005). In brief, samples were pyrolysed at 600°C for 30 s, with the GC run for 40 min of ramping temperature from 40°C to 320°C in full scan mode. Dwell times were approximately 19 min for pCA and 21.5 min for FA. Absolute quantification of UACs in pollen using THM-GC-MS may not always be possible due to different intermolecular linkages which may produce different by-products during pyrolysis, which can also vary between samples (Blokker et al., 2006; Seddon et al., 2017). Therefore, results are expressed as the ratio of the UAC abundance to the internal standard applied prior to pyrolysis (Seddon et al., 2017). Identification of pCA and FA was by comparison with standards, while other compounds were identified using the NIST5 database.
FTIR spectroscopy
Untreated pollen samples were analysed on a PerkinElmer Spotlight 400 imaging system using a Universal Attenuated Total Reflection (UATR) accessory in the Earth Science Laboratories at The University of Manchester. Methodology is based upon Lomax et al. (2008) and Fraser et al. (2011). A sufficient quantity of pollen grains (typically 50 mg) was placed directly on the UATR diamond crystal to cover the 2-mm window entirely. Spectra were obtained in the wavenumber range 4000-650 cm−1 at a resolution of 4 cm−1 for 16 scans per sample. Three replicates were analysed for every sample. Background spectra were run prior to analysis and after every 18th analysis (including replicates).
UACs in pollen contain an aromatic ring, which is excited at the wavenumber around 1520 cm−1 (Fraser et al., 2011; Lomax et al., 2008; Zimmermann and Kohler, 2014). As FTIR analysis does not provide absolute UAC concentrations and because peak heights may correspond to sample thickness and UAC concentration (Lomax et al., 2008), the relative abundance of UACs was determined by normalising the aromatic peak to the major OH absorption band (assumed to represent a stable compound in pollen FTIR spectra) occurring around 3300 cm−1 as per Lomax et al. (2008). In addition, the relative abundance of UACs between samples was also determined by standardising spectra to zero-mean and unit variance as per Jardine et al. (2015, 2017). This removes the need to normalise the aromatic peak against the OH band but assumes that the relationship of all other peaks in the spectra is the same across samples except the UAC peak.
Data processing
Data and statistical analyses were carried out using R (R Core Team, 2016). All FTIR spectra were baseline-corrected to remove drift using the ‘baseline’ R package (Liland and Mevik, 2015) as per Jardine et al. (2017). FTIR results are reported as the mean spectra baseline-corrected ratio between the aromatic and OH peak heights (Lomax et al., 2008), and additionally the z-score-standardised aromatic peak heights (Jardine et al., 2015, 2017) are also considered. Principal components analysis (PCA) was performed on the baseline-corrected FTIR spectra for all samples to identify influential wavenumbers and to reveal similarities and differences the samples.
For regression and correlation analysis, individual pollen samples were grouped by their respective sampling location (Table 1) and average values calculated for four ‘regional’ groups: ‘All Samples’ which includes all native Moroccan and non-Moroccan samples, ‘Non-Morocco’ which excludes native Moroccan samples, ‘All Morocco’ which excludes non-native samples and ‘Middle Atlas’ which excludes non-native samples and samples from the Rif, Morocco.
Surface UV-B data were extracted from glUV datasets representing the period between 2004 and 2013 which has a spatial resolution of approximately 25 km2 (Beckmann et al., 2014). UV-B data are a erythemally weighted estimate of mean daily UV-B radiation for each month, with values expressed as J/m2/day. At present, no specific UV-B action spectra exist for Cedrus atlantica; however, the erythemally weighted action spectra is similar to the general plant damage action spectra (e.g. Horneck, 1995). The dataset is based on remotely sensed satellite records obtained by NASA’s Ozone Monitoring Instrument (Aura-OMI). Data were correlated with existing datasets (WorldClim) to test for known environmental gradients. The glUV dataset shows seasonal variance at global scales, with UV-B flux decreasing towards higher latitudes and influenced by topographic and climatic effects (Beckmann et al., 2014). Summer UV-B flux was calculated as the average daily mean for June, July and August.
As the resolution of the glUV datasets is too low to fully capture the variability within the Middle Atlas sampling region, the data were interpolated using bilinear interpolation which reveals a strong UV-B flux gradient in the region. In addition, UV-B flux was interpolated for the wider Northwest Africa area to understand the general patterns and fluxes across the region.
Results
Detection of UACs by THM-GC-MS and FTIR analysis
THM-GC-MS analysis confirmed the presence of UACs pCA and FA in Cedrus atlantica pollen (Figure 2). The chromatogram shows that FA concentrations in Cedrus atlantica pollen are higher than pCA concentrations, with an average of 2.5 times as much FA compared with pCA (based on six samples).
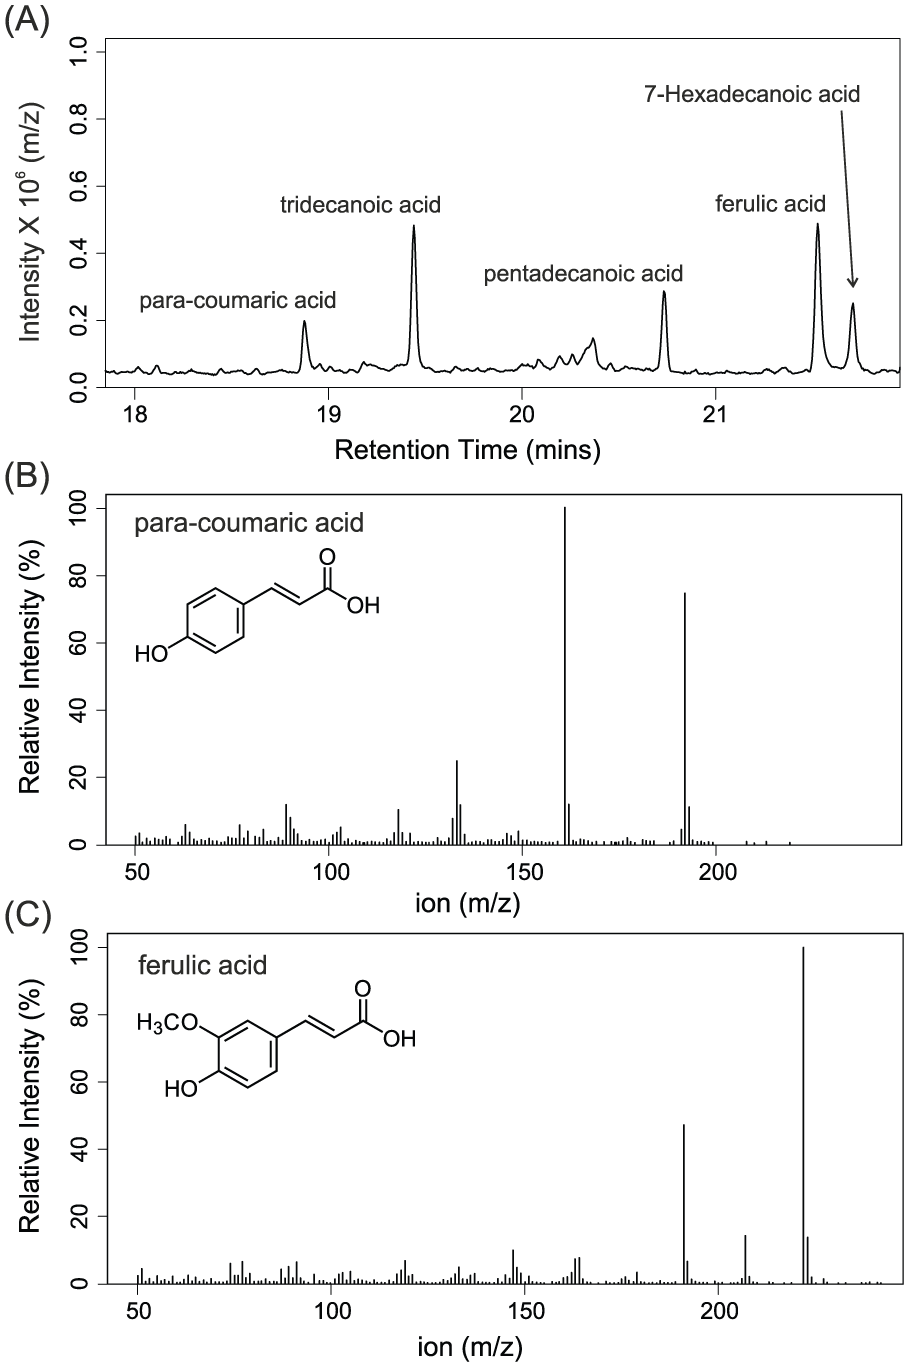
(A) Detailed view of the chromatogram of untreated Cedrus atlantica pollen. Mass spectra of (B) para-coumaric acid and (C) ferulic acid, as identified in the sample.
In the FTIR spectra of Cedrus atlantica pollen, the aromatic peak representing UACs occurred around wavenumber 1516 cm−1, while the OH peak occurred around 3300 cm−1. There is a marked difference in the fingerprint region (indicated by red boxes in Figure 3) between typical Middle Atlas pollen samples (Figure 3a and b) and Rif samples (Figure 3c and d). There were, however, a few Middle Atlas samples which had similar spectra to samples in the Rif. These included two samples from Ifrane (MA_IFR_01, 02), one from Col Du Zad (MA_COL_27) and three from Lake Sidi Ali (MA_ALI_33, 35, 40). Full spectra for all samples are available in Online Supplementary Material.
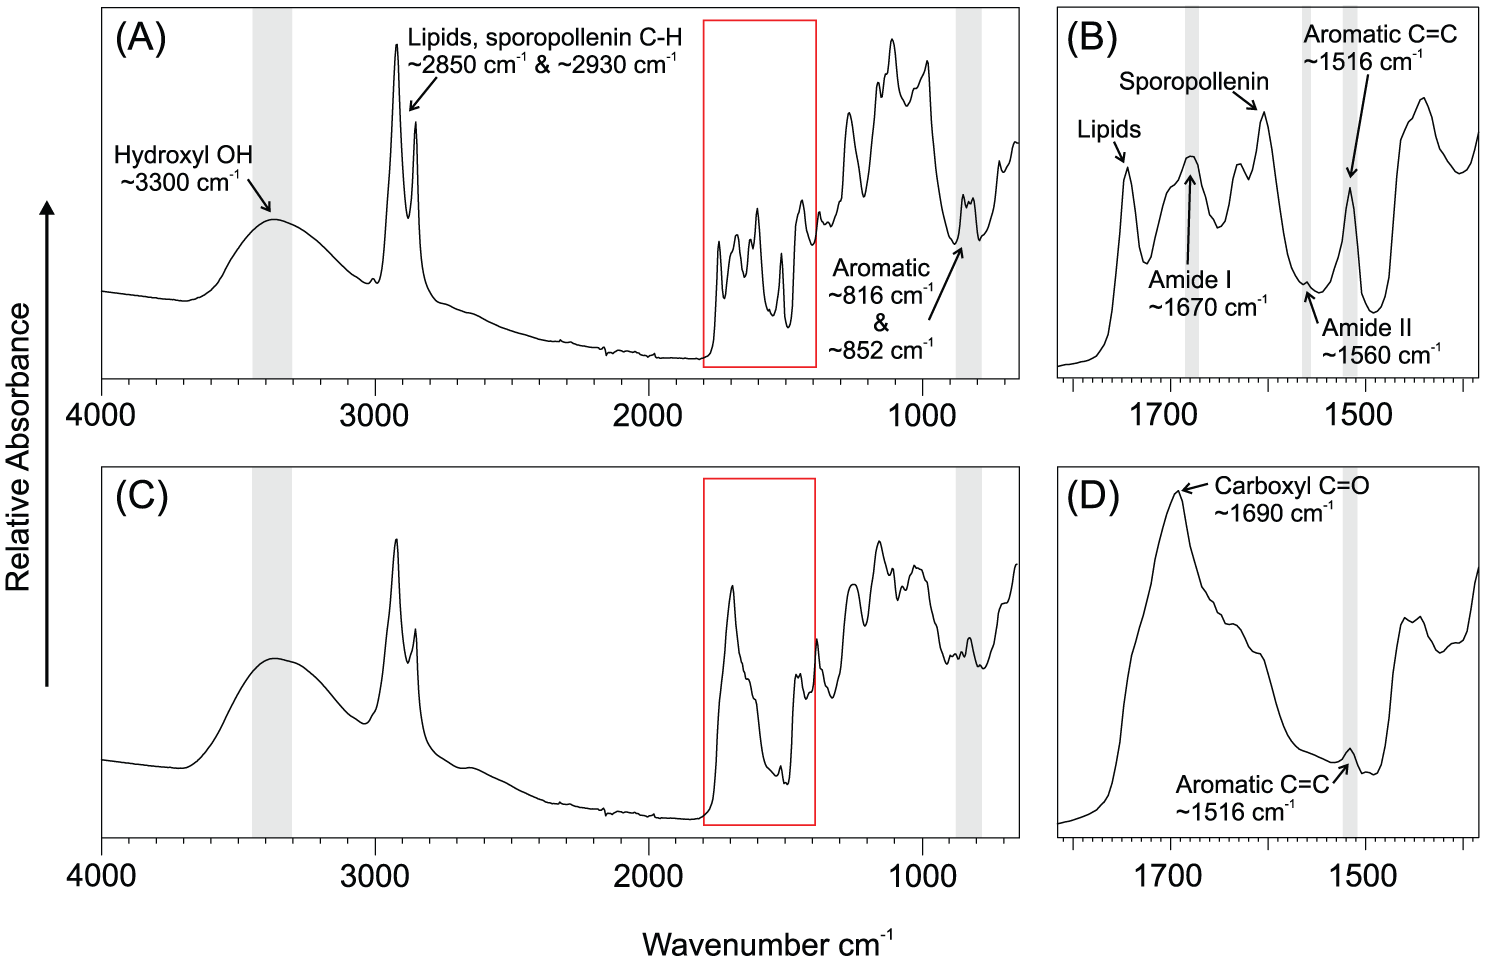
FTIR spectra of (A) typical Middle Atlas Cedrus atlantica pollen sample, with (B) showing a more detailed view of wavenumbers 1800 to 1400 cm-1 (red box). (C) Typical Rif Mountains Cedrus atlantica pollen sample, and (D) a more detailed view of wavenumbers 1800 to 1400 cm-1 (red box).
In Middle Atlas spectra (Figure 3a and b), there are several distinguishable peaks between 1400 and 1800 cm−1, with lipids linked to the ~1740 and ~1440 cm−1 peaks (Gottardini et al., 2007; Zimmermann, 2010; Zimmermann and Kohler, 2014) and sporopollenin linked to the ~1606 cm−1 peak (Schulte et al., 2008; Zimmermann and Kohler, 2014; Zimmermann et al., 2015). Proteins are evident, with the amide I peak occurring at ~1670 cm−1 (Domínguez et al., 1999; Schulte et al., 2008; Zimmermann, 2010; Zimmermann et al., 2015) and a minor amide II peak at ~1560 cm−1 (Jardine et al., 2017; Zimmermann et al., 2015). The amide II peak is clearly distinguishable from the ~1516 cm−1 aromatic peak, which suggests that nitrogen in untreated Cedrus atlantica pollen (1.21 ± 0.3%, data available in Online Supplementary Material) does not interfere with the UAC peak, confirming the findings of Jardine et al. (2017). Nitrogen is not present in sporopollenin.
In Rif pollen spectra (Figure 3c and d), neither amide peak is distinguishable as they are overlapped by a strong peak at ~1690 cm−1 representing carboxylic acids (Domínguez et al., 1999). In Rif and Middle Atlas spectra, there are two peaks at ~816 and ~852 cm−1, which are associated with FA (Schulte et al., 2008; Zimmermann et al., 2015). The strong absorbance at these bands suggests high quantities of FA within the sporopollenin of Cedrus atlantica pollen, which was also confirmed by the THM-GC-MS analysis. However, in Rif samples, the ~816 cm−1 peak is weaker compared with Middle Atlas samples, while the ~852 cm−1 peak is significantly weaker. The ~1516 cm−1 aromatic peak in Rif spectra also appears to be significantly weaker compared with Middle Atlas spectra. A comprehensive review of band assignments for pollen FTIR spectra can be found in Jardine et al. (2017).
PCA of the entire FTIR spectral data (Figure 4) reveals grouping of spectra by region and location. Broad separation of Moroccan and non-Moroccan samples on PCA 1 (which accounts for 66% of variance) is driven by wavenumbers around ~1744 cm−1, which has the strongest loading on PCA 1. This wavenumber is representative of lipids (Gottardini et al., 2007; Zimmermann, 2010) and may indicate higher lipid content in Moroccan samples. PCA 2 includes strong loading for wavenumbers in the fingerprint region of the FTIR spectra (Figure 3), including UAC abundance (~1516 cm−1) as well as carboxylic acids (~1690 cm−1). PCA 2 mainly discriminates the Rif samples while highlighting the similarity in the abundance of UACs between Moroccan and non-Moroccan samples. (Wavenumber loadings on PCA 1 and 2 are shown in Online Supplementary Material.) Overall, PCA 2 explains 17% variance in the FTIR spectra and confirms the significant contribution of UAC abundance to sample differences in pollen composition.
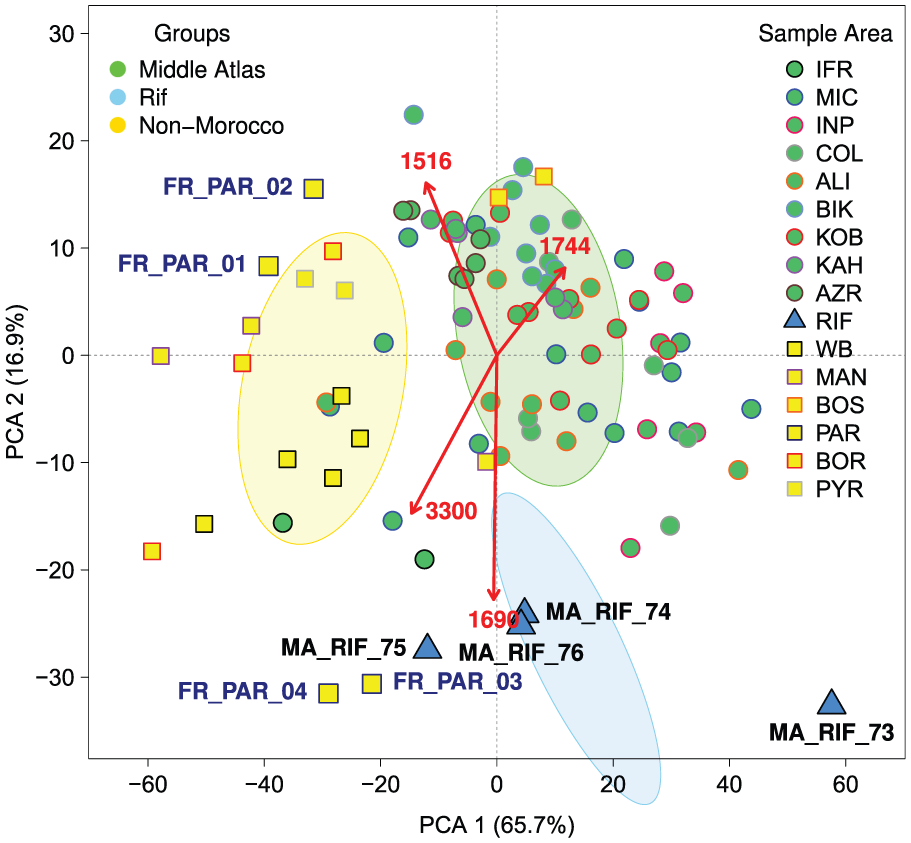
Principal component analysis (PCA) of the entire baseline corrected FTIR spectra for each pollen sample. Select wavelengths shown in red: ~1516 cm−1 (UACs), ~1690 cm−1 (carboxylic acids), ~1744 cm−1 (lipids) and ~3300 cm−1 (OH band).
Pollen UAC abundance along environmental gradients
Our findings reveal considerable variability between individual trees within the same geographical location (Figure 5). However, significant differences between geographical sampling locations are observed (ANOVA F = 8.666, p < 0.0001). A post hoc Tukey’s HSD test suggests that UAC abundance in non-Moroccan samples is not significantly different from Moroccan samples, while significant differences between Moroccan samples occur across the latitudinal gradient.
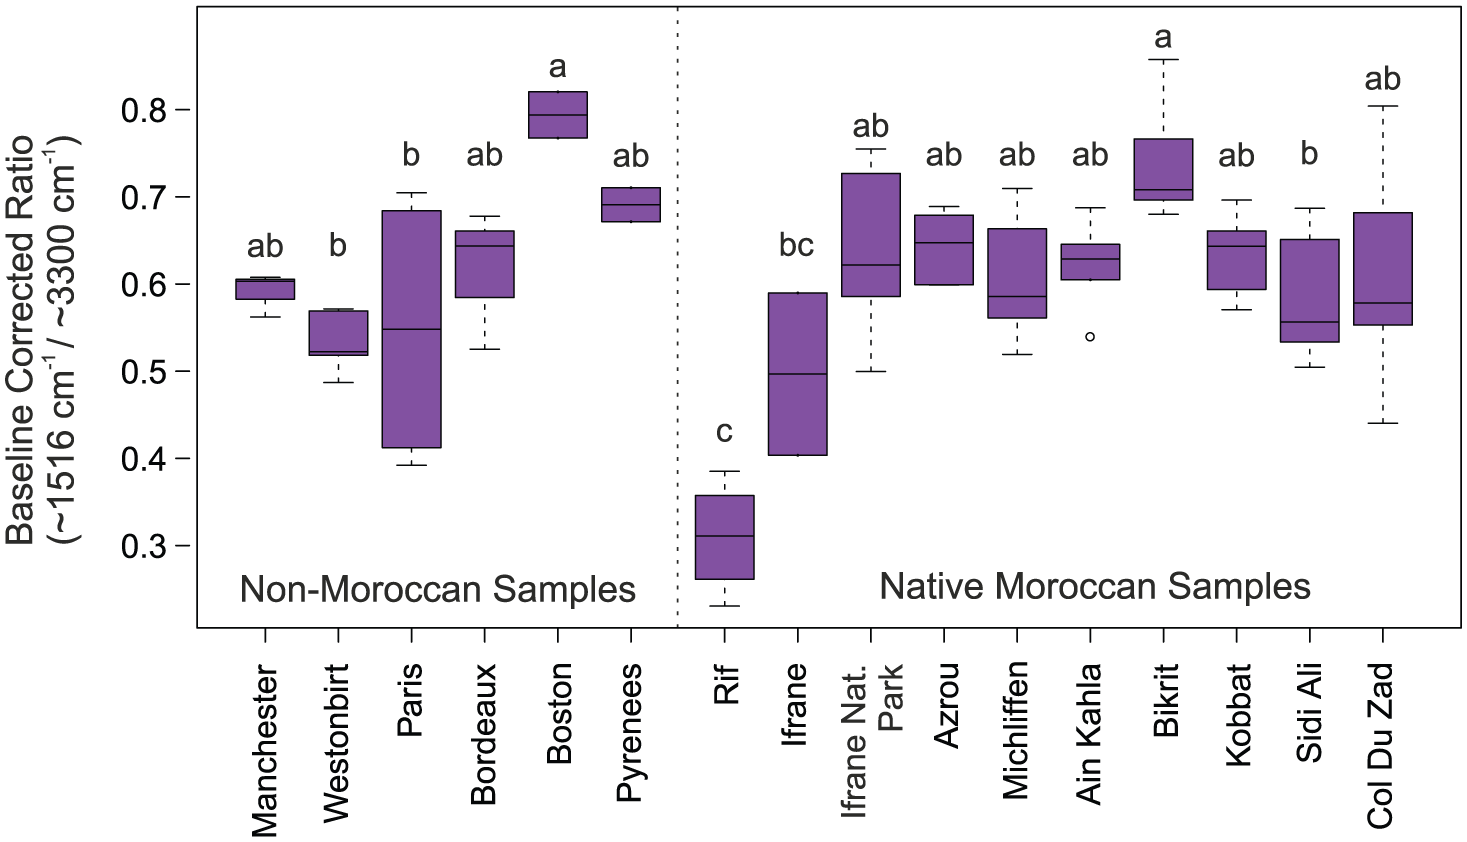
Boxplot of FTIR analysis showing baseline corrected ratio (~1516 cm−1/~3300 cm−1 peaks). Results are grouped by location and ordered along a north to south latitudinal gradient. Letters indicate locations which do not have significantly different means.
For the Moroccan samples, correlation analysis (Table 2) shows there is a significant trend (r = −0.65, p < 0.0001) of increasing UAC abundance towards the south (lower latitudes). However, boxplots (Figure 4) reveal that this pattern mainly applies until the Bikrit sampling location, after which there is a general trend of decreasing UAC abundance with lower latitudes. These patterns may be linked to the unique pattern of incoming summer UV-B flux over the Middle Atlas (discussed in section ‘UACs in pollen samples from outside Morocco’).
Correlation analysis of UAC abundance (baseline-corrected ratio) in Cedrus atlantica pollen samples (averaged by sampling location) and environmental gradients and summer UV-B flux.
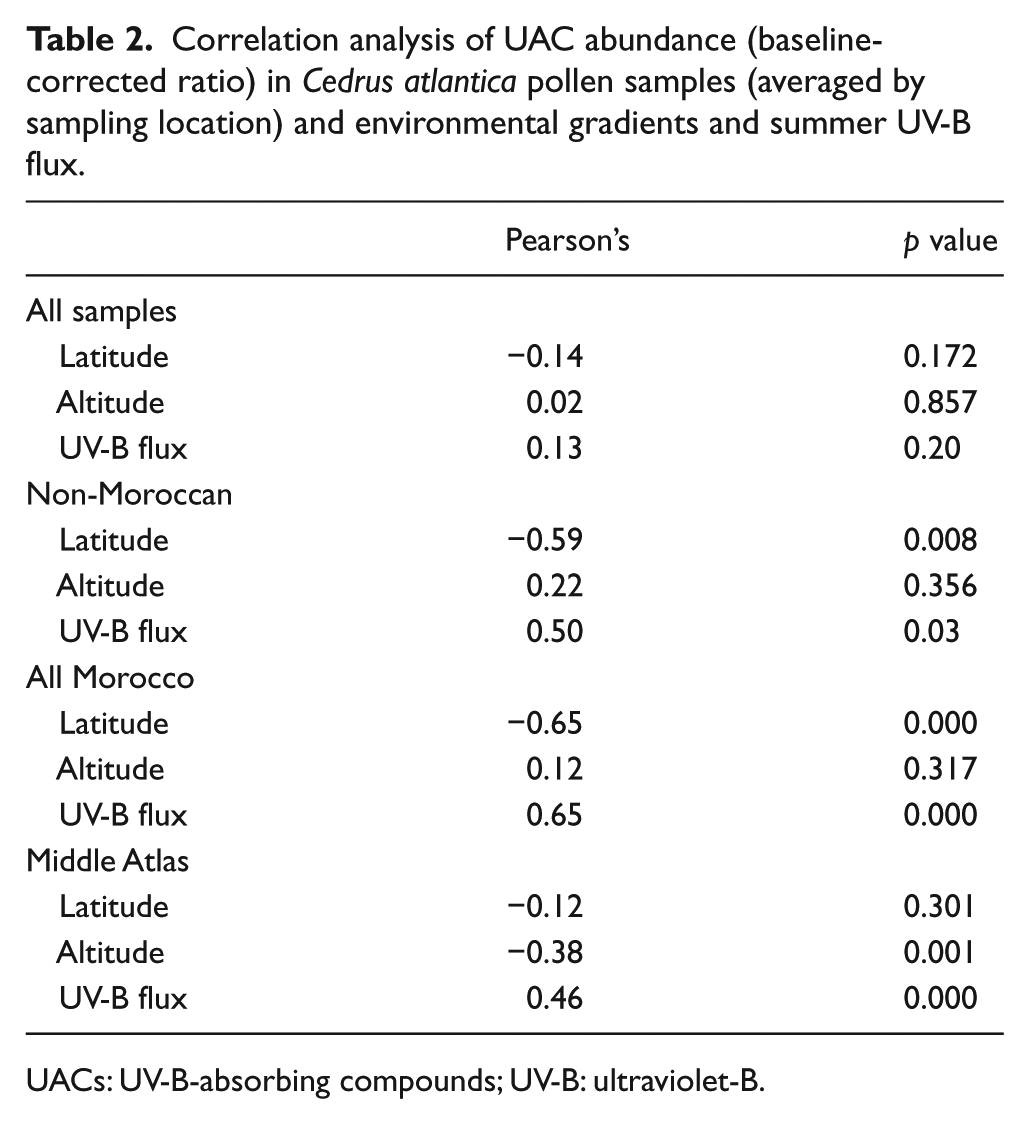
UACs: UV-B-absorbing compounds; UV-B: ultraviolet-B.
Non-Moroccan samples also display a significant trend of increasing UAC abundance towards lower latitudes (r = −0.59, p = 0.008), which is independent of the trend observed for Moroccan samples. There is no latitudinal trend across the entire sampling range (r = −0.14, p = 0.172). UV-B flux correlations mirror latitudinal trends except in the Middle Atlas. For altitude, only in the Middle Atlas is there a significant correlation with UAC abundance, although this is weak (r = −0.38, p = 0.001).
UV-B influence on pollen UACs
Using the baseline-corrected aromatic/OH ratio results (Figure 6a, c, e and g), linear regression analysis shows significant relationships between summer UV-B flux and UAC abundance for pollen samples in native Moroccan samples for both All Morocco samples (r2 = 0.84, p < 0.0001) and Middle Atlas samples (which exclude Rif Mountains; r2 = 0.58, p < 0.01). In contrast, there is no relationship between summer UV-B flux and UAC abundance across the entire sampling range (r2 = 0.00, p = 0.99). For the non-Moroccan samples, there is a weak positive (but not significant) association between UAC abundance and summer UV-B flux (r2 = 0.39, p = 0.18).
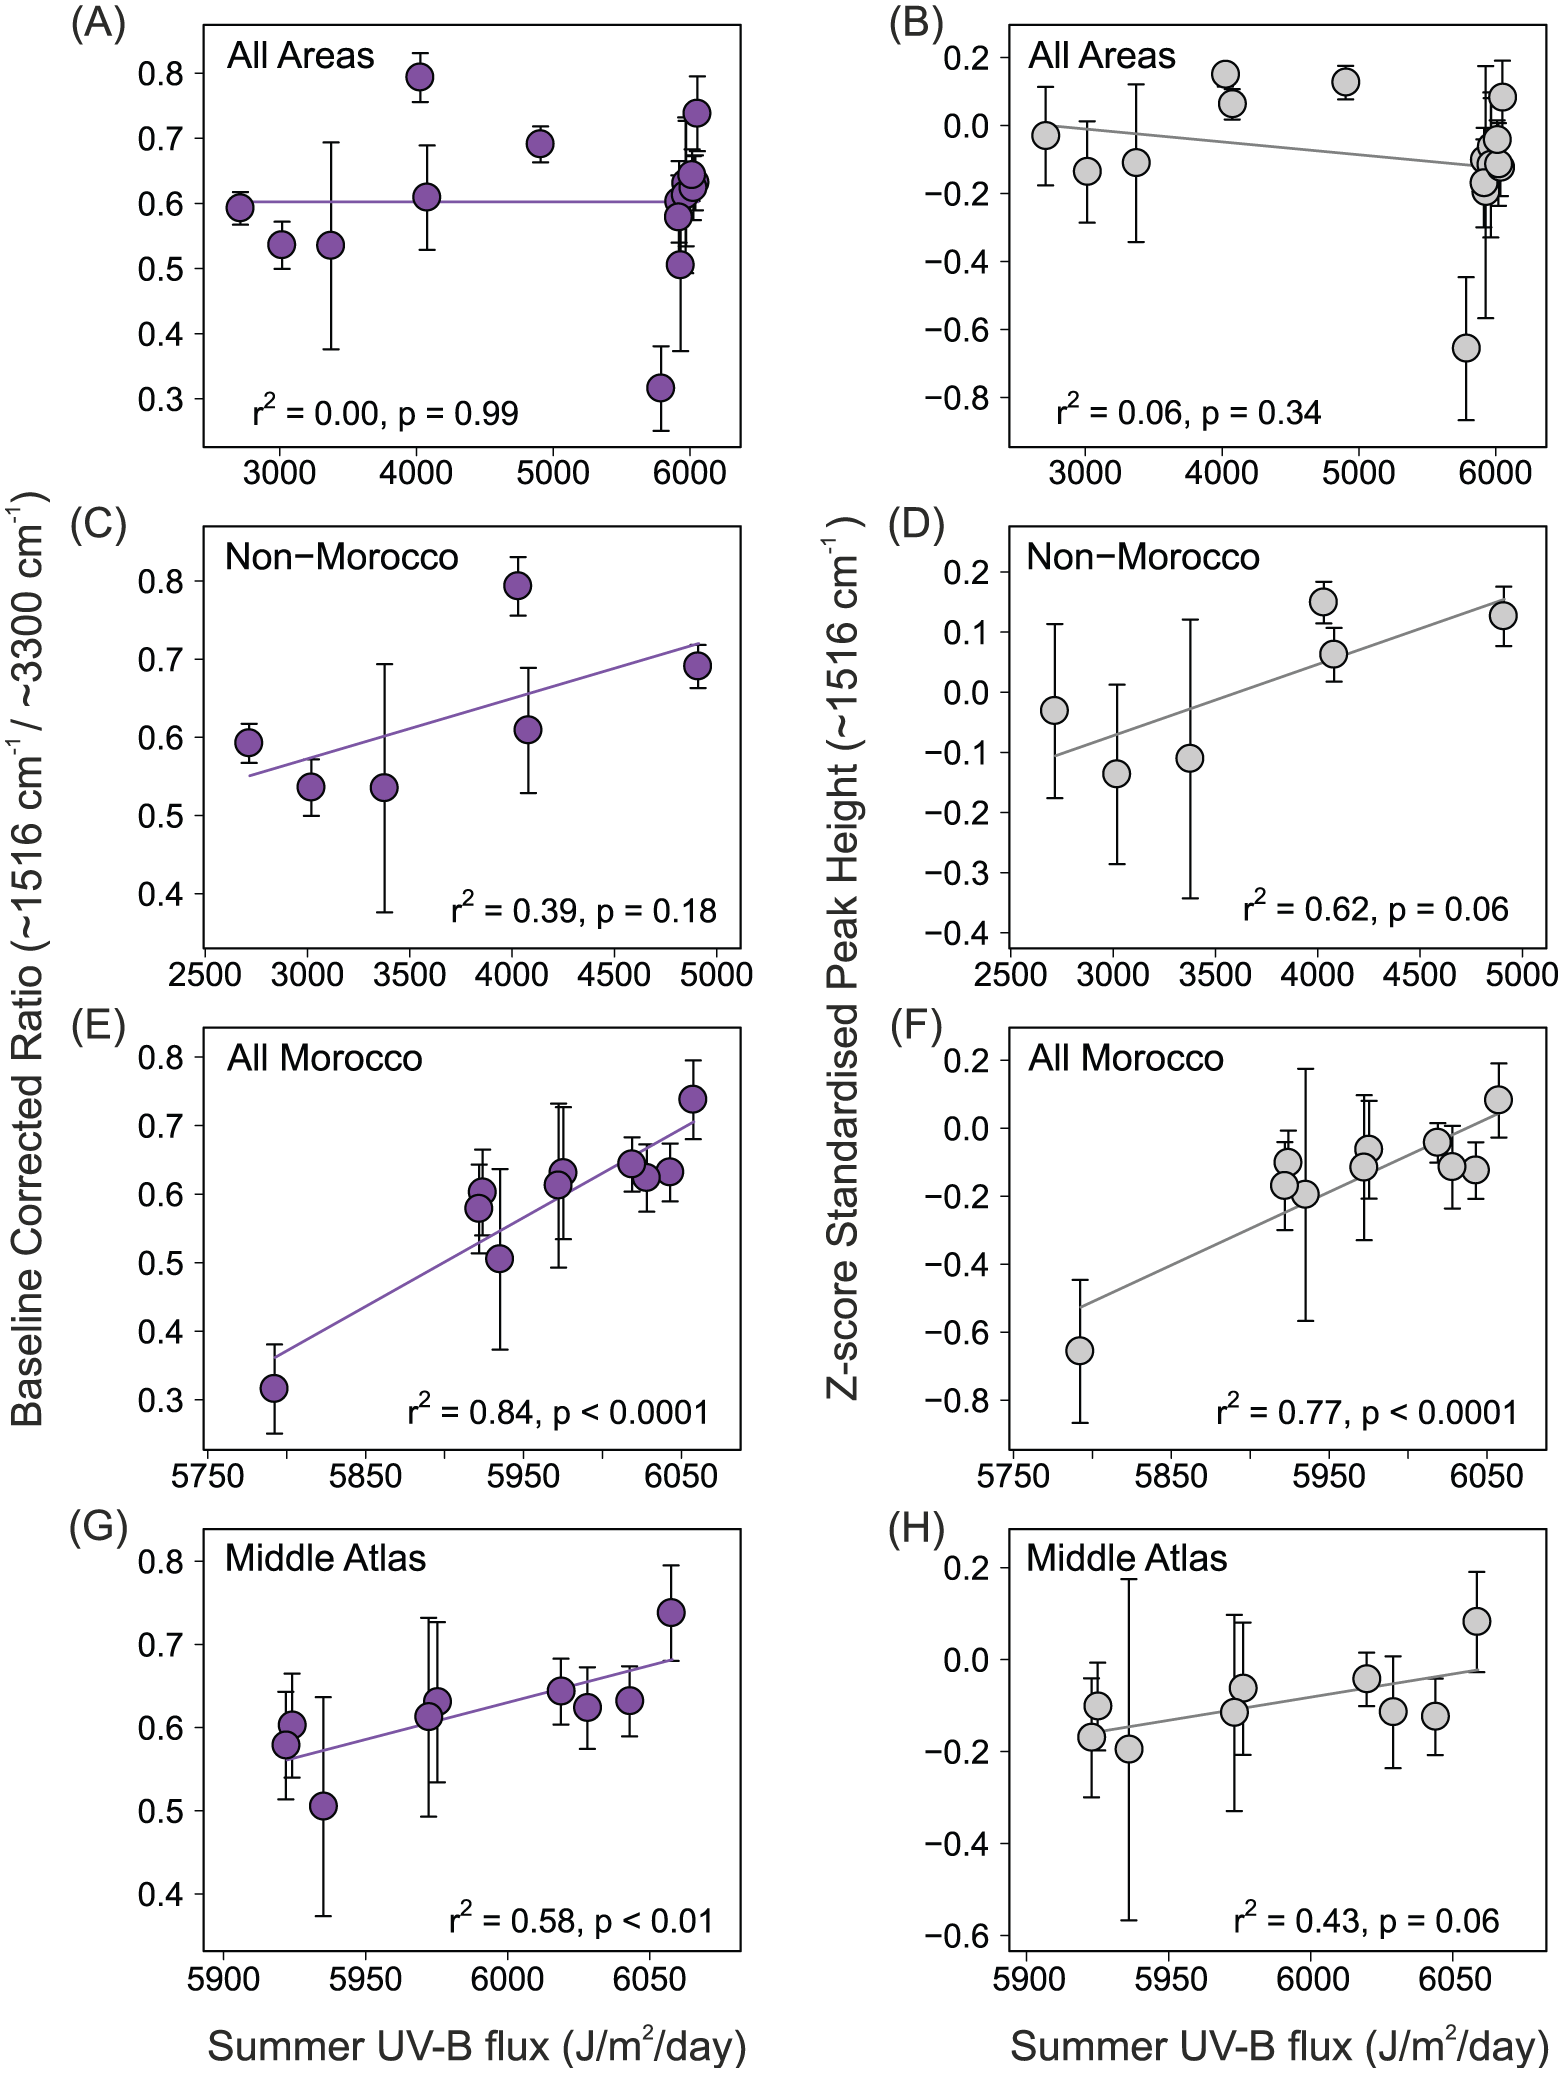
Biplots showing UAC abundance (averaged by location) vs. summer UV-B flux with linear regression models (coefficients available in online supplementary material). Baseline corrected ratio results (A, C, E, G), and Z-score standardised peak height results (B, D, F, H) for: All samples (A, B), Non-Moroccan samples (C, D), Moroccan samples (E, F) and Middle Atlas samples (G, H). Error bars show standard deviation.
Similar results were observed between UV-B flux and UACs when determining UAC abundance using the ~1516 cm−1 peak height from Z-score standardised spectra (Figure 6b, d, f and h), although these were weaker: All Morocco (r2 = 0.77, p < 0.0001), Middle Atlas (r2 = 0.43, p = 0.06) and All areas (r2 = 0.06, p = 0.34). In contrast, for non-Moroccan samples, the association between summer UV-B flux and UAC abundance was stronger (although still insignificant) using Z-score spectra (r2 = 0.62 p = 0.06) compared with using the aromatic/OH ratio to determine UAC abundance. The relationship between UAC abundance and summer UV-B flux when using Z-score standardised spectra results was only significant across all Moroccan samples (Figure 6f).
Additional regression analysis was run on Middle Atlas individual samples to test UAC response against slope angle and tree aspect which may influence the UV-B flux received (available in Online Supplementary Material), but neither of these factors showed a relationship with UAC abundance: slope angle (r2 = 0.01, p = 0.34) and tree aspect (r2 = 0.02, p = 0.30).
Overall, the results suggest that exposure to UV-B flux during the summer in Cedrus atlantica trees is a significant predictor of UAC abundance. However, there appear to be two independent relationships occurring. A significant relationship occurs in native Moroccan sampling locations, and separately, there is a similar association occurring in locations outside the native range (although not significant). The relationships between UAC abundance and summer UV-B flux are not evident if all samples across the entire range are considered.
Discussion
UAC abundance in Cedrus atlantica pollen
Cedrus atlantica pollen samples contain high quantities of FA and pCA which are detectable using THM-GC-MS, while the functional groups associated with these compounds can be resolved using FTIR spectrometry.
The abundance of FA in Cedrus atlantica pollen is more than double that of pCA. Zimmermann et al., (2015) previously noted that the presence of FA in Cedrus atlantica sporopollenin is somewhat unusual among Pinaceae taxa including Pinus and Abies, where sporopollenin comprises almost entirely pCA (confirmed in Pinus in Seddon et al. (2017). The ratio of FA to pCA in Cedrus atlantica pollen also contrasts to that of Vicia faba (broad bean) pollen, where FA abundance was shown to be much lower than pCA abundance after exposure to high UV-B flux (using THM-GC-MS). At low UV-B exposure, FA abundance was only slightly lower than pCA abundance, suggesting pCA was more responsive to UV-B exposure than FA in Vicia faba (Blokker et al., 2005). In contrast, the high abundance of FA compared with pCA in Cedrus atlantica pollen suggests that FA may be more responsive to summer UV-B flux. In Alnus pollen, the abundance of FA was similar to pCA; however, after treatment with acetolysis, FA abundance was lower than pCA (Blokker et al., 2005). These studies and findings highlight how response to UV-B flux varies by species and indicate there is some variation in the chemical composition of pollen between species. Further research is required using THM-GC-MS analysis to examine the response of FA and pCA and whether they act independently to changing UV-B flux or UV wavelengths.
We observe variability in the abundance of UACs found in pollen between different trees from the same sampling areas. This may suggest that local environmental or micro-scale climate variations could influence the UV-B flux received, and thus the UAC abundance in pollen. However, we found no relationship between UAC abundance and the position of the tree (slope angle and tree aspect, available in Online Supplementary Material), which could affect the amount of UV-B flux received. Changes in surface albedo may also be responsible for affecting the UV-B flux received by individual trees (e.g. Blumthaler, 2007; Blumthaler and Ambach, 1988), although this is likely to be minor between samples in the same area. Another factor that may influence UAC abundance between samples is the effect of shading on individual trees, with higher shading reducing the exposure to UV-B flux (Fraser et al., 2011). However, in our study, most of the pollen samples were collected from exposed branches with little shading influence. Genotypic variation between individuals may also be a factor in different levels of UAC abundance, consistent with high within-population genetic diversity in Cedrus atlantica (Terrab et al., 2006, 2008).
UV-B flux patterns in Northwest Africa
Our results indicate that the abundance of UACs in Cedrus atlantica pollen does not follow an altitudinal trend, even though increased UAC abundance due to increasing UV-B flux with altitude might be anticipated (Blumthaler, 2007; Madronich et al., 1995). There was however, a significant correlation with latitude in Moroccan samples. UV-B trends for Northwest Africa (Figure 7) show the expected global pattern of UV-B flux, where UV-B generally increases with more southerly latitudes in the northern hemisphere. However, during the summer months, particularly July and August, UV-B flux is lower in large parts of the Middle Atlas (indicated by red box), and northern parts of the High Atlas, in comparison with other areas at the same latitudes. Looking at the Middle Atlas region more closely (Figure 8), there is an east to west gradient of UV-B flux during July and August (when Cedrus atlantica pollen develops) which returns to the expected North to South gradient in September.
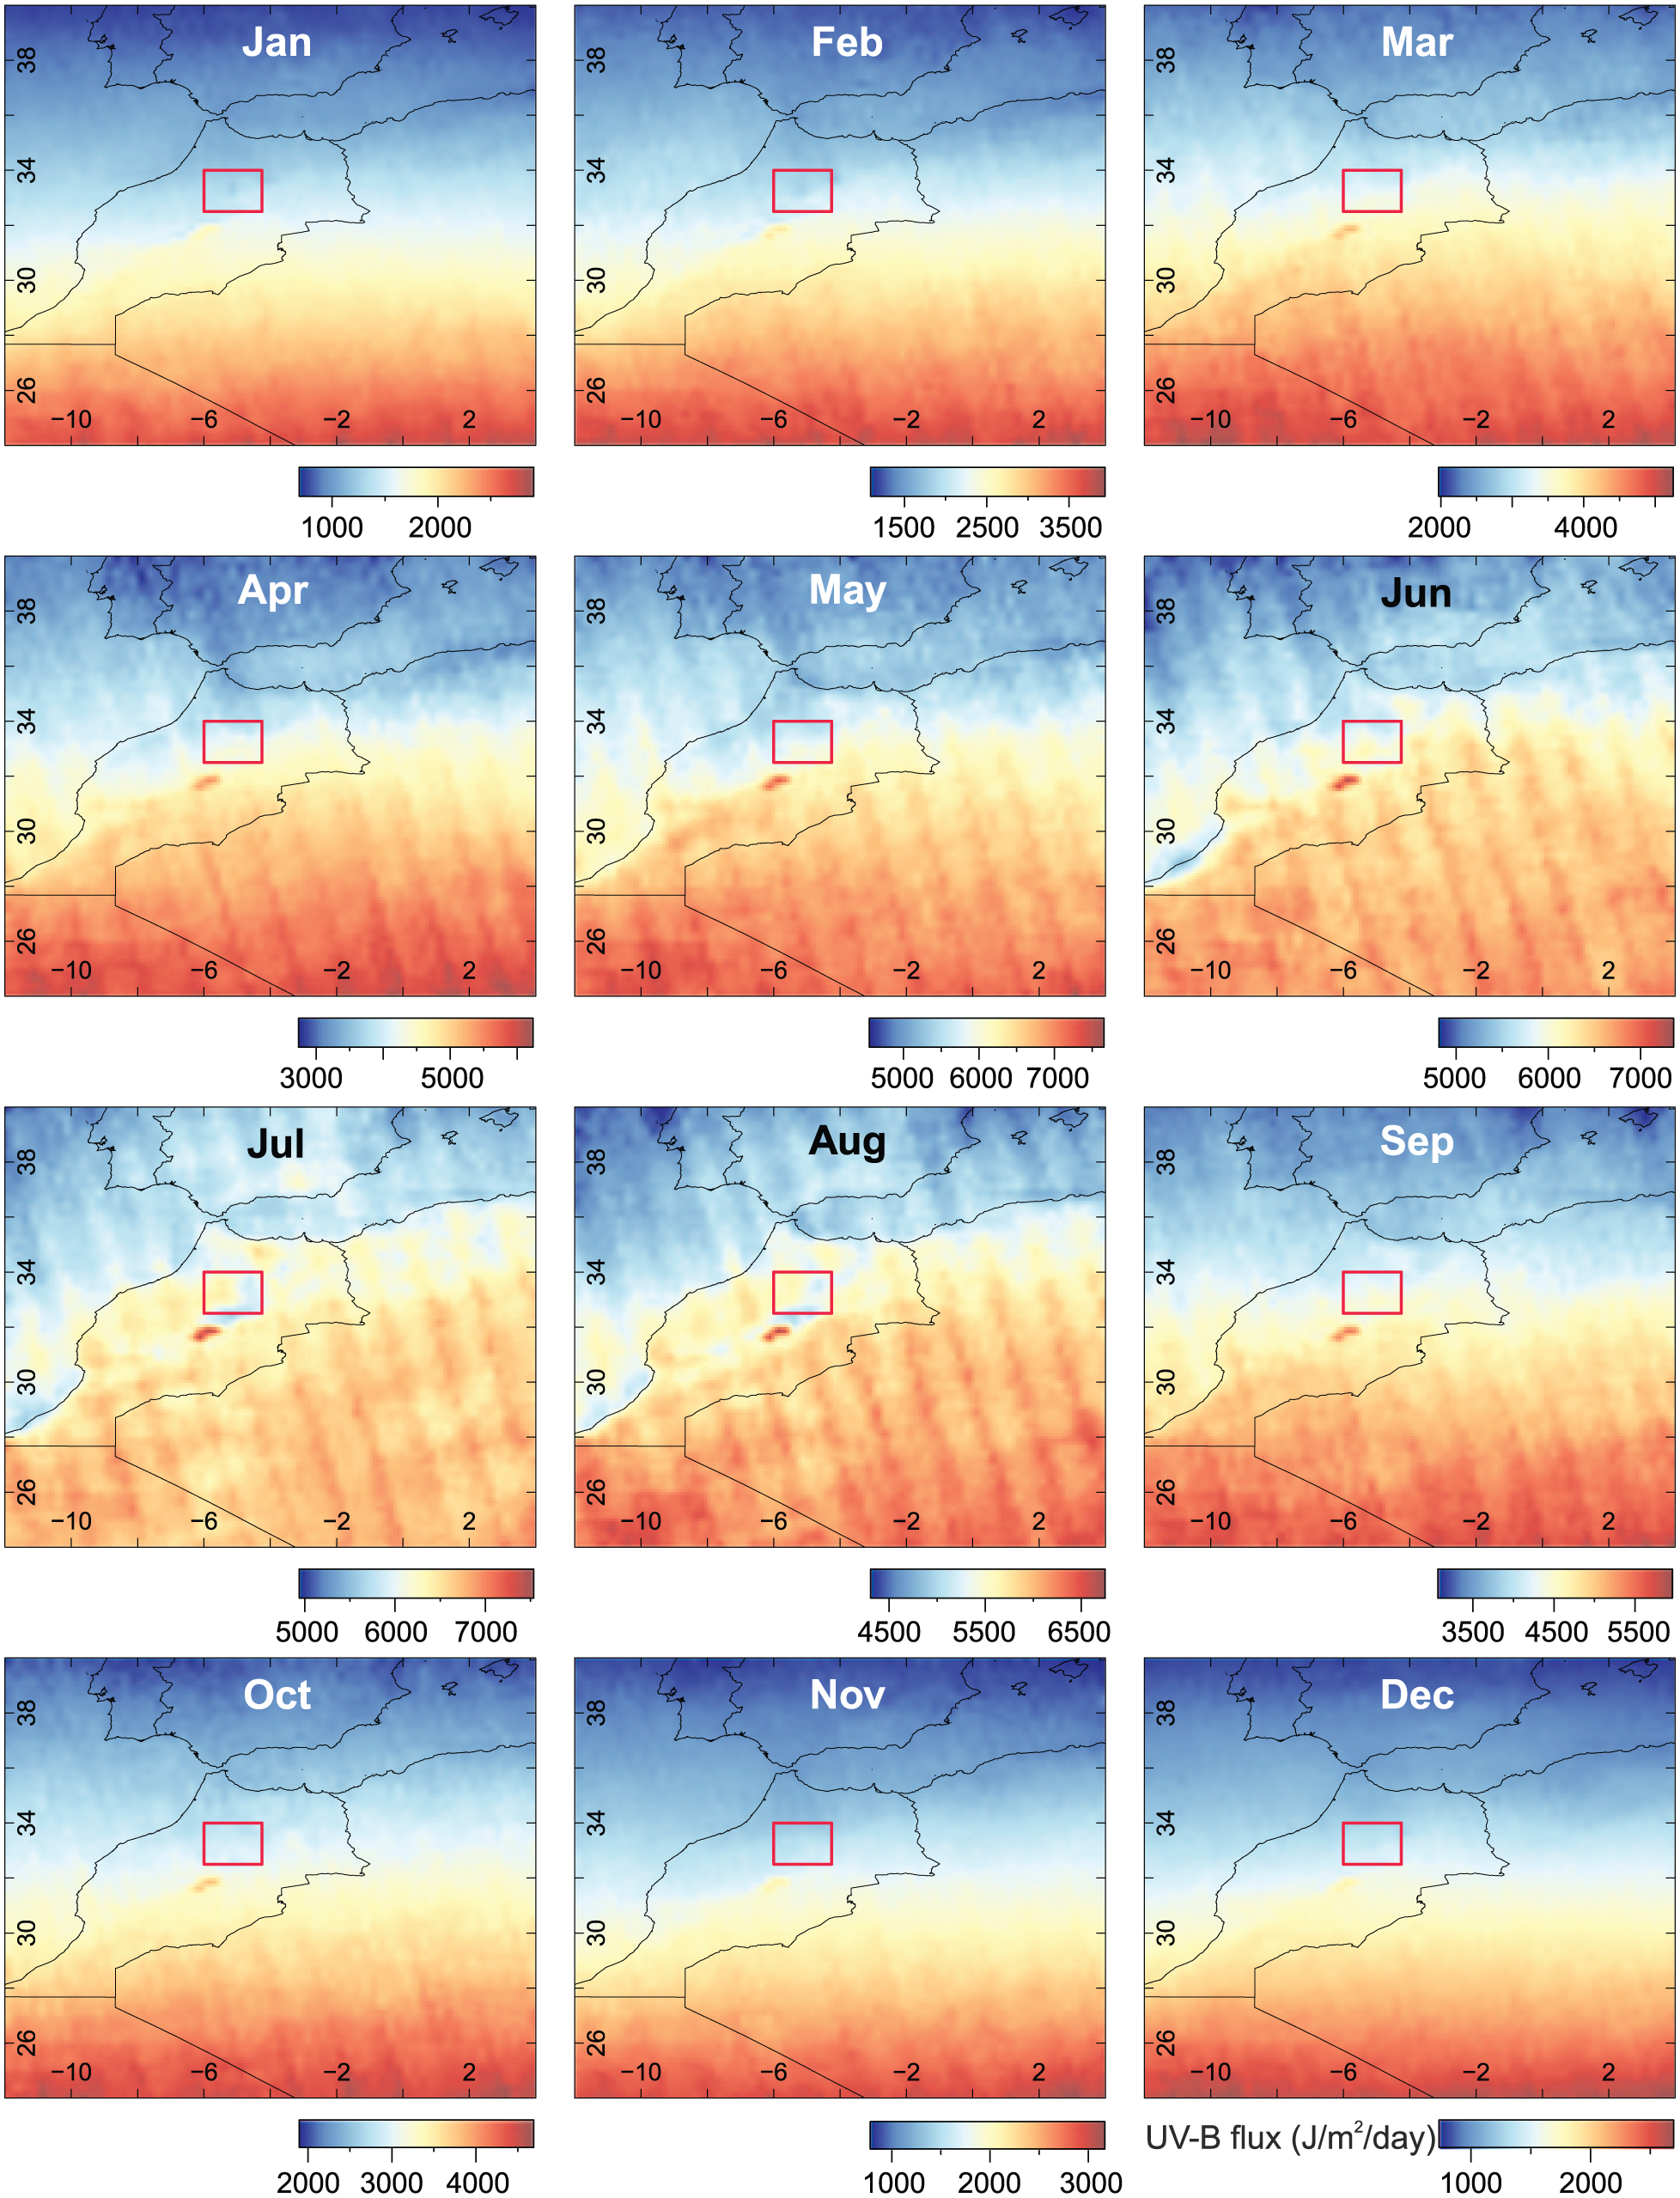
Pattern of monthly UV-B flux across Northwest Africa. Note that scale changes for each month. Box indicates Middle Atlas study area. UV-B data interpolated from glUV global datasets (Beckmann et al., 2014).
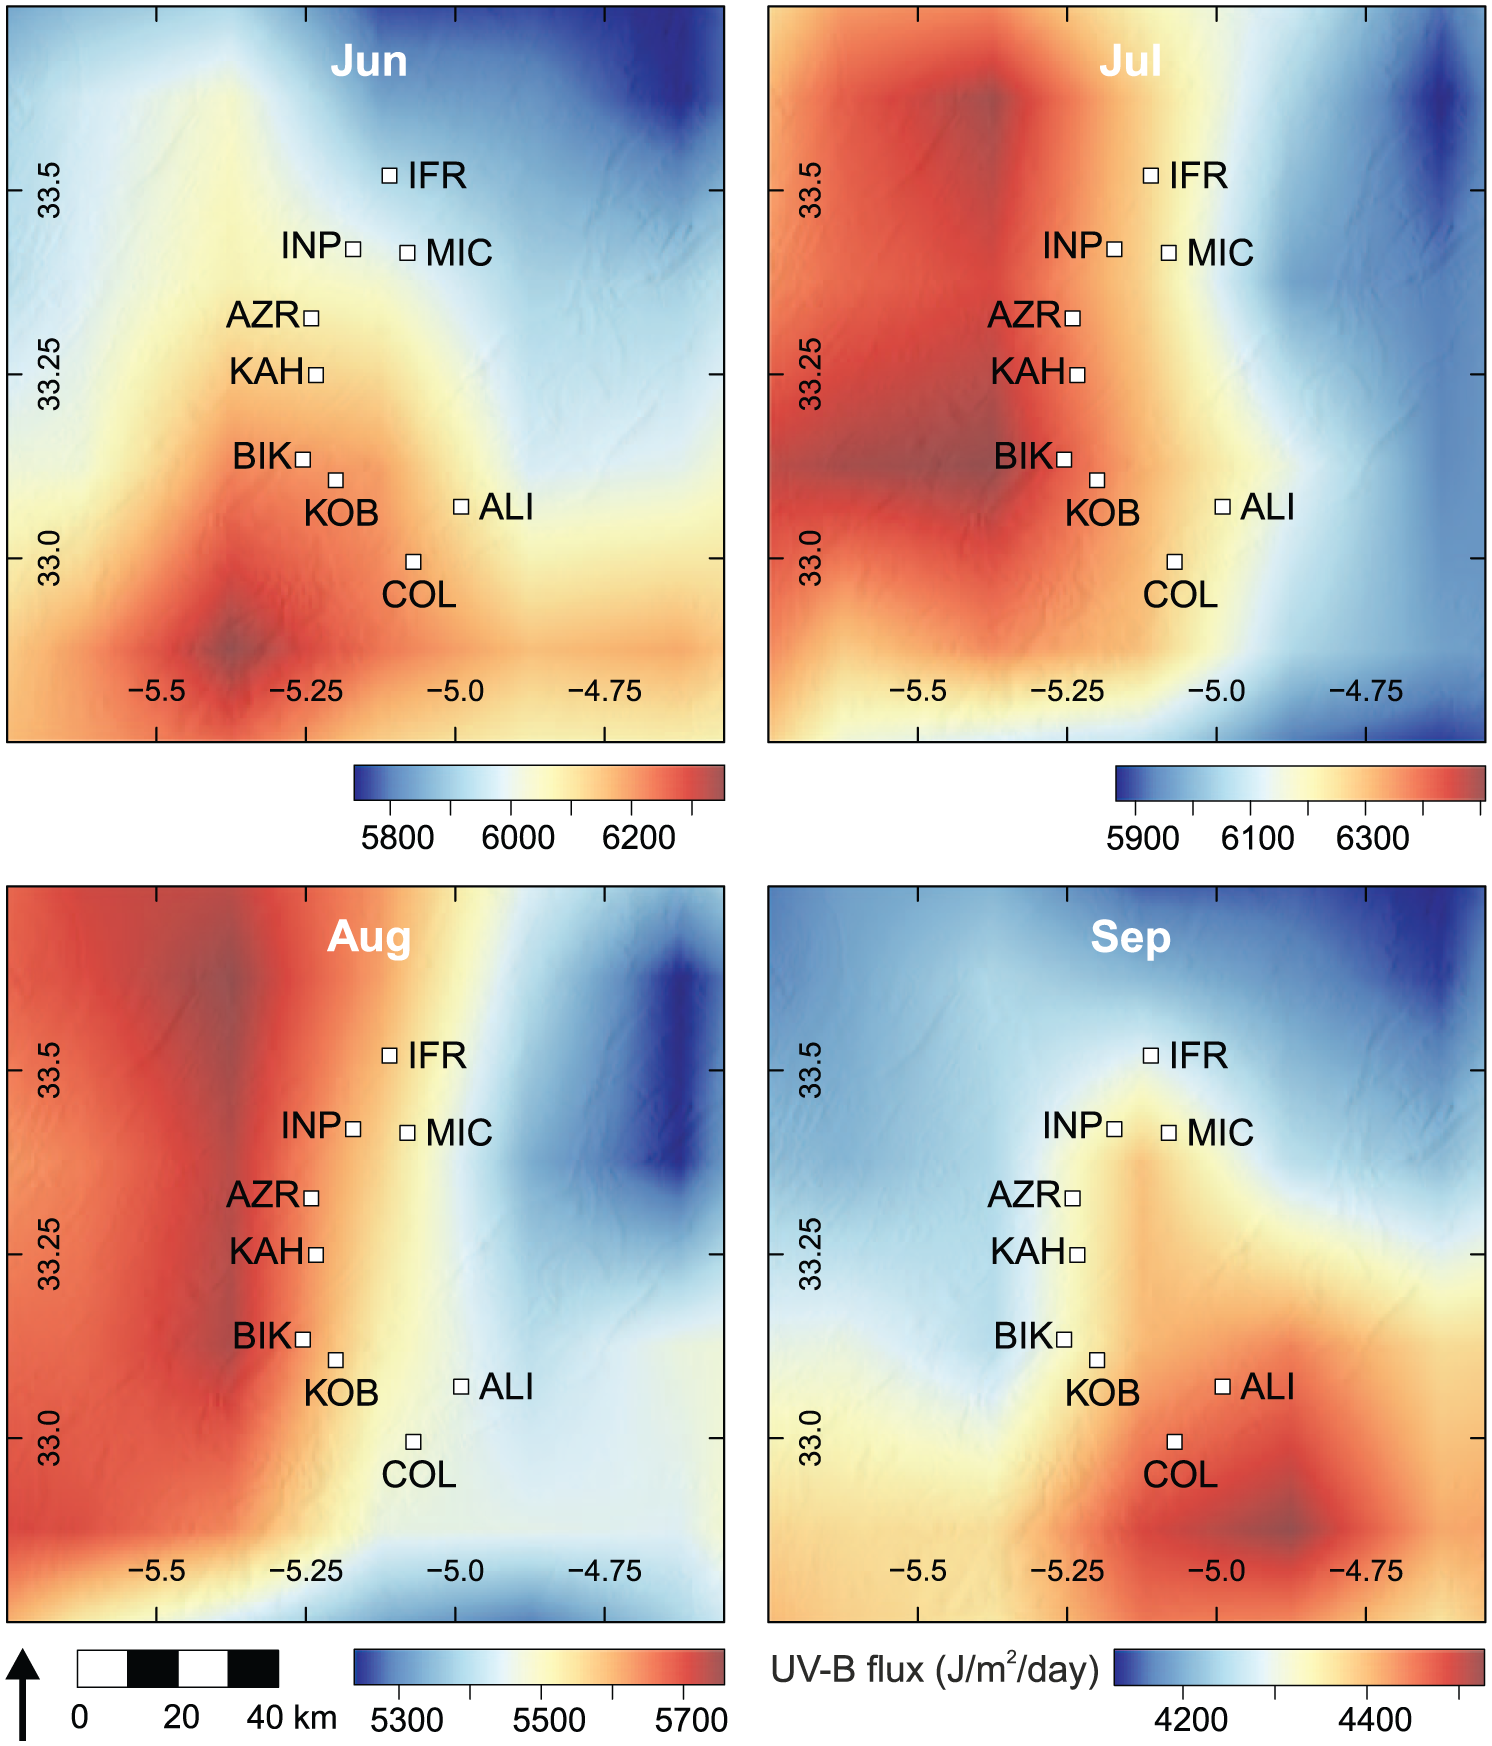
Pattern of UV-B flux over the Middle Atlas during the summer months and early autumn. Note that scale changes for each month. Boxes indicate sampling locations. UV-B data interpolated from glUV global datasets (Beckmann et al., 2014).
The pattern of UV-B flux in the Middle Atlas likely explains why we do not observe a strong altitudinal gradient in UAC abundance for Cedrus atlantica, as UV-B flux is lower at higher altitudes in the Middle Atlas during the summer. This may be a result of local climate conditions, such as increased cloudiness or fog which can reduce UV-B flux exposure (e.g. Caldwell, 1968; Körner, 2003). In the area around Lake Sidi Ali (~2000 m a.s.l), precipitation is higher during the summer months due to convective storm activity (Born et al., 2010) compared with areas further north near Ifrane (~1600 m a.s.l) (Bell et al., 2017; Sayad et al., 2011). The increased precipitation and storm activity may have a corresponding increase in cloud cover, which could reduce UV-B exposure. Körner (2007) states that while there is a global trend of increasing peak solar radiation with increasing altitude, no global trend exists for mean daily or seasonal solar radiation, which is clearly evident in the Middle Atlas. The results highlight the importance of establishing UV-B proxies using samples obtained from the region of interest, as samples collected over large environmental gradients may not exhibit the expected UV-B response if UV-B flux does not follow expected global patterns, as observed in the Middle Atlas.
UACs in pollen samples from outside Morocco
Our results show that pollen samples obtained from Cedrus atlantica trees growing outside their native range have an independent relationship with summer UV-B flux from those growing in Morocco. There was no significant relationship between UAC abundance and UV-B flux when all samples across the entire environmental gradient were considered. In some cases, trees growing outside Morocco which receive half the summer UV-B flux compared with Middle Atlas samples have the same or higher abundance of UACs as their Moroccan counterparts.
As the chemical composition of Cedrus atlantica sporopollenin includes both FA and pCA, it is anticipated that its pollen will contain some level of these compounds regardless of UV-B exposure. Nevertheless, the high levels of UACs detected in some non-Moroccan samples are surprising and may point to as yet unidentified controls on UAC abundance. These might include environmental factors, such as macro- and micro-climatic site characteristics or interactions with atmospheric or soil biogeochemistry. Alternatively, as discussed below, there may be a role for inherited characteristics, either linked to the genetic make-up of trees from different source populations or transgenerational ‘memory’ of UV stress in the parent plants.
A heritable component of pollen UAC abundance?
An unexpected finding of our study is the tentative indication of possible genotypic influence on UAC abundance. Cedrus atlantica trees from Westonbirt, Paris and Boston originate from seed collected in Morocco (provenance is not known for Manchester, Bordeaux or Pyrenees samples), and we see similarities in the spectra of the fingerprint region between these non-native samples and Moroccan samples. Consider the Paris samples, two of which (FR_PAR_01 and FR_PAR_02) originate from near Lac Ouiouane, Middle Atlas, close to the Bikrit sampling area in this study. The spectra from these Paris samples closely resemble the Bikrit spectra (Figure 9a). The other Paris samples (FR_PAR_03 and FR_PAR_04) where provenance is the Rif Mountains have spectra that closely resemble Rif samples, particularly sample MA_RIF_75. The aromatic peak height ~1516 cm−1 of FR_PAR_03 is identical to MA_RIF_75, while the other Paris sample is only slightly higher (Figure 9b). Paris samples received a mean summer UV-B flux of 3380 J/m2/day compared with 6084 J/m2/day for Bikrit and 5792 J/m2/day for the Rif sample. If environmental influences were the sole reason for the differences in the FTIR spectra between the ‘Rif’ and ‘Middle Atlas’ samples, then one would also expect all the samples grown in Paris under the same environmental conditions to have similar FTIR spectra. However, the FTIR spectra of the Paris samples and their UAC abundance closely match samples from their place of origin.
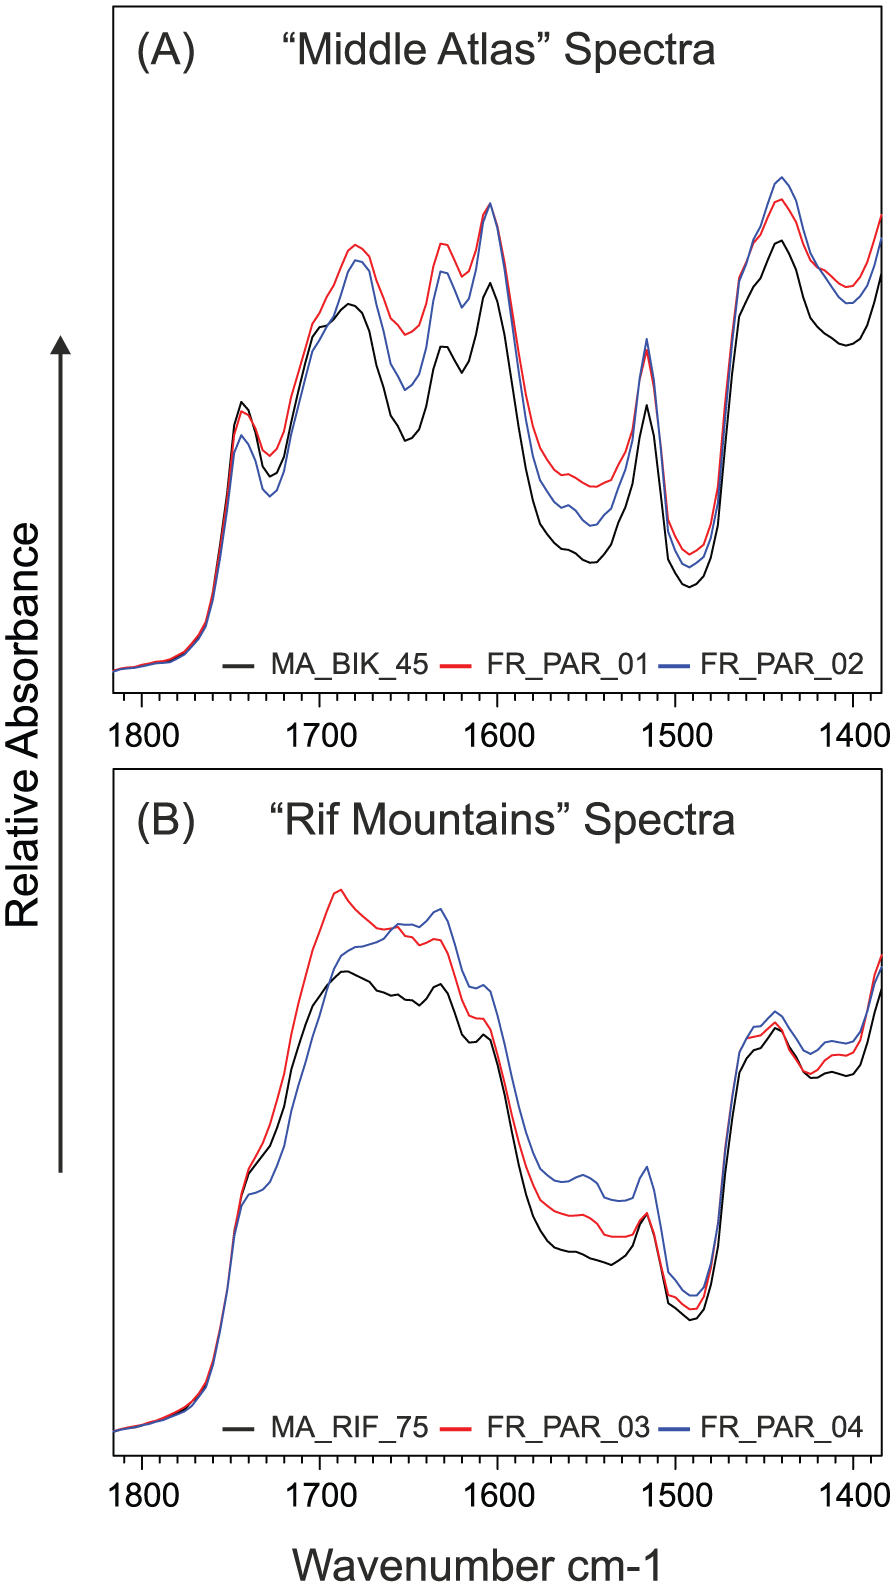
FTIR spectra showing strong similarities between Paris Botanical Garden samples and native samples from: (A) Middle Atlas, and (B) Rif Mountains, between wavenumbers 1800 and 1400 cm−1.
We postulate that a ‘baseline abundance’ of UACs in pollen may be determined by the UV-B exposure received by the parent trees in their native environment. Recent research reveals that such ‘transgenerational memory’ in plants is both mechanistically possible and probably of great significance in adaptation to environmental challenges (e.g. Annacondia et al., 2018; Kinoshita and Seki, 2014; Mirouze and Paszkowski, 2011). In Arabidopsis, elevated solar UV-B doses result in somatic homologous DNA rearrangements and increased expression of genes implicated in DNA repair pathways, photoreactivation and recombination repair (Ries et al., 2000). Furthermore, genomic changes in Arabidopsis are evident not only in treated individuals but also persist in subsequent, untreated generations (Molinier et al., 2006).
Compared with annual plants, the study of epigenetic memory in conifers is difficult due to long lifetime, slow reproduction rates and large genomes (Yakovlev et al., 2012). However, conifers have a high abundance of epigenetic mechanisms in place to control the repetitive parts of the genome and are thus particularly important targets for improving the understanding of transgenerational memory of environmental stressors (Rohde and Junttila, 2008). Epigenetics are implicated, for example, in the inheritance of phenology traits such as timing of bud burst in Picea abies, Picea glauca, Picea engelmannii and Pinus sylvestris (Rohde and Junttila, 2008), as well as in resistance to insect and pathogen attack in Pinaceae (Bonello et al., 2006).
In light of these studies, we speculate that an epigenetic-based UV-B memory might account for similar baseline levels of UACs observed in non-Moroccan and Moroccan samples. Trees grown in locations outside their native environment, which experience lower UV-B flux but originate from seed from Morocco, would effectively have a higher abundance of UACs than would be expected for that location. As we observe a similar response to summer UV-B flux independently in both non-Moroccan and Moroccan samples, it suggests that non-native trees continue to produce UACs in pollen in response to UV-B exposure, despite the pollen already comprising an abundance of UACs already exceeding the level necessary for protection against UV-B exposure. The relative role of epigenetics and physiological plasticity in UV-B response in plants remains an open question and linking plant UV-B responses to epigenetic memory may yet be largely speculative (Muller-Xing et al., 2014). However, this uncertainty presents an exciting opportunity for further research incorporating UAC determinations on pollen.
Overall, these observations should be treated with caution due to the limited number of samples analysed from outside the Middle Atlas. The tentative finding of population differences in UAC abundance is also surprising given the generally weak evidence for spatial structures in genetic diversity of Cedrus atlantica (Cheddadi et al., 2009; Renau-Morata et al., 2005; Terrab et al., 2006, 2008). Considerable gene flow across major geographical ranges is evident, and Middle Atlas and Rif populations are not clearly differentiated by these studies. Indeed, different populations in the Middle Atlas reveal phylogenetic proximity with spatially disparate populations in the Rif, High Atlas and Algeria (Cheddadi et al., 2009; Terrab et al., 2008).
However, further research incorporating genetic information into the research design is necessary to rule out possible influence of genetic population structures on UAC abundance patterns. FTIR spectra have been used to explore linkages between pollen properties and genetics structure (e.g. Julier et al., 2016; Zimmermann, 2017; Zimmermann and Kohler, 2014; Zimmermann et al., 2015). Further systematic translocation studies including investigation of botanical garden specimens of known provenance could prove informative.
Cedrus atlantica UAC abundance as a UV-B proxy
There is a significant relationship between the abundance of UACs measured using FTIR spectrometry and summer UV-B flux, which suggests the production of UACs in Cedrus atlantica pollen increases in response to increasing UV-B flux. This relationship was strongest when UACs were quantified by using the ratio of the aromatic peak (~1516 cm−1) to the OH peak (~3300 cm−1) as per Lomax et al. (2008). Critically, we demonstrate a highly significant empirical relationship between summer UV-B flux and UACs in trees growing in their native environment. Moreover, the UAC response appears highly sensitive, that is, values for the aromatic−OH peak ratios change rapidly across a fairly short UV-B gradient within Morocco. We consider these essential prerequisites for future application of pollen UACs from Cedrus atlantica as a UV-B proxy.
Trees growing outside their native environment also show generally higher UAC abundance with higher summer UV-B doses, but the values are ‘out of line’ with the native samples. We do not consider this discrepancy to be detrimental to future proxy application. Rather, it provides an important reminder of the as yet incomplete knowledge of the physiological and genetic mechanisms governing UV response (section ‘UACs in pollen samples from outside Morocco’). Overall, many differences in growth conditions between native and botanical garden specimens may be anticipated, and different provenance of the seed-stock introduces a further (and sometimes unknown) variable. Consequently, we suggest that UV-B proxies should be established using only native samples from the region of interest.
The apparent strength of the relationship in Morocco may be overly influenced by the Rif sample group. However, when this sample group is excluded from analysis, the relationship still stands (albeit lower r2). This indicates the sensitivity of UACs in pollen to summer UV-B flux across a relatively small environmental gradient. Additional samples from the Rif and the High Atlas are needed to confirm the strong relationship observed with summer UV-B flux across an extended Moroccan UV-B gradient.
The greatest focus for palaeo-climatic research in Morocco has so far been the Middle Atlas, and thus, the region provides a good basis to explore UV-B reconstructions from fossil Cedrus pollen records. For example, a continuous record of Cedrus pollen is found at Lake Sidi Ali for the past ~11,000 years (Campbell et al., 2017; Zielhofer et al., 2017), while the Lake Ifrah record shows the presence of Cedrus pollen during the past ~29,000 years (Rhoujjati et al., 2010). The Cedrus pollen in these records is almost certainly from one species, Cedrus atlantica, which is constrained to the montane bioclimatic zone, so any changes recorded in UAC abundance would not result from potential differences in response to UV-B flux between different species. This taxonomic and ecological specificity should be advantageous as compared with approaches using pollen types identifiable only at the genus (e.g. Pinus) or family (e.g. Poaceae) level.
Untreated modern pollen samples contain additional components (e.g. lipids, proteins, cytoplasm) that are not present in fossil pollen or sporopollenin. Early work by Rozema et al., (2001b) showed that UV-B absorbance was largest in the sporopollenin fraction of pollen, while the cytoplasm and wall-bound fractions had lower absorbance of UV-B. Isolation of sporopollenin from modern pollen using standard palynological preparation techniques such as acetolysis could significantly alter the geochemical signal (e.g. Blokker et al., 2005; Jardine et al., 2015). In these studies, cold acetolysis treatment had a more limited effect on the FTIR spectra of pollen. Although this treatment resulted in reduced aromatic peak heights compared with untreated samples, crucially the aromatic gradient remained (Jardine et al., 2017), that is, a similar response to UV-B flux was found in untreated and treated pollen. Jardine et al. (2017) also found that the UAC peak was clearly distinguishable in FTIR spectra of untreated pollen samples and not altered by the non-sporopollenin components, which our study confirmed for Cedrus atlantica pollen.
Overall, the results of this study suggest that UACs in Cedrus atlantica pollen could be used as a proxy for the reconstruction of historic summer UV-B flux for Northwest Africa for at least the Holocene and Late Glacial Period. Although we observe variations in UAC abundance between pollen samples from individual trees in the same geographical areas, the average UAC abundance for samples from the same area has a strong relationship with summer UV-B flux. As fossil Cedrus atlantica pollen assemblages will comprise pollen derived from many trees within the local area (Bell and Fletcher, 2016), sub-fossil samples should effectively provide an average representation of local environmental conditions. These findings confirm the potential for a pollen-based UV-B proxy (e.g. Blokker et al., 2005, 2006; Fraser et al., 2011; Jardine et al., 2016; Lomax et al., 2008; Rozema et al., 2001b; Willis et al., 2011).
Conclusion
Cedrus atlantica pollen samples contain high levels of FA and pCA that are detectable using THM-GC-MS, while functional groups associated with these compounds are detectable using FTIR spectrometry. These compounds increase in response to higher summer UV-B flux. This relationship is observed independently in native Moroccan samples and non-Moroccan samples. However, samples from trees grown outside Morocco exhibit unexpectedly high UAC levels, which suggests there may be other environmental or genetic factors influencing UAC abundance. For a small subset of our data, we highlight similarities in FTIR spectra between seed-grown trees of known provenance and native trees from the original source regions (Middle Atlas or Rif); this serendipitous observation raises the intriguing possibility that epigenetics play a role in transgenerational similarities in UAC production.
Consequently, we recommend that establishment of UV-B proxies should be made using pollen samples collected from native specimens from within the region of interest. Calibration datasets spanning large environmental gradients which are often used in palaeo-climatic and palaeo-environmental studies may conceal strong responses to local variations in UV-B flux, as is evident in the Middle Atlas. Overall, the strong positive relationship we observe between UAC abundance and summer UV-B flux in modern Cedrus atlantica pollen samples from Morocco supports the future application of UACs in fossil pollen as a proxy to reconstruct historic summer UV-B flux for Northwest Africa.
Supplemental Material
HOL_Supplementary_Material – Supplemental material for UV-B-absorbing compounds in modern Cedrus atlantica pollen: The potential for a summer UV-B proxy for Northwest Africa
Supplemental material, HOL_Supplementary_Material for UV-B-absorbing compounds in modern Cedrus atlantica pollen: The potential for a summer UV-B proxy for Northwest Africa by Benjamin A Bell, William J Fletcher, Peter Ryan, Alistair WR Seddon, Roy A Wogelius and Rachid Ilmen in The Holocene
Footnotes
Acknowledgements
Fieldwork was carried out with assistance from the Haut Commissariat aux Eaux et Forêts et à la Lutte Contre la Désertification, Morocco, with thanks to Said Hajib. We thank Bart van Dongen (University of Manchester) for early testing of THM-GC-MS and Wesley Fraser (Oxford Brookes University) for useful discussions on FTIR analysis. In addition, we thank Rachel Hurley, John Moore, Jonathan Yarwood, Tom Bishop and Heath Bagshaw (University of Manchester) for field and laboratory assistance. Non-Moroccan pollen samples were kindly supplied by Penny Jones (Westonbirt Arboretum), Martin Gardner (Royal Botanical Gardens, Edinburgh), Kathryn Richardson (Arnold Arboretum, Harvard University), Stéphanie Desprat (EPHE, Bordeaux), Daniel Gómez (Instituto Pirenaico de Ecología, Spain) and the Paris Botanical Gardens. Finally, we thank the anonymous reviewers for their constructive comments and useful feedback to improve the final manuscript.
Funding
This work was supported by an Engineering and Physical Sciences Research Council (EPSRC) studentship award (Ref: 1478466). AWRS is supported by a Norwegian Research Council FRIPRO project (PollChem Project number 249844).
Supplementary material
Explanatory notes for supplementary material: Detailed information for every sample used in this study FTIR spectra for each sample, including the uncorrected, baseline corrected, and Z-score standardised spectra PCA loadings scores figure Regression model coefficients for Figure 6 Nitrogen data for pollen samples
References
Supplementary Material
Please find the following supplemental material available below.
For Open Access articles published under a Creative Commons License, all supplemental material carries the same license as the article it is associated with.
For non-Open Access articles published, all supplemental material carries a non-exclusive license, and permission requests for re-use of supplemental material or any part of supplemental material shall be sent directly to the copyright owner as specified in the copyright notice associated with the article.