
Abstract
This study uses data from a continuous employee web-survey to investigate the trade-off between wage and workforce adjustments and the role of industrial relations in firm-level responses to the economic crisis in Germany and the Netherlands. Workforce adjustments seemed to be a continuous organizational strategy, but wage adjustments were less often reported. We found no large-scale evidence of wage concessions being traded-off for job protection in the two countries. Collective bargaining ensured that wage-setting was more robust than employment protection: employees covered by collective agreements reported workforce adjustments more often than wage adjustments. Low-educated and low-wage employees reported basic wage reductions more often: the economic crisis increased wage inequality. Labour hoarding was reported predominantly by young, male employees with a permanent, full-time contract.
Keywords
Introduction
There have been many studies of policy responses to the recent economic and financial crisis (ILO/World Bank, 2012), but fewer have analysed company-level responses. This limits our empirical and theoretical understanding of its effects. This article adds to the body of knowledge by using survey data from employees in Germany and the Netherlands to investigate in detail the trade-off between wage and workforce adjustments, and the role of industrial relations processes. Surveys of employees allow more detailed analysis of the adjustment processes at workplace level than is possible with employer surveys or administrative data. Our first objective is to explore the extent to which organizations use wage or workforce adjustments to adapt to falling demand caused by the economic crisis. Second, we ask how far there is a trade-off between wage concessions and job protection. Third, we examine how industrial relations processes, and in particular collective bargaining, affect wage and workforce adjustments. Finally, we consider how wage or workforce adjustments affect perceptions of job security.
The choice of a German–Dutch comparison was inspired by discussion among the authors about the crisis responses of firms in the two superficially similar economies. In both countries, governments applied short-term work (STW) arrangements. However, industrial relations differed notably with respect to collective bargaining coverage, which was higher in the Netherlands. Collective agreements normally affect wages to a larger extent than employment levels. Would this hold true in crisis conditions, and could we expect more wage adjustments in Germany and more workforce adjustments in the Netherlands? To investigate these questions we included six additional items in the German and Dutch survey of a global, continuous web-survey on work and wages in which we were involved, asking employees how the economic crisis had affected themselves and their workplaces. The data were collected between August 2009 and December 2010, generating 36,130 observations and allowing detailed analysis of employee reporting of the economic crisis.
In this article we first outline the two national contexts and review the literature with respect to firm-level adjustment strategies; next we detail the hypotheses, data and methods. We then present the findings and finally end with conclusions and discussion.
Factors influencing wage and workforce adjustments
The economic context in Germany and the Netherlands
In the crisis years 2008 to 2010, according to Eurostat data, trends in employment and unemployment were initially similar in both countries, but they diverged in 2010. While German employment (headcount) fell by 0.2 percent in 2009 and increased by 0.1 percent in 2010, the Dutch equivalent remained constant in 2009 and fell by 0.2 percent in 2010. In both countries the unemployment rate rose in 2009, though somewhat faster in the Netherlands; in 2010 unemployment in Germany fell, even below its 2008 level, whereas it continued to increase in the Netherlands. GDP in both Germany and the Netherlands reached its lowest point in the first quarter of 2009, though German economic growth fell slightly more than Dutch. Thereafter, the German economy grew in real terms by 3.6 percent, but the Dutch by only 1.7 percent. Thus the economic downturn was more serious in Germany than in the Netherlands, but the recovery was stronger, both in terms of GDP and in terms of employment and unemployment. The much weaker performance of the Dutch construction sector compared to its German counterpart was a significant factor. In both countries, recovery was clearly export-led, though more evidently in Germany, where industrial production dominates exports. Dutch exports, by contrast, are dominated by food and agricultural products and energy (Burda and Hunt, 2011; CBS, 2011; Van de Belt and Struijs, 2011). Hence analyses of work and workforce adjustments needed to be controlled for time periods and for export industries.
Both governments implemented crisis adjustment strategies to avoid steep rises in unemployment. The most important was STW, in Germany called Kurzarbeit and in the Netherlands Deeltijd-WW. Employers could apply for temporary state assistance to top up wages of employees working reduced hours. By May 2009, Kurzarbeit affected 64,000 companies and approximately 1.5 million employees; but by December these numbers had fallen to 53,000 and 800,000 respectively, hence a decrease in the average number of Kurzarbeiter per company (from 23 to 15) (Brenke et al., 2010).
In the Netherlands, 770 companies used the STW scheme in the first four months of 2009. Between April 2009 and December 2010, 7800 companies applied for assistance for 76,000 employees (press release, SZW, 20 January 2011). Unfortunately, no indication was given of the numbers approved. According to an employer survey, 9.5 percent of private companies had used Deeltijd-WW between November 2008 and summer 2010 (Josten, 2011). Though the data are incomplete and not easy to compare, we estimate that in 2009 about 15 times more German than Dutch companies used STW schemes, involving 25 to 27 times more employees. Since the number of companies and the size of the labour force are nearly five times as great in Germany as in the Netherlands, German companies were three times more likely to use STW schemes, involving five times as many employees. The relative differences were somewhat less in 2010, but the fact remains that Kurzarbeit was much more widely applied than the more restrictive Deeltijd-WW. This underlines the importance of controlling analysis for time periods, since the proportion of employees working in crisis-hit organizations closely reflects changes in GDP over time, and changes faster in export-led industries.
In summary, this paragraph shows that labour hoarding can expected to be a major workforce adjustment strategy in both countries, but particularly in Germany.
Company responses to the crisis: Wage and workforce reductions
How far did organizations use wage or workforce adjustments, including labour hoarding, when adapting to a falling demand; and were wage concessions traded off for job protection? Economic models assume an inverse relationship between wages and employment, but the empirical literature barely addresses the trade-off between wage and employment adjustments. One Japanese survey showed that when firms needed to reduce labour costs substantially they often laid off core employees, whereas adjustments in wages were more likely if pressures were less (Ariga and Kambayashi, 2010). In Germany and the Netherlands, surveys typically ask if the firm has applied any crisis measures, listing a range of responses, such as postponing or cancelling investments and cost saving.
The IAB-Betriebspanel allows detailed analysis of firms’ use of labour (Dietz et al., 2010), and there have been other German studies in this field. Boysen-Hogrefe and Groll (2010) explain the small increase in German unemployment relative to the large GDP fall in 2009 mainly by firms’ good financial position, reflecting both wage moderation and the stock of hours in working-time accounts accumulated before the crisis. Hence German firms affected by the crisis resorted much more to internal adjustment (labour hoarding) than external (dismissals). Working-time accounts and annualized hours formed a buffer stock that allowed firm-level adaptation to lower levels of production and servicing without substantial lay-offs (Möller, 2010). In 2008, many working-time account arrangements were revised, imposing a prolonged Christmas holiday break (Glassner and Galgóczi, 2009).
In the Netherlands, a survey suggested that firms concentrated reductions in the volume of paid overtime and pressed staff to take holidays (Van der Ende et al., 2010). The country’s relatively large share of flexible workers made it rational and relatively easy for employers to implement hiring freezes, reduce temporary work and end temporary contracts. In autumn 2009, about a quarter of private employers reducing their workforce had used these measures (Josten, 2011). Temporary agency workers were the first group targeted, followed by self-employed contract staff (Van der Ende et al., 2010).
In Germany Kurzarbeit, albeit an important instrument, only accounted for a third of the observed working-time reduction in 2008–09; other practices, according to Boysen-Hogrefe and Groll (2010), were reductions of working hours with proportional reduction in pay, reductions in paid overtime and in the positive balances in the working time accounts and a trend to part-time employment. The reluctance of firms to fire permanent staff is partly attributable to the difficulties they experienced in finding skilled workers during the economic boom of the mid-2000s (Boysen-Hogrefe and Groll, 2010; Dietz et al., 2010). Similar arguments can be applied to Dutch firms, though the relationship with ‘skills’ was less clear than in Germany. Three surveys reported that between 13 and 19 percent of Dutch employers hoarded staff, of which two-thirds did so to avoid the loss of employees who would be needed in the event of a recovery (Intomart, 2010; Van der Ende et al., 2010). In a third survey an unspecified proportion of employers indicated they were keeping surplus employees because ‘good staff’ would be needed later (Josten, 2011).
Collective bargaining responses to the crisis
How did industrial relations, and more particularly collective bargaining, influence wage and workforce adjustments; and were their effects the same for all employees? The literature on wage determination through collective bargaining was reviewed by Kaufman (2000), who concluded that unions placed more weight on wages than on employment, that ‘insider’ members exerted more influence on wage policy than did ‘outsiders’ and that members’ wage preferences systematically differed according to personal characteristics. Stabilizing the level of employment was less often addressed in collective agreements, though to a larger extent in the public sector than in the private. Kaufman concluded that only since the 1990s had economists seriously addressed the impact of unionism on employment growth, partly because the relationship was complex. Views differed concerning the effects of unions on the wages and employment of non-union workers (Ruiz-Verdú, 2004). Here, we expect that employees covered by a collective agreement would report wage adjustments less often and workforce adjustments more often than those not covered.
In Germany and the Netherlands, collective bargaining patterns have diverged over the past two decades. German bargaining coverage has fallen considerably, from 72 percent in 1990 to 61 percent in 2009 (Bispinck and Schulten, 2010; European Commission, 2011), largely because of declining membership in employer’ organizations. By contrast, coverage in the Netherlands has been more stable; since 1990 it has fluctuated between 78 and 85 percent, without a clear trend. The continuously high membership density of employers’ organizations has been crucial; in addition, 3 to 5 percent of all employees are covered because of the mandatory extension of industry-wide agreements (European Commission, 2011; Van Klaveren and Tijdens, 2008).
Germany has seen a marked trend towards the use of opening clauses in sectoral agreements. In exchange for employee concessions on pay and working time, employers usually offered job protection (Glassner and Galgóczi, 2009). The 2010 WSI-Betriebs- und Personalrätebefragung, a representative survey of establishments with at least 20 employees and a works council, showed that an opening clause was in use in 58 percent of establishments. One-third of these clauses introduced variable working time; 18 percent extended the agreed working time, and 7 percent temporarily reduced it. Pay-related issues were less widespread; in 13 percent of clauses an already agreed pay increase was deferred and in 6 percent basic pay was reduced (Bispinck and Schulten, 2010). In contrast, in the Netherlands in 2009–10 no wage opening clauses were reported (Harteveld, 2012). In response to the crisis, the Dutch social partners have reduced the duration of collective agreements, sometimes from two years to six months, as at the Corus/Tata steelworks, thus creating more opportunities to renegotiate the agreement (AIAS-ETUI Collective Bargaining Newsletter, monthly issues 2009 and 2010). A firm-level survey confirmed that very few firms had lowered basic wages in 2009 or expected to do so in 2010 (Van der Ende et al., 2010). Hence our expectation that employees covered by a collective agreement would report wage adjustments less often and workforce adjustments more often, might only be confirmed for the Netherlands and not for Germany.
Job insecurity resulting from wage and workforce adjustments
Did wage or workforce adjustments affect employees’ perceptions of job security; and if so, did it affect all employees equally? Few studies have related job security to firm-level policies or organizational changes. Using country- and individual-level data, Chung and Van Oorschot (2011) found that differences in economic and labour market conditions between countries better explained employees’ perceived job insecurity than differences in government employment and income policies. Using repeated cross-sectional data, Olsen et al. (2010) observed a convergence in job insecurity and work intensity over time. They assumed that this may reflect a ‘lean and mean’ management strategy. Hence, we expect that workforce adjustments affect employees’ self-perceived job security to a larger extent than wage adjustments.
The literature relates self-perceived job security predominantly to job-related and individual characteristics. Saloniemi and Zeytinoglu (2007), for example, concluded that fixed-term workers in both Finland and Canada felt more insecure than those in permanent jobs. This finding was confirmed in a study of five European countries, using data from earlier WageIndicator web-surveys (Muñoz de Bustillo and De Pedraza, 2010). In the UK, Campbell et al. (2008) found that previous personal experiences of unemployment affected self-perceived job insecurity, whereas educational level, gender, occupation or industry were not important determinants. For gender this was confirmed among others by Erlinghagen (2007) and Muñoz de Bustillo and De Pedraza (2010). We will control our analyses for a range of individual characteristics.
Objectives, data and method
Hypotheses
At the outset we formulated four research objectives, which are here presented as hypotheses. The first objective was to explore whether organizations used wage or workforce adjustments to reductions in demand caused by the economic crisis. We expect that: H1: In crisis-hit organizations, wage and workforce adjustments are reported in both countries and across all quarters equally, whereas no adjustments are reported in organizations that are not hit by the crisis.
The second objective was to explore whether wage concessions were traded off for job protection or if adjustments were cumulative, expecting that: H2a: If wage adjustments are reported in crisis-hit organizations, no workforce adjustments are reported, and vice versa; or conversely H2b: If adjustments are reported in crisis-hit organizations, these include both wage and workforce adjustments.
The third objective was to investigate how industrial relations and individual characteristics affect the reported wage and workforce adjustments, expecting that: H3a: Employees covered by a collective agreement report workforce adjustments more often and wage adjustments less often; and H3b: Vulnerable employees report both wage and workforce adjustments more often.
The fourth objective was to explore whether adjustments affected employees’ self-perceived job security, expecting that: H4a: Adjustments affect job insecurity, but workforce adjustments do so to a greater extent; and H4b: Vulnerable employees report job insecurity more often.
Survey and data
Between August 2009 and December 2010, six survey questions about the impact of the economic crisis on respondents and their organizations were included in German and Dutch web-surveys, coordinated by the authors in each country. These surveys are continuously posted on the Lohnspiegel and Loonwijzer websites, with information on such matters as occupational wages, vacancies and labour law. Every year these sites attract millions of visitors. On many pages in the websites, visitors are invited to complete the survey on work and wages. It should be noted that the invitation did not indicate that some survey questions related to the economic crisis. The two web-surveys are part of the worldwide WageIndicator web-surveys, which are comparable across countries, written in the national language(s), offer a lottery prize as an incentive to participate and have a completion time of approximately 10–15 minutes. There are questions concerning industry, occupation, wage, firm size, collective bargaining coverage, employment contract, working hours, age, gender, and education (Tijdens et al., 2010). Apart from the six survey questions on the economic crisis, the dataset is particularly suited for investigating employees’ experience of the crisis, because of the wide range of explanatory variables and because the survey is held continuously, allowing for comparisons over time.
The six crisis questions were targeted at respondents who had indicated being an employee, thus excluding the self-employed and unemployed. Hence who had lost their job as a result of the economic crisis were excluded, and there were no questions for unemployed respondents to identify the reasons for losing their last job. Our analyses only included employees who started their job with their current employer in 2009 or before; any 2010 job starters were assumed not to be aware of their organizations’ economic situation prior to their start date. The analysis only included respondents with valid answers to at least one crisis-item (Germany = 22,975; Netherlands =13,155). On average, Germany had more than 1350 respondents per month and the Netherlands almost 775. The six crisis questions altogether measured 26 items, of which 18 have been used in our analysis. Item non-response was low and showed no decline towards the end of the 17 months. Of the 36,130 respondents, 93.8 percent provided valid answers to all 18 items and 99.2 percent did so for at least 17 items.
As a volunteer web-survey, the WageIndicator is affected by selection bias, but the strength of this bias varies for different variables and across countries. The bias has been studied in great detail, comparing the 2006–07 WageIndicator web-surveys with reference surveys for the same populations, years and countries (Steinmetz et al., 2012). For Germany the Sozio-oekonomische Panel (SOEP) and for the Netherlands the OSA-Arbeidsaanbodpanel served as reference surveys. The bias was studied with respect to individual-level wages. For Germany, the average gross monthly wage in the web sample was around €172 higher than in the SOEP survey; for the Netherlands, the average net hourly wage in the WageIndicator sample (€10.9) was around € 0.6 lower than in the OSA survey (€11.5). To investigate the 2009–10 bias, the sample has been compared to labour force data, showing that women were underrepresented in the web-survey (DE, -9%; NL, -5%), age 40–65 was underrepresented (DE, -6%; NL, -9%), and age 15–24 was overrepresented (DE, +2%; NL, +9%). These deviations were not so strong that we needed to apply inter or intra-country weights to correct the bias.
Methods
To investigate the hypotheses, we recoded the 18 items in the crisis survey into five categories:
Workforce adjustments
reductions in the permanent workforce (hiring freezes, lay-offs, voluntary redundancies and early retirement)
reductions in the flexible workforce (lay-offs of temporary workers, non-extension of temporary contracts, freezes on new training places)
labour hoarding (working-time reduction, partial unemployment)
Wage adjustments
reductions in basic pay
reductions in benefits (reductions in allowances and benefits, bonuses and holiday pay)
The 18 questions and their recoding can be found in the appendix of Tijdens et al. (2011). Note that the survey questions about workforce adjustments were asked with respect to the employees’ workplaces, whereas questions about wage adjustments were asked with respect to the employees themselves, as we assumed employees would be more aware of workforce adjustments at the workplace than of wage adjustments for other workers.
The recoding supposed a clear definition of work and workforce adjustments. However, this was challenged by two open-ended survey questions, used extensively by respondents in both countries. They referred to a variety of downward wage adjustments and only a very few mentioned upward adjustments. Among other things they reported not having received a salary increase or having received less than expected, that their overtime hours were no longer paid, that no Christmas presents were given or that their commuting allowances, lease cars or other extra benefits were reduced. Respondents mostly referred to downward workforce adjustments, although here again some of them also mentioned upward adjustments. They reported that fewer overtime hours were available or that they were obliged to take leave days. Some reported that their organization had less work resulting in a lower workload, but many more reported that because of staff reductions, hiring freezes and a lack of replacements for sick staff, they had experienced a higher workload. During a crisis, organizations run the risk of not adjusting their workforce in line with a decreased workload, thereby creating idle hours. From the open-ended items, though, it was evident that many organizations had quickly applied downward workforce adjustments and in so doing had prevented idle hours. Although the open-ended questions pointed to a wide range of adjustments, the responses were too heterogeneous and too scattered to be included in the analysis.
H1 and H2 required identifying whether employees worked in organizations that were hit by the crisis. Therefore, the first of the six survey questions asked how the economic situation of the employee’s organization had changed since early 2009. Although a continuous web-survey, we chose the phrasing ‘since early 2009’, to refer to a fixed point in time. Responses could be given on a five-point scale, ranging from significantly worsened to significantly improved, as well as ‘don’t know’. We created a binary variable for working in a crisis-hit organization: those who answered that the economic situation of their organization had worsened or significantly worsened versus all others, including ‘don’t know’ (5%). Three in ten German employees and four in ten Dutch employees reported that their organization was hit by the crisis. Cross-tables and binary logistic regressions were used to test these hypotheses.
H3 investigated how collective bargaining coverage and individual characteristics affected wage and workforce adjustments. For each of the five adjustment measures, binary logistic regressions were applied to test the hypothesis. To identify employees with vulnerable characteristics, we took a standard set of gender, age, education, wages, employment contract and working hours. In the sample, 7.6 percent did not report a valid wage, and therefore we controlled for observations with missing wages. Note that a relatively high non-response for the wage question is common in surveys (Steinmetz et al., 2012). Finally, for the regression analyses we added five control variables: firm size, public sector, export industry, quarter of the year, and of course whether or not the organization was hit by the crisis.
H4 investigated how wage and workforce adjustments affected job security. The web-survey asked about job security, using a five-point scale. We categorized the answers ‘highly dissatisfied’ and ‘dissatisfied’ on the scale as 1 = self-perceived job insecurity, and the answers ‘neutral’, ‘satisfied’ and ‘highly satisfied’ as 0 = self-perceived job security. The item-non response for this variable, including the answer ‘not applicable’, was 9 percent. A binary logistic regression was used to test the hypothesis.
Employee reporting
Did wage and workforce adjustments occur only in crisis-hit organizations?
Do organizations apply wage or workforce adjustments to adapt to a fall in demand caused by the economic crisis? H1 expected that these adjustments would be reported in crisis-hit organizations and not in those not affected. The data, however, did not support this expectation. Employees in organizations not affected by the crisis did report wage and workforce adjustments, although to a lesser extent than those in crisis-hit organizations. In Germany, wage adjustments were reported almost twice as often by employees in crisis-hit organizations compared to those in organizations not hit by the crisis (means of .40, SD .49 as against .21, SD .41, respectively; p < .001), while workforce adjustments were reported one-and-a-half times more often (means of .84, SD .37 as against .57, SD .50 respectively; p < .001). In the Netherlands a similar pattern was evident. Wage adjustments were reported twice as often by employees working in crisis-hit organizations (means of .23, SD .42 as against .12, SD .32, respectively; p < .001), and workforce adjustments almost twice as often compared to those in organizations not hit by the crisis (means of .81, SD .39 as against .45, SD .50, respectively; p < .001).
H1 also stated that wage and workforce adjustments would be reported equally in both countries and across all quarters. Figure 1 shows that the percentages of employees in crisis-hit organizations who reported workforce adjustments hardly varied across the quarters of the year and across the two countries. In contrast, the percentages who reported workforce adjustments in organizations not hit by crisis were stable in both countries in 2009, but in 2010Q1 they started to increase, reaching higher levels in Q2, and stabilizing in the remaining quarters. Figure 1 shows that the percentages of German employees in crisis-hit organizations who reported wage adjustments varied greatly across the quarters. Many employees reported these adjustments between 2009Q3 and 2010Q1, whereas from 2010Q2 onwards the German level came closer to that in the Netherlands, that had been stable across all quarters. The patterns of wage adjustments in organizations not hit by the crisis revealed the same pattern across quarters in both countries, though at lower levels.
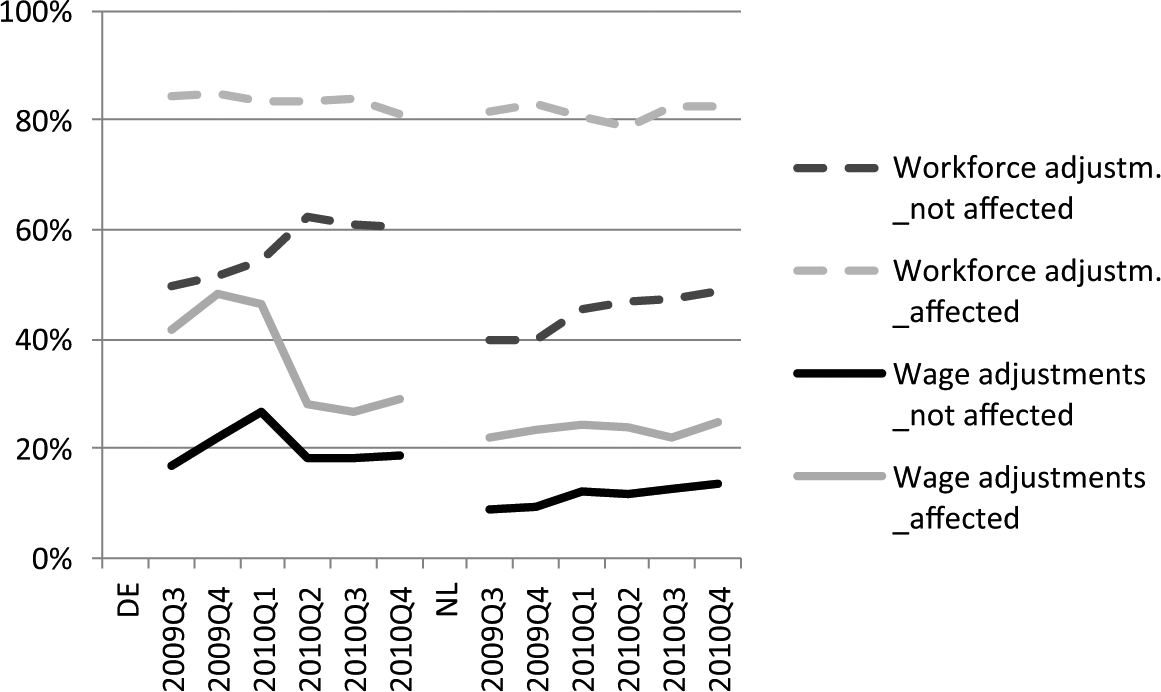
Percentages of employees reporting wage and workforce adjustments in organizations affected by the crisis, by country and quarter.
In conclusion, workforce adjustments were a frequent response to the crisis that did not vary across quarters and countries. In contrast, wage adjustments in crisis-hit organizations varied largely across the countries and the quarters. In a similar pattern, but at lower levels, employees in organizations not hit by the crisis also reported both types of adjustments. H1 expected that non-crisis-hit organizations would not apply adjustments but this was rejected. It also predicted that adjustments would not vary across quarters and countries and this was confirmed for workforce adjustments but not for wage adjustments.
Wage concessions for job protection?
H2a expected that wage and workforce adjustments in crisis-hit organizations would be mutually exclusive, and H2b that they would be cumulative. To develop our understanding, four categories were formulated: no adjustments, wage adjustments only, workforce adjustments only and wage and workforce adjustments jointly. Figure 2 shows that in crisis-hit organizations, between 10 and 16 percent of the employees did not report any adjustments across the quarters and the two countries. Between 3 and 5 percent reported only wage adjustments, between 41 and 62 percent reported only workforce adjustments, and between 18 and 44 percent reported both adjustments. In organizations not hit by the crisis in both countries, the shares of employees reporting no adjustments were much higher, and if adjustments were reported, these were predominantly workforce adjustments. These bivariate findings suggest that workforce adjustments rarely go alongside wage adjustments but that wage adjustments frequently coincide with workforce adjustments.
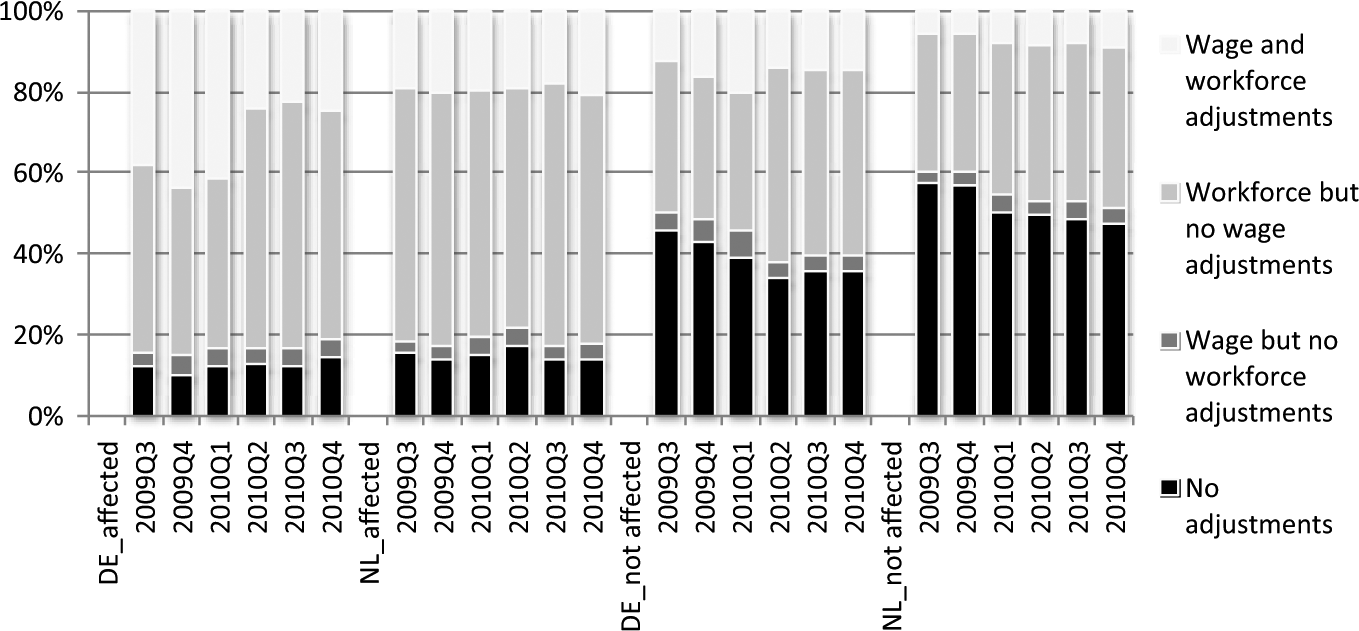
Distribution of wage and workforce adjustment combinations in crisis-hit organizations, by country and quarter.
To investigate further whether adjustments were cumulative, the adjustments were detailed into the five adjustment categories detailed in the previous section. The data revealed that 66 percent of the employees in German crisis-hit organizations, and 51 percent in the Dutch, reported two or more adjustments, and 15 as against 3 percent reported at least four adjustments (means DE 2.1, NL 1.5). The number of adjustments was much lower in organizations not hit by the crisis (means DE 1.2, NL 0.7). The extent to which organizations apply all five adjustments was very low in non-crisis organizations (DE 1%, NL 0.1%), but not negligible in crisis-hit organizations (DE 4.3%, NL 0.2%). If wage adjustments were reported, the vast majority concerned benefits and only a minority concerned basic wages or basic wage plus benefits adjustments. This held for both countries as well as for crisis-hit and non-crisis organizations. If workforce adjustments were reported, these most commonly affected both the permanent and the flexible workforce; this held for German crisis-hit and non-crisis organizations and for Dutch crisis-hit organizations. In Dutch non-crisis organizations, adjustments solely in the flexible workforce were most common.
Did these bivariate findings hold in multivariate analyses? Table 1 shows that employees working in an organization applying permanent workforce adjustments more often reported flexible workforce adjustments, labour hoarding and benefits adjustments (odds ratios increase 265%, 59% and 58%, respectively). Employees working in an organization applying flexible workforce adjustments more frequently reported labour hoarding, basic pay adjustments and benefits adjustments (odds ratios increase 136%, 18% and 56%, respectively). Employees working in an organization applying labour hoarding more often reported basic pay adjustments and benefits adjustments (odds ratio increase 203% and 53%, respectively). Finally, employees working in an organization applying basic pay adjustments more often reported benefits adjustments (odds ratio increases 335%). The most striking combinations were basic pay and benefits adjustments, basic pay adjustments and labour hoarding, and adjustments in the permanent and the flexible workforce.
Chance of an employee to report five adjustments and self-perceived job insecurity (mean values and logistic regression: odds ratio and significance levels).
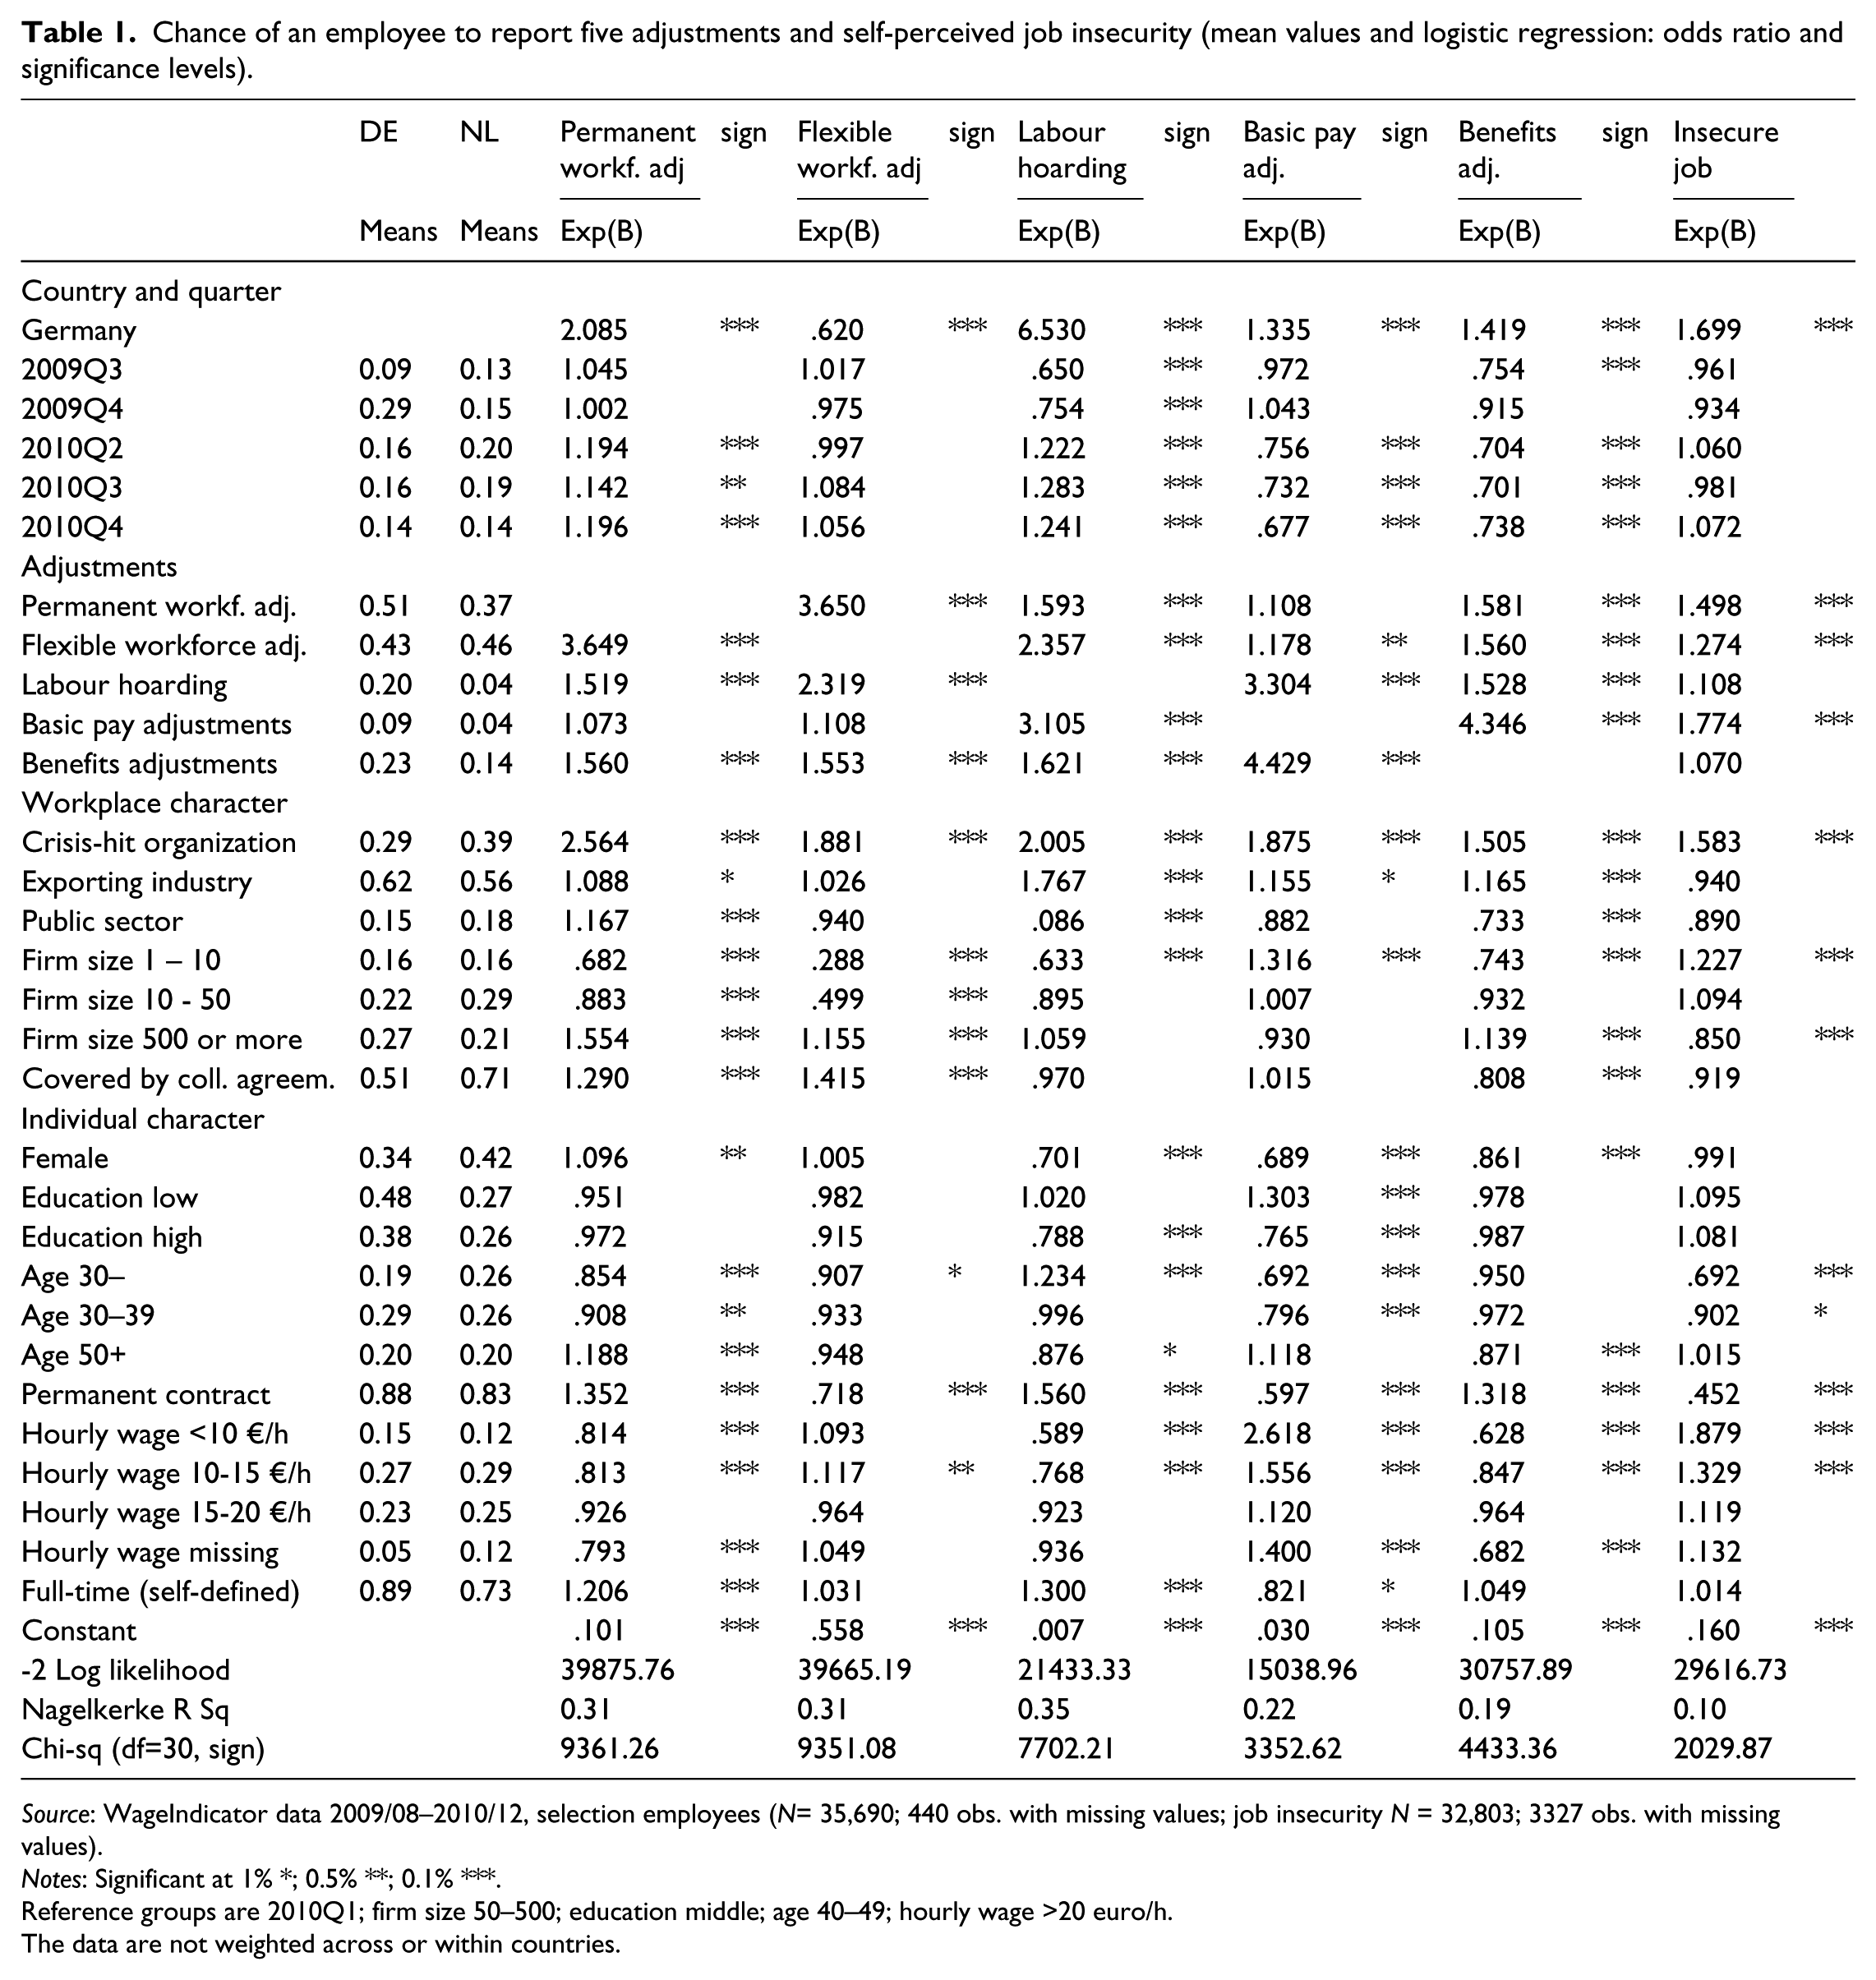
Source: WageIndicator data 2009/08–2010/12, selection employees (N= 35,690; 440 obs. with missing values; job insecurity N = 32,803; 3327 obs. with missing values).
Notes: Significant at 1% *; 0.5% **; 0.1% ***.
Reference groups are 2010Q1; firm size 50–500; education middle; age 40–49; hourly wage >20 euro/h.
The data are not weighted across or within countries.
In conclusion, H2a was rejected because wage and workforce adjustments were not found to be mutually exclusive. Given the small percentages of employees who reported only wage adjustments, we found no convincing grounds for a trade-off of wage concessions for job protection in the two countries. H2a was confirmed for its ‘vice versa’ expectation, indicating that to some extent workforce adjustments did go along with wage adjustments. H2b was also confirmed for its expectation that adjustments would be cumulative. Where and when they were applied, it was most likely that at least two adjustments were evident.
Impact of industrial relations and individual characteristics
To what extent did industrial relations and individual characteristics of employees affect the reporting of wage and workforce adjustments? H3a expected that employees covered by a collective agreement would report workforce adjustments more often and wage adjustments less often. Table 1 shows the chance of an employee covered by a collective agreement reporting any of the five adjustments. The results confirmed the hypothesis. For an employee covered by a collective agreement, the odds ratio decreased by 24 percent for reported benefits adjustments and increased by 29 percent for reported permanent workforce adjustments and by 42 percent for reported flexible workforce adjustments. For the remaining two adjustments, labour hoarding and basic pay adjustments, no significant effect was found.
H3b held that employees with vulnerable characteristics would report both wage and workforce adjustments more frequently. Table 1 shows the results of the analysis for the effects of gender, age, education, wages, employment contract and working hours. The chance that female employees would report permanent workforce adjustments was higher compared to males (odds ratio increases 10%), but lower for reports of labour hoarding, basic pay and benefits adjustments (odds ratios decrease 43, 45 and 16%, respectively). No significant effect was found for flexible workforce adjustments. Compared to middle-educated employees, the chance that low-educated individuals would report basic wage adjustments was higher (odds ratio increases 30%), whereas the chance that the high-educated would report basic wage adjustments or labour hoarding was lower (odds ratio decreases 31%). No effects were found for permanent or flexible workforce adjustments or for benefit adjustments. Age turned out to be an important characteristic: employees aged 50+ reported permanent workforce adjustments more often and employees aged 30 or younger reported labour hoarding more often (odds ratios increase 19 and 23% respectively when compared to employees aged 40–49). Compared to this middle group, employees aged 50+ reported benefits adjustments less often and employees aged 30 or less reported basic pay adjustments less often (odds ratios decrease by 45 and 15%, respectively).
Having a permanent employment contract increased the chance that employees would report adjustments in the permanent workforce, labour hoarding and benefits adjustments (odds ratios increase 35, 56 and 32%, respectively), but lowered the chance that employees would report adjustments in the flexible workforce and basic wage (odds ratios decrease 39 and 68%, respectively). Compared to employees with an hourly wage of €20 or more, those earning at most €10 per hour reported adjustments in the permanent workforce, labour hoarding and benefits less often (odds ratios decrease 23, 70 and 59%, respectively), but basic wage adjustments more often (odds ratio increases 162%). Having a full-time job increased the chance that employees would report permanent workforce adjustments and labour hoarding (odds ratios increase 21 and 30%, respectively), but lowered the chance that they would report basic wage adjustments (odds ratio decreases 22%). Hence, the support for H3b was mixed. The most striking results however were in line with the hypothesis. The low-educated and low-wage employees were much more likely to report basic wage adjustments, whereas the high-educated earners were less likely. Thus crisis responses in organizations obviously increased wage inequality.
Job insecurity
H4a held that both workforce and wage adjustments would affect job insecurity, though workforce adjustments would do so to a larger extent. The last columns in Table 1 show that basic wage adjustments increased feelings of job insecurity for both permanent and flexible workforces (odds ratios increase by 50, 27 and 77%, respectively). Working in an organization that applied labour hoarding did not significantly affect job insecurity. The most likely interpretation is that employees would perceive labour hoarding as an alternative to job losses. Remarkably, however, labour hoarding did not reduce job insecurity. Working in an organization that used benefits adjustments also did not significantly affect job insecurity. Our hypothesis expected that workforce adjustments would affect job insecurity to a larger extent than wage adjustments, but this was not confirmed. By contrast, basic wage adjustments exhibited the largest impact on job insecurity.
H4b stated that employees with vulnerable characteristics would report job insecurity more often. However, job insecurity was related neither to gender, education or working hours; but it was influenced by age, employment contract and wage level. Employees aged 30 and less reported job insecurity less often (odds ratio decreases by 44% compared to age group 40–49). Having a permanent employment contract suppressed job insecurity reporting (odds ratio decreases 221%). Having a low income increased job insecurity reporting. Employees earning under €10 or €10–15 per hour reported job insecurity more often (odds ratios increase 88 and 33%, respectively compared to employees earning over €20). The most striking results were in line with the hypothesis. Low-wage earners were much more likely to report job insecurity, as were employees with a fixed-term contract.
Conclusions
How did firms in Germany and the Netherlands respond to the economic and financial crisis in 2009 and 2010? Our study investigated in detail the trade-off between wage and workforce adjustments, and examined the role of industrial relations in this process, using survey data from German and Dutch employees. The findings show that employees in crisis-hit organizations reported that workforce adjustments were widely applied and that this hardly varied for both countries over the time period of the study. In contrast, wage adjustments in these organizations were reported to a much lesser extent and varied greatly over the time period. Employees working in organizations that were not hit by the crisis also reported workforce and wage adjustments, though to a lesser extent. Workforce adjustments seemed to be a continuous strategy in a majority of organizations, whereas wage adjustments were clearly more related to the crisis. Workforce adjustments to some extent occurred in conjunction with wage adjustments, while wage adjustments mostly accompanied workforce adjustments. The most striking combinations were basic pay and benefits adjustments, basic pay adjustments and labour hoarding, and adjustments in the permanent and the flexible workforce. Given the small percentages of employees who reported only wage adjustments, we found no convincing evidence of a trade-off between wage concessions and job protection in the two countries. As a possible explanation, it seems likely that the relevant collective agreements in Germany were too scattered to have a large impact on the sample.
Collective bargaining primarily determines wages rather than employment protection. In line with the theories that union wage determination works through collective bargaining, employees covered by agreements reported wage adjustments less often but workforce adjustments more often. Controlling for bargaining coverage, low-educated and low-wage employees were much more likely to report basic wage adjustments, whereas the high-educated were less likely to report this, leading to the conclusion that the economic crisis may have increased wage inequality. In addition, low-wage earners reported fewer instances of labour hoarding, but they also reported fewer workforce adjustments. Labour hoarding was predominantly reported by young, male employees with a permanent, full-time contract. We expected that workforce adjustments would affect job insecurity to a larger extent than wage adjustments, but it turned out that basic wage adjustments exerted the largest impact on job insecurity. In addition, low-wage earners were much more likely to report job insecurity; as were employees with a fixed-term contract.
Although Germany and the Netherlands are in many respects similar countries, their crisis responses varied greatly. This was predominantly attributable to differences in the development of the economic crisis and its recovery, and to the relatively extensive STW arrangements in Germany. Here, wage adjustments increased largely in 2009Q4, but during 2010 these adjustments decreased to the same level as had been the case in the Netherlands for all quarters. Controlling for these characteristics showed that organizations in the two countries applied wage and workforce adjustments similarly.
Our study of course has limitations related to the models used and the data collected. First, the concepts of wage and workforce adjustments are not as clearly demarcated as the analyses suggest; indeed both involve a wide range of expressions. For example, is receiving a less than expected salary increase to be defined as a downward wage adjustment? Is reorganization of the workplace a downward workforce adjustment? If the concepts are not strictly defined, how valid are employees’ reports on these concepts? Second, in the survey respondents were asked about their own wage adjustment and the workplace’s workforce adjustments. Hence, we may have underestimated the extent of wage adjustments. However, taking these limitations into account, we remain convinced that the unique dataset and robust findings of our study contribute to the overall understanding of wage and workforce adjustments in an economic crisis.
Footnotes
Acknowledgements
This article builds on research work done using the WageIndicator web survey on work and wages (www.wageindicator.org). The authors would like to acknowledge the contribution of WEBDATANET, a European network for web-based data collection (COST Action IS1004, ![]() ). We are grateful to Denis Gregory for language editing.
). We are grateful to Denis Gregory for language editing.
Funding
This research received no specific grant from any funding agency in the public, commercial, or not-for-profit sectors.