
Abstract
To boost the circular economy of the electric vehicle battery industry, an accurate assessment of the state of health of retired batteries is essential to assign them an appropriate value in the post automotive market and material degradation before recycling. In practice, the advanced battery testing techniques are usually limited to laboratory benches at the battery cell level and hardly used in the industrial environment at the battery module or pack level. This necessitates developing battery recycling facilities that can handle the assessment and testing undertakings for many batteries with different form factors. Towards this goal, for the first time, this article proposes proof of concept to automate the process of collecting the impedance data from a retired 24kWh Nissan LEAF battery module. The procedure entails the development of robot end-of-arm tooling that was connected to a Potentiostat. In this study, the robot was guided towards a fixed battery module using visual servoing technique, and then impedance control system was applied to create compliance between the end-of-arm tooling and the battery terminals. Moreover, an alarm system was designed and mounted on the robot’s wrist to check the connectivity between a Potentiostat and the battery terminals. Subsequently, the electrochemical impedance spectroscopy test was run over a wide range of frequencies at a 5% state of charge. The electrochemical impedance spectroscopy data obtained from the automated test is validated by means of the three criteria (linearity, causality and stability) and compared with manually collected measurements under the same conditions. Results suggested the proposed automated configuration can accurately accomplish the electrochemical impedance spectroscopy test at the battery module level with no human intervention, which ensures safety and allows this advanced testing technique to be adopted in grading retired battery modules.
Keywords
Introduction
Due to their energy savings and environmental friendliness, the number of electric vehicles (EVs) on the roads is already growing and is projected to grow over the medium to the long haul. These EVs use lithium-ion batteries (LIBs) as the main energy source due to their outstanding benefits over other rechargeable batteries, such as high energy density, high output voltage, lower self-discharge rate and longer life cycle. As a result, with more prominent number of EVs hitting the market likewise implies a growing number of LIB being used and thus more of them reaching their end of life (EoL).1,2 For the first time, more than one million electric vehicles were sold worldwide, in 2017. 3 To capitalise on this rising; reuse, recycling and recovery of those batteries is getting imperative to support the circular economy and diminishing ecological harm. 4 This demand grading the retired batteries according to their current state of health (SoH) for reusing in the primary or secondary application and acquiring an exhaustive knowledge about the degradation mode before recycling after the end of second life.
Generally, SoH describes the physical health condition of a battery at a given time in percentage, related to the nominal condition of the battery when it is new. 5 This can be defined in terms of capacity fade or the increase in the ohmic resistance that is the ratio of the current status (capacity or resistance) to that of the beginning of life.6,7 For instance, in EV batteries, the battery is replaced when the capacity has decreased to 80% of the initial rated capacity. 8 Therefore, accurate SoH avoids early disposal of the batteries, decreasing the ownership cost and unexpected failures in primary and second life applications. However, the SoH estimation is a complicated process that is affected by several factors such as temperature, state of charge (SoC) and the estimation method used. 5 Based on these factors, several studies have been conducted to find a trustworthy non-destructive method for SoH estimation in LIB. Among these methods, capacity-based methods,9–11 impedance spectroscopy7,12–15 and Kalman filtering methods are commonly used to estimate the battery model parameters that can be considered as battery health indicators.16–20 Capacity-based SoH methods can result in extremely accurate and reasonably straight forward measurements, 21 but this test is a very time-consuming process that requires the cell to be fully charged and discharged to carry out the current integration.22,23
On the other hand, the internal resistance can be determined through both pulse power tests and the use of electrochemical impedance spectroscopy (EIS). 24 AC impedance also called EIS is a powerful non-destructive technique with a broaden application in the field of electrochemical energy storage systems. Sine wave of potential (PEIS) or current (GEIS) will be applied to a system, and consequently, the current or voltage response will be collected and analysed. Generally, the current response is shifted from the voltage and the ratio of the complex representation of a sinusoidal voltage to the current gives the impedance that includes the phase and the magnitude. During EIS measurement, the frequency response analyser (FRA) measures the amplitude and the phase of the AC component of both current and potential, and they will be converted into a value of the impedance at the frequency of the sine wave. The measurement will be repeated at a series of different frequencies, and the collected data represents the impedance spectrum.
EIS was first applied in the field of wet electrochemistry especially in corrosion studies where complicated processes involve surface and solution reactions and hence electrified interface. The EIS has been used extensively for battery, supercapacitor, fuel cell/electrolyser, coating evaluation and corrosion system characterisation. Briefly, the EIS literature on LIB, 24 Zhuang et al., 25 Chagnes and Swiatowska 26 and Chang and Park 27 have described and discussed the development of new EIS methods to reduce measurement time. Zhuang et al. 25 have reviewed and presented different models (i.e. Adatom model, Single Particle model etc.) that reflects the steps involved in LIB during lithium intercalation and the frequency domain at which they are located. Ben Ali et al. 11 proposed an incremental support vector regression to estimate the battery SoH lifetime estimation using NASA battery data set. Eddahech et al. 28 presented an equivalent circuit model of the lithium-ion polymer cell using EIS measurements. This model was employed to develop a real-time automated system for monitoring battery behaviour and SoH. Likewise, in Pattipati et al.’s atudy, 29 the parameters of a modified Randles circuit model were estimated from the EIS data to predict the capacity fade and hence the SoH of LIB. Zhang et al. 30 used Nyquist plots obtained from EIS test to study the decay in performance of batteries with cycling and its relationship to the increment in cell resistance. Galeotti et al. 15 have implemented a fitting procedure on the EIS data to extract the parameters of an equivalent circuit model. Then, a relationship between the ohmic resistance and the available capacity of the battery was found to determine the SoH. The use of the EIS technique was further extended to test mass production LIB in the industry like the study by Lambert et al. 31 who proposed and implemented an end-of-production-line test for automotive LIB using EIS. Recently, some battery testing systems were designed and commercialised like the system developed by National Instruments 32 that performs some basic battery testing techniques such as drive cycles under different conditions to determine key performance and durability characteristics related to cycle life, efficiency and safety. However, this testing system is not fully automated and there is no published work validates its applicability in adopting sensitive methods like EIS test to estimate the SoH of LIB. In addition, the data collected during the test is provided by the battery management system which is not always accessible or existed, particularly when testing EoL EV batteries where the battery management system (BMS) could be damaged or not working properly. According to the presented literature, the EIS method has been proved to be a rapid and a reliable technique in monitoring the SoH of LIB. This is because of its non-destructive nature and the substantial amount of information provided on battery degradation in a reasonably short testing time. 33
Nevertheless, the electrochemical and thermal equilibrium of system to be measured must be ensured throughout the EIS experiment in order to avoid drifting in the system and this can be very difficult to achieve. Especially in the case of battery, where change can result from several factors such as adsorption of solution impurities, growth of oxide layer, build-up of reaction product in solution, coating degradation, change in temperature and so on. 34 In addition, the EIS is built on linear systems theory which requires that the system satisfy conditions of causality, linearity and stability. This entails the data to be evaluated by the Kramers–Kronig (K-K) relation where the complex plane spectral data show magnitude and phase dependency. 34 Moreover, the real part of the collected spectrum can be linked by integration to the imaginary part and vice versa. This is always true if the data comply the following criteria that is linearity, causality stability and finiteness. 35 The advantages are that this method is non-evasive, the system needs to be in thermodynamic equilibrium, the perturbation is approximately linear with a small perturbation and the measurement can cover a large frequency range with different time constant. 36 Moreover, the analytical models are readily available. The disadvantages are that the equipment is expensive and the low-frequency range is difficult to measure. It is worth pointing out that most of the related research on LIB SoH estimation is mainly focused on single-cell diagnostics under controlled experimental conditions.
On the other hand, there are limited published works that evaluate the effectiveness of these techniques in estimating the SoH for paralleled cells or at the module level which is the case of LIB used in EVs where the LIBs are typically connected in a series and/or parallel to maximise the capacity and voltage. 37 This issue was addressed in Weng et al. 38 when incremental capacity analysis (ICA)-based SoH monitoring was extended to battery modules. The proposed approach was based on IC peak tracking principles that used for single cell. Experimental results show that the proposed approach can be applied for capacity estimation for a module or pack that has paralleled cells. However, the accuracy of ICA is highly dependent on the charging/discharging current used during the experiment which is advised to be very low to obtain observable peaks that allow SoH monitoring. Therefore, this approach cannot be utilised in an industrial environment where short testing time is utmost to maximising the number of tested modules. Jensen et al. 39 presented the EIS technique as a measurement method used to examine the impedance of 75 Ah LIB module consists of eight serially connected cells. The proposed measurement approach combined the single sine technique and the Laplace transformed excitation signal to collect the impedance data for the module and individual cells. In terms of testing time, the authors claimed to be reduced to less than 30 min, which was further shortened using other instruments to approximately 5 min.31,40 According to the available works in this field, the module testing is still limited to laboratory benches with a small number of samples were tested.
Rationale for automating the EIS test
In the area of battery research, there are several devices used to conduct the EIS test from various manufacturers with unique sensor and power cable designs that are commonly utilised in characterising the LIB at the cell level in laboratory41–43 or in industrial environment. 31 As mentioned earlier, the LIBs are typically connected in a series and/or parallel configuration to shape modules in order to maximise the capacity and voltage because of which the direct link of the sensor and power cables to the cell tabs is no longer feasible. This influences the results of the EIS, particularly if certain primary parameters derived from impedance spectra, such as internal/charge-transfer resistance are very small (less than 10 mOhm) which is the case in battery modules from the Nissan LEAF battery pack addressed by Ahmeid et al. 40 and considered in this article. In addition, there are serious health and safety risks associated with testing a high energy density battery module like self-ignite due to internal/external short-circuits that could release toxic materials which are harmful to human. Thermal runaway can release all energy stored in the battery leading to temperature above 780°C. 44 These risks are likely to increase when dealing with EoL EV batteries with unknown history and physical conditions.
To alleviate the aforementioned risks and to extend laboratory-based methods to suit the growing recycling industry for EV batteries, there are very few published patents and research studies about possibility of automating the procedure of dismantling of EV battery packs, sorting and battery measurement. However, the focus is more on the robot-assisted disassembly45–47 and design of flexible tools that can be used for disassembly. 48 Hedegor et al. developed a battery testing and sorting system that sorts the batteries based on the electrical condition of the batteries. However, this semiautomated machine is not adaptable to batteries with various shapes and different electric characteristics. 49 In another study, a custom designed battery sorting system integrated with a measurement probe mounted on a 6 degrees of freedom (DoF) industrial robot to demonstrate the operation of testing/sorting. Given that this study structured based on a demo in an industrial show and authors have not released any technical results about their work. 50
In another study, Schmitt et al. 48 proposed a flexible robotic gripper for handling pouch-cells, with different geometries, for sorting and cell characterising based on voltage and inner resistance. The proposed system consisted of a fixed gripper and a moving gripper connected to a battery arrester separately. The gripping force and clamping force have been calculated followed by a series of static-mechanic finite-element method (FEM) analysis to avoid damaging the contactors during contact with the grippers. Schmitt et al. 51 validated the values derived by the developed robotic gripper for the actual cell voltage and the inner resistance. This concept is extended here to collect impedance data of a battery module using high sensitive technique like EIS that provides more information about the battery status which is not the case in Schmitt et al.’s48,51 study, where internal resistance only is estimated using pulse discharge.
The proposed system consisted of a fixed gripper and a moving gripper connected to a battery arrester separately. The gripping force and clamping force have been calculated followed by a series of static-mechanic FEM analysis to avoid damaging the contactors during contact with the grippers. Schmitt et al. 51 validated the values derived by the developed robotic gripper for the actual cell voltage and the inner resistance. This concept is extended here to collect impedance data of a battery module using high sensitive technique like EIS that provides more information about the battery status which is not the case in Schmitt et al.’s48,51 study, where internal resistance only estimated using pulse discharge.
Advances in deploying robotic machines in modern industries has considerably assisted human in accomplishing typical tedious and repetitive tasks that could have some times high risk for human, such as assembly/disassembly, pick and place, welding/cutting and so on. Saying that successful execution of tasks by robots is highly dependent on a perfectly known environment, with a superbly known location and configuration of the objects they interact with. Therefore, robots act blindly if they cannot actively interact with the surrounding environment. Therefore, it is necessary to provide perceptual capabilities to the robot to readjust its actions according to a visual feedback. Visual servoing (VS) is a well known technique for control of a robot’s motion via visual features and key points. In this technique, the 6 DoF position of an object obtained by a camera transforms into those in the world coordinate reference fixed to an environment in order to guide the robot manipulator to a desired position. There are two types of VS techniques; 52 image-based and position-based. The latter one has more stability with better predictability as it decouples the calculation of object’s pose from the robot control, given that the image-based approach regulates the error faster as the robot control only depends on the image features. In this study, we implemented the position-based approach to guide the robot to a pre-defined off-set position, above an stationary LIB. The main reason for using VS technique in this study is to propose an automated framework that can actively react against uncertainties in an industrial environment.
In addition, manipulation requires mechanical interaction with the object being manipulated, and consequently, the movement tasks will be characterised by the interaction force. Planning the entire tasks by a pure motion control strategy would be difficult as it requires parameters for both environment and the robot. By applying a compliant behaviour to the system, the environmental parameters can be estimated during the interaction. Usually the contact force measures by a force sensor attached on the end-effector; however, in this study, we read the external torque given by the robot control system. We employ hybrid-position force control as the principle control system specification. The main principle of hybrid-position force control is to use all actuated joints to control position in the free motion directions while controlling force in the directions where the robot has its position constrained by contacts. The literature suggests a variety of tasks involving the force said strategy including continuum manipulators in unknown constrained environments 53 or to control biped walking. 54 In addition, we use a 7 DoF robot arm with a redundant joint which allows to perform complex tasks by executing secondary tasks such as avoiding singularity or minimising joint torques.
This article aims at introducing a framework for automating the EIS data collection using a manipulator arm (Figure 1). The remainder of this article is structured as follows: a brief background about the EIS test and unsteady data will be presented, then the experimental setup and the implemented methodology for the robotized EIS test will be investigated, next the development of end-of-arm tooling (EOAT) will be discussed, followed by experimental results and conclusion.
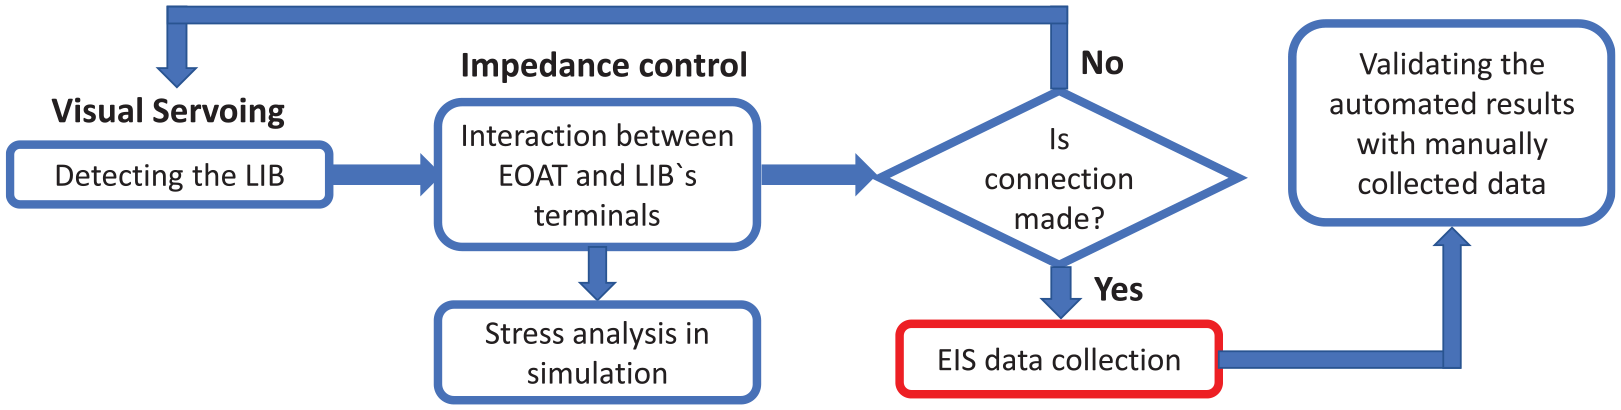
Illustration of the proposed framework flowchart.
EIS for Nissan LEAF battery module
The 24 kWh LEAF pack is made of 48 modules electrically connected in series, and each module consists of four individual pouch cells electrically configured as two in series and two in parallel. The cells are made by lithium manganese oxide (LMO) with lithium nickel oxide (LNO) chemistry, the rated capacity of each cell is 33 Ah, and the nominal voltage is 3.75 V. Figure 2 shows a Nissan LEAF module canister and its schematic diagram. within the module canister, the cells’ terminals are welded to copper bus bars to form the electrical connections for the module. Each module has three terminals: red, white and black (RWB) which form the positive and negative terminals of the module. The white centre tap is either positive or negative terminal relative to the two by two arrangement. The maximum voltage of a module is 8.4 V, and the rated capacity is 66 Ah. The Nissan LEAF module’s canister has a dimension of
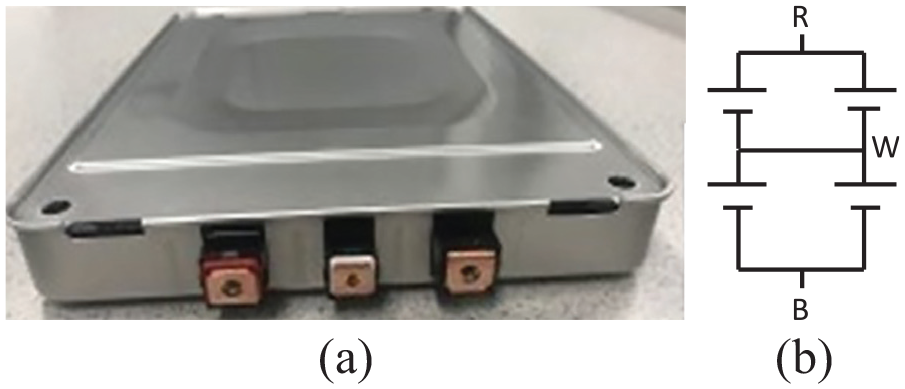
(a) 24 kWh Nissan LEAF module and (b) schematic diagram.
In this study, a retired Nissan LEAF pack was manually disassembled down to the module level imitating the real scenario in the recycling plant. The next step is collecting the impedance data for each module using the EIS technique. To successfully perform this procedure, the power and sensor cables of the testing instrument must be attached to the module terminals using bolts and screw, every time a new module being tested. Here, the EIS spectra were recorded using the SP-150 Potentiostat/galvanostat (Biologic) between 1000 and 0.15 Hz in potentiostatic mode with a voltage amplitude of 7.1 mV, when the battery module reaches its equilibrium state to ensure stability. Figure 3 shows a typical Nyquist plot derived from the EIS test, in line with the literature, the shape of the Nyquist plot is divided into four regions, the very-high-frequency region represents the inductance of cell and cables, the intersection of the inductive tail with the real axis corresponds to the ohmic resistance due to the electrolyte and current collectors, the semicircle is governed by the surface/electrolyte interphase and the charge-transfer phenomenon, and the low-frequency region denotes the diffusion in the electrodes.25,41 Typically, this test repeats at different SoC to comprehend the dynamic status of the battery over a wide operating range. Figure 4 illustrates EIS measurements collected for one battery module, (RW) terminal, at (100%, 80%, 60%, 40% and 20%) SoC under a controlled temperature of 25°C.
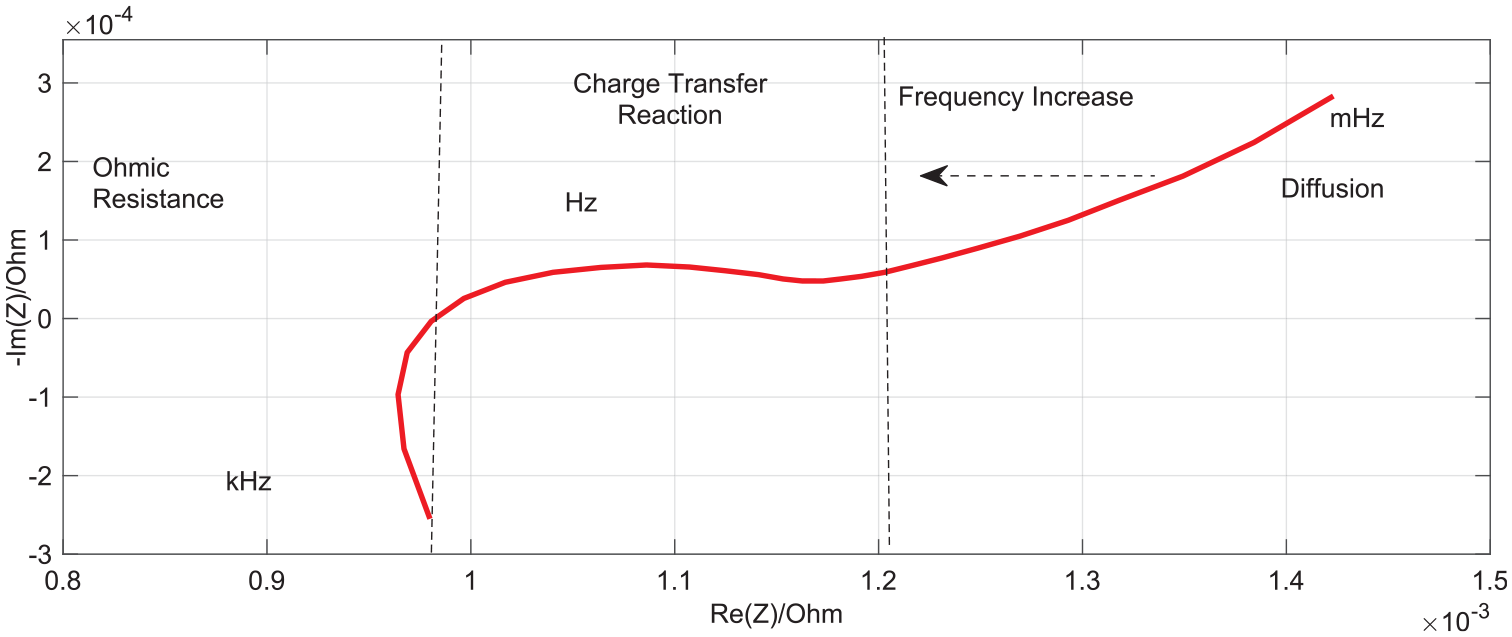
Nyquist plot derived from the EIS test.
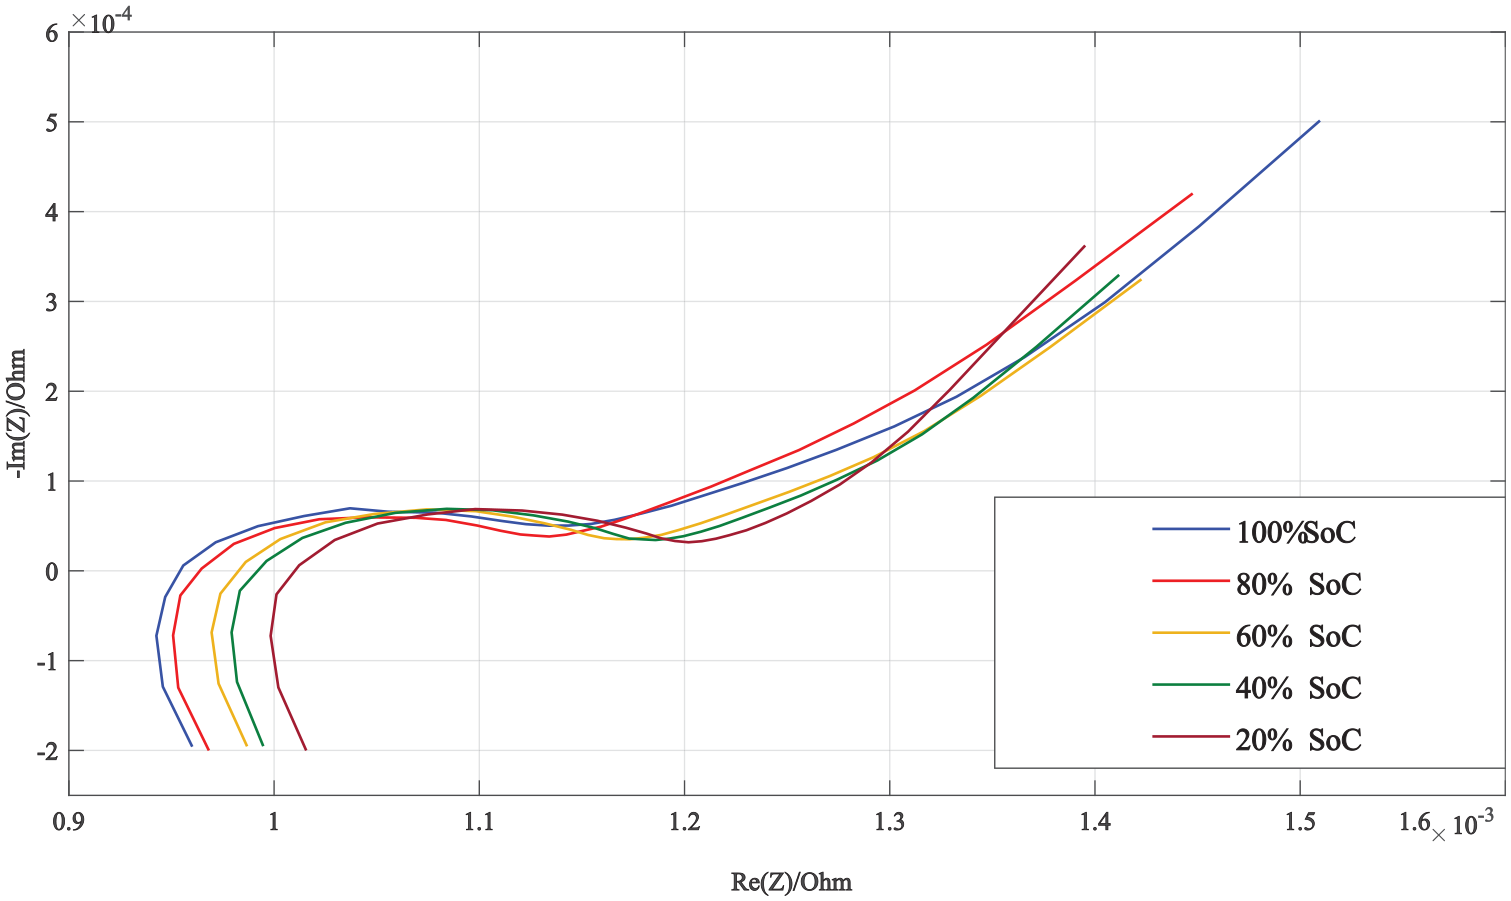
EIS data collected over a wide range of SoC.
One of the most common usages of the EIS measurements is to identify the parameters of an Equivalent circuit model (ECM) by means of fitting procedures in the frequency domain. These parameters can be used for SoH and remaining useful life estimation. All ECMs are based on the same structure: an ideal voltage source for open-circuit voltage (OCV), a series resistance
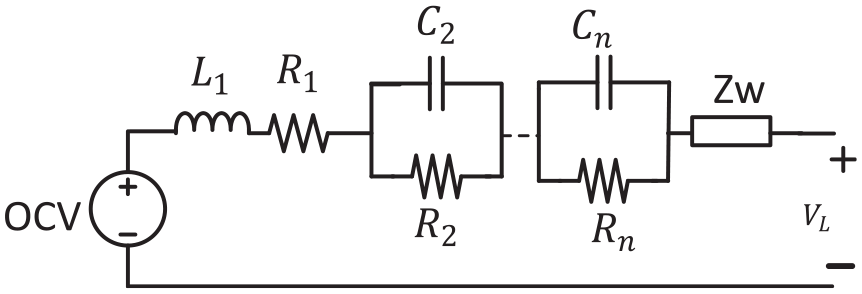
Simple electrical battery model.
In the case of using the EIS technique in a battery recycling plant, the precision of the impedance data collected becomes an issue that must be carefully dealt with. For instance, Figure 6(a)–(c) display unsteady and erroneous EIS data collected from three different batteries due to loose connection that resulted from a human error during tightening the bolts and screws to attach the power/sensor cables to the battery module terminals. Consequently, if the obtained Nyquist plot is fitted to an ECM, inaccurate model parameters will be identified, resulting in incorrect SoH estimation. Thus, a standard connector tool/EOAT is designed and proposed in this study. The connector will be mounted on a cobot’s end-effector to overcome the bolts/screws tightening issues and standardising the testing tools. This will increase the reliability of the EIS technique in testing and sorting many battery modules.
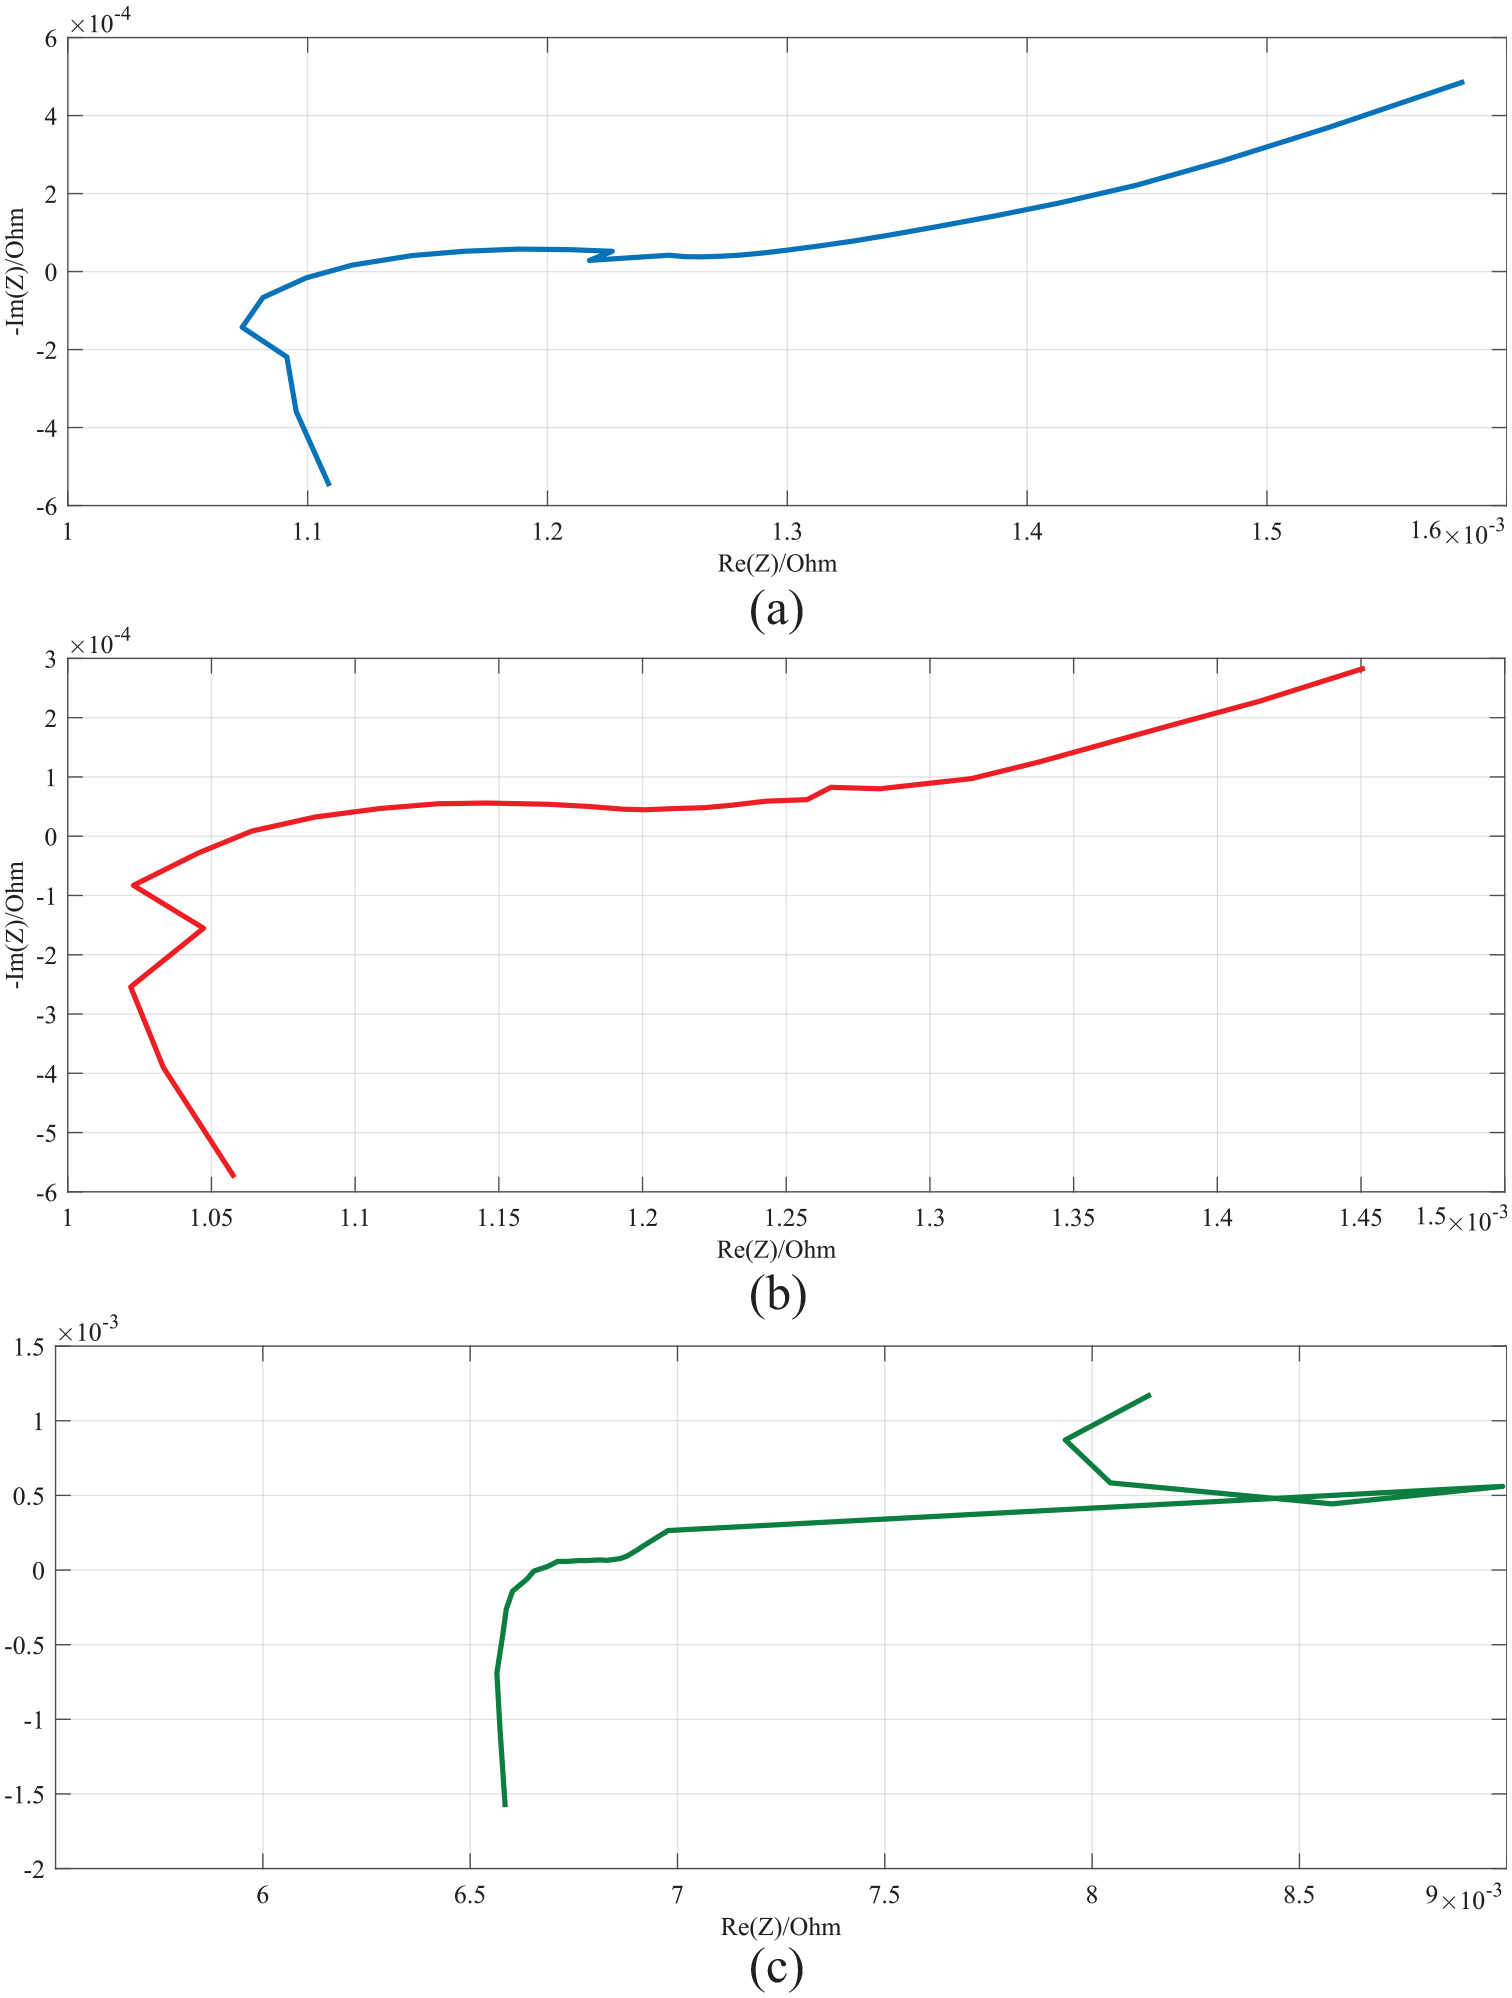
Unsteady EIS data due to improper terminal connection. (a, b, c) represent EIS data collected from three different LIB module.
Experimental setup
Task description
The overall task of robotizing the EIS test involves four main sub-tasks: (1) detecting the battery module in the scene via VS technique, (2) switching to impedance control to apply compliance behaviour to the robot during contact with the battery terminals, (3) finite-element analysis (FEA) of LIB terminals during contact with the EOAT, (4) validating EIS data collected by the robot with those of collected manually.
Robotic test platform
As shown in Figure 7(a), the experimental setup consisted of two cobots (Franka Emika panda) where one of them is stationary with an RGB camera (Logitech Brio) mounted on its end-effector, and another robot arm is used for manipulation tasks. There is a dismantled Nissan LEAF battery pack placed between two robots on a table, and an LIB was fixed on the pack shell within work-space of the moving arm (i.e 20 cm far from the moving-arm’s base). A custom designed connector/EOAT is mounted on the end-effector (where its design will be explained in the next section) and connected to a Potentiostat (Figure 7(c)). An alarm system with Arduino microcontroller has been designed and attached on the robot wrist, connected to EOAT, to ensure a stable electrical connection is established between EOAT and the battery terminals (Figure 7(b)). Top view of EOAT shows that the EOAT connects to the Potentiostat using cables bolted down on the EOAT. Once connection created, a series of LEDs will be turned on and a piezo buzzer creates some beeps. Subsequently, the operator runs the EC laboratory software to collect the EIS data by the Potentiostat. The test will start and finish based on the range of frequencies defined. The robot remains in the connection point until the EIS data collected, and then moves to a pre-defined home position. The robot control system (i.e. VS and impedance control) is implemented using Libfranka
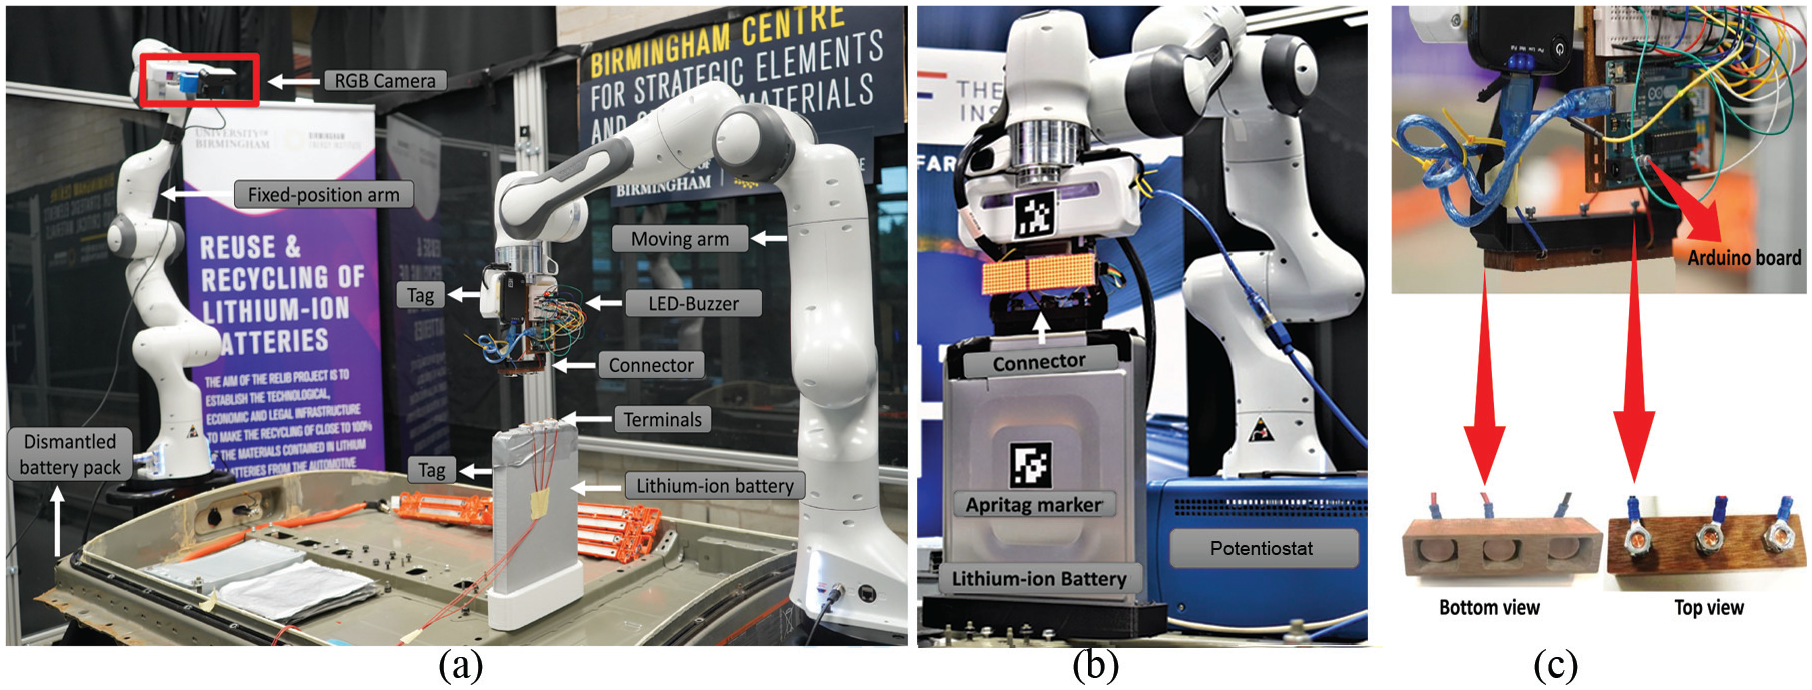
Experimental setup, (a) robotic testbed consisted of two robot arms and a fixed lib placed in the work-space of the moving cobot, (b) robotized EIS test by connecting the designed connector to the LIB’s terminals: tag marker used to move the robot to a pre-defined off-set close to the LIB, (c) custom designed EOAT with an Arduino alarm system attached to the robot’s wrist: Bottom view shows the metal plates implemented to make a stable conductive connection. Metal plates are supported by compression springs to provide compliance to the EOAT.
Safety protocols
Prior to start the experiment, risk assessment was conducted to mitigate the potential risks during the experiment. These instructions might be considered as a safety protocol for other researchers who want to conduct similar robotic EIS tests. The following points were considered in this study:
A bucket of sand was placed next to the experimental setup to sink the battery into the sand in case if the battery overheated during the experiment.
A thermal imaging camera was located next to the experimental setup to monitor the temperature of the battery during the experiment (Figure 8). Usually heat will be generated during charging and discharging the battery by high voltage; however, very small voltage perturbation was injected to the battery in this study. Therefore, it is very unexpected to observe heat generation, if any will be very small. Although it is not necessary to use thermal imaging camera during EIS test, but it mitigates the risks and it helps to monitor the LIB temperature if short circuit developed between terminals due to any reason.
The experiment was performed in a robotic cell equipped with safety glass enclosures and interlock mechanism that prevents entering into the cell when robot is operating.
There was a robot emergency stop next to the robot operator to stop the movement of robot in emergency situations. Operator must hold his hand over the emergency stop during the experiment in order to react quickly in emergency situations.
Insulating gloves were worn to connect the Potentiostat’s cables to the EOAT.
Prior to conducting the EIS test, a mock-up trial was performed using a 3D-printed battery module. This trial was mainly designed to observe the movement of the robot during the experiment.
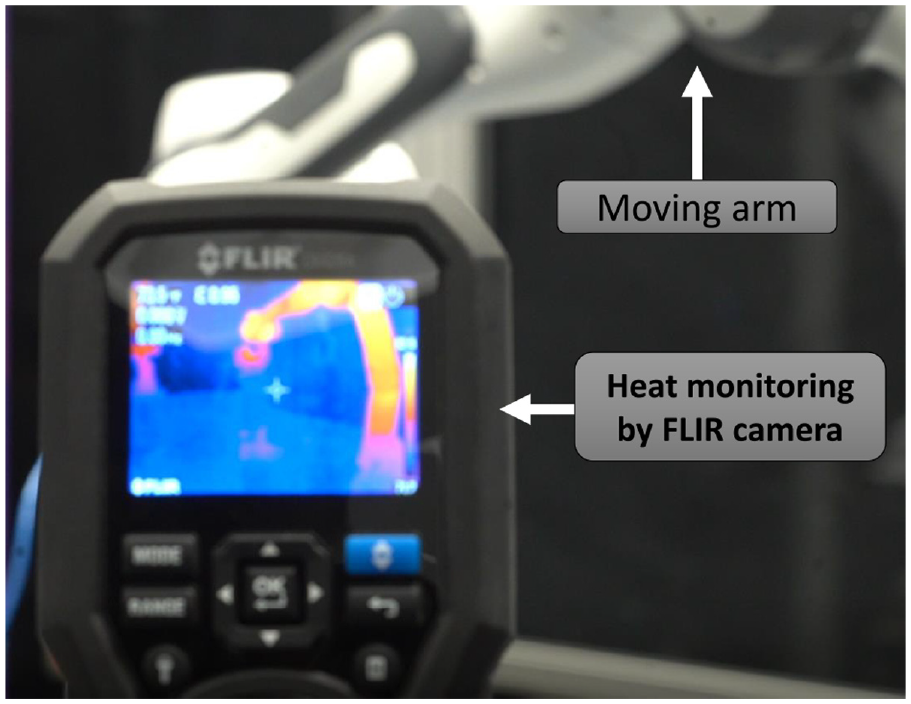
FLIR thermal image camera monitors the temperature of the LIB during the EIS test.
Vision-guided manipulation
Vision systems provide flexibility to automated manufacturing processes because of their adaptability to new environments and their ability to deal with uncertainties in industrial environments. Towards robotizing the EIS test, we used VS technique to benefit from vision sensory feedback to assist with the manipulation. Apart from tracking the objects in an unstructured environment, VS assists with key points detection and manipulating the arm via camera velocities. Visual features enables the alignment of the robot arm with an object.
In this study, the robot arm starts moving from a pre-defined home position to a pre-defined offset (i.e 10 cm in z-axis) above the battery terminals. Once the error of VS regulated, the control system will be switched to impedance control system with a pre-defined stiffness and damping coefficients. The impedance control system allows the robot to have compliance in contact with terminals. In addition, the compliance assists with correcting the potential misalignment between the connector and the battery terminals. In the following section, theoretical detail of implemented control systems will be discussed explicitly.
VS of cobot
In this case study, although the position of the battery module was fixed and look-and-move method 58 could be used to couple the connector and the LIB terminals, but instead we used position loop closure based on visual feedback to leverage eye-to-hand strategy that gives good performance even in the presence of significant vision system miscalibrations and kinematic model parametric errors. 59 The proposed control strategy has the capability to cope with uncertainties that could be happened in an industrial environment like sudden position change of the desired target, and also keeping constant relation between the robot and the battery module.
AprilTag markers
60
were used as visual feature for the VS method; one attached on the robot end-effector (

where
Impedance control system
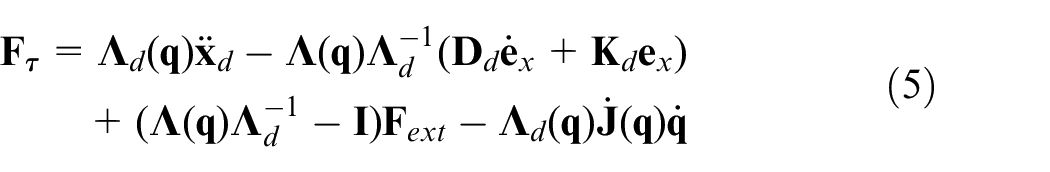
Once the error regulated via VS, then the control law that imposes the impedance dynamics has been implemented in the joint space. 62 Cartesian impedance control has been proposed to regulate the relationship between end-effector position and interacting force. The dynamic model of the robot is in the form

where

where

where
where
Development of finite-element model
The EOAT is designed and fabricated based on the shape and geometry of the LIB terminals and the robot’s gripper. The EOAT is bolted to the gripper from one end, and from another side is equipped with a connection box (Figure 7(c)) consisted of three metal plates supported by compliant springs. The main body of EOAT is made by tough PLA and the metal plates are made by 6061 aluminium. The connection box facilitates connection with the battery terminals, which eliminates bolts and screws tightening issue and shorten the time needed for the testing procedure.
The entire system was modelled in Solidworks; including the Nissan LEAF LIB, the EOAT and the robot’s wrist (Figure 9). Finite-element analysis was performed statically in order to determine the stress distribution and any potential failure on the terminal surfaces due to loads. The focus of this FEA study is to investigate the stress applies on the battery terminals by the interaction force between the EOAT and the LIB; therefore, the model was simplified by only considering the connector and the battery during applying load. In FEA study, it was assumed that loads applied constantly without changing in time, and stress versus strain has a linear relation up to the yield stress.
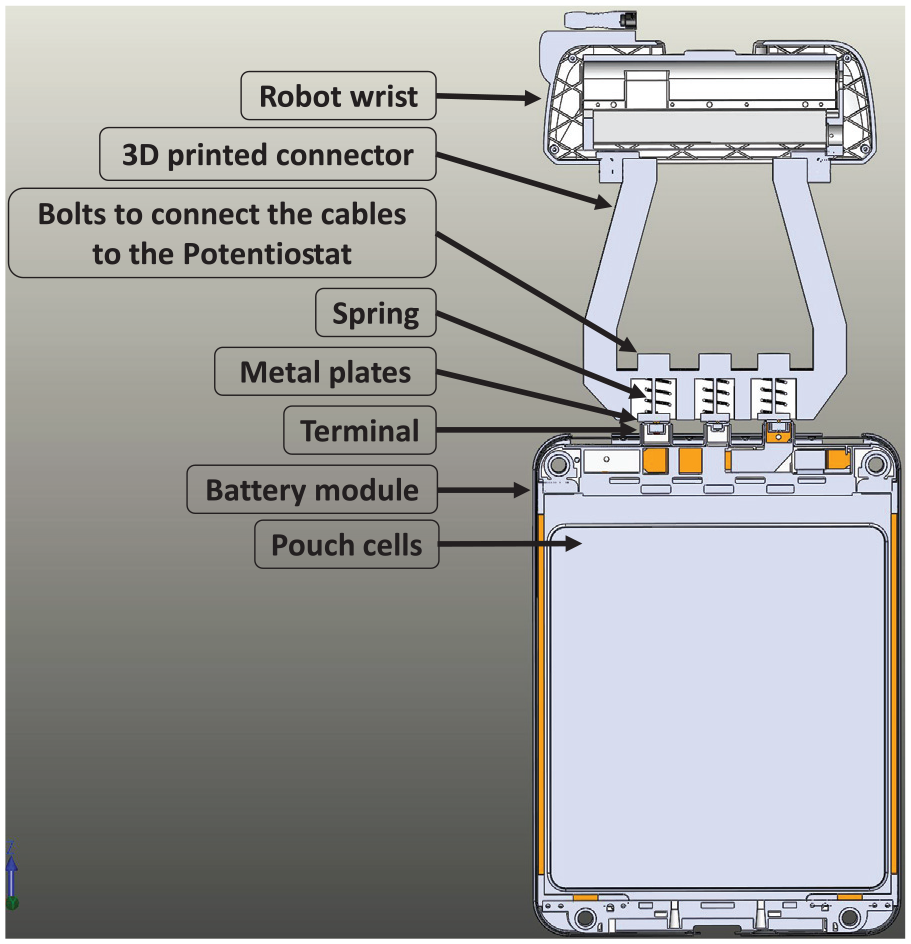
Cross-section view of 3D CAD model of the robot’s wrist and gripper, EOAT and the LIB. Metal plates in the connection box are supported by springs to provide extra compliance in contact with the LIB’s terminals.
The interaction force was measured by the robot joint torques when the EOAT connects to the LIB terminals. This force was measured prior to connect the EOAT to the Potentiostat. The measured interaction force in the real world was used as a reference value for the force in simulation; the same amount of force was applied normal to the EOAT attached to the robot’s end-effector. The contact sets were defined carefully between the metal plates’ surfaces and their corresponding terminal surfaces. Mesh model was created with a maximum element size of 25.4 mm and a minimum element size of 1.2 mm. FEA results provided information about strain, displacement and stress. Stress results could be represented in a different format of principal stresses, normal stresses and von Mises stress. We decided to show the Von Mises stress here in this study. Von Mises stress provides comprehensive information about the mechanical behaviour of the terminals during applying load; on another word Von Mises stress is a good indicator to check if the terminal surface remains within the elastic limit and do not yield during the experiment. The von Mises stress is formulated as follow
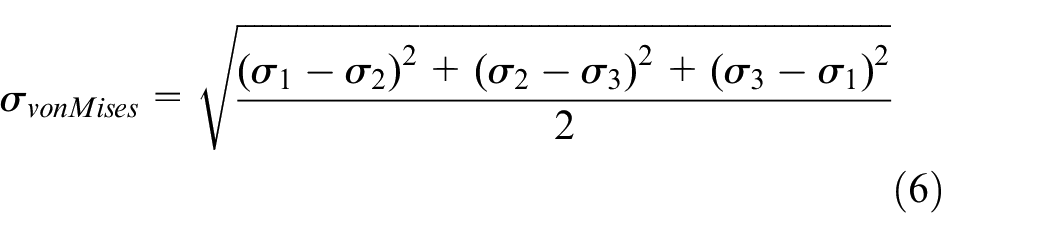
where
Experimental evaluations
To evaluate the efficacy of the proposed framework, a series of robotized EIS tests were conducted. The results for evaluating the robustness of VS algorithm was carried out, followed by a series of FEA analysis to assess damage-free contact between the connector and the battery terminals. Finally, the collected EIS data by the robot was validated by those of collected manually.
Guiding the robot into the task space
In position-based control scheme, the pose of the camera with respect to the reference coordinate frame was used to define
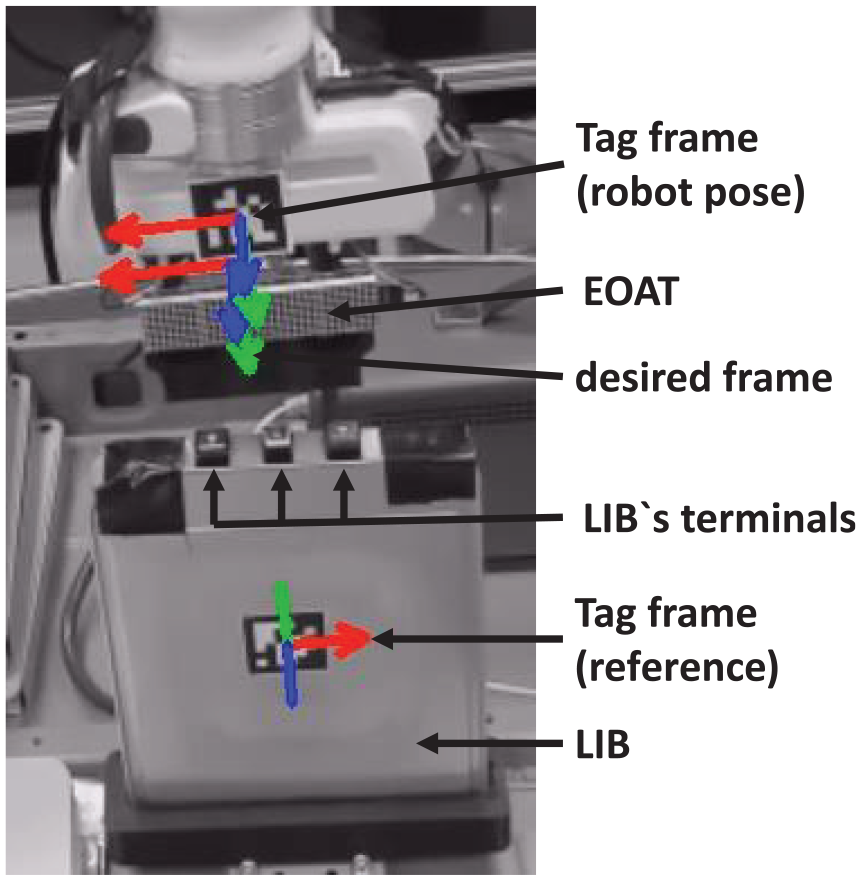
Visual servoing: error was calculated w.r.t the current camera frame, desired camera frame and a reference frame.
In this study, the accuracy and convergence of the VS technique was evaluated with three different camera resolutions. As Figure 11 suggested, the camera with full HD resolution had the quickest velocity convergence, in less than 50 iterations, in comparison with other two resolutions. The configuration of the robot in home position dictates Joints 1, 2 and 3 to have higher velocity to converge. In addition, the translational error and rotational error regulated faster when full HD resolution is used. As it is shown in Figure 11, the translational error in Y-axis and Z-axis had larger error in comparison with other translational and rotational errors. With respect to the calculated error, the rotational motion followed a geodesic with an exponential decreasing speed; therefore, the translational parameters involved in
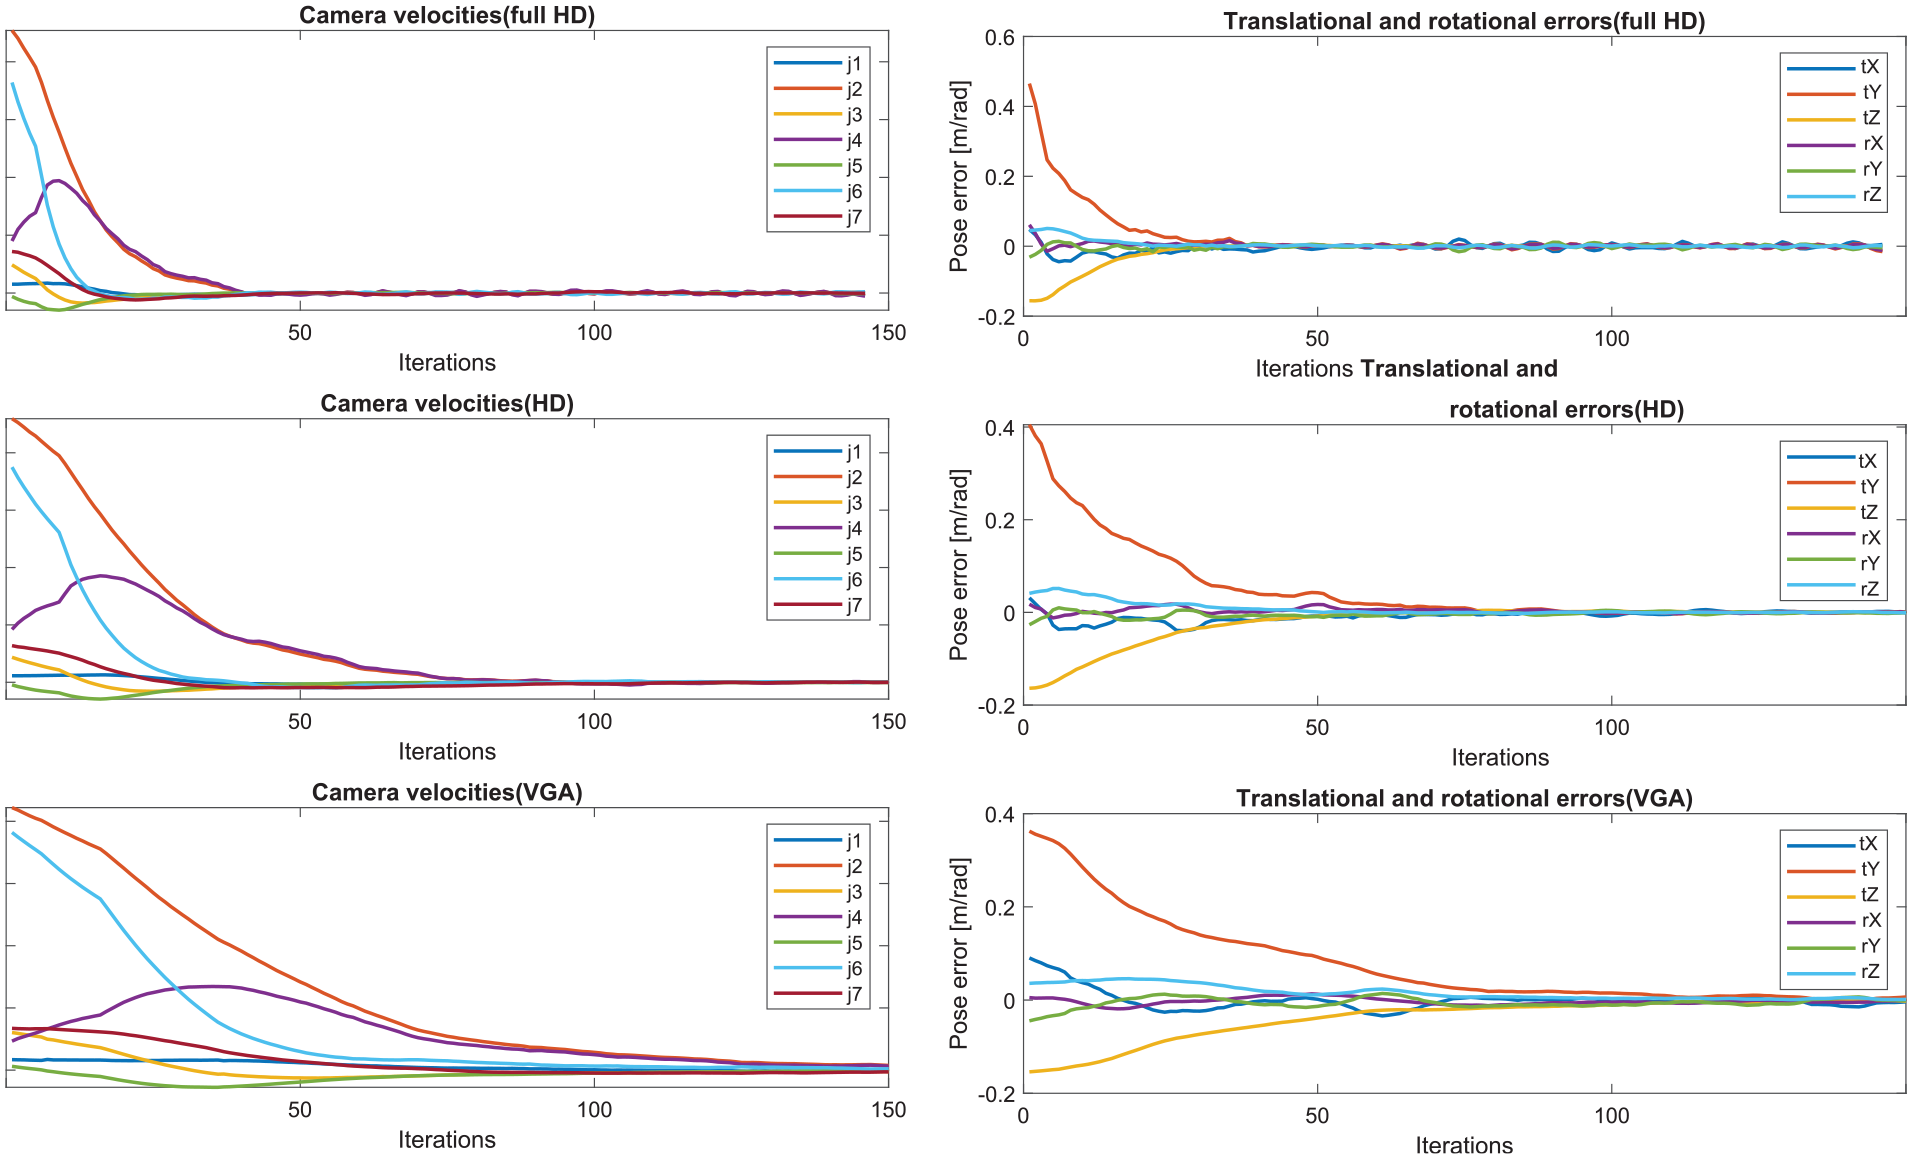
Visual servoing result for three different camera resolutions (VGA, HD and Full HD); camera velocities and positional error.
Given that using tag markers for object detection is not an efficient and practical solution in an industrial environment. Saying that this study is a proof of concept, and developing an object detection strategy is not the focus of this article; however, in future, more advanced algorithms like model-based object detection will be used to allow the system to detect various types of batteries with or without visual features (textureless) w.r.t data set models. 64
Measuring the force applied to the LIB’s terminals
To measure the interaction force, the mock-up experiment was repeated over a number of trials. We decided to choose the trial with maximum applied torque as reference for the interaction force. The amount of force applied by the robot during contact with the battery terminals is depicted in Figure 12. In time 0 s, the controller was switched from VS to impedance control system, and in instance 1.9 s, the robot made contact with the terminals and the force reached to its maximum of 7.8 N. In average, force of 2.1 N was applied to the terminals to make a stable connection. Once contact created, the Potentiostat started collecting the impedance data from the LIB. Although, this study was a proof of concept but it showed there is no need of applying significant amount of force to make a stable connection between the EOAT and the terminals. In design of EOAT, it should be considered that the metal plates have a proper contact with the terminals’ surfaces. Therefore, metal plates were fabricated in circular shapes to have maximum contact surface with the terminals. In addition to the compliance provided by the robot, the metal plates were connected to the compression springs, with size of 9.5 mm × 20 mm, to provide extra compliance during contact between the EOAT and the LIB’s terminals.
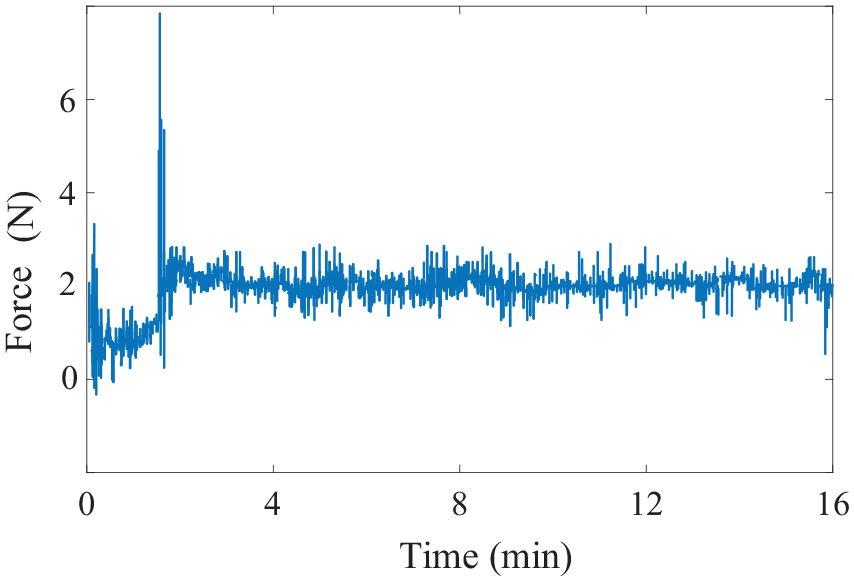
Interaction force between the EOAT and the Lib terminals.
Finite-element analysis for a damage-free contact
In the previous section, it was explained how the maximum applied force was obtained by the robot. In this section, we will investigate if this maximum force causes failure on the terminals. Therefore, we studied the Von Mises stress on the terminal surfaces to check if it yields or fractures. The terminals were modelled by 6061 aluminium alloy in simulation. As Figure 13(a) suggests, the yield strength is
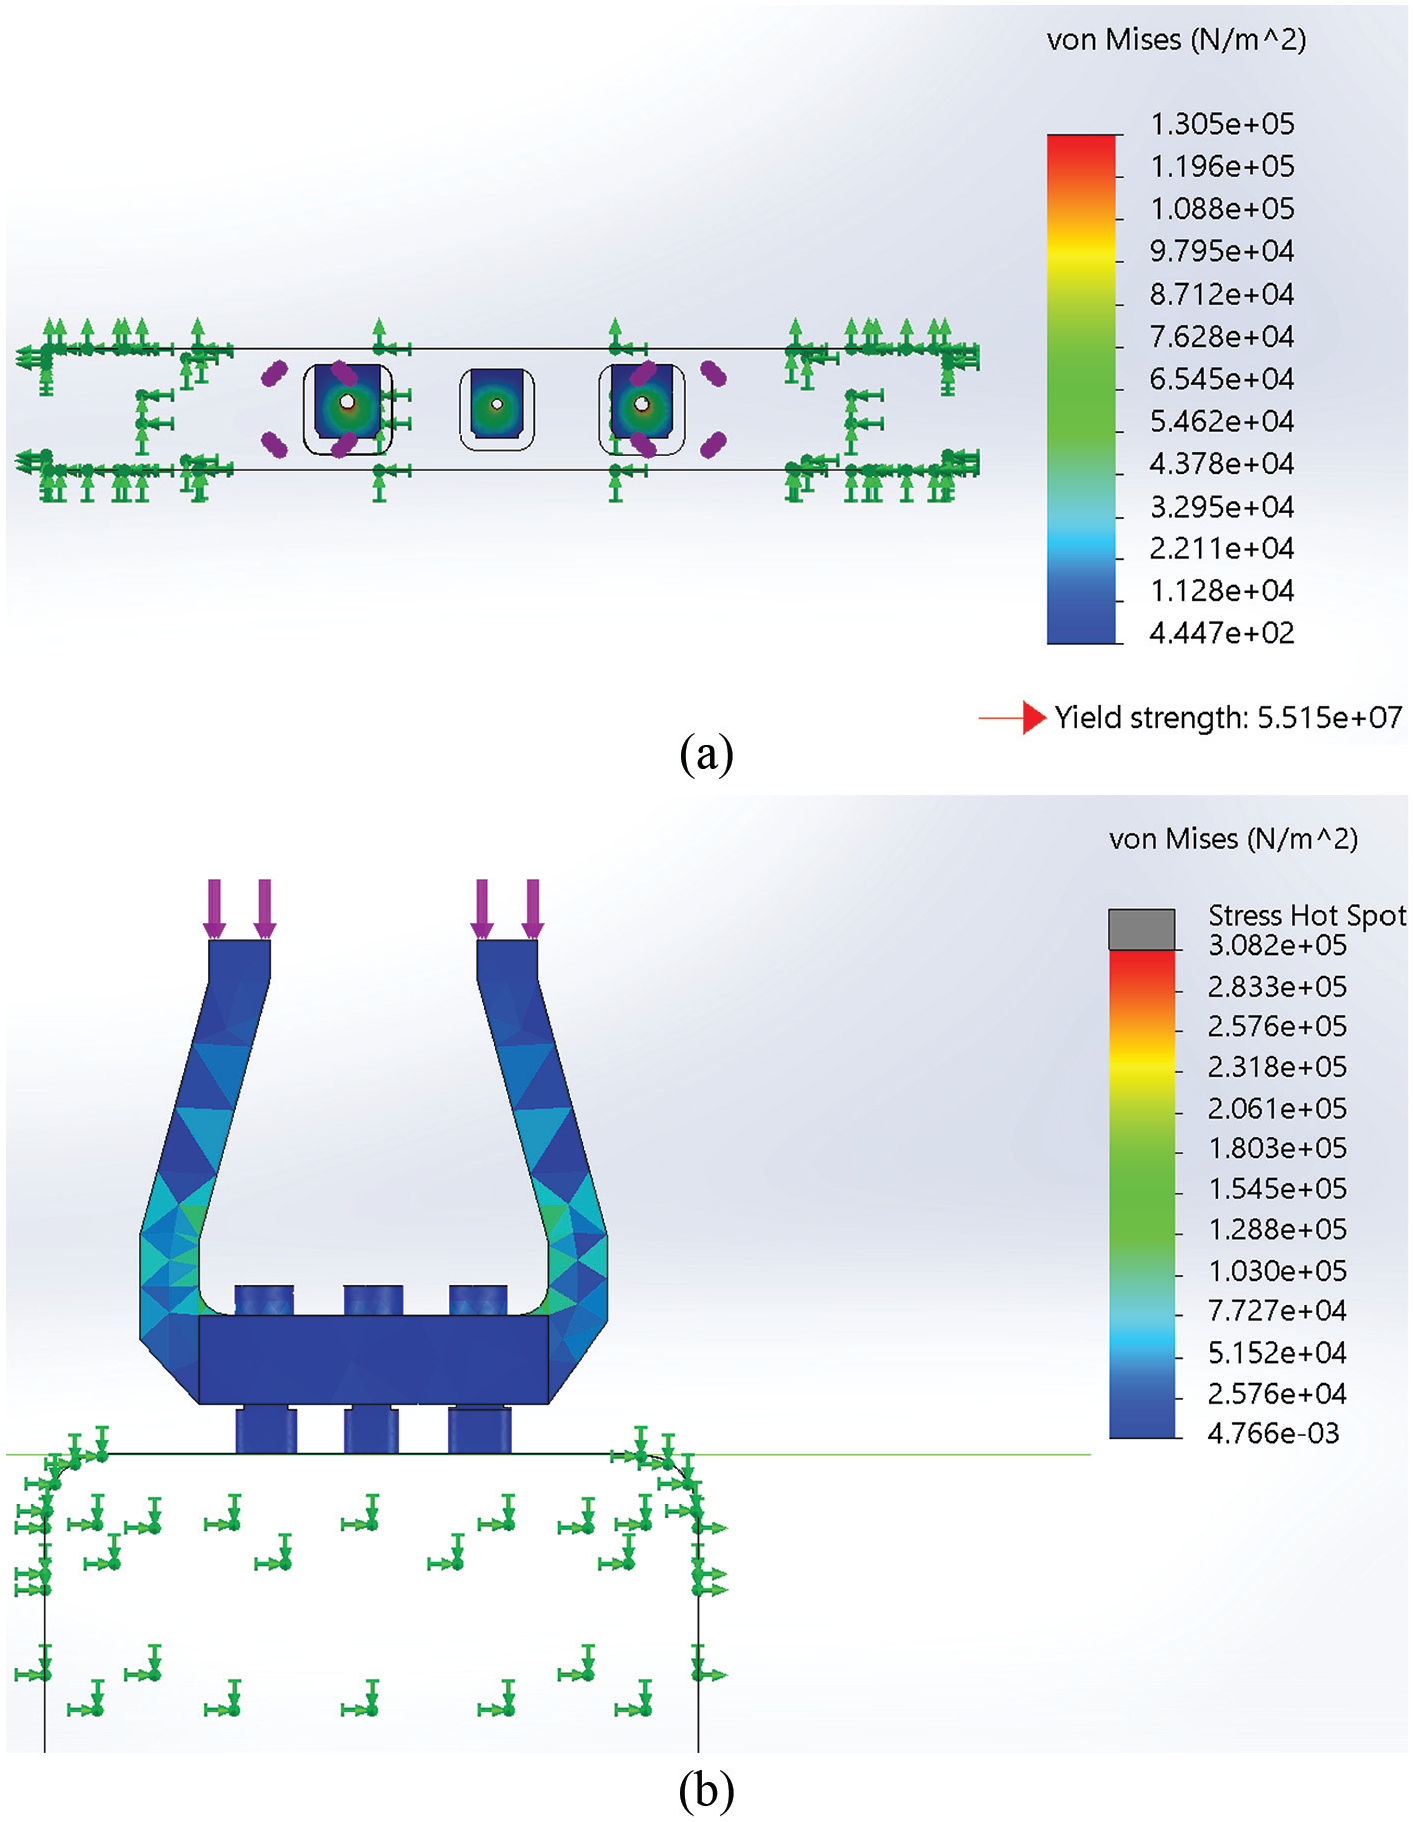
Results of Von Mises stress depicts that (a) the maximum stress appears around the centre point of the terminal surfaces (b) and on the connector handles.
The main body of the connector was 3D printed by tough PLA. The Stress Hot Spot diagnostics tool was used to detect regions of the connector where stress gradients between adjacent elements are irregular. The stress hot spot diagnostics tool detects irregular stress gradients in near connection point between the connector’s handles and the metal plate box. In future studies, author will improve the design of the connector to reduce the stress hot spots. In this study, PLA was defined as a non-linear elastic material with mechanical properties of Poisson’s ratio of
Validation of the EIS results
The aim of this study is to evaluate the robustness and accuracy of two sets of configuration for the EIS test: (1) robotized approach using a custom designed EOAT and (2) manual approach by connecting the power cables directly to the LIB terminals. This comparison was performed in order to ensure the repeatability or reproducibility of the system with no loss of accuracy. In the automated test, the open-circuit voltage is measured prior to the test to ensure that the connection is successfully established as observed in Figure 14(a). Therefore, the stability condition is met to make the EIS data valid for further analysis. This guarantees that the appropriate connection is made before applied sinusoidal began and the drift in the collected EIS data at lower frequencies is mitigated. Likewise, the causality criterion is met as the resultant signal which is the current here is caused only by the applied small voltage perturbation as shown in Figure 14(b), and at the same time satisfies the condition of linearity due to the very small amplitude of the applied signal.
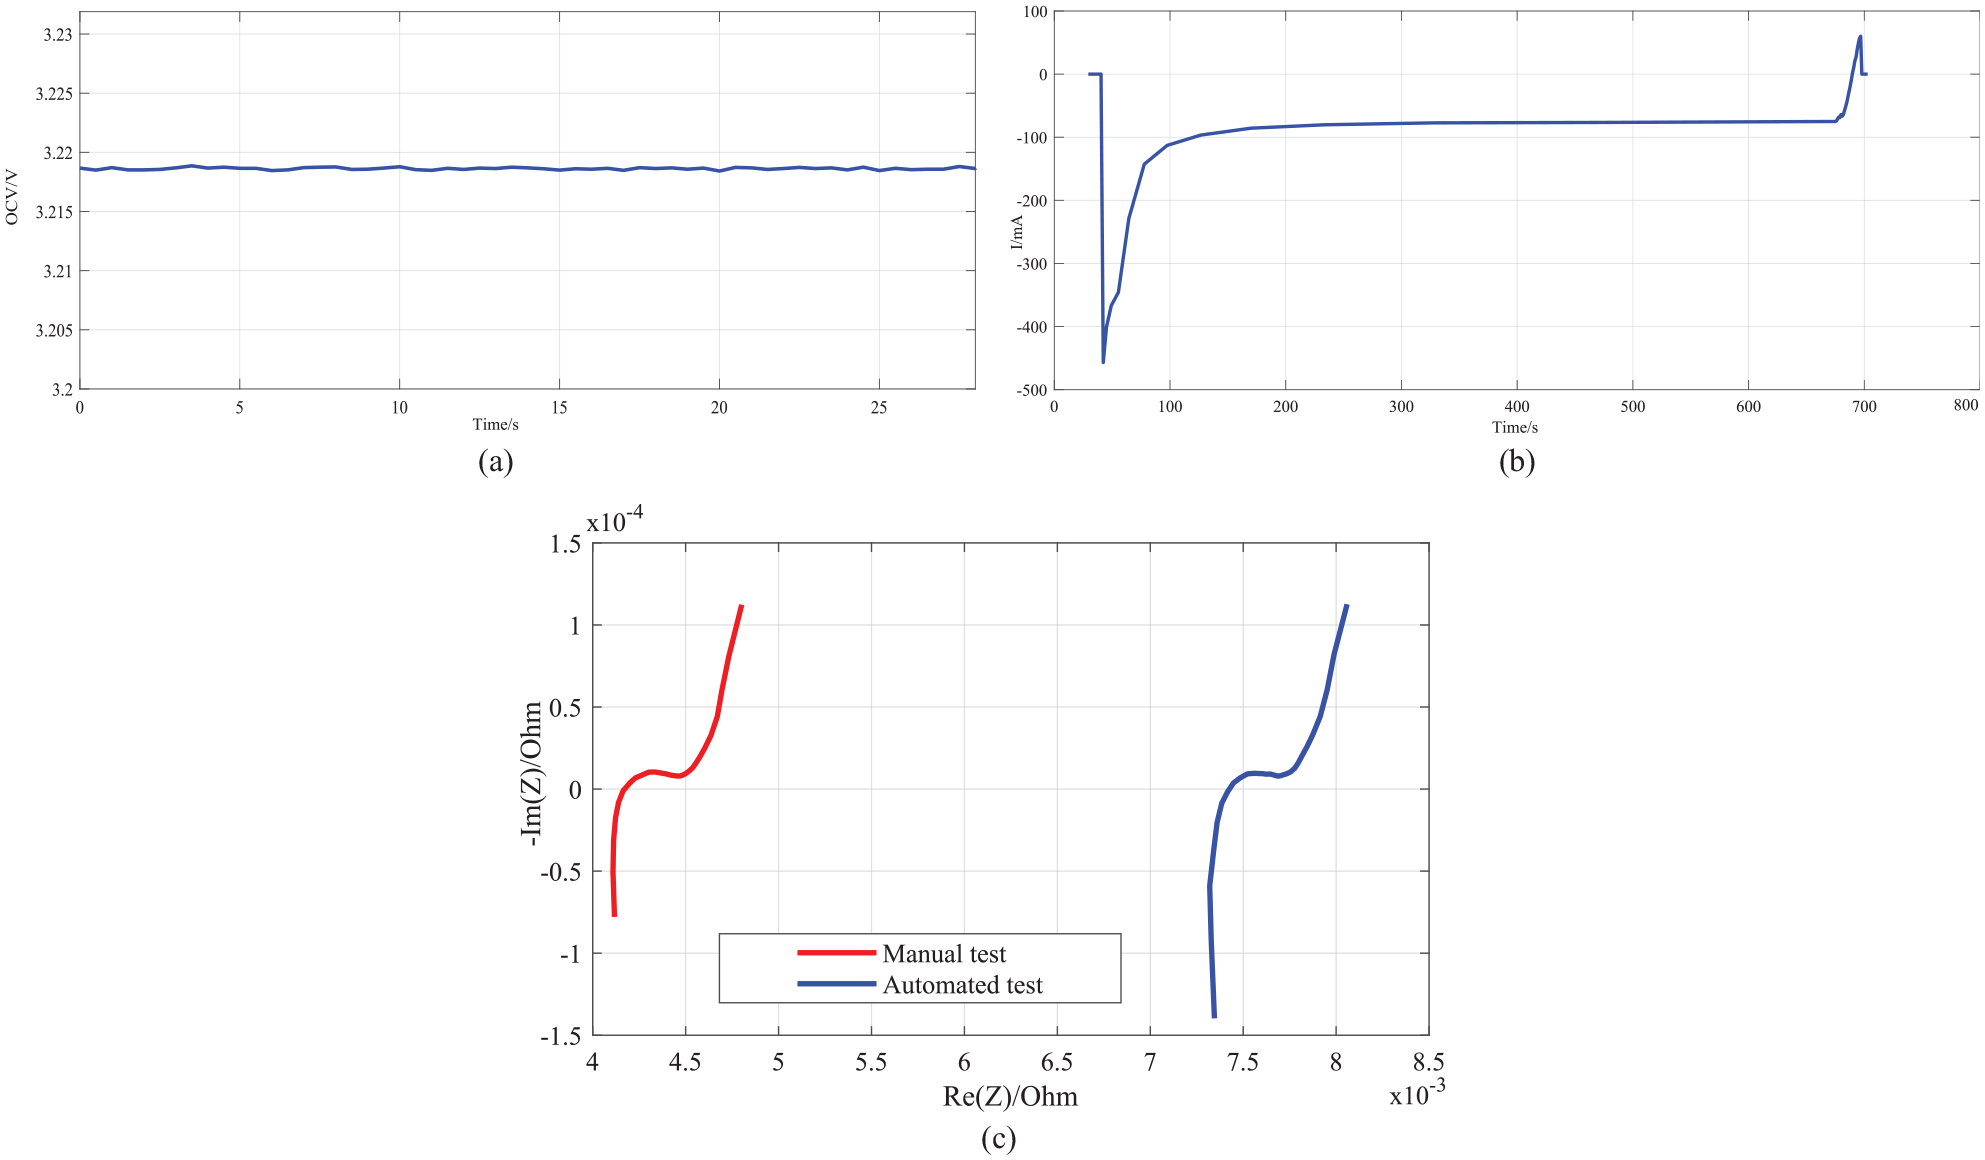
EIS results: (a) OCV before the test, (b) the current response during the test and (c) the Nyquist plot obtained from the manual and automated test.
Figure 14(c) shows the EIS data collected from both connection configurations for the same frequency range (1 kHz–15 mHz). Here, the Nyquist plot obtained from the automated test is shifted to the right which is explained by the cable extension made due to the designed connector that also appears in the longer inductive tail at the high-frequency region. To compare the plots, the EIS data were normalised with respect to the real-axis, and illustrated in Figure 15. The plots acquired show a high degree of congruent for the low- and medium-frequency region with a mean square error of 0.012. As a result, the same dynamics of the LIB module are captured from the automated test and can be further analysed to determine the SoH. It is worth noting that the same test has been repeated more than 30 trials with the same accuracy maintained.
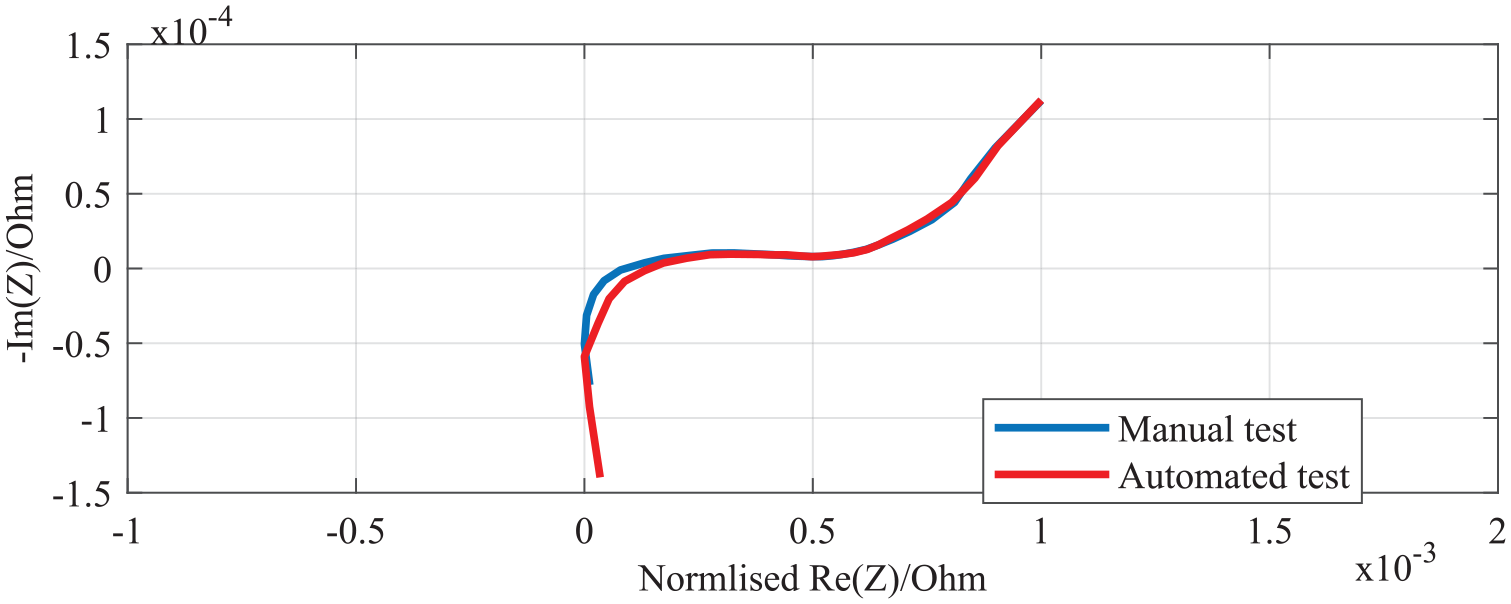
Normalised EIS data w.r.t real axis for the manual and the automated test.
To demonstrate the effectiveness of the collected EIS data as a battery health indicator, the same test was applied on three battery modules with a measured capacity of 57, 54 and 49 Ah. Figure 16 shows that the impedance spectra of the battery module with the lowest capacity have the highest intersection point with the real axis, which is related to the increase in the ohmic resistance compared with other battery modules. Similarly, the size of the semicircle is larger for the weakest battery module that can be interpreted as an increase in the charge-transfer resistance.
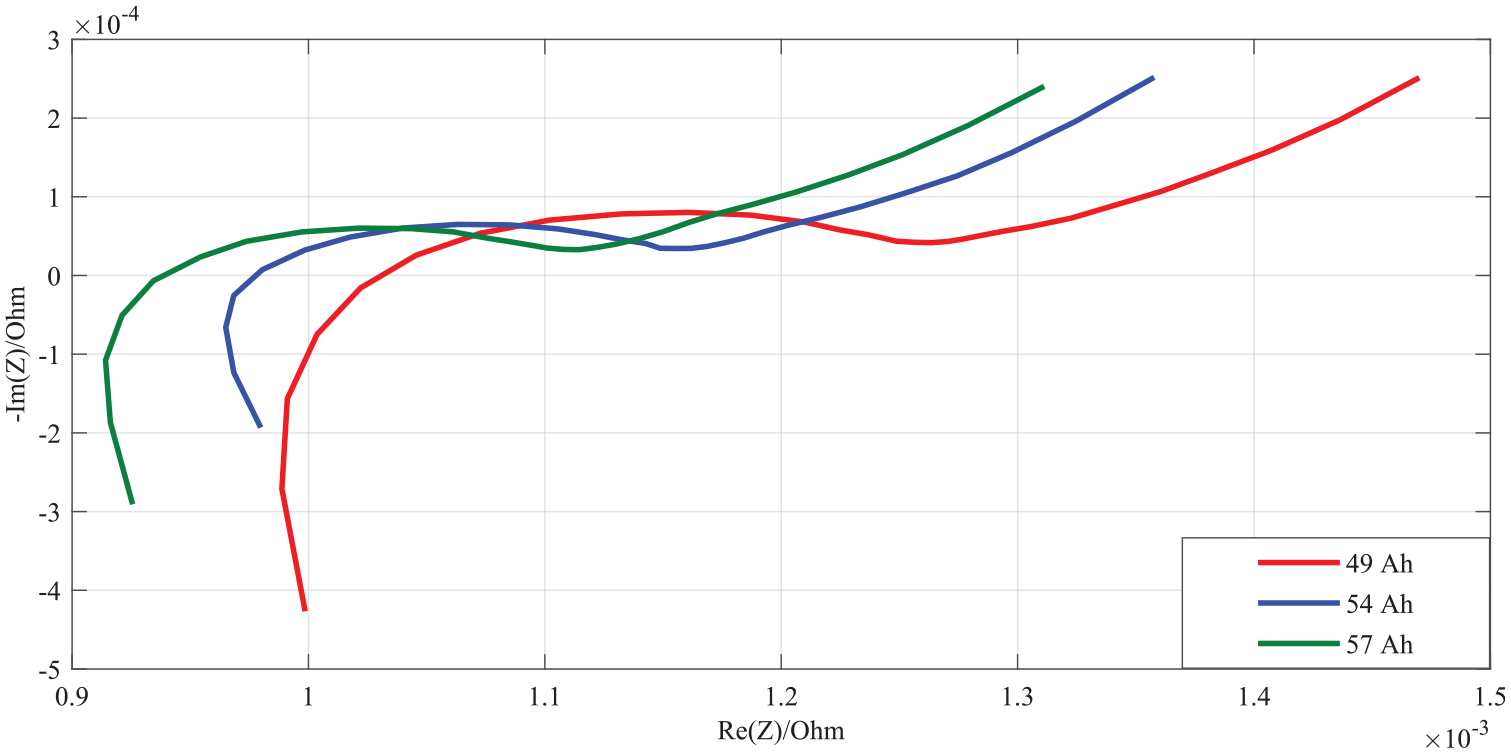
Nyquist plots for three battery modules with different SoH.
Repeatability test
The entire procedure of EIS data collection by robot was repeated over 30 trials with three different camera resolutions. Averaged time for completing the task and number of failed trials are reported in Table 1. In the previous sections, it was explained that the error of VS was regulated faster using Full HD resolution. Although the time spent for tracking and detection of the object could be minimised by defining waypoints for the robot to get closer to the stationary LIB module, VS was implemented to address uncertainties if the position of the LIB module changed. Collecting EIS data (to scan from 1kHz to 10mHz) from the Nissan LEAF battery module took 10 min in average. The entire process of EIS data collection by robot took about 615 s in average. The main reason of task failure was misalignment between the EOAT and the terminals which could be improved by implementing an adaptive stiffness for the impedance control system or modifying the clearance of the shell inside the connector in order to give more space to compensate the positional error. The other reasons associated with the failure were exceeding the joint velocities and tracking failure during VS, and another failure case was disconnection of the Potentiostat’s cables from the EOAT. In this proof of concept study, robotizing the EIS test took a bit longer than the manual approach because of implementing the sensory feedback in the control loop. Saying that, it showed that the test could be performed autonomously without human intervention with minimum safety risks. In future studies, the authors will focus on designing an advanced framework for collecting the impedance data from a stack of LIB modules (12–24 modules) simultaneously. The proposed configuration will be extended to capacity and pulse power testing, and the cost effectiveness of the system will be investigated via testing many modules, and the results and their contribution in grading retired battery modules will be evaluated for second life applications.
Repeatability: analysing the success rate of the robot in accomplishing the task of collecting the EIS data.
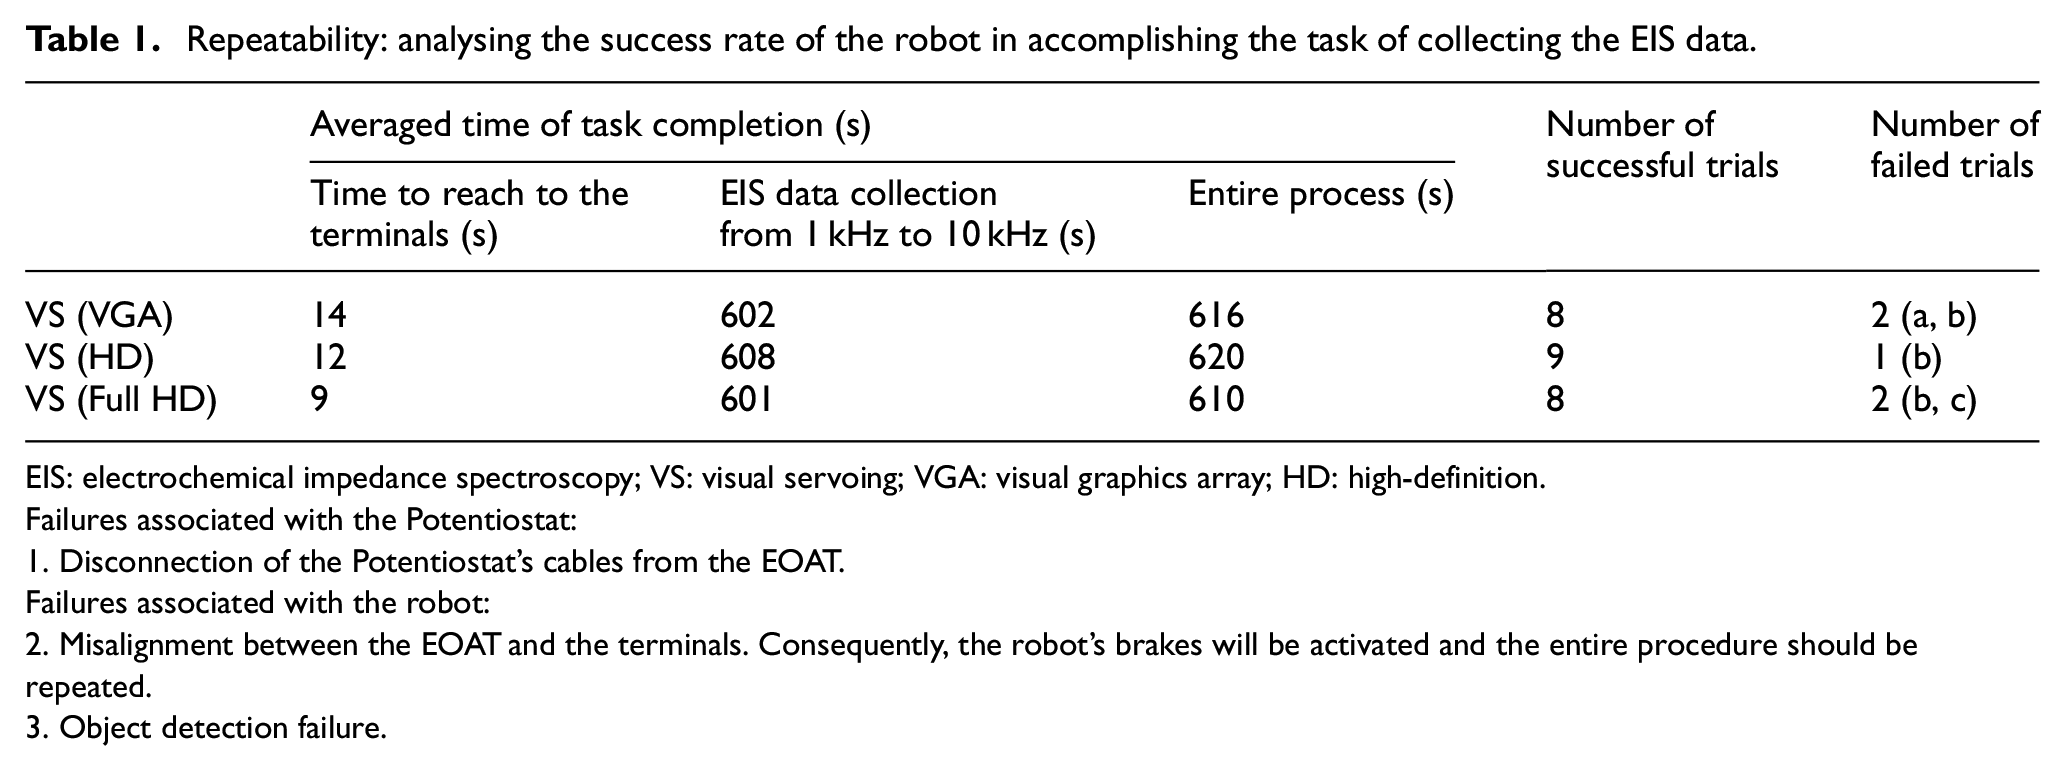
EIS: electrochemical impedance spectroscopy; VS: visual servoing; VGA: visual graphics array; HD: high-definition.
Failures associated with the Potentiostat:
1. Disconnection of the Potentiostat’s cables from the EOAT.
Failures associated with the robot:
2. Misalignment between the EOAT and the terminals. Consequently, the robot’s brakes will be activated and the entire procedure should be repeated.
3. Object detection failure.
Conclusion
To the best of the authors knowledge, this is the first research study conducted proposing a robotized mechanism for collecting the EIS data. The proposed framework minimises the human intervention during collecting the EIS data and consequently eliminates the health and safety risks associate with the LIBs. To cope with uncertainties that could be happened in real world in industry, VS technique was implemented to control the robot while tracking the desired object. A custom designed EOAT and an alarm system were mounted on a cobot’s end-effector to create interaction between a Potentiostat and LIB terminals. Once the robot reached to the offset position above the LIB, the control system was switched to impedance control in order to have compliance in contact with the battery terminals. A series of finite-element analysis performed and results suggested a damage-free contact between the EOAT and the terminals’ surfaces. The experiment was repeated more than 30 trials with three different camera resolutions, and the cobot accomplished the task with 83% success rate. The EIS results of robotic test was compared with those of collected manually, and the Nyquist plots for both automated and manual approaches were identical within the same range of frequency (1 kHz–15 mHz). In future, the proposed solution could automate the process of battery testing that allows the recycling plant to process large number of batteries in the shortest possible time via utilising the information provided by the EIS technique that considered as the fastest and most comprehensive characterisation method.
Footnotes
Acknowledgements
The authors would like to thank Dr Muez Shiref, Mr Christopher Gell and Mr Maxime Adjigble for their technical supports during the course of this research.
Declaration of conflicting interests
The author(s) declared no potential conflicts of interest with respect to the research, authorship, and/or publication of this article.
Funding
The author(s) disclosed receipt of the following financial support for the research, authorship, and/or publication of this article: This research was conducted as part of the project called ‘Reuse and Recycling of Lithium-Ion Batteries’ (RELIB). This work was supported by the Faraday Institution (grant no. FIRG005).