
Abstract
How we treat the people most in need of support is a good indicator of the state of our societies. But we lack empirical evidence on how political parties affect minimum income benefits. The classic partisan difference theory leads us to expect opposite effects of governing right and left parties on benefit levels. The analysis of 16 OECD countries over the period of 1990 to 2009 shows that this hypothesis must be rejected as – if anything – right and left parties are associated with cuts. The inconsistent party effects point towards ‘new politics’ of blame avoidance strategies. A novel approach in the field of minimum income benefits is the analysis of the context of partisanship: how do unions and migration alter governments’ effects on benefits? The effect of migration on parties cannot be captured using the net migration rate; in the future we should look at how public opinion on migration influences policies. In line with the power resources approach, trade unions show a consistently strong association with higher benefits, but they cannot constrain right nor left parties in cutting benefits. The findings confirm that the politics of new social policies differ from the politics of old ones: (1) new politics are at work, (2) signs of negotiated retrenchment between unions and right governments are not robust and (3) no evidence of coalition building between left parties and unions was found.
Keywords
Introduction
Goodbye new social risks! Hello old welfare states! Or is it the other way around? The dualisation of welfare states signifies the end of the silver age of welfare states: insiders benefit from stable benefits covering old social risks (old-age, sickness and unemployment); outsiders must rely on needs-based social assistance and minimum income benefits for new social risks (atypical employment, long-term unemployment or unstable family constellations) (Häusermann, 2012).
Cuts in those latter benefits do not come as major retrenchments, but as gradual declines through ‘non-intervention’ or ‘technical’ changes (skipping indexation, abolishment or decrease of additional benefits) (Marchal et al., 2016).
This article sets out to answer how left and right governments affect minimum income benefits (Parties → MIB) and how the parties’ effects are conditioned by unions and migration (Parties X Migration/Unions → MIB).
Do parties still matter?
Yes, but less. Both an extensive qualitative review (Potrafke, 2017) and a quantitative meta-analysis (Bandau and Ahrens, 2020) indicate a decline in partisan effects since the 1990s, but that parties still matter – and that the finding of partisan effects depends a lot on the studies’ characteristics. However, they did not cover the politics of new social policies, which should differ from the ones of old social policies (Häusermann, 2012).
Research on the politics of minimum income benefits is contradictive: while one study finds a ‘cautious positive’ (Wang and Van Vliet, 2016a) and another a negative relationship – ‘if anything’ – (Noël, 2019), a third finds a ‘clear positive’ association between left governments and minimum income benefits (Swank, 2019).
The effect of right parties on minimum income benefits (MIB) has not been addressed at all and the conditioning effects of unions not sufficiently. No other publication has looked at how migration changes the impacts which left and right governments have on benefits.
Do unions have an impact on parties?
Right parties should only be successful in cutting benefits if confronted with a weak labour movement and left governing parties need strong unions in order to implement their preferred policies.
Does migration alter governments’ policy outcomes?
Migration is expected to (1) amplify the negative effect of right-wing governments and to (2) increase the left parties’ impact on minimum income benefit replacement rates.
The results of the study run contrary to the old politics thesis. If anything, right and left parties are likely to cut benefits. However, parties try to avoid blame and conceal retrenchment of minimum income benefits by ‘non-intervention’. I do find that the politics of new social politics differ from the politics of old policies, since negotiated retrenchment (right parties blaming unions) could be at work and left parties cannot build coalitions with unions for negotiated expansion. The effect of migration on parties cannot be captured using the net migration rate; in the future we should look at how opinions on migration changes parties’ outcomes.
Minimum income benefits from 1990 to 2009
Minimum income benefits (monetary and material transfers) – as the last safety nets – are tax-financed, means-tested and granted for an indefinite period. There exists no uniform definition and there are country-specific differences regarding general, group-specific and earmarked (e.g. housing and family allowances) benefits (Neumann, 2015: 424–425).
Figure 1 shows the development of minimum income benefits in 19 OECD countries from 1990 to 2009. This timeframe is chosen as most of the data are available.
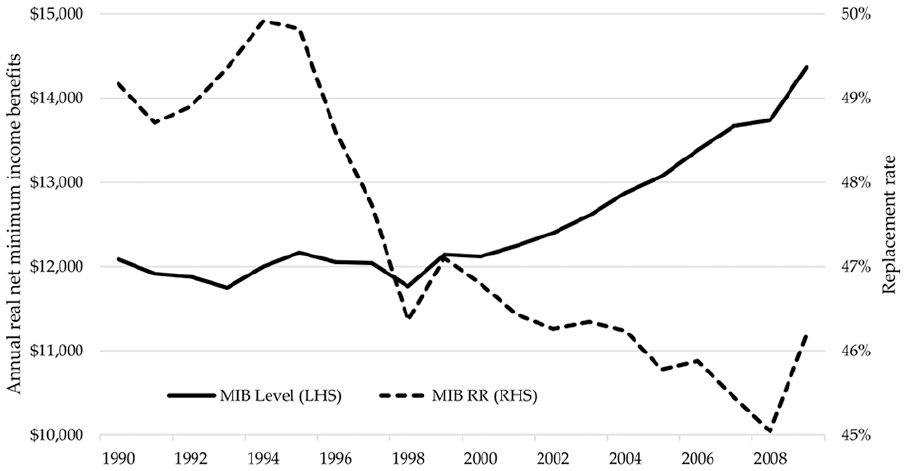
Annual minimum income benefits: absolute amounts (MIB Level) and replacement rates (MIB RR) in 19 OECD countries with complete data from 1990–2009.
The solid line in Figure 1 shows that the annual net amount of minimum income benefits (MIB level) was fairly constant for a long time and even increased in the 2000s (left scale in US dollars). The dotted line shows that the benefits, relative to average wages – that is, the minimum income benefit replacement rate (MIB RR) – declined (right scale in percent). Only by comparing the absolute figures with the replacement rates can we draw conclusions about benefit adequacy: if, for example, the benefits rise by 10%, but the cost of living by 20%, the disposable household income (and the replacement rate) decreases.
Literature review and hypotheses
Old politics: Classic partisan effects on minimum income benefits
Although Pierson proclaimed the ‘new politics of the welfare state’ (2001), newer research based on entitlements confirms that government involvement of left parties tends to correlate with welfare state expansion (or less retrenchment) and the ones of right parties with retrenchment (Armingeon et al., 2016; Giger and Nelson, 2011; Starke, 2006).
What do we know about partisan politics and minimum income benefits? Wang et al. (2018) as well as Van Vliet and Wang (2019) find ‘cautious’ evidence for a positive relationship between left governments and benefit levels: their results are only significant in the short run, but not across all model specifications. Swank (2019) finds a significant and substantive significant positive impact of left partisan government on minimum income protection. Another recent study by Noël (2019) finds that parties matter less in the politics of minimum income benefits: ‘If anything, the consequences of social-democratic cumulative power are marginally negative’ (p. 18). The evidence is not conclusive, and I formulate the following hypothesis:
H1: If anything, the higher the proportion of left (right) parties in a government cabinet, the higher (lower) the minimum income benefit replacement rates.
Party effects conditioned by unions
In line with the power resources approach, recent evidence shows that union density positively correlates with minimum income benefits (Van Vliet and Wang, 2019). In these studies, union strength is referred to as a ceteris paribus effect (Unions → WFS).
Because this ignores power relations, I am taking a novel approach by looking at how unions influence right and left governing parties in their effect on minimum income benefit replacement rates (Parties × Unions → WFS).
This study builds on the idea of ‘coherent configurations’ by Alvarez et al. (1991): left and right governments are expected to only be successful in implementing their preferred policies when the government-constellation is in accordance with the social distribution of power (union strength). This is the case when left governments meet strong unions and right governments are confronted with weak unions.
H2a: Can strong unions constrain right governments?
The argument is straightforward: unions as inclusive actors try to inhibit right governments from cutting benefits for outsiders (Zohlnhöfer et al., 2012: 45).
Right parties should only be successful in cutting benefits if confronted with a weak labour movement (coherent configuration). Vice versa, this should mean that right parties are constrained in their preferred policies, when labour movements are strong (incoherent configuration):
H2a: The right party effect on minimum income benefits is weaker (stronger), the stronger (weaker) unions are; this effect is negative at all levels of union density.
H2b: How left governments and unions interact
Work on coalition building (Kwon and Pontusson, 2009) and negotiated expansion (Jensen, 2011) shows that left governing parties need strong unions for implementing their preferred policies: Swank shows that the effect of left governments on minimum income benefits increases with higher labour organisation (Swank, 2019: 18).
What’s the story? The coalition with (strong) unions is essential for left governments to mitigate post-industrial cleavages. With the help of unions, they try to balance interests of new and old constituencies:
H2b: The left party effect on minimum income benefits is stronger (weaker), the stronger (weaker) unions are; this effect is positive at all levels of union density.
Party effects conditioned by migration
Economic literature assumes that migration directly affects welfare spending (Migration → WFS). While the disciplinary hypothesis holds that rising immigration leads to cuts, the compensation hypothesis argues that increased immigration leads to compensation measures and higher welfare expenditures (Garrett and Mitchell, 2001: 150–154). But these rather economistic views ignore political contexts by assuming that parties’ outcomes are identical. But the effects of migration depend on the mediation through the political process (Parties × Migration → WFS).
H3a: How does migration interact with the right party effect?
The expectation is a strengthening of the right parties’ effects when migration increases as they frame both labour migrants and refugees as cultural threats and undeserving (Jørgensen and Thomsen, 2016; Schmitt and Teney, 2019).
Two mechanism could be at work: (1) blame avoidance: right parties use increased migration as an excuse for cutting benefits; (2) party competition by populist right-wing parties leads right parties to cut minimum income benefits which are more utilised by immigrants.
H2b: The right party effect on minimum income benefits is stronger (weaker), the higher (lower) net migration rates are; this effect is negative at all levels of the net migration rate.
H3b: Does migration influence the left party effect?
Recent research sees left parties ‘reconceptualising’ solidarity – giving in to shifting public opinions or pressure from the right by using the frame of deserving national workers and undeserving immigrants: they become reluctant to open social protection schemes to immigrants as one type of outsiders (Jørgensen and Thomsen, 2016; Schmitt and Teney, 2019).
Having said that, there are reasons to believe that the mainstream left stands up for inclusive policies for immigrants without being afraid to defend positions that could estrange blue-collar voters (Akkerman 2015: 61). Lipsmeyer and Zhu find evidence that left-wing governments increase unemployment benefit generosity when faced with rising immigration (2011: 655). In line with the more classical approach, I hypothesise that left governments try to compensate vulnerable groups:
H3b: The left party effect on minimum income benefits is stronger (weaker), the higher (lower) net migration rates are; this effect is positive at all levels of the net migration rate.
Data and method
To test the hypotheses data from 1990 to 2009 are used, since this is the timeframe made possible by the data on replacement rates. See Supplemental Appendix for case selection, data availability and description of the main variables. Due to data restrictions on migration the number of countries decreases to 16. This leaves Australia, Austria, Belgium, Denmark, Finland, Germany, Ireland, Japan, the Netherlands, New Zealand, Norway, Portugal, Spain, Sweden, Switzerland and the United Kingdom.
Dependent variable: Minimum income benefit replacement rates
The minimum income benefit replacement rate (MIB RR) is defined as the ratio of the net minimum income benefit to the wage of an average production worker in each country (Wang and Van Vliet, 2016b: 4). The indicator thereby corresponds with the replacement rates of unemployment and health insurance in calculation, but not in meaning: the MIB RR is not an income replacement, but an adequacy rate that compares the transfer payments to the average standard of living.
The data are obtained from the ‘Social assistance and minimum income levels and replacement rates dataset’ (Wang and Van Vliet, 2016b), which builds on the ‘Social assistance and minimum income protection dataset (SAMIP)’ (Nelson, 2015).
In addition to the basic benefit, minimum income benefits may include child and housing allowances as well as refundable tax credits. Not included are one-off payments for urgent and unexpected expenses. Nelson (2015) collected disaggregated data for 34 countries from 1990 to 2009 based on national regulations for three model households: an individual who has not reached retirement age, a single parent with two children aged 7 and 14, and a family with two parents and two children aged 7 and 14. In this article, the averages of the three model households are used. 1
There are limitations to the use of these replacement rates. First, they are based on model households. Second, they cannot reflect access and withdrawal conditions. Third, the data are not always nationally uniform: in Germany the average rates of the federal states are used. Elsewhere, model regions must serve as benchmarks for the entire country: Vienna for Austria, the Community of Madrid for Spain, Milan for Italy, Ontario for Canada, Michigan for the USA (Nelson, 2015).
Despite these restrictions there are two major advantages: (1) There are no problems in recording the duration of minimum income benefits as they are indefinite; (2) Using replacement rates is a major step forward in the ‘dependent variable problem’ (Green-Pedersen, 2004) as it makes assessing policy impacts for individual groups possible.
Independent variables
Cabinet share
To analyse the party effect, the cabinet share of government parties is used: ‘Cabinet posts of left/centre/right party in percentage of total cabinet posts. Weighted by the number of days in office in a given year’ (Armingeon et al., 2017: 3). The values range from 0 (no government involvement) to 100 (all cabinet posts in a government). This standard measure is derived from the Comparative Political Data Set (CPDS) (Armingeon et al., 2017).
Following Armingeon et al. (2017) I divide parties into three categories: ‘left’, ‘centre’ and ‘right’. Left parties are mainly social democratic and green parties. Right parties include secular-conservative, liberal and right-wing populist parties. Centre parties are excluded as ‘thorny issues’ (Jensen and Mortensen, 2014: 154) as their preferences towards minimum income benefits are ambivalent (Schmidt, 2016).
Comparing national cabinet shares with benefits for regions could bias the results. For example, in Austria, from 2000 to 2006 there was a centre/right government coalition at the national level, but in Vienna Social Democrats were in power. Hence, the benefit increase in Vienna would be attributed to the centre/right government. Therefore, I created cabinet shares for the model regions according to the method stated above and compare the results of the national cabinet share with the new variable that accounts for regions. 2
Comparing data of model regions with data measured at the national level brings in new complications but it is the best approximation possible. Spoiler alert: the results hardly change as the correlation of the new and old variables are quite high, for right cabinet share it is 0.77 and for left cabinet share 0.81.
Unions
Union density is used as a proxy for unions’ strength: ‘net union membership as a proportion of wage earners in employment’ (Visser, 2016: 3). The data are derived from the ‘Database on institutional characteristics of trade unions, wage setting, state intervention and social pacts in 51 countries between 1960 and 2014’ (Visser, 2016).
Migration
The net migration rate captures labour migration and excludes refugees. The OECD Migration Database (OECD, 2019) is used to calculate the net migration rate: ‘annual inflow of immigrants minus outflow of immigrants divided by 1000 inhabitants’. Unfortunately, several countries drop out of the sample as they have too few observations on emigration or – as for example, France, Canada or the USA – do not report numbers at all.
Control variables
To control for policy legacies and the type of welfare state, the overall welfare state generosity from the Comparative Welfare Entitlements Dataset (CWED 2) (Scruggs et al., 2017) is included. 3 Unemployment rates and expenditures on active labour market policies (ALMP) are used to control for labour market pressures on the budget. To control for economic and globalisation constraints real GDP growth, debt-to-GDP ratios, budget deficits, trade openness and financial openness are included. If not stated otherwise, data from the CPDS (Armingeon et al., 2017) are used and defined in the Supplemental Appendix.
Method and model specification
For the analysis of pooled time-series cross-section data the approach by Beck and Katz (1995) is used, whereby I estimate a linear regression model by OLS with panel-corrected standard errors (PCSE) in presence of panel heteroskedasticity, 4 cross-sectional correlation 5 and autocorrelation. 6
Instead of controlling for dynamics and autocorrelation with a lagged dependent variable (LDV) (Beck 2001: 123), an autoregressive model is used, since the LDV approach is inconsistent in the presence of autocorrelation (Wilson and Butler, 2007: 107) and biases the effect of the independent variable(s) downward (Podestà, 2006: 546). The autoregressive model is then corrected with Prais-Winsten. To test my variables for non-stationary Phillips-Perron and improved Dickey-Fuller tests for unbalanced TSCS data were performed (Choi, 2001) – with the result that the null hypothesis that all country series contain a unit root can be rejected.
Additional to the pooled model, a fixed effects model is used, as country specifics (e.g. electoral system) remain constant over the time period, but differ between countries (Wilson and Butler, 2007: 104). Following Allan and Scruggs (2004: 505), the lagged values (t-1) of the party variables are used, since policies become effective with a time delay.
To answer hypotheses 2 and 3, an interaction between two independent variables is modelled. The party effect (x) on minimum income benefits (Y) conditionally depends on a condition (Z): X (Z) → Y. The coefficients in such a model cannot be interpreted as the – ceteris paribus – average effect of X on Y, so graphs are used to depict the marginal effects (Brambor et al., 2005).
The specified static model in levels – including all constitutive elements of the interaction term – including correction for first order autocorrelation is the following 7 :
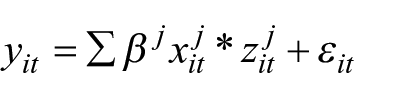

with
Empirical results
H1: Non-existent party effects point towards blame avoidance strategies
The literature led to the expectations that minimum income benefit replacement rates would increase under left and decrease under right government participation. Column 1 of Table 1 shows the result for Hypothesis 1, which contradicts these expectations: the coefficients for right and left parties are negative, but the partisan variables are not significant. The partisan effects are robust against model specification with model regions’ cabinet share, other control variables, inclusion of one, two or three parties in one model or leaving out individual countries. When looking at the short-run effects with a First Differences approach, the party effect is significant at the 5% level for right parties.
OLS regression with PCSE for hypothesis 1–3 including cabinet share of model regions.
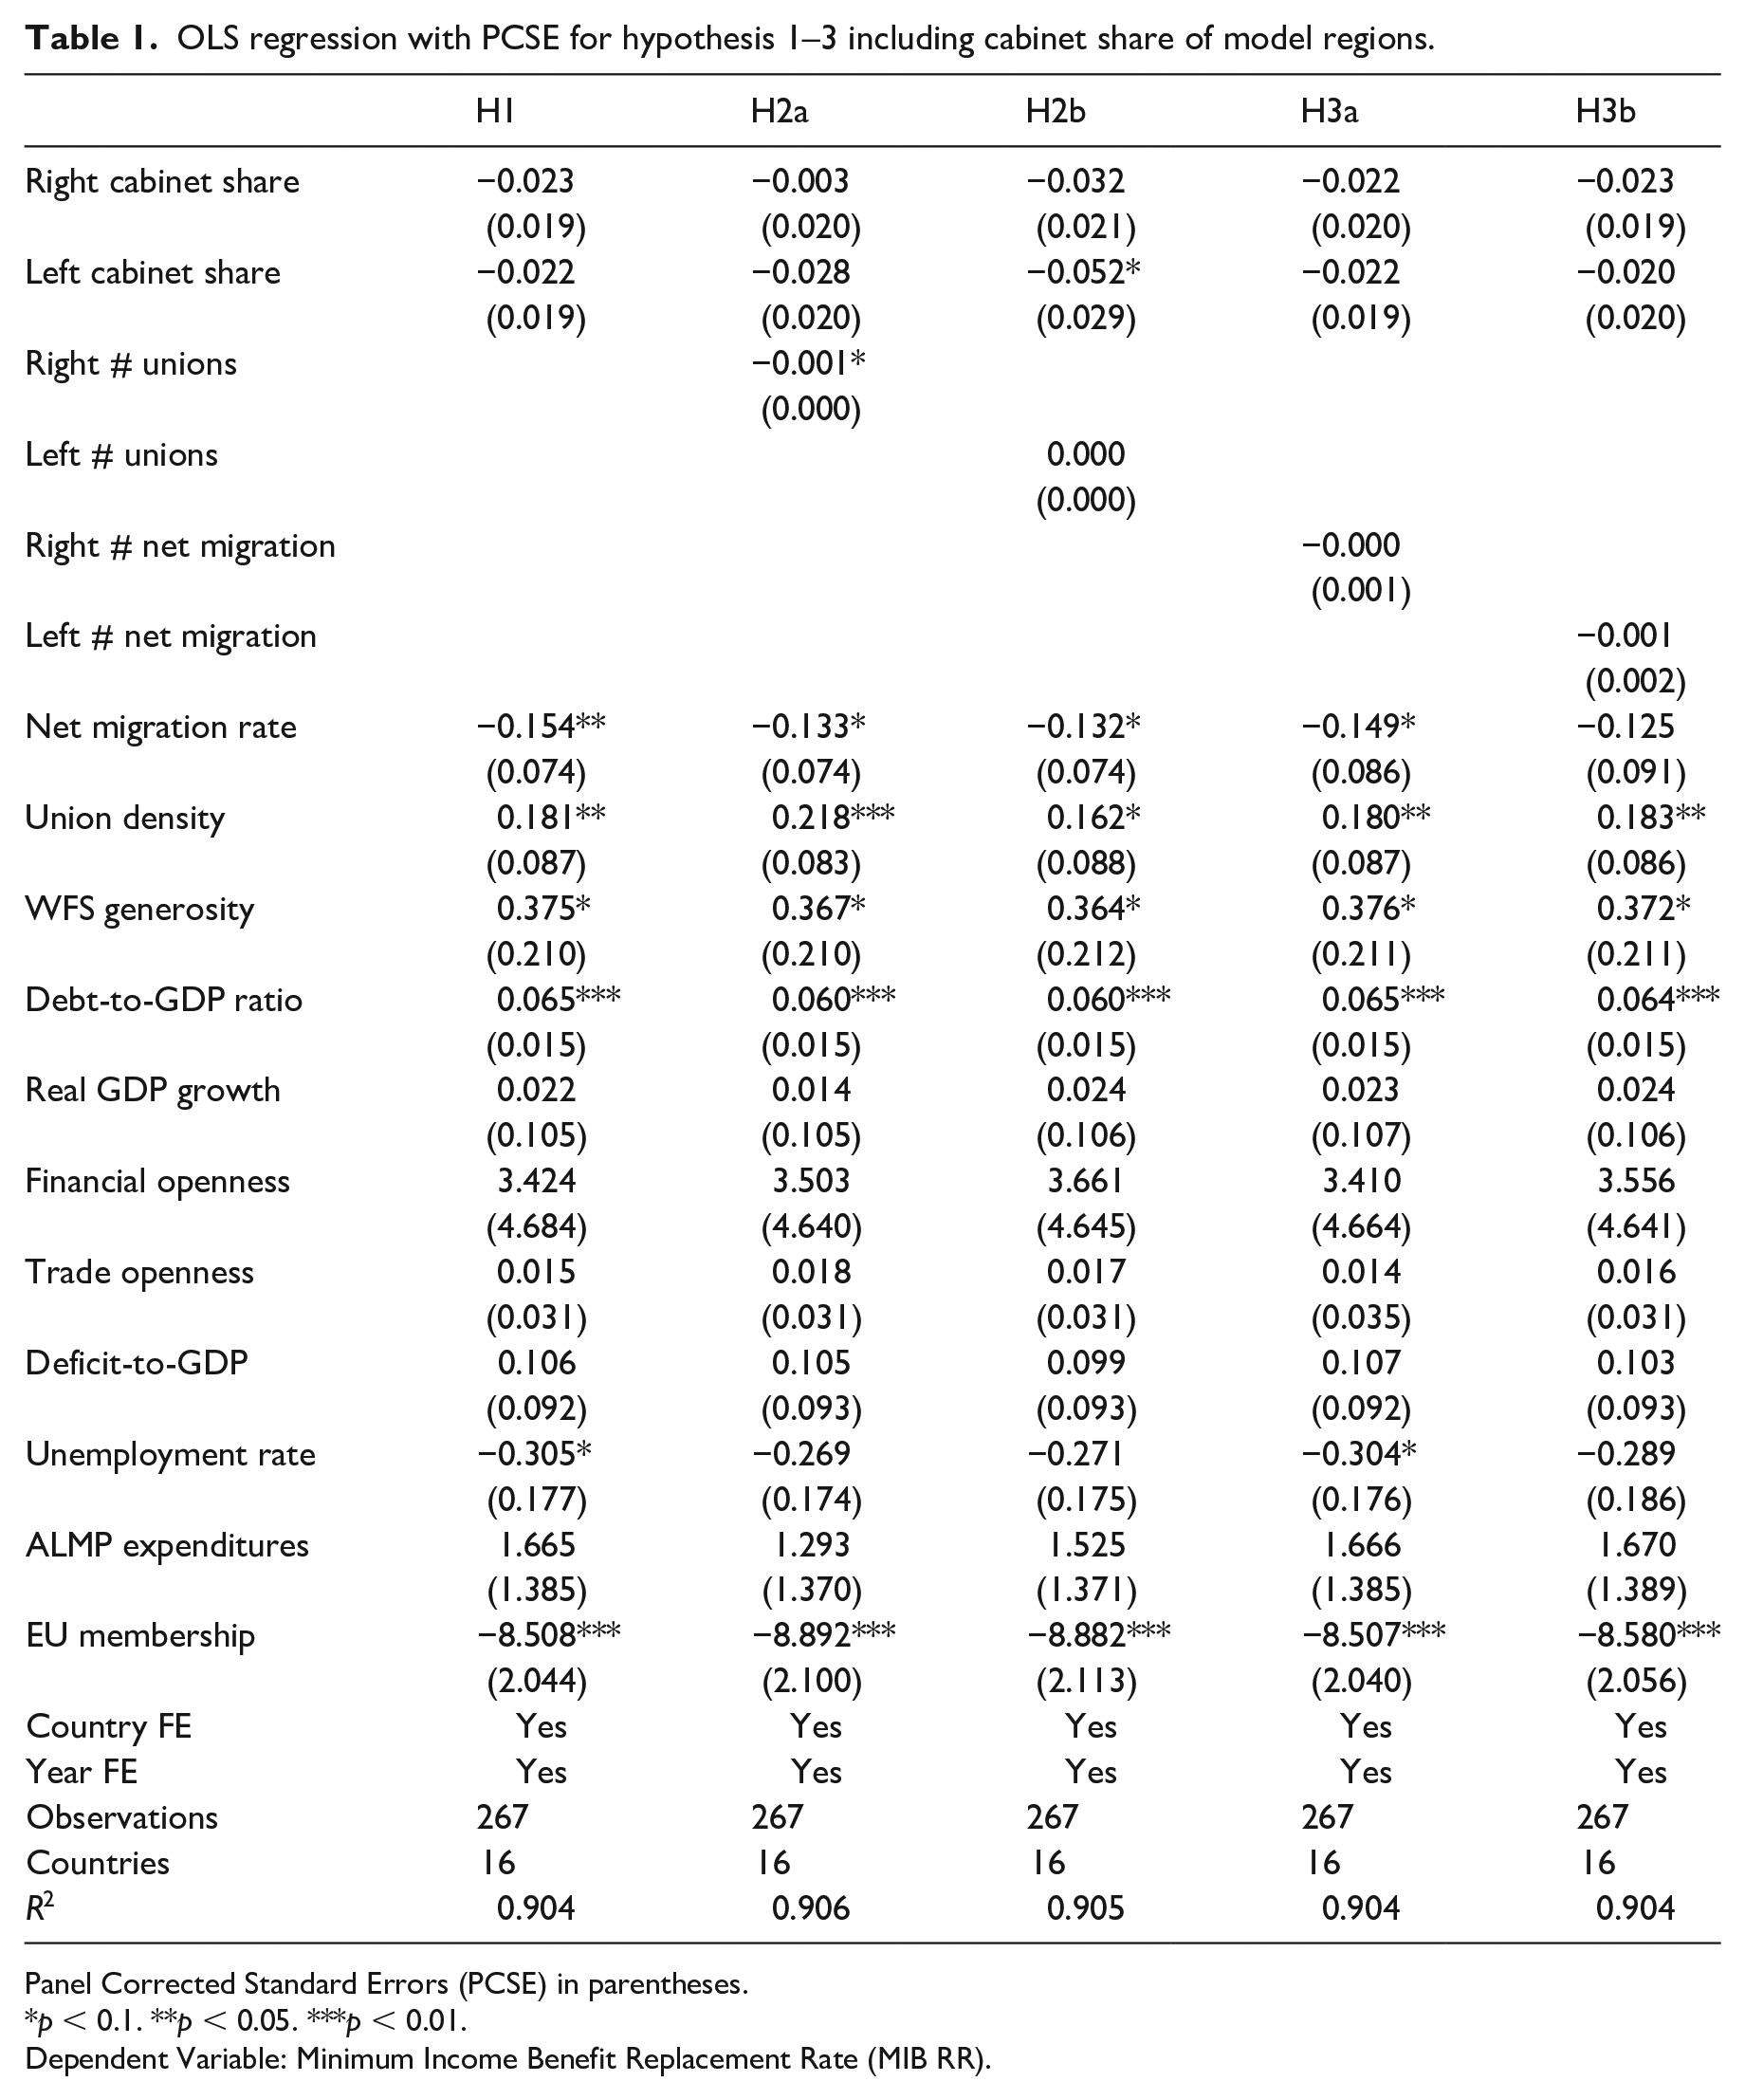
Panel Corrected Standard Errors (PCSE) in parentheses.
p < 0.1. **p < 0.05. ***p < 0.01.
Dependent Variable: Minimum Income Benefit Replacement Rate (MIB RR).
The results do not change when using the partisan variable by Swank (2018): the partisan coefficient (0.004) for right parties is slightly positive but not significant. 8 When looking at social democratic parties only, again there is no effect, while the results for the controls stay the same.
Do parties matter in the 1990s? Table 5 in the Supplemental Appendix compares the effects for 1990–1999 and 2000–2009. For the 1990s we can see a negative partisan effect for right and left parties at the 5% significance level, but not for the 2000s. Remember from Figure 1 that the replacement rates fell from 49% to about 46% in the first window (1990–1999) and only slightly changed in the second window (2000–2009). 9 Apart from the partisan variables, union density (positive, 5%-level), unemployment rate (negative, 10%-level) and EU membership (negative, 1%-level) are significant. In comparison, from 2000 onwards and over the whole timeframe, the partisan effects disappear.
Trade unions seem to have a significant effect on the benefit levels – even after controlling for time effects. This finding is in line with the power resources approach: unions advocate higher replacement rates as they position themselves as inclusive actors.
Net migration is significant across different model specifications. This effect is less surprising in the absence of partisan effects. This could be a first indication of blame avoidance strategies, since higher net migration is negatively associated with benefit levels.
The overall welfare state generosity is positive and significant at the 10% level which supports the expectation that ‘mature WFS’ have higher minimum income benefit standards (Noël 2019: 17). The highly significant and positive correlation of debt to GDP contradicts the economic pressure argument and lends more weight to this argument: states with higher social standards have a higher debt-to-GDP ratio (Sanz and Velázquez, 2007).
No evidence of the existence of globalisation constraints – measured by financial and capital openness – and economic constraints (debt-to-GDP, government spending on active labour market policies, real GDP growth, budget deficit) on the benefit replacement rates were found.
The EU-variable is negative and significant in all model specifications. This would mean that countries that are EU members or joined the EU have lower(ed) benefits. These findings concur with the ‘race to the bottom’ hypothesis: negative market integration and neoliberal ideas emphasised a convergence towards less generous welfare states in Europe (McManus, 2019).
The first hypothesis must be rejected: right and left parties show a negative coefficient, but the results are not significant. If anything, both right and left parties show a negative correlation in the 1990s. These findings run contrary to the ‘old politics’ hypothesis, suggesting that parties’ explanatory power has decreased.
H2a: Unions cannot constrain right parties
Column 2 in Table 1 shows a significant result for the interaction term of right cabinet share and union density at the 10% significance level. The results can only usefully be explained graphically: the left graph in Figure 1 depicts the marginal effect of right-wing government on the MIB RR conditioned by unions.
The marginal effect is significant (p < 0.10) with a union density of 54% or higher, because this is the point where the confidence interval falls below 0. Although the slope of the marginal effect line is clearly negative, the effect size is not substantive, since the confidence intervals at the two extremes of the y-axis overlap. As guidance: union density is above this level in 32% (85 of 267) of the observations. Here again, when using the timeframe from 1990 to 1999 the results are significant and substantive, which strengthens the point, that unions cannot constrain right parties (see Supplemental Appendix).
Interaction terms are inherently symmetric. You can look at the other side in the Supplemental Appendix: the marginal effect graph for the conditional effect of trade unions on MIB replacement rates constrained by right parties does not yield significant nor substantive results.
Do trade unions constrain right parties in their abilities to cut benefits? No, the present evidence means the rejection of Hypothesis 2a, since trade unions don’t condition the negative effect of right-wing parties. 10 On the contrary: if anything, the stronger trade unions are, the stronger the negative effect of right-wing governments on the minimum income benefit replacement rate.
H2b: Unions cannot change the negative left party effect
The results for the interaction term of left cabinet share and union density in column 3 in Table 1 are not significant, but the coefficient for left cabinet share is at the 10%-level.
The right graph in Figure 2 shows the interaction effect of left parties conditioned by unions. The slope of the marginal party effect is positive in the left graph. Although the effect is significant (confidence intervals below 0) from a union density of 0% to 36%, the confidence intervals overlap at the two ends and the point estimate is negative across the whole range of union density. Union density is in the range of 0% to 36% in 57% (152 of 267) of the cases. As with partisan effects before, when looking at the time from 1990 to 1999, there is a significant and substantive effect of how unions influence left parties. This would indicate that in the 1990s left parties cut benefits less when union density is higher (see Supplemental Appendix).
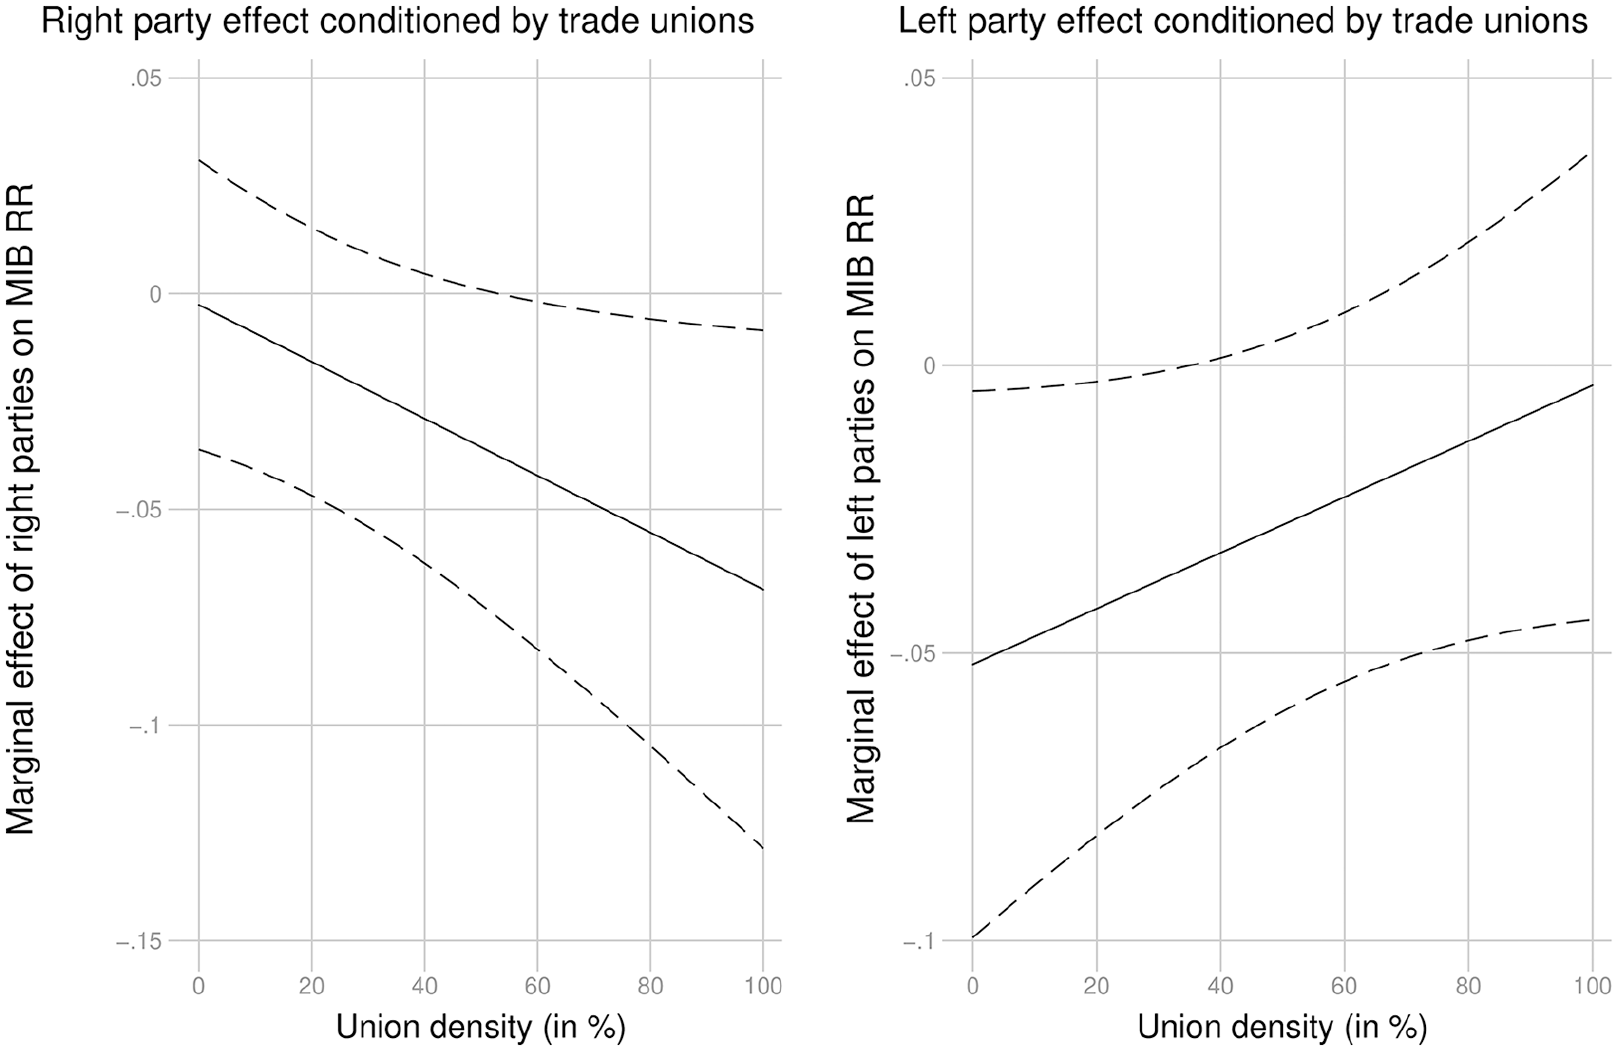
Interaction effects of parties and unions on minimum income benefit replacement rates (left graph: H2a, right graph H2b).
As before, the marginal effect graph for the conditional union effect conditioned by left parties does not yield significant or substantive results (Figure 3 in the Supplemental Appendix). There goes hypothesis 2b: although the slope points in the ‘right’ direction – meaning that the negative left party effect would become weaker, the stronger unions are – the effect is neither significant nor substantive. 11 In addition, the left party effect is negative at all levels of union density. Hence, there is not sufficient evidence that left governing parties are conditioned by unions and the hypothesis must be rejected.
H3a&b: Migration does not alter parties’ outcomes
Do partisan effects occur when interacted with migration? No. As evidence for the effects of government parties is lacking, this is not very surprising.
Neither the interaction effects in columns 3 and 4 of Table 1 are significant, nor are the partisan or net migration coefficients. This is reflected in the interaction graphics, which will only be described here: the slopes for left and right parties interacted with net migration are basically zero, the confidence intervals are not below zero and overlap. This time there is no difference between the 1990s and the 2000s. Even when controlling for the countries where union strength remained relatively stable (Belgium, Denmark, Finland, Norway and Sweden) there is no difference in outcomes.
There is no evidence that the parties’ effects are in any way conditioned by net migration rates: both hypotheses must be rejected.
Discussion: how to interpret the results
(No) party effects in times of permanent austerity
This analysis runs contrary to findings by Wang et al. (2018) and Swank (2019) who find evidence of left parties increasing benefit levels, but is confirmed by Noël (2019), who concludes that parties matter less in the politics of minimum income benefits. According to Pierson (2001) ‘permanent austerity’ has become the new frame for making retrenchment of welfare states necessary.
The difference to the results of Wang et al. (2018) could lie in using a different sample. While they include 26 OECD countries, the sample of this article is reduced to 16 because of limitations on net migration data. Swank (2019) uses a different operationalisation of partisan impacts (and union strength), which leads to different findings. This might also be the reason why I cannot reproduce his results of negotiated expansion for left parties and unions. Having said that, the results of Noël (2019) are quite similar as he uses a similar sample and operationalisation.
As we have seen in the descriptive part, the benefit replacement rates have gone down. What does this say about partisan politics? The results point towards ‘welfare reforms by stealth’ (Jensen et al., 2018; Otto and Van Oorschot, 2019), whereby governments try to avoid blame by enacting ‘invisible’ policies – by not adjusting nominal benefit levels to inflation and wage developments – as ‘frontal assaults on the welfare state carry tremendous electoral risks’ (Pierson, 1996: 178).
It seems mainstream left and right parties deliver similar political outcomes with different justifications: while right parties prefer lower social transfer payments there are two lines of reasoning for the possible negative left party effect (in the 1990s): (1) The ‘Nixon goes to China’ argument states that left parties – as credible guardians of welfare state achievements – can better justify welfare cuts. (2) Research shows that social democratic parties have aligned their ideological preferences to a new electorate, which also advocates liberal market reforms (Häusermann et al., 2013: 227).
Unions cannot change left and right governments’ effect
In a ceteris paribus setting I find striking evidence that trade unions oppose cuts. As expected – and in line with empirical findings (Noël, 2019: 16; Van Vliet and Wang, 2019) – unions are associated with higher minimum income benefits. But when interacted with the partisan variables, I cannot find enough evidence that unions change parties’ outcomes. First, they cannot constrain right parties. Second, the evidence that left parties build coalitions with unions to mitigate post-industrial cleavages is not strong enough for the whole period of interest.
When looking at the 1990s only, the stronger unions are, the stronger is the negative effect of right-wing governments on benefits. This counter-intuitive result points to ‘negotiated retrenchment’ (Jensen, 2011): without unions, right parties would have to bear the responsibility for cuts alone, but when there are strong trade unions, right parties can frame retrenchment policies as a necessity negotiated with the unions.
The results for the interaction of left parties and unions are contrary to the idea of ‘coalition building’ or ‘negotiated expansion’: left parties are associated with cutting benefits in the 1990s, even when union density is high. These findings are contrary to what Swank (2019) finds, but this could be due to a different operationalisation of partisan effects and union strength: first, he finds cumulative left partisan effects in the first place and second, he uses an index for union organisation.
It must be migration then!
The robust and significant negative association between net migration is interpreted in terms of blame avoidance: parties try to shift blame on (labour market) pressures from increased migration.
However, it cannot be concluded that governing parties’ effect on minimum income benefits are changed by net migration rates. One reason might be the absence of partisan effects in the beginning. But for the 1990s I found (1) partisan effects and (2) partisan effects that were moderated by unions, but not by net migration.
How is it possible that net migration does not influence partisan politics? Or put differently: what are the limits of this study to capture an effect? It might be that we cannot capture a quantitative effect, since migration influences parties’ effects on benefit access, which has happened after 2015 (Jørgensen and Thomsen, 2016: 345).
Another plausible explanation is the following: net migration fails to capture the effects of migration on politics, as it is not factual indicators that shape policies, but the perceptions of those. In the case of migration that seems all the more possible, since after 2015 it was public opinion on immigration that shaped policies (D’Amato and Lucarelli, 2019).
Further avenues of research or how to write version 2.0 of this article
The availability and quality of data has improved significantly. For the independent variable there is an update in the OECD database ‘Adequacy of guaranteed minimum income benefits’, which now features data from 2000 to 2019 (OECD, 2020).
Concerning the ‘independent variable problem’ (Bandau and Ahrens, 2020: 2) one should look at new ways of measuring party effects. When looking at unions, one could try to incorporate labour organisation, which captures centralisation of power and state integration (Swank, 2019).
For migration, I would consider the perceptions of immigration instead of actual figures. By using data from the Eurobarometer or the European Social Survey we could probably capture a moderating effect on governments.
There Is No Alternative (to a conclusion)
In this article, I examined the question of how right and left governments’ effects on minimum income benefit replacement rates are conditioned by unions and migration (Parties × Migration/Unions → MIB). After regression analyses of the effects of left and right governing parties as well as graphic analyses of the party effects dependent on the conditioning factors of unions and migration the results run contrary to the ‘old politics’ thesis.
Evidence for the existence of party effects is rather weak across all hypotheses and model specifications, indicating the presence of ‘new politics of the welfare state’ (Pierson, 2001): blame avoidance strategies conceal party effects. According to the new logics of welfare state retrenchment, established parties try to avoid blame for cutting benefits through ‘invisible policies’ such as not indexing benefits or not adjusting them to inflation.
In some countries, data of model regions serve as a benchmark for the whole country. For those cases regional cabinet shares were incorporated and show that there is no difference of outcomes.
The significant trade union effects are in line with the power resources theory: unions act as inclusive actors that incorporate both labour market insiders and outsiders into their strategies and fight for higher minimum income benefits. But I fail to find substantive evidence throughout the whole period that unions change the weak right and left party effects. If anything, unions and right governments are partners in negotiated retrenchment, while unions cannot push mainstream left parties to not cut benefits.
Net migration is negatively associated with benefit levels. In the absence of partisan effects this is another indication of blame avoidance strategies, since parties are likely to use migration as justification for cuts. A moderation effect of migration on parties cannot be captured using the net migration rate. This points towards not actual figures but perceptions and public opinion on migration affecting parties’ outcomes.
We are indeed living in times of permanent austerity: either parties exert an effect and right and left parties cut back minimum income benefits; or new politics of blame avoidance are at work and parties enact welfare state reforms by stealth.
Supplemental Material
Taschwer_Appendix – Supplemental material for The political economy of minimum income benefits: How parties, unions and migration influence benefit adequacy
Supplemental material, Taschwer_Appendix for The political economy of minimum income benefits: How parties, unions and migration influence benefit adequacy by Mario Tobias Taschwer in Journal of European Social Policy
Footnotes
Acknowledgements
Thank you, Lena Raffetseder, Martin Höflmayr, Felix M. Dorn, Manuel Goditsch and Laurenz Ennser-Jedenastik for time, input and patience. I hope the two anonymous reviewers read how much better they made this article. Thanks. All mistakes remain my own.
Funding
The author received no financial support for the research, authorship, and/or publication of this article.
Supplemental material
Supplemental material for this article is available online.
Author’s note
The author is no longer affiliated to University of Vienna, Austria. He wrote the article over the course of his studies of political science at the University of Vienna.
Notes
References
Supplementary Material
Please find the following supplemental material available below.
For Open Access articles published under a Creative Commons License, all supplemental material carries the same license as the article it is associated with.
For non-Open Access articles published, all supplemental material carries a non-exclusive license, and permission requests for re-use of supplemental material or any part of supplemental material shall be sent directly to the copyright owner as specified in the copyright notice associated with the article.