
Abstract
We use a tax-benefit microsimulation model to investigate the size and distributional effects of tax allowances and tax credits in six European countries. Results indicate that tax allowances and tax credits benefit large sections of the population, not just individuals with high incomes and that together they amount to substantial amounts of foregone revenue. However, with some (important) exceptions, their effect on inequality is small. Tax allowances are generally regressive while tax credits tend to be proportional or mildly progressive. Yet, the redistributive effect of tax allowances and tax credits works in complex and often unanticipated ways. Other features of the income tax system (such as the tax rate schedule or the definition of the taxpayer unit) are as important in determining the size and direction of the redistributive effect as the characteristics of the tax allowances/tax credits themselves. Even instruments inversely linked to taxable income can be more beneficial to high-income households in some contexts. Consequently, tax allowances and tax credits appear ill-suited to target resources towards households in the bottom part of the income distribution.
Introduction
Recent debates on growing inequality and its potentially harmful consequences in developed countries have focused the attention on public policies aimed at redistributing and in particular on progressive taxation and public spending. Historical data and cross-national comparative analysis suggest that governments are indeed able to use progressive taxation and spending to reduce or contain existing levels of inequality (Alvaredo et al., 2013; Doerrenberg and Peichl, 2014).
Whereas a large body of literature has focused on measuring the size and redistributive effects of public transfers (Brady, 2005; Cantillon et al., 2003; Fuest et al., 2010; Jäntti and Danziger, 2000; Plotnick, 1984), much less is known about how governments’ use of the tax system affects the relative position of different types of households. Modern tax systems make extensive use of tax concessions that reduce the marginal and average tax rate (ATR) considerably for some categories of taxpayers. Albeit tax concessions are not usually framed as redistribution tools, in fact many of these instruments depend on such characteristics as family composition, old-age, disability status, expenditure shocks or housing needs. As such, they are at least partly designed along similar lines and have similar aims as public transfers. 1 More recently, some governments, especially in Anglo-Saxon countries, have begun to use the tax system to target lower income households through so-called negative income taxes. 2 Thus, to some extent, the role of tax concessions (or expenditures) is functionally similar to that of direct transfers and at least partly aimed at redistributing resources (e.g. tax deductions related to rent paid may be viewed similarly to housing benefits, or child related tax credits similarly to child benefits).
The consensus is that tax expenditures are an important and possibly growing spending item in public budgets (Greve, 1994; Howard, 1997; OECD, 2010). An OECD (2010) report calculates that tax expenditures amount to between 0.26 and 5.21 percent of gross domestic product (GDP) depending on country and year with Canada, the United States and the United Kingdom being the largest spenders.
By lowering the final tax liability for some groups of taxpayers, tax expenditures effectively narrow the tax base. Their reform or even abolition has been proposed as a way of increasing government revenues without raising the tax burden (Poterba, 2011). Their abolition has also been justified based on them being non-transparent, inefficient and unfair. Conversely, tax expenditures have been promoted as an alternative to benefits as a way to economize on administrative costs, reduce fraud and improve take-up by reducing application costs as well as potentially diluting stigma associated with receipt of some benefits (Greve, 1994; Howard, 1997; OECD, 2010).
A large body of literature focuses on the political processes that underlie the provision of tax expenditures and highlights the fact that these expenditures tend to receive much less scrutiny in the course of budget making compared to direct spending and therefore constitute a form of welfare that is partly ‘hidden’ from public view (Greve, 1994; Howard, 1997). They also note that tax expenditures tend to disproportionately benefit higher income groups as well as private providers of services who become powerful interests vested in the maintenance and expansion of these tax advantages (Branco and Costa, 2015; Burman et al., 2008; Howard, 1997; Toder et al., 2009). However, this result is to a large extent based on studies of the US income tax system in which deductibility of various types of expenses figures prominently and even in the case of the United States, it hinges on the exact definition of tax expenditures (Schuyler, 2014). Non-US studies have also tended to focus on tax provisions centred on particular types of expenses (e.g. health-related or mortgage interest payments; Branco and Costa, 2015; Jahoda and Godarova, 2014; Pellegrino et al., 2011). Less is known about the redistributive effects of tax expenditures functionally equivalent to cash benefits.
A different strand of research examines tax expenditures in the context of measuring the progressivity of the various components of income taxation in a comparative cross-national setting (Verbist, 2004; Wagstaff et al., 1999; Wagstaff and van Doorslaer, 2001). It finds that, while significant cross-national variation exists, tax credits and lump sum allowances are generally progressive whereas tax deductions are mostly regressive. Albeit offering valuable insights into the distributional consequences of tax relief, these studies suffer from a few shortcomings. First, several of these studies use tax returns as their underlying microdata. 3 Because tax returns do not include information about individuals who are not liable to pay tax, studies relying on them miss a serious portion of the income distribution. Moreover, progressivity and redistributive effect are calculated relative to taxable income (rather than household disposable income (HDI)). This means that any results are based on an income concept that misses important sources that are generally not taxable (such as many cash transfers). Second, the decomposition techniques used in these studies have to assume that modifying one element of the income tax code leaves all the others, as well as benefit entitlements, unchanged. Yet, modifying one tax expenditure can have knock-on effects on eligibility to other tax concessions and thus on the final tax liability. Furthermore, changes in the tax liability can in turn affect benefit entitlements. Third, with some exceptions, 4 these studies fail to examine in detail the issue of instrument design and how it may affect any redistributive effects.
Finally, the new fiscal sociology literature aims at drawing links between the structure and progressivity of the tax system (broadly defined) and ‘traditional’ social spending effort (Ganghof, 2006; Martin and Prasad, 2014; Prasad and Deng, 2009). This literature does not address the question of tax expenditures directly, but suggests that the tax system and public social spending may be alternative channels for state-led redistribution. Countries with very progressive tax systems are characterized by lower welfare spending effort, whereas high spending countries appear to rely on regressive taxation to generate revenue.
This study contributes to the literature on fiscal expenditure and to the wider field of redistribution via taxes and benefits by examining the distributional consequences of two types of tax expenditures, that is, tax allowances and tax credits present in the personal income taxation legislation of six European countries. Both types of tax expenditures ultimately reduce the final tax liability of beneficiaries, but they do so in different ways. While tax credits are provisions that directly reduce the initial (gross) tax, tax allowances work indirectly by reducing the taxable income of the taxpayer. We focus on household and individual taxation as this is the area where tax expenditure instruments are more likely to include a ‘social’, that is, distributional objective. The six countries included in the study are the Czech Republic, Denmark, Germany, France, Italy and Spain. The country selection aims to cover a variety of tax expenditure instruments as well as variation in the parameters of the income tax system itself. For example, the Czech Republic has flat rate taxation whereas Germany and France have very steep tax rate schedules. The German tax system includes many tax allowance provisions that are aimed at specific ‘disadvantaged’ categories (such as the elderly or lone parents) whereas Italy tends to use tax credits to help those same ‘disadvantaged’ groups. Denmark has a few large tax allowances that are designed to benefit large numbers of individuals whereas Spain has many small tax credits designed to benefit narrowly defined groups. Spain and Italy have tax credits that are directly linked to income (income-tested). Finally, the Czech Republic and France have refundable tax credits aimed at boosting the incomes of low earners.
The remainder of the article proceeds as follows. Given that the vocabulary on fiscal expenditure has not always been used consistently, section ‘Definitions and terms’ starts by defining and clarifying the terms used in the remainder of the article. Section ‘Methodology’ outlines the methodology used to measure the value of tax allowances and tax credits as well as to quantify their redistributive effects. The size of fiscal expenditure in the areas we cover is scrutinized in section ‘Size of tax allowances and tax credits’. Section ‘The redistributive effect of tax allowances and tax credits’ presents estimates of the overall redistributive effects of tax allowances and tax credits. Section ‘Progressivity and redistributive effects of specific types of instruments’ examines the redistributive effects but this time using narrower categories of instruments to enhance comparability and look at policy design more carefully. Section ‘Discussion’ discusses the results, and section ‘Conclusion’ concludes.
Definitions and terms
Income tax systems usually do not treat taxpayers in the same way. Various characteristics ranging from family circumstances to income to labour market status and so on can interact with the rules of the income tax system to determine a taxpayer’s final liability. In this context, the term tax expenditure has been used to refer to foregone government tax revenue due to special advantageous treatment afforded to some taxpayers (Altshuler and Dietz, 2011; Burman, 2003; Burman et al., 2008; OECD, 2010). There is very little agreement though on which rules should be classified as ‘special treatment’ and thus included under tax expenditures. Often, the choice of what to include and what not has been based on particular historical conjunctures or on specific political or administrative views. For purposes of this study, a different approach from US/OECD studies on the topic is taken. We focus on only two types of instruments, namely, deductions from income subject to taxation 5 which we collectively term tax allowances 6 and reductions in the initial tax liability which we term tax credits and disregard other types of tax expenditures (such as tax exempted income, special rates for some categories of taxpayers or some types of incomes, as well as joint taxation – including the ‘quotient familial’ in France). We include all provisions that reduce the taxable income of a taxpayer under tax allowances, including general provisions that theoretically apply to all taxpayers. Likewise, all measures that diminish the initial (calculated) tax liability are included under tax credits. Both types of instruments may be related either to characteristics of the taxpayer (e.g. tax credits for children in Italy, tax allowances for disabled persons in France or tax allowances for lone parents in Germany), or they may subsidize specific activities carried out by the taxpayer (e.g. tax credits for mortgage interest payments in France, tax allowances for contributions to private pension plans in Denmark or tax credits for renters in Spain).
In taking this approach, we aim at being as comprehensive as possible while maintaining a narrow enough focus to keep the complexity of the analysis manageable as well as to go beyond simply quantifying forgone revenue to examine which features of tax allowances and tax credits are likely to make them more progressive and how these depend on the broader design of the tax system. We opt to include all measures that reduce taxable income/tax liability, respectively, including some that are often included in the benchmark tax rules such as general tax allowances and zero rate bands 7 (and thus not considered tax expenditures). While this approach might not be suitable for some policy oriented exercises, we believe that in the context of this study it has two main advantages. First, it enhances cross-national comparability, as not all countries include these instruments in their tax codes and where they do, the size varies considerably. Second, from a theoretical point of view, the distributional consequences of general tax allowances and tax credits are of interest. These instruments are often thought to benefit lower and middle income households most. We test this proposition and examine their distributional effects in the context of different types of income tax systems (see section ‘General instruments’).
Finally, we take a completely cross-sectional view and treat deferred tax liability as a tax allowance, that is, we disregard the fact that some types of deductions may be taxed later on in life (e.g. pension contributions).
In calculating our measures, we ignore any potential behavioural effects. We only include tax instruments that are included in personal income taxation, and thus are targeted at households and not businesses.
Methodology
We calculate tax allowances and tax credits at the taxpaying unit level using EUROMOD, 8 the European tax-benefit microsimulation model (Sutherland and Figari, 2013). EUROMOD uses detailed policy rules taken from each country’s fiscal and social legislation together with information about individual and household characteristics taken from representative household income surveys to calculate tax liabilities and benefit entitlements in a comparable manner for all 28 countries of the European Union. For each respondent in the microdata, EUROMOD constructs additional variables representing the income tax liability corresponding to that individual. 9 As part of that calculation, it also computes the corresponding tax allowances and tax credits to which a taxpayer is entitled. Thus, our measures are based on simulated entitlements and not on actual claims in tax records. In interpreting results, one should keep in mind that they relate not to the actual but to the theoretic distributional effects of tax allowances and credits.
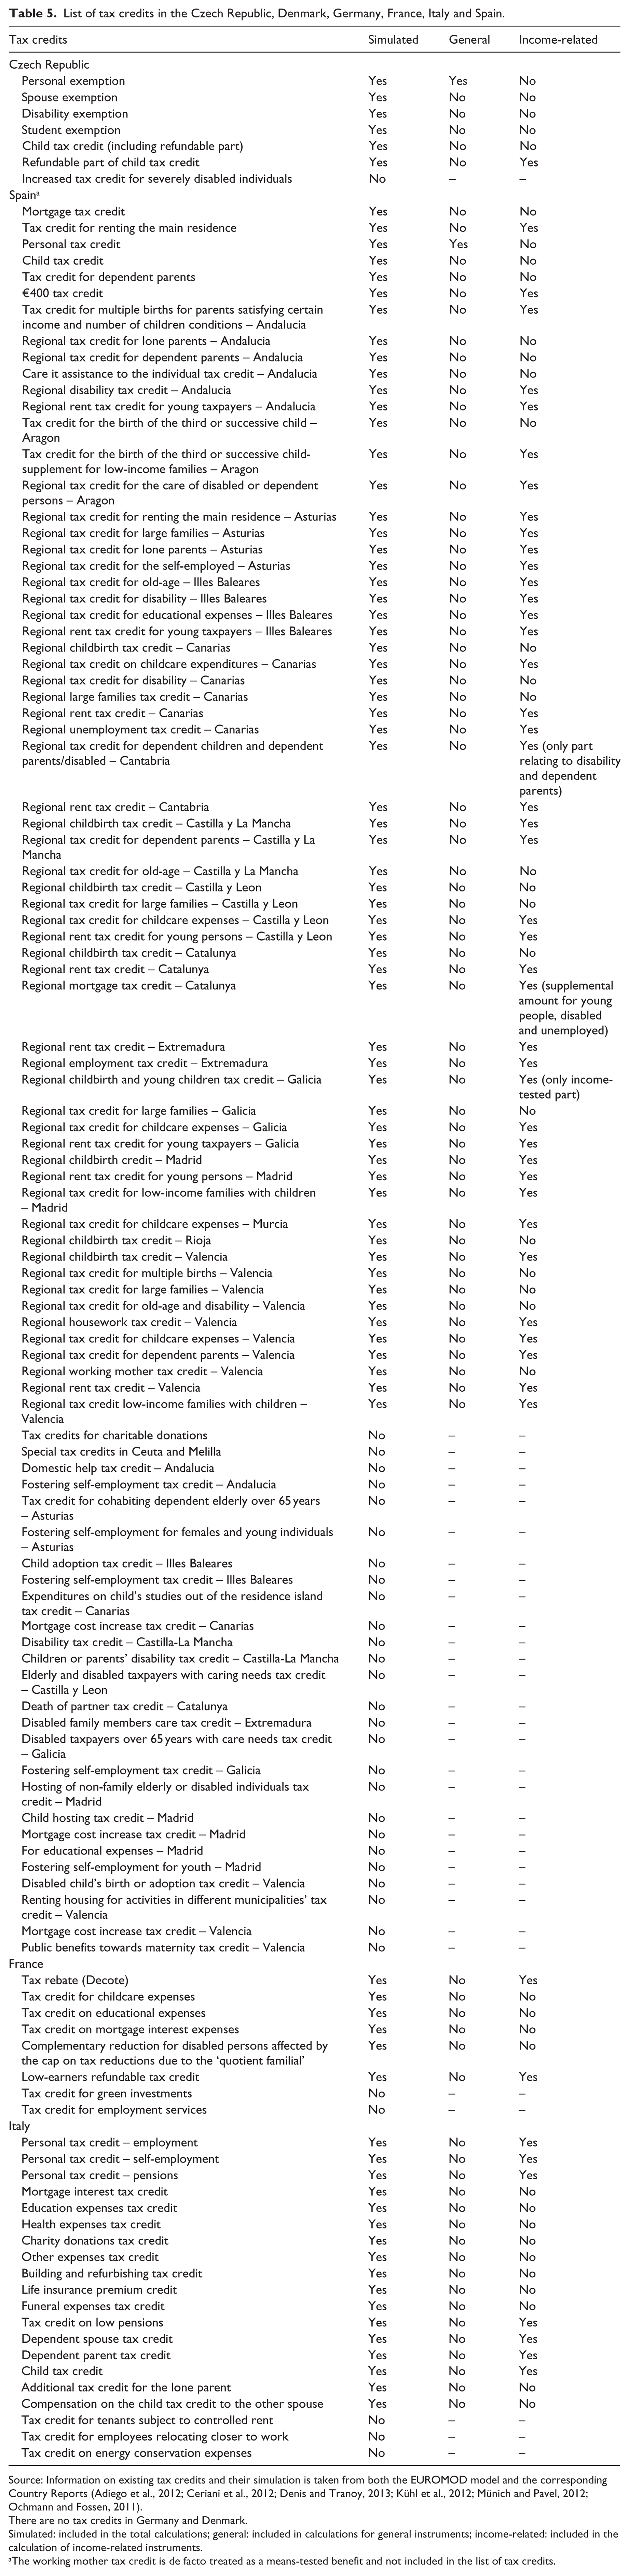
EUROMOD uses information about individual and household characteristics from a dataset based on the European Union–Survey of Income and Living Conditions (EU-SILC). 10 Unfortunately, there is not enough detail in SILC to fully simulate all tax allowances and all tax credits in our six countries (a complete list of which tax allowances/credits we are able to simulate and which not is available in Tables 4 and 5 respectively). In particular, information about many types of deductible expenditures is lacking. As such, it should be kept in mind that figures for total tax allowances and total tax credits are in all likelihood an underestimation, and distributional indices calculated for total tax allowances and total tax credits are not fully comparable across countries. Differential coverage of tax allowances and tax credits in EUROMOD is much less of an issue when we compare countries within instrument type (see section ‘Progressivity and redistributive effects of specific types of instruments’).
We construct two measures of tax allowances and tax credits, which we term, respectively, gross and net. The gross measure represents the difference in the net tax liability attributable to the existence of the tax allowance or tax credit, respectively. The net measure is calculated as the difference in net disposable income attributable to a tax allowance or a tax credit. In addition to the changes in the net tax liability, the second measure also captures any changes in benefits received as a result of altering the tax burden. 11 In both cases, we calculate these measures at the household level and adjust for household size using the modified OECD equivalence scale. We take a ‘dynamic’ approach meaning that in calculating the effect of an instrument on the net tax liability or on the net disposable income, respectively, we allow the other elements of the tax-benefit system to kick in and compensate for the change. This compensation takes place automatically, as the tax rules apply to the slightly changed household circumstances. In this way, our gross measures account for interactions between elements of the income tax system. The net measures we construct take into account the interactions between the income tax system as a whole and the remainder of the wider tax-benefit system.
To better understand the extent to which the distributional effects of tax expenditures are influenced by instrument design, we perform a separate analysis on two types of instruments which typify ‘universalism’ and ‘targeting’, respectively. The first category comprises of tax reliefs that are available to all taxpayers irrespective of income or other personal characteristics (e.g. basic/personal allowances, zero rate bands and general, universal tax credits). They are likely to cover large sections of the population and thus have a quasi-universal nature. The second category contains instruments which specifically depend on (taxable) income; they either are more generous towards low-income taxpayers or exclude higher income units altogether (e.g. non-wastable tax credits aimed at low-income earners, or income-tested child or family tax credits). They are thus specifically targeted towards the bottom of the income distribution.
Using our two measures of gross and net value, we first present estimates of the total size of tax expenditure on tax allowances and tax credits. We then show how the benefits derived from our two types of tax relief vary across the income distribution. In keeping with the existing literature, we also estimate the Kakwani index to measure progressivity and the Reynolds–Smolensky index to measure redistribution (Kakwani, 1977; Lambert, 1989). The Kakwani index is calculated as the difference between the Gini coefficient of pre-tax allowance/tax credit incomes and the concentration coefficient of tax allowances/tax credits; it shows the extent to which tax allowances/tax credits disproportionately benefit some part of the income distribution relative to the distribution of original, pre-tax incomes (in this case, HDIs re-calculated in the absence of the analysed instrument). Because tax allowances/tax credits add to (rather than subtract from) disposable income, a smaller/more negative number indicates higher progressivity. A smaller/more negative Kakwani index shows that poorer households receive relatively more income from tax allowances/tax credits whereas a higher/more positive number indicates that more affluent households benefit more. The Reynolds–Smolensky index is the difference between the Gini coefficients of HDI with and without the analysed instrument(s). It measures the reduction in inequality attributable to that instrument. The higher the Reynolds–Smolensky index, the more the instrument reduces inequality. A negative index indicates that the instrument actually increases inequality. We perform the same set of calculations both for total tax allowances and tax credits, respectively, and by instrument type. We include 95 percent confidence intervals for all our estimates. 12 In each case, we analyse tax allowances and tax credits separately.
Size of tax allowances and tax credits
Before examining the distributional aspects, we estimate the relative size of tax allowance and tax credits expenditures. Figure 1 shows the total annual revenues forgone as a result of tax allowances and tax credits in each of the six countries, respectively, as a percentage of total government revenue. Both gross and net measures are shown, as explained above. We cannot simulate comprehensively tax expenditure in all of the six countries and as such, the figures are not strictly comparable cross-nationally. Nevertheless, Figure 1 makes clear that from a budgetary perspective, tax expenditures are a very important element. Foregone revenue due to either tax allowances or tax credits exceeds 10 percent of total government revenues in Denmark, Germany and Spain. These figures suggest that resources channelled via tax expenditures can be substantial and thus it is both of interest and necessary to investigate the extent to which they affect the distribution of incomes.
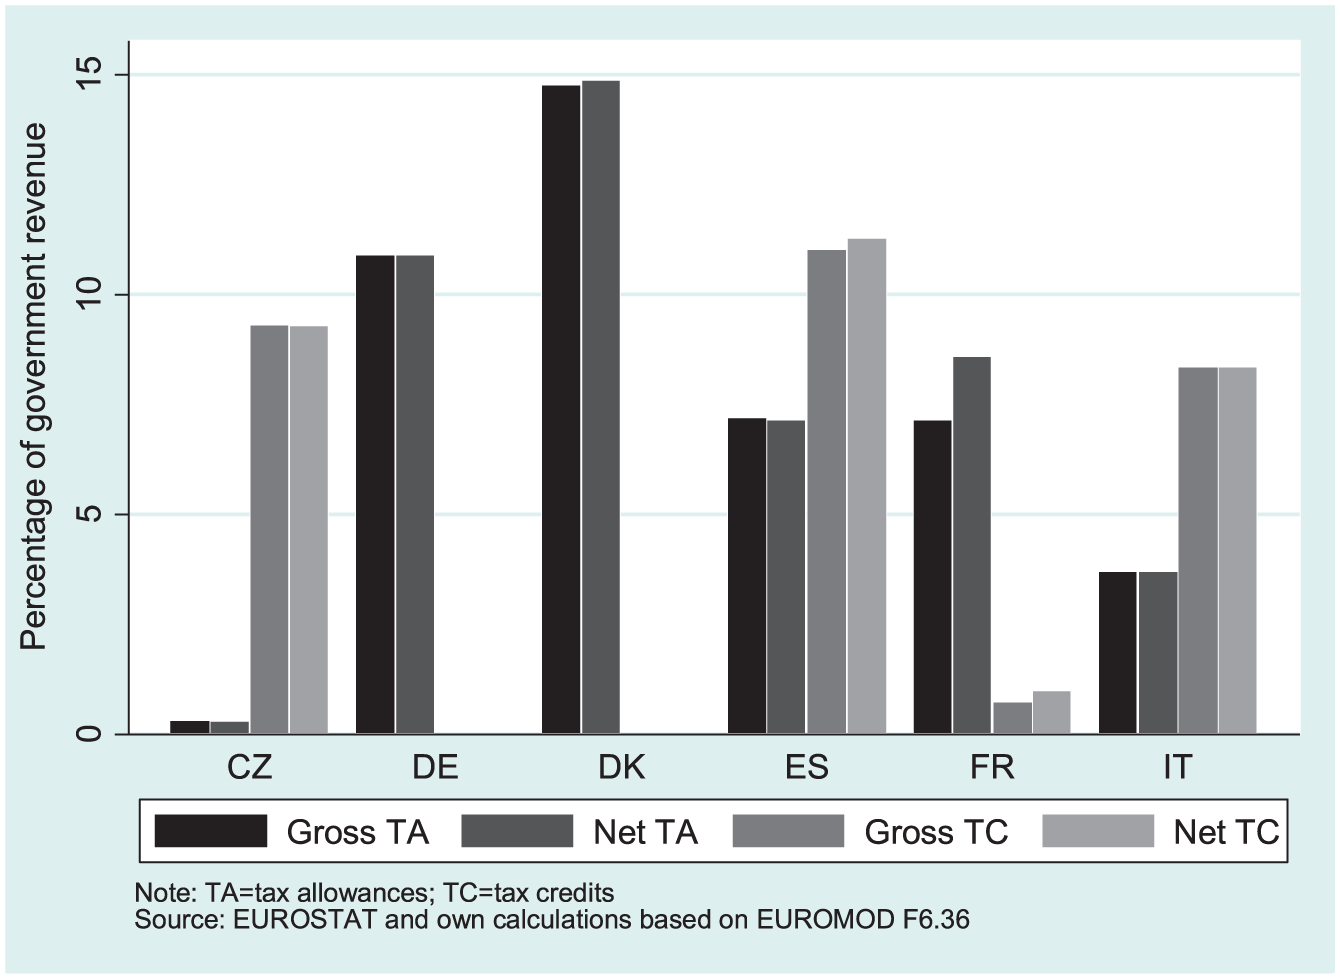
Annual total lost revenue due to tax allowances and tax credits as a percentage of government revenue.
In general, the gross and the net measures of foregone revenue are quite close. The only notable exception is tax allowances in France where the net measure is significantly larger than the gross one suggesting that in addition to lost tax revenue, the presence of tax allowances induces increased benefit expenditure. This pattern is due to the presence of an interaction between family means-tested benefits and the tax base. Eligibility for these family transfers is income-tested against the tax base. Eliminating tax allowances increases the tax base and consequently affects benefit eligibility. Some families who are eligible for means-tested family benefits under the original legislation lose entitlement when tax allowances are removed from the income tax system. Thus, the net overall effect of tax allowances is larger than the loss in tax revenues alone.
Another way of assessing the importance of tax allowances and tax credits is by looking at their prevalence. Figure 2 shows the proportion of individuals in households who receive some tax relief via tax allowances and tax credits overall and by quintile group of HDI calculated when the respective tax instruments (i.e. either allowances or credits) are not present (we denote this income concept rank as HDI rank). 13 Almost every household in Denmark is entitled to some form of tax allowance. The receipt of tax allowances is widespread in Germany, Italy, Spain and France where more than four-fifths of the population benefits from this type of tax expenditures. The only country where tax allowances are not quasi-universal is the Czech Republic.
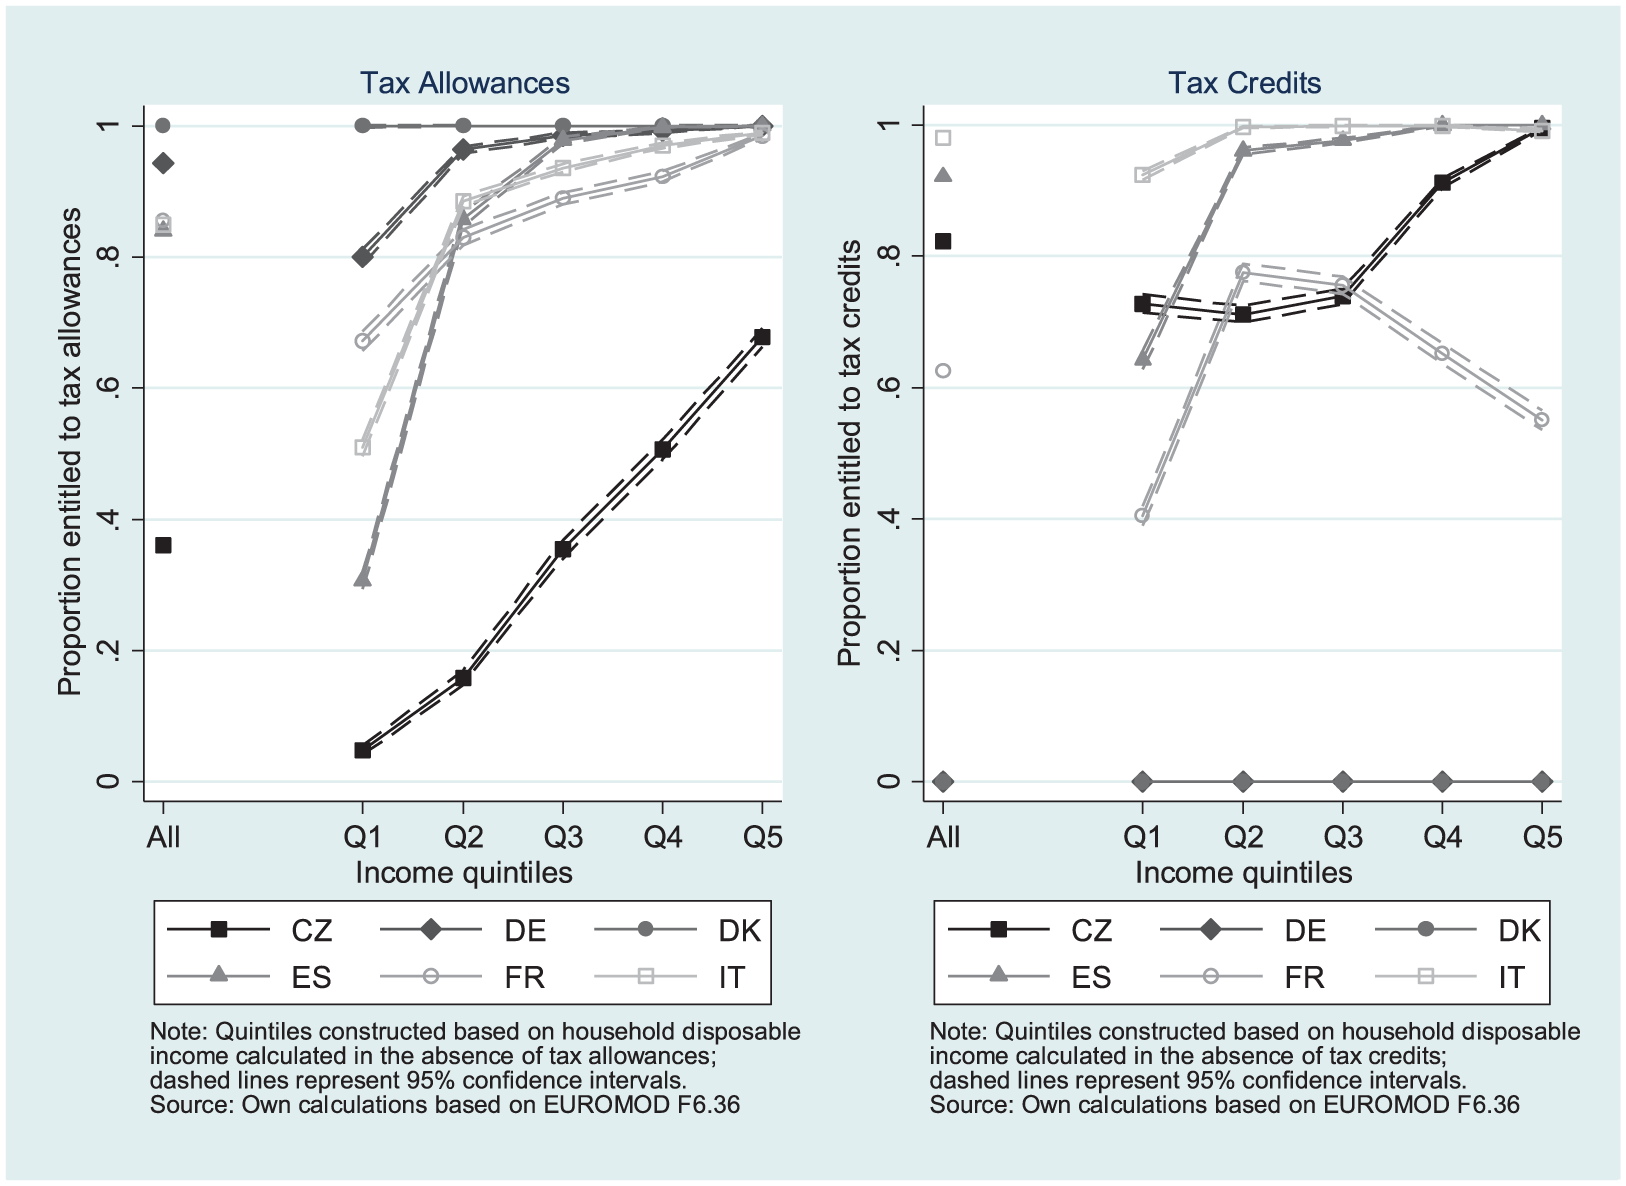
Proportion of individuals in households entitled to tax allowances (left) and tax credits (right) by income quintile.
Tax credits are completely absent in Germany and Denmark but widespread in the countries that use them. They are received by over 80 percent of the population in Italy, Spain and the Czech Republic. Thus, in a majority of countries, both tax allowances and tax credits can be seen as near universal instruments able to reach a large share of the population not just the very rich. The extent to which there are asymmetries in their benefits across the income distribution is investigated in the next section.
The redistributive effect of tax allowances and tax credits
Figure 2 shows the extent to which the likelihood of being able to claim tax allowances varies with income. With the exception of Denmark where receipt of tax allowances is very close to 100 percent in all quintiles, there is a clear income gradient in the probability of receipt. The steepest slope is found in the Czech Republic where moving from each quintile to the next roughly doubles the probability of receipt. In the remaining four countries, there is a substantial difference between the first quintile and the rest.
In the case of tax credits, the pattern is somewhat different. In Spain and to a lesser extent in Italy, we observe the same jump in proportion entitled when moving from the first to the second quintile followed by a relatively flat line thereafter suggesting that it is only the first quintile that is unable to take advantage of tax credit provisions. In France, the second and the third quintiles are the ones most likely to benefit from tax credits while the bottom and the top of the distribution are least likely to be entitled. Finally, in the Czech Republic, the most notable difference is between the bottom three quintiles and the rest. Especially the top but also the fourth quintiles are more likely to be able to take advantage of tax credits compared to the rest.
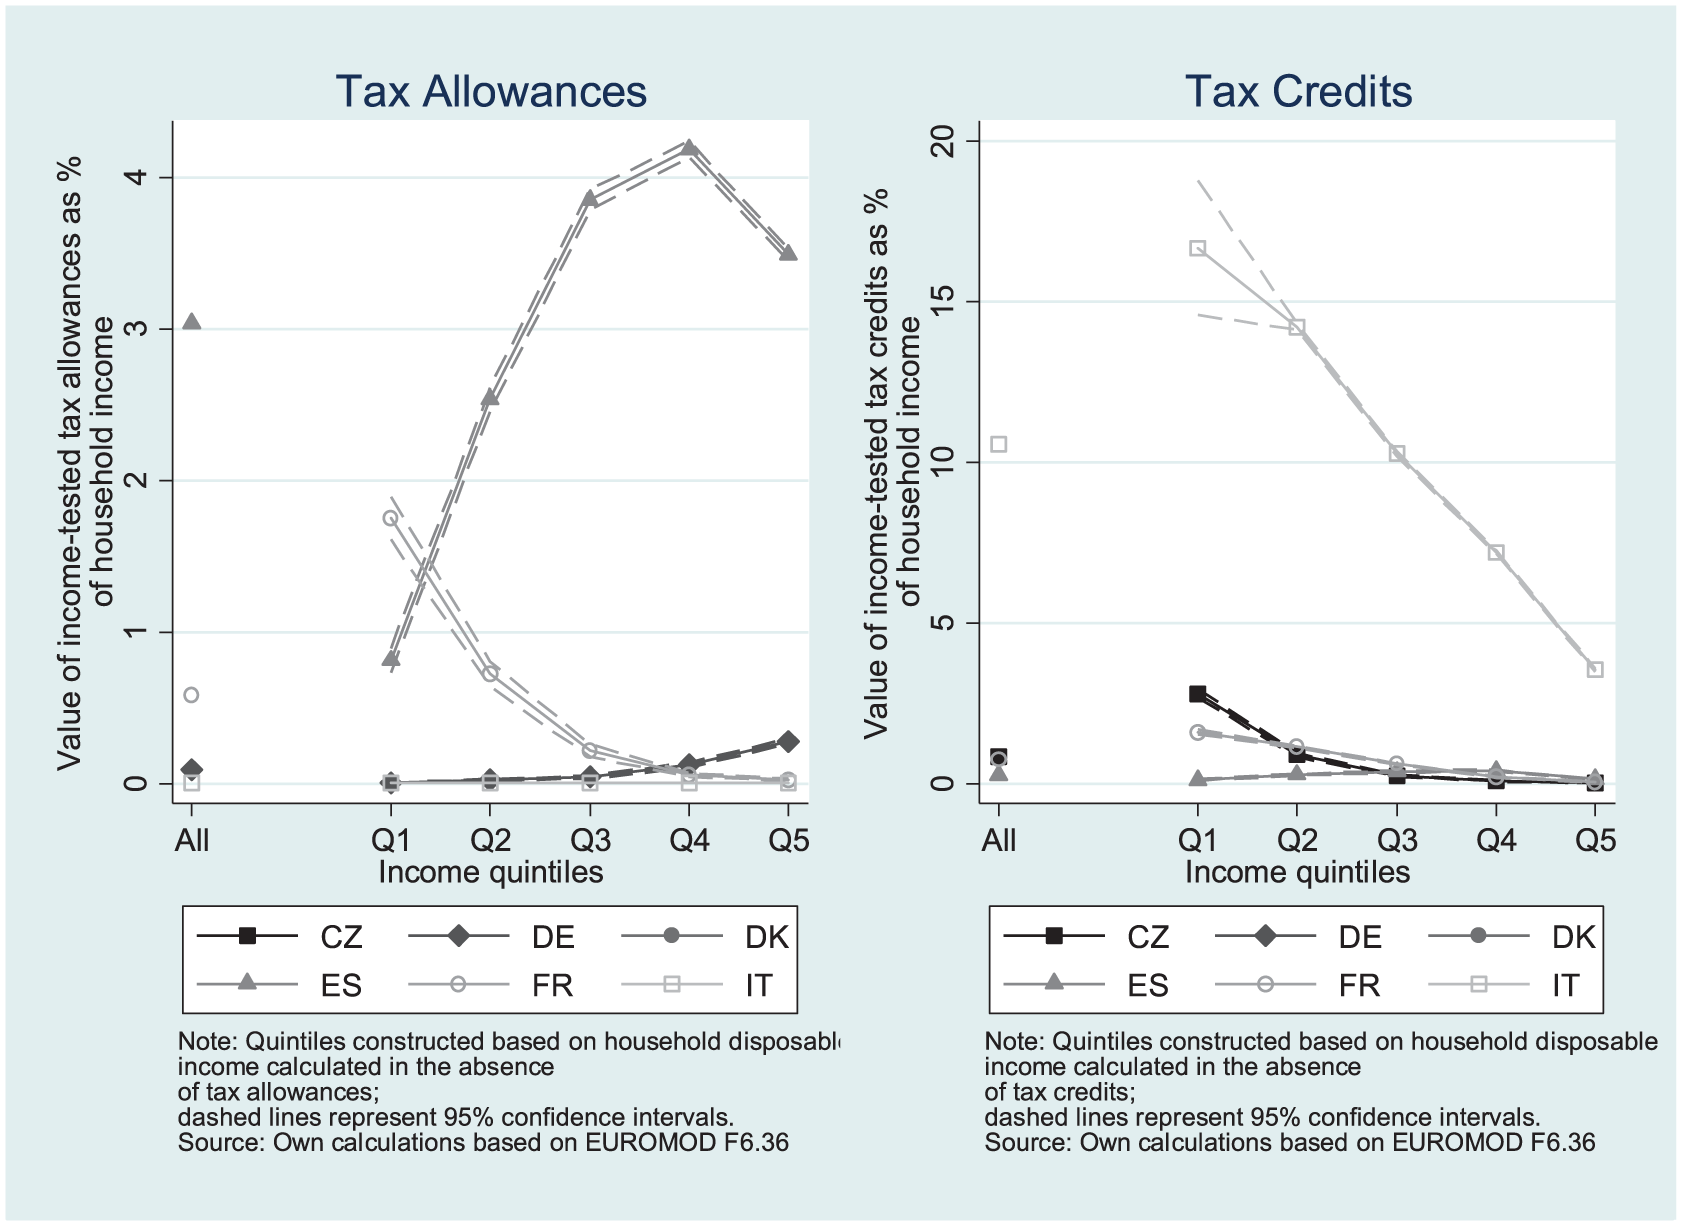
A clear indication of the potential of tax allowances and tax credits to redistribute can be obtained by assessing the extent to which tax allowances and tax credits contribute to increasing disposable income proportionally more at the bottom compared to the top of the income distribution. Figure 3 plots the share of the gross and net values of tax allowances in HDI by rank HDI quintile group. Gross tax allowances are slightly upward sloping in their effect in all countries with the exception of Denmark. The curve is particularly steep in Germany. In Italy and Spain, the value of tax allowances rises more slowly with income. This pattern suggests that tax allowances are likely to be regressive and increase inequality. Tax allowances make up a very small proportion of household income for all quintiles in the Czech Republic whereas they are important across the income distribution in Denmark.
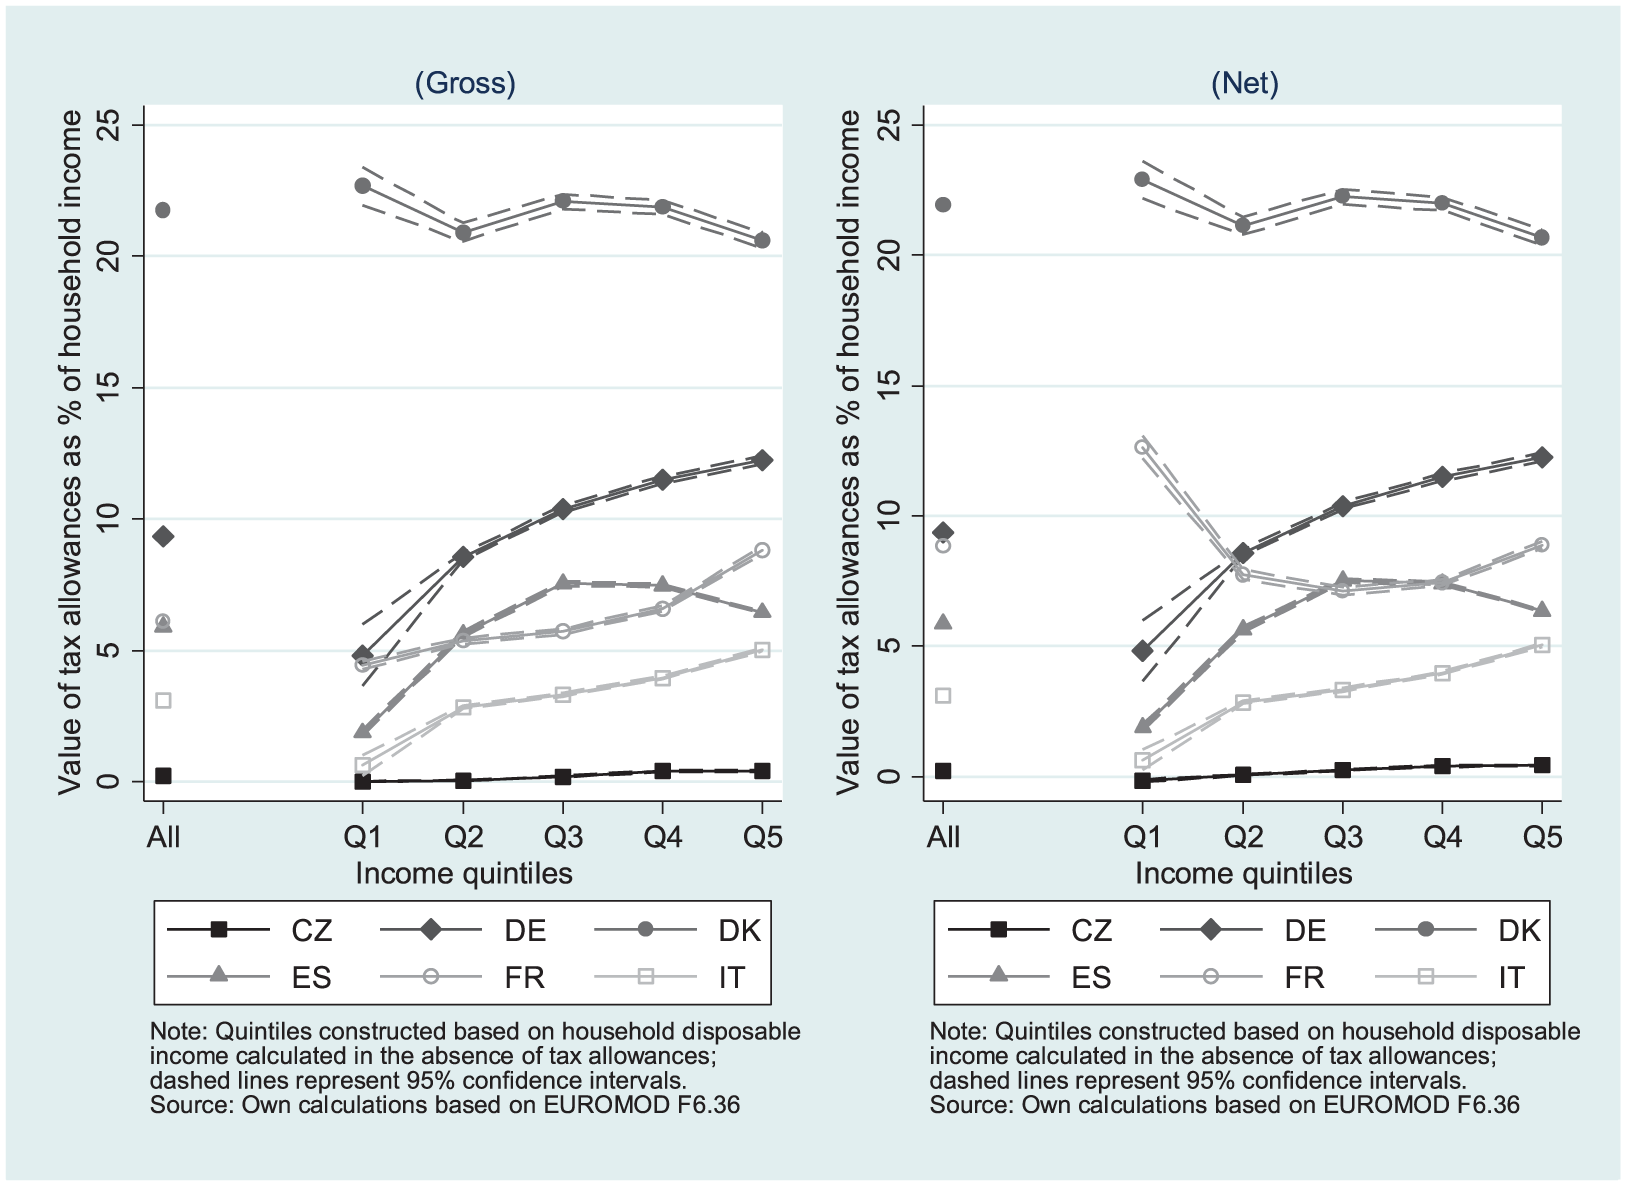
Average gross and net values of tax allowances as a percentage of rank HDI.
Using gross or net values does not matter much with the exception of France. The much larger shares obtained for the bottom quintile when using the net measure instead of the gross confirms the interaction between the tax base and means-tested benefits. Tax allowances direct resources to the bottom quintile both directly by lowering the tax burden but also indirectly by making these households eligible for income-tested benefits, as explained in section ‘Size of tax allowances and tax credits’. The indirect effect is almost twice as large as the direct effect .
The share of tax credits in rank HDI is shown in Figure 4. Because Denmark and Germany have no tax credits, only four countries are shown. Tax credits are likely to be relatively more important at the bottom and middle of the income distribution compared to the top. There is a very steep negative income gradient of tax credits in Italy. Tax credits are almost five times more important in the bottom quintile compared to the top. Quintiles in the middle of the income distribution are the largest beneficiaries of tax credits in Spain whereas in the Czech Republic there is a modest negative quasi-linear relationship between income and the share of tax credits in rank HDI. Tax credits are very small in France.
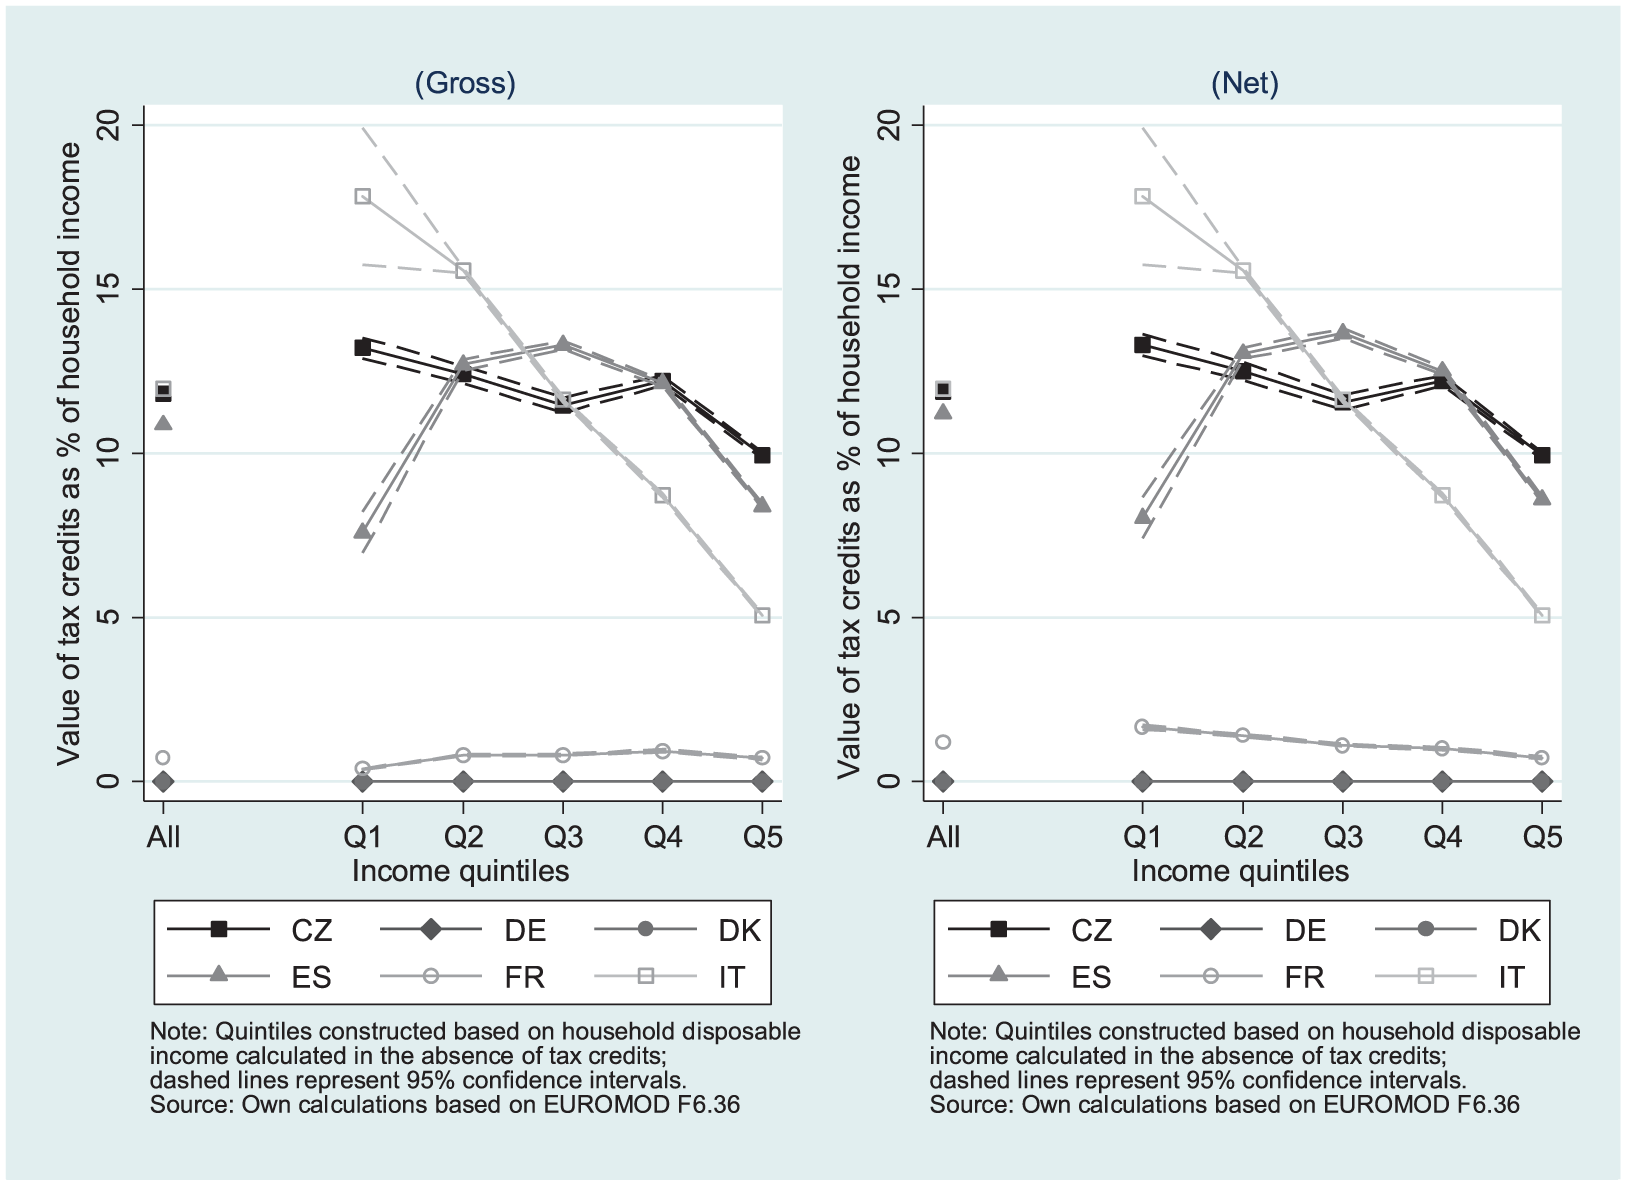
Average gross and net values of tax credits as a percentage of rank HDI.
Table 1 summarizes progressivity and redistribution indices for tax allowances and tax credits in the six countries. For completeness, Table 1 also shows implied ATRs. ATRs are a measure of how important the instrument is relative to HDI. They show the size of tax allowances/tax credits as a percentage of rank HDI. With one exception, the effect of tax allowances on inequality is rather modest. The exception is Germany where tax allowances raise the Gini index by approximately 1.3 points. This is due to the fact that tax allowances are relatively important (the corresponding implied ATR is 10%), and they are concentrated more in the top part of the income distribution. In addition to Germany, other countries where tax allowances are skewed towards the top of the income distribution are Italy and especially Czech Republic. However, in these two countries, the size of tax allowances relative to income is much smaller and hence their effect on inequality relatively muted. France and Denmark are the only two countries where tax allowances are relatively progressive albeit their effect on inequality is very small.
Progressivity and redistribution indices (all tax allowances and tax credits).
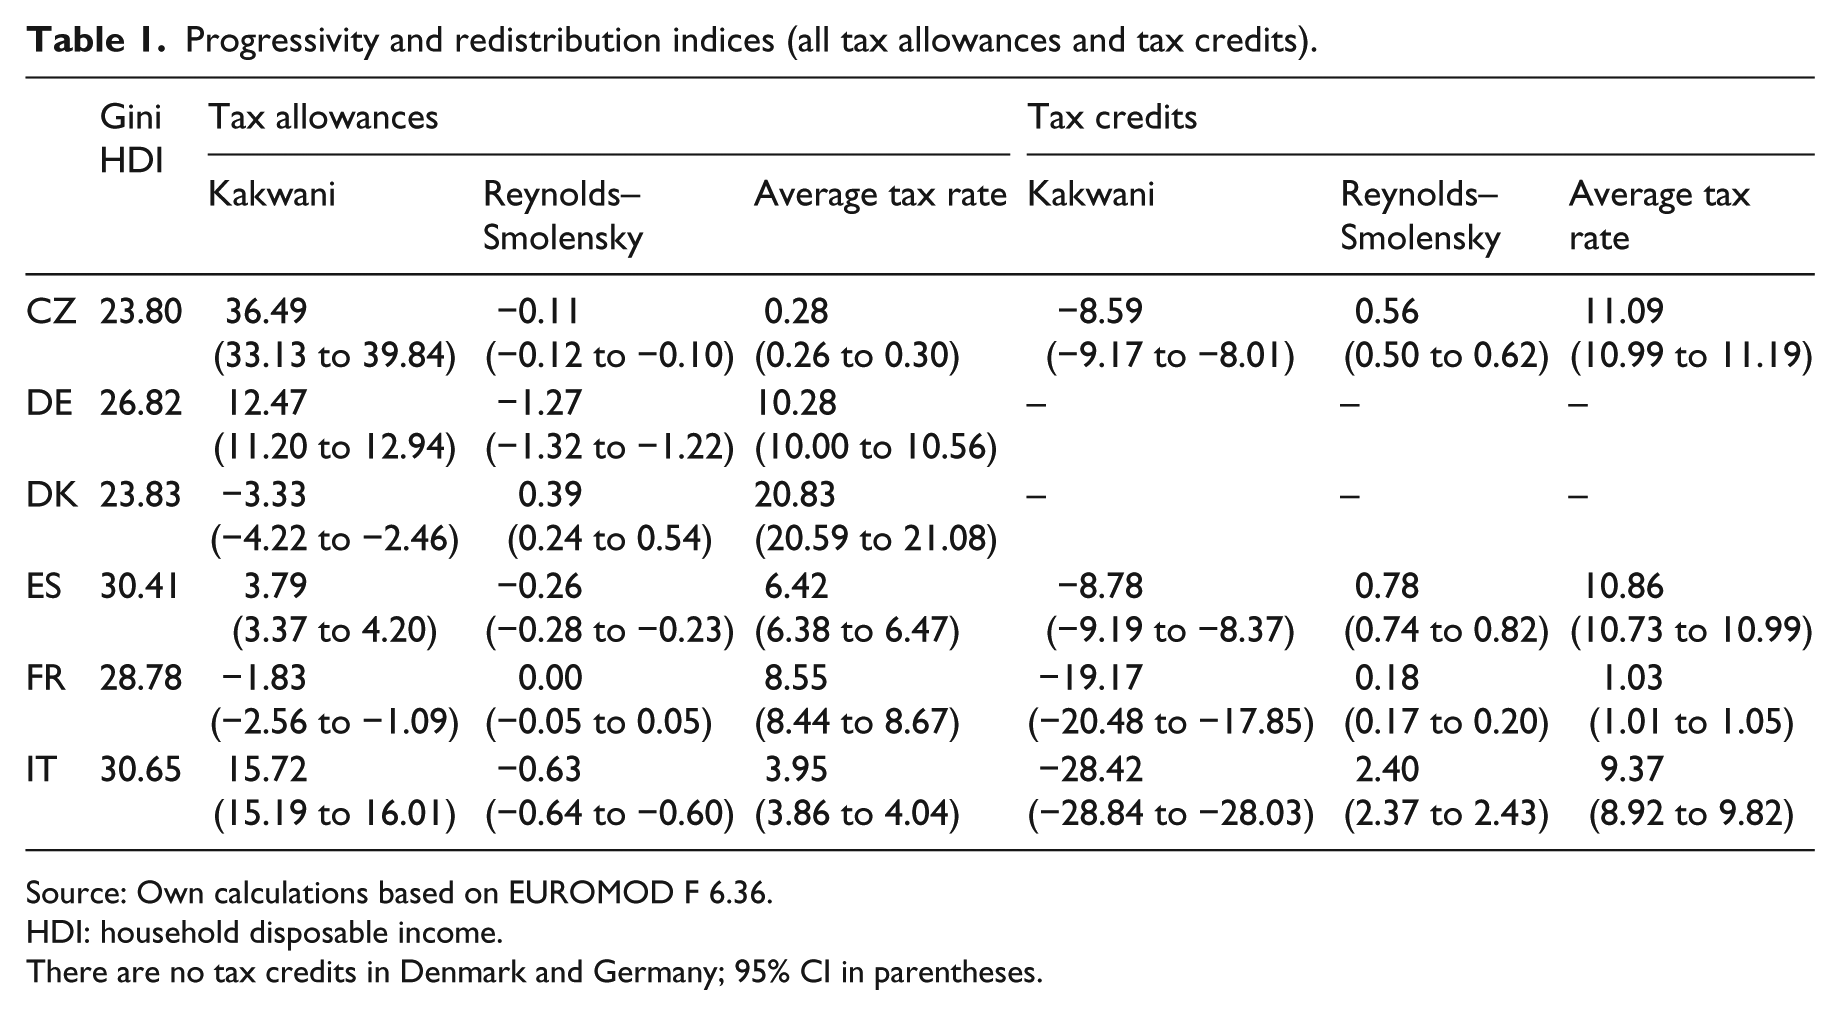
Source: Own calculations based on EUROMOD F 6.36.
HDI: household disposable income.
There are no tax credits in Denmark and Germany; 95% CI in parentheses.
In comparison with tax allowances, tax credits tend to be more progressively distributed. This is especially the case in Italy but also in Spain and the Czech Republic. All three countries have tax credits that make up roughly 10 percent of disposable income. The very progressive distribution of tax credits in Italy reduces inequality by 2.4 points, a large impact. Modelled tax credits are too low in France to have any noteworthy impact.
Progressivity and redistributive effects of specific types of instruments
In the remainder of the article, we focus on two specific types of instruments, namely, general and income-related policies. On one hand, focusing on narrower categories of tax allowances and tax credits improves comparability by ensuring that all relevant instruments in each country are captured in the simulations. On the other hand, we have the opportunity to examine policy design in more detail. More specifically the two types of instruments allow us to examine whether ‘universalist’ and/or ‘targeted’ instruments, respectively, are more effective at redistributing compared to the overall average of all tax allowances and tax credits, respectively. In the remainder of this section, we present only results based on net values. Using gross measures instead of net makes no difference to the results.
General instruments
General tax allowances/tax credits theoretically benefit all taxpayers. They include such measures as personal tax allowances or zero rate tax bands. We look at tax allowances and tax credits separately. In each case, the value of the instrument has been calculated by setting it to zero, re-applying the rules of the tax-benefit system and comparing incomes with and without the instrument.
General tax allowances make up only a tiny proportion of HDI in Germany (see Figure 5). They are however strongly regressive. Relative to rank HDI, they are almost six times as large in the top quintile compared to the bottom quintile. Yet, due to their small size, their impact on inequality is very low. General tax allowances are more important in France and especially in Denmark where they make up approximately 8 percent of rank HDI on average (see Table 2). Tax allowances are progressive both in France and especially in Denmark. In the latter country, general tax allowances are three times as important to the bottom quintile compared to the top. Given both their size and their strong progressive nature, tax allowances have an important impact on inequality in Denmark. They reduce the Gini coefficient by approximately 1.7 percentage points (see Table 2).
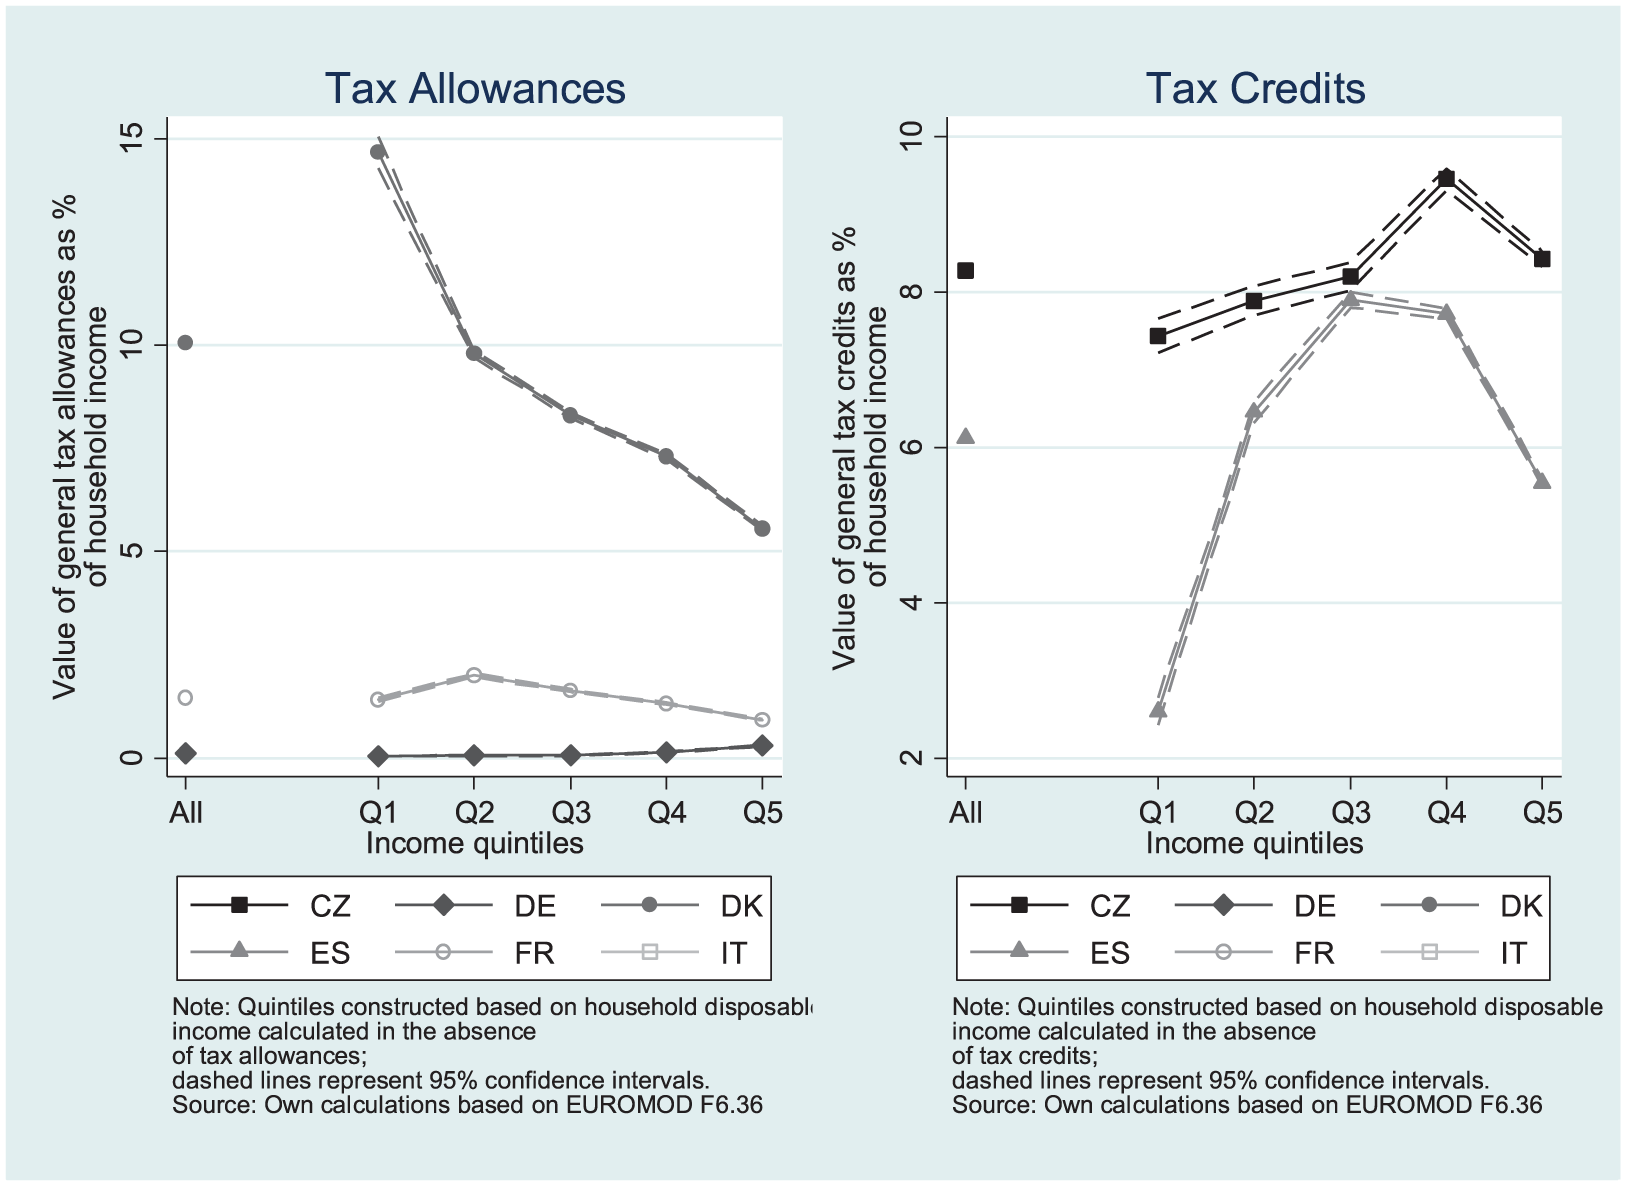
Average net value of general tax allowances (left) and general tax credits (right) as percentage of rank HDI by income quintile.
Progressivity and redistribution indices related to general tax allowances and credits.
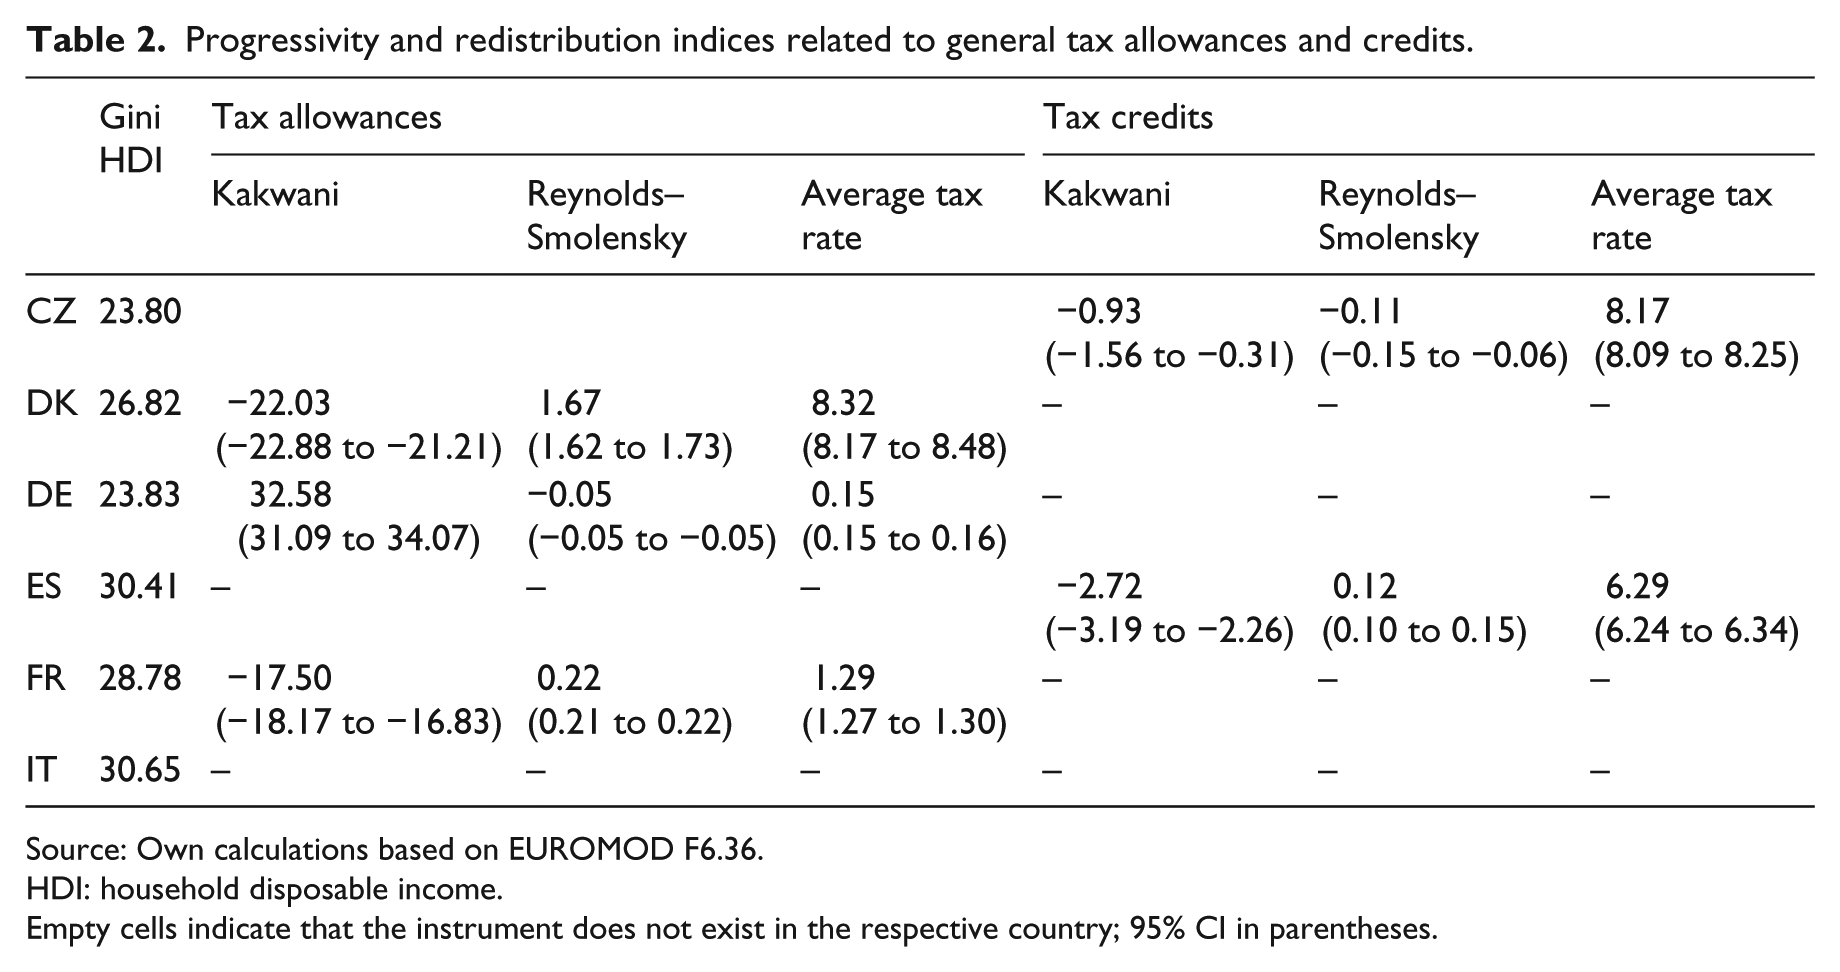
Source: Own calculations based on EUROMOD F6.36.
HDI: household disposable income.
Empty cells indicate that the instrument does not exist in the respective country; 95% CI in parentheses.
General tax credits are relatively important in both countries where they are present, making up between 6 and 8 percent of income on average. They are relatively progressive in Spain and proportional in the Czech Republic. In Spain, it is the middle quintiles of the income distribution that gain most. This suggests that bottom deciles have incomes that are too low to take full advantage of this type of tax concession. In the Czech Republic, the absolute value of the general tax credit increases with income so that the relative value compared to household income changes little across the income distribution. Again, this pattern suggests that lower income quintiles are unable to take advantage of all available tax credits.
Compared to the overall effect of tax allowances, general instruments are more progressive in Denmark and France. However, they are more regressive in Germany. Similarly, both Czech and Spanish general credits are less progressive compared to the total of credits in the two countries (see Tables 1 and 2). This suggests that general instruments received by large proportions of taxpayers are unlikely, on their own, to significantly contribute to inequality reduction.
Income-related instruments
Tax allowances that are explicitly income-tested in one form or another exist in Italy, France, Germany and Spain. In Italy, they consist of a small regional tax allowance, so they are virtually irrelevant for broader measures of inequality and redistribution. They are somewhat more important in the other two countries (see Table 3). Although the income-tested employment allowance in Spain appears to have fairly low-income thresholds, its value is largest in the third and fourth quintiles of the income distribution (see Figure 6). In addition, its size relative to income is larger in the top quintile compared to the bottom one. In France, income-related allowances are available only for the disabled and the elderly. They are more effective in boosting the incomes of the bottom quintile compared to Spain. They are also strongly progressive as beneficiaries tend to cluster in the first two quintiles. Surprisingly, in Germany, income-related tax allowances are concentrated towards the top of the income distribution (Figure 6).
Progressivity and redistribution indices related to income-tested tax allowances and credits.
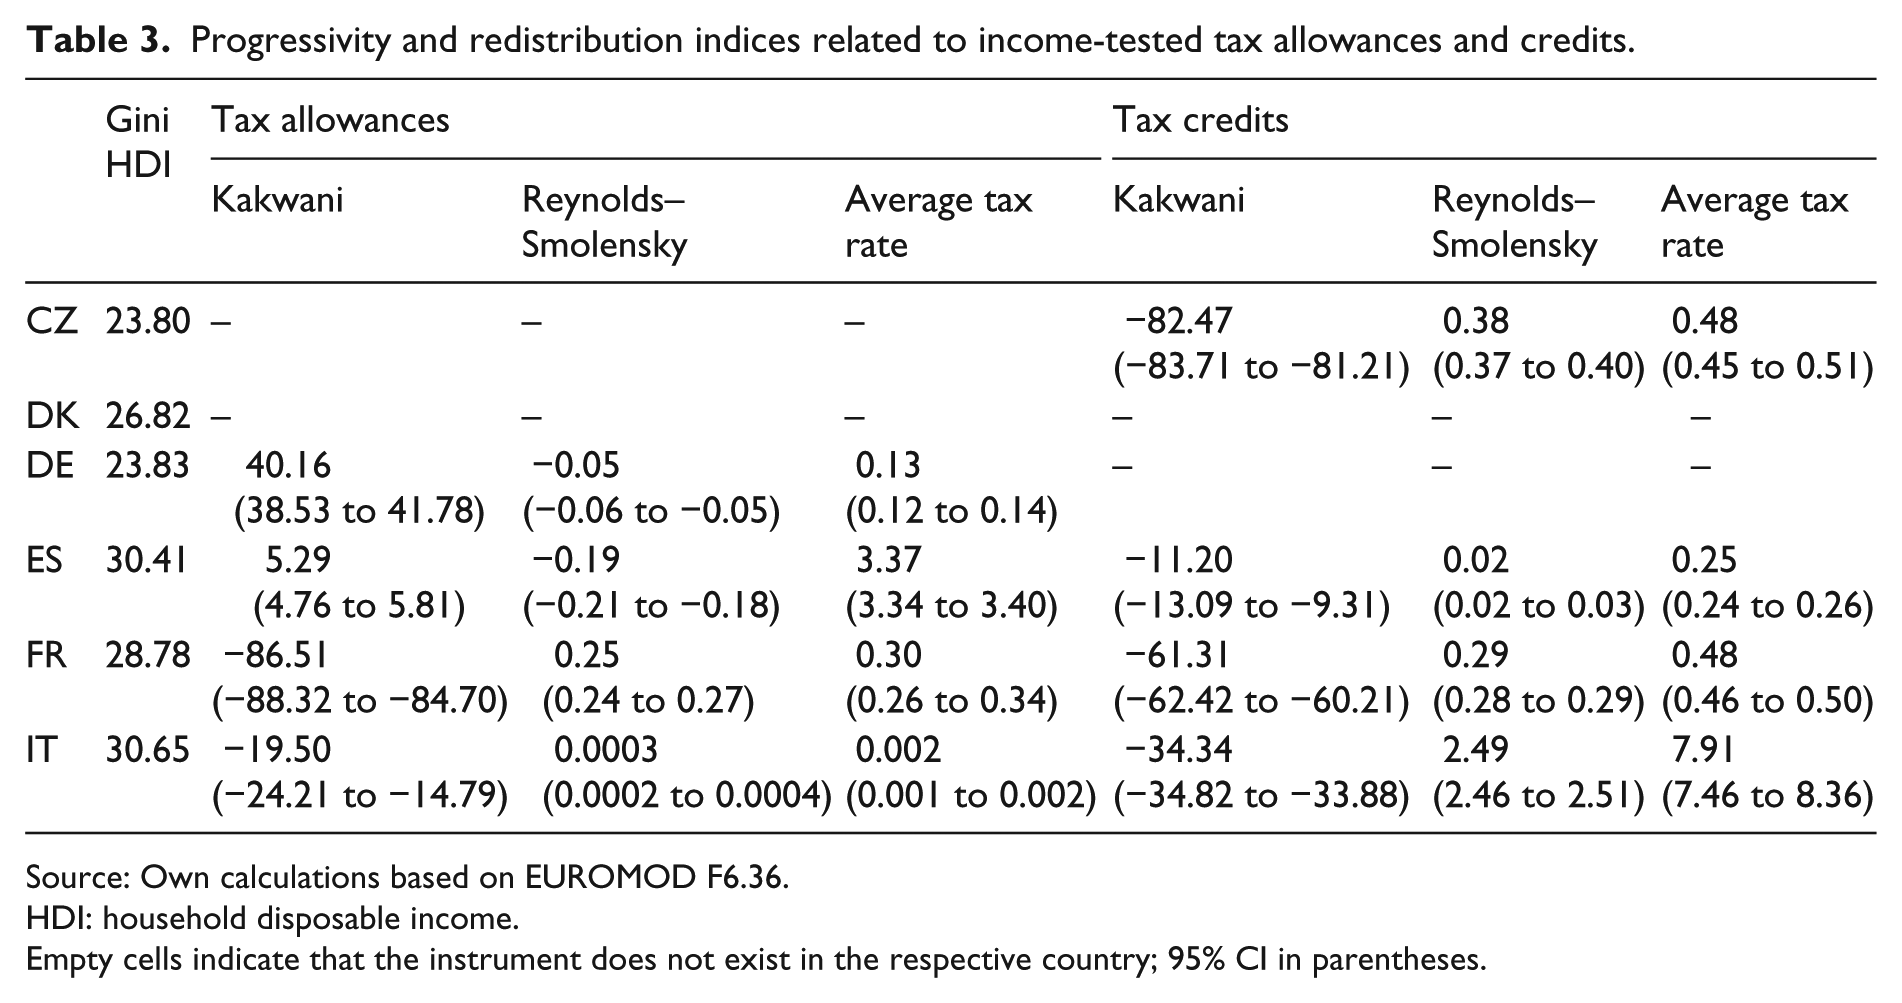
Source: Own calculations based on EUROMOD F6.36.
HDI: household disposable income.
Empty cells indicate that the instrument does not exist in the respective country; 95% CI in parentheses.
Average net value of income-related tax allowances (left) and tax credits (right) as a percentage of rank HDI by income quintile.
Income-related tax credits are relatively large and very progressive in Italy. The effect is a substantial reduction in the Gini coefficient of approximately 2.5 percentage points. In the other three countries where they are present, tax credits are much less important. They are progressive everywhere but particularly so in the Czech Republic. This is due to the refundability of the child tax credit for low earners. Finally, Spain has a large array of regional income-related tax credits with different eligibility rules and income thresholds. Taken together, they are small in size and have an even smaller impact on inequality. In fact, of the four countries, Spain registers the lowest progressivity index for income-related tax credits.
In comparison to all tax allowances, income-related ones are more progressive in France and Italy. Unexpectedly, they are more regressive in Germany while in Spain they are very close to the overall average. Finally, income-related tax credits are everywhere more progressive compared to the average effect of tax credits overall.
Discussion
Tax allowances and tax credits are not instruments exclusively reaching higher income households. On the contrary, large sections of the population, including low-income households, benefit from them. Although we are unable to capture all tax allowances and credits, it is clear that these types of instruments can have a significant impact on inequality either increasing it (tax allowances in Germany) or decreasing it (tax credits in Italy). Confirming previous research results, tax credits are found to be generally (mildly) progressive and especially more progressive compared to tax allowances. On the contrary, tax allowances are generally regressive. The overall tax allowance measure does not distinguish between deductions and lump sum allowances, but the general allowances measure is composed only of the latter type of instruments. Contrary to previous findings, it could not be shown that general/lump sum allowances are generally inequality reducing.
The strongest and most consistent result of the analysis is that the redistributive effect of tax allowances and credits is as much dependent on the other elements of the income tax system as on their own characteristics. Very similar instruments can have widely diverging effects depending on the tax system in which they operate. For example, Danish general tax allowances benefit lower income groups substantially partly due to public transfers being relatively large and taxable and partly due to the tax rate schedule being fairly flat. Conversely, the strong progressivity of the income tax system in Germany induces tax allowances, including the general tax allowance, to be regressive. This effect is so strong that it virtually dominates any type of allowance that may be introduced, including income-related ones. Finally, linking an allowance or a credit to (taxable) income does not guarantee its progressivity.
As a result, neither tax allowances nor tax credits are particularly effective tools directing resources towards the bottom of the income distribution. There is however an exception, that is, refundable tax credits aimed at low-income households. Although the sample used in this analysis contains too few examples of such instruments to warrant a strong conclusion, we found that refundable tax credits are strongly progressive irrespective of the setting in which they operate.
Finally, a few caveats should be kept in mind when interpreting the results. First, we are unable to simulate all tax credits and tax allowances existent in the income tax legislation of our six countries due to lack of data availability. As a result, estimates of size and redistributive effect of total tax allowances and tax credits are not strictly comparable. 14 Comparisons of tax instruments within categories are less likely to suffer from this problem. 15 Second, we include in our calculations only deductions from taxable income and from the initial gross liability. We do not consider other aspects of the tax system which are usually included in the tax expenditure literature such as tax-exempt income categories, 16 or reduced rates. Third, we use simulated entitlements to tax allowances and tax credits to perform our calculations and not actual claims. As a result, our findings reflect the intended rather than the actual impact of allowances and credits. Finally, we do not account for any behavioural adaptations when removing tax allowances or tax credits. In this respect, ours is a static first-round effects analysis of tax expenditure instruments.
Conclusion
This article examines the role of tax allowances and tax credits in personal income tax legislation in shaping inequality in six European countries. We use tax-benefit microsimulation to isolate the effect on the income distribution when all or selected tax allowances or tax credits are removed.
We find that this type of tax expenditure is a significant spending item relative to government revenue in all countries albeit there is a considerable cross-national variation. Moreover, with few exceptions, tax allowances and tax credits are able to reach large sections of the population. Thus, at least in the six European countries included in this study, they are by no means a policy instrument intended only/mainly for the rich. However, despite being widespread, their distributional consequences are generally not progressive. We thus confirm previous insights from the ‘hidden welfare state’ literature that suggested tax expenditures are more beneficial to middle and higher income groups. This finding is true not only with respect to tax expenditures related to ‘social’ services purchased in the private sector (on which the ‘hidden welfare state’ literature tended to focus) but also of many provisions that are functionally analogous to cash social transfers.
Overall, tax allowances tend to be either regressive or proportional. They have a significant impact on inequality only in Germany where they increase the Gini coefficient by 1.2 points. Tax credits, on the contrary, tend to be either progressive or proportional. Their size is usually too small to affect inequality significantly. The only exception is Italy where tax credits reduce the Gini coefficient by 2.4 points.
A second general result emerging from the analysis suggests that the distributional effects of tax allowances and tax credits are complex and often unanticipated. In particular, tax allowances and tax credits may interact among themselves as well as with the wider tax-benefit system, such as in the case of France where tax allowances induce not only reduced government revenues but also increases spending on some income-tested benefits. Their redistributive effect is heavily dependent on other features of the tax system and population characteristics and is less sensitive to instrument design. While tax allowances and tax credits may have similar objectives to some of the cash transfer programmes (e.g. supporting families with children or covering housing costs), their distributional consequences are often very different. Moreover, because they operate in a more complex way than direct cash transfers, it is much harder to use them to achieve a particular distributional result. The new fiscal sociology literature suggests that some countries use the tax system as an alternative to direct social spending to shape their income distribution. This study shows that even if this is the case, the distributional outcomes are unlikely to be similar. At least where tax allowances and tax credits are concerned, the beneficiaries tend to find themselves in middle and higher income groups. In addition, who benefits from these provisions is determined by many factors including the other elements of the income tax system and idiosyncratic characteristics of the population. Thus, policymakers wishing to use tax allowances or tax credits to boost low incomes may find that they are unable to without at the same time changing other important features of their income tax system. Targeting tax allowances and tax credits is much more difficult compared to equivalent cash transfers.
To sum up, tax allowances and tax credits represent a channel through which considerable resources are distributed. However, their operation is quite complex and prone to side effects.
Footnotes
Appendix 1
List of tax credits in the Czech Republic, Denmark, Germany, France, Italy and Spain.
| Tax credits | Simulated | General | Income-related |
|---|---|---|---|
| Czech Republic | |||
| Personal exemption | Yes | Yes | No |
| Spouse exemption | Yes | No | No |
| Disability exemption | Yes | No | No |
| Student exemption | Yes | No | No |
| Child tax credit (including refundable part) | Yes | No | No |
| Refundable part of child tax credit | Yes | No | Yes |
| Increased tax credit for severely disabled individuals | No | – | – |
| Spain a | |||
| Mortgage tax credit | Yes | No | No |
| Tax credit for renting the main residence | Yes | No | Yes |
| Personal tax credit | Yes | Yes | No |
| Child tax credit | Yes | No | No |
| Tax credit for dependent parents | Yes | No | No |
| €400 tax credit | Yes | No | Yes |
| Tax credit for multiple births for parents satisfying certain income and number of children conditions – Andalucia | Yes | No | Yes |
| Regional tax credit for lone parents – Andalucia | Yes | No | No |
| Regional tax credit for dependent parents – Andalucia | Yes | No | No |
| Care it assistance to the individual tax credit – Andalucia | Yes | No | No |
| Regional disability tax credit – Andalucia | Yes | No | Yes |
| Regional rent tax credit for young taxpayers – Andalucia | Yes | No | Yes |
| Tax credit for the birth of the third or successive child – Aragon | Yes | No | No |
| Tax credit for the birth of the third or successive child-supplement for low-income families – Aragon | Yes | No | Yes |
| Regional tax credit for the care of disabled or dependent persons – Aragon | Yes | No | Yes |
| Regional tax credit for renting the main residence – Asturias | Yes | No | Yes |
| Regional tax credit for large families – Asturias | Yes | No | Yes |
| Regional tax credit for lone parents – Asturias | Yes | No | Yes |
| Regional tax credit for the self-employed – Asturias | Yes | No | Yes |
| Regional tax credit for old-age – Illes Baleares | Yes | No | Yes |
| Regional tax credit for disability – Illes Baleares | Yes | No | Yes |
| Regional tax credit for educational expenses – Illes Baleares | Yes | No | Yes |
| Regional rent tax credit for young taxpayers – Illes Baleares | Yes | No | Yes |
| Regional childbirth tax credit – Canarias | Yes | No | No |
| Regional tax credit on childcare expenditures – Canarias | Yes | No | Yes |
| Regional tax credit for disability – Canarias | Yes | No | No |
| Regional large families tax credit – Canarias | Yes | No | No |
| Regional rent tax credit – Canarias | Yes | No | Yes |
| Regional unemployment tax credit – Canarias | Yes | No | Yes |
| Regional tax credit for dependent children and dependent parents/disabled – Cantabria | Yes | No | Yes (only part relating to disability and dependent parents) |
| Regional rent tax credit – Cantabria | Yes | No | Yes |
| Regional childbirth tax credit – Castilla y La Mancha | Yes | No | Yes |
| Regional tax credit for dependent parents – Castilla y La Mancha | Yes | No | Yes |
| Regional tax credit for old-age – Castilla y La Mancha | Yes | No | No |
| Regional childbirth tax credit – Castilla y Leon | Yes | No | No |
| Regional tax credit for large families – Castilla y Leon | Yes | No | No |
| Regional tax credit for childcare expenses – Castilla y Leon | Yes | No | Yes |
| Regional rent tax credit for young persons – Castilla y Leon | Yes | No | Yes |
| Regional childbirth tax credit – Catalunya | Yes | No | No |
| Regional rent tax credit – Catalunya | Yes | No | Yes |
| Regional mortgage tax credit – Catalunya | Yes | No | Yes (supplemental amount for young people, disabled and unemployed) |
| Regional rent tax credit – Extremadura | Yes | No | Yes |
| Regional employment tax credit – Extremadura | Yes | No | Yes |
| Regional childbirth and young children tax credit – Galicia | Yes | No | Yes (only income-tested part) |
| Regional tax credit for large families – Galicia | Yes | No | No |
| Regional tax credit for childcare expenses – Galicia | Yes | No | Yes |
| Regional rent tax credit for young taxpayers – Galicia | Yes | No | Yes |
| Regional childbirth credit – Madrid | Yes | No | Yes |
| Regional rent tax credit for young persons – Madrid | Yes | No | Yes |
| Regional tax credit for low-income families with children – Madrid | Yes | No | Yes |
| Regional tax credit for childcare expenses – Murcia | Yes | No | Yes |
| Regional childbirth tax credit – Rioja | Yes | No | No |
| Regional childbirth tax credit – Valencia | Yes | No | Yes |
| Regional tax credit for multiple births – Valencia | Yes | No | No |
| Regional tax credit for large families – Valencia | Yes | No | No |
| Regional tax credit for old-age and disability – Valencia | Yes | No | No |
| Regional housework tax credit – Valencia | Yes | No | Yes |
| Regional tax credit for childcare expenses – Valencia | Yes | No | Yes |
| Regional tax credit for dependent parents – Valencia | Yes | No | Yes |
| Regional working mother tax credit – Valencia | Yes | No | No |
| Regional rent tax credit – Valencia | Yes | No | Yes |
| Regional tax credit low-income families with children – Valencia | Yes | No | Yes |
| Tax credits for charitable donations | No | – | – |
| Special tax credits in Ceuta and Melilla | No | – | – |
| Domestic help tax credit – Andalucia | No | – | – |
| Fostering self-employment tax credit – Andalucia | No | – | – |
| Tax credit for cohabiting dependent elderly over 65 years – Asturias | No | – | – |
| Fostering self-employment for females and young individuals – Asturias | No | – | – |
| Child adoption tax credit – Illes Baleares | No | – | – |
| Fostering self-employment tax credit – Illes Baleares | No | – | – |
| Expenditures on child’s studies out of the residence island tax credit – Canarias | No | – | – |
| Mortgage cost increase tax credit – Canarias | No | – | – |
| Disability tax credit – Castilla-La Mancha | No | – | – |
| Children or parents’ disability tax credit – Castilla-La Mancha | No | – | – |
| Elderly and disabled taxpayers with caring needs tax credit – Castilla y Leon | No | – | – |
| Death of partner tax credit – Catalunya | No | – | – |
| Disabled family members care tax credit – Extremadura | No | – | – |
| Disabled taxpayers over 65 years with care needs tax credit – Galicia | No | – | – |
| Fostering self-employment tax credit – Galicia | No | – | – |
| Hosting of non-family elderly or disabled individuals tax credit – Madrid | No | – | – |
| Child hosting tax credit – Madrid | No | – | – |
| Mortgage cost increase tax credit – Madrid | No | – | – |
| For educational expenses – Madrid | No | – | – |
| Fostering self-employment for youth – Madrid | No | – | – |
| Disabled child’s birth or adoption tax credit – Valencia | No | – | – |
| Renting housing for activities in different municipalities’ tax credit – Valencia | No | – | – |
| Mortgage cost increase tax credit – Valencia | No | – | – |
| Public benefits towards maternity tax credit – Valencia | No | – | – |
| France | |||
| Tax rebate (Decote) | Yes | No | Yes |
| Tax credit for childcare expenses | Yes | No | No |
| Tax credit on educational expenses | Yes | No | No |
| Tax credit on mortgage interest expenses | Yes | No | No |
| Complementary reduction for disabled persons affected by the cap on tax reductions due to the ‘quotient familial’ | Yes | No | No |
| Low-earners refundable tax credit | Yes | No | Yes |
| Tax credit for green investments | No | – | – |
| Tax credit for employment services | No | – | – |
| Italy | |||
| Personal tax credit – employment | Yes | No | Yes |
| Personal tax credit – self-employment | Yes | No | Yes |
| Personal tax credit – pensions | Yes | No | Yes |
| Mortgage interest tax credit | Yes | No | No |
| Education expenses tax credit | Yes | No | No |
| Health expenses tax credit | Yes | No | No |
| Charity donations tax credit | Yes | No | No |
| Other expenses tax credit | Yes | No | No |
| Building and refurbishing tax credit | Yes | No | No |
| Life insurance premium credit | Yes | No | No |
| Funeral expenses tax credit | Yes | No | No |
| Tax credit on low pensions | Yes | No | Yes |
| Dependent spouse tax credit | Yes | No | Yes |
| Dependent parent tax credit | Yes | No | Yes |
| Child tax credit | Yes | No | Yes |
| Additional tax credit for the lone parent | Yes | No | No |
| Compensation on the child tax credit to the other spouse | Yes | No | No |
| Tax credit for tenants subject to controlled rent | No | – | – |
| Tax credit for employees relocating closer to work | No | – | – |
| Tax credit on energy conservation expenses | No | – | – |
Source: Information on existing tax credits and their simulation is taken from both the EUROMOD model and the corresponding Country Reports (Adiego et al., 2012; Ceriani et al., 2012; Denis and Tranoy, 2013; Kühl et al., 2012; Münich and Pavel, 2012; Ochmann and Fossen, 2011).
There are no tax credits in Germany and Denmark.
Simulated: included in the total calculations; general: included in calculations for general instruments; income-related: included in the calculation of income-related instruments.
The working mother tax credit is de facto treated as a means-tested benefit and not included in the list of tax credits.
Acknowledgements
The author would like to thank two anonymous referees and participants to the 4th General IMA Conference, 2014 ZEW Public Finance Conference, the 13th LAGV Conference and the 2016 LIEPP Fiscal Welfare Workshop for useful comments on earlier versions of this paper. The paper uses EUROMOD F6.36. Any remaining errors, results produced, interpretations or views presented are the author’s responsibility.
Funding
The author(s) disclosed receipt of the following financial support for the research, authorship, and/or publication of this article: This work has been supported by the Economic and Social Research Council (ESRC) through the Research Centre on Micro-Social Change (MiSoC), grant no ES/H00811X/1.