
Abstract
The Report: Intergovernmental Panel on Climate Change (IPCC) set a goal global warming of 1.5°C on global temperature change. Extreme climate changes have increased the demand for electricity consumption by people and enterprises. In fact, China's total power generation in 2019 exceeded 25% of the world's amount, and its thermal power generation accounted for more than 70%. Although past research on electricity efficiency seldom discusses the issue of climate change, the topic still remains important. This research thus considers extreme temperature days (climate change variable) as exogenous variable and uses the Two-Stage Meta Under exogenous undesirable EBM model to examine power efficiency in China. The results are as follows. (1) In the west only Qinghai's GDP, CO2, PM2.5, and electricity consumption have technology gap ratio (TGR) efficiency values of 1 in the 5 years. (2) China's electricity consumption has the same trend with the TGR efficiency of CO2 and is higher than PM2.5. (3) The national overall efficiency, meta overall efficiency, and TGR overall efficiency are the worst in China's west region.
Introduction
The natural change of climate can be regarded as the result of the interaction among the five components of atmosphere, hydrosphere, cryosphere, lithosphere, and biosphere. Atmosphere is like a thermometer for the climate system – in other words, changes in the atmosphere are a sign of climate change. Changes in atmospheric composition, topography, vegetation, ice and snow coverage, the interaction between the atmosphere and the ocean, the interaction between the atmosphere, the biosphere, and the land, and even the amount and distribution of cloud cover all cause changes in atmospheric circulation. These influencing factors, which are intrinsic, exist in the earth itself and interact with the workings of the atmosphere. Changes in the amount of solar radiation, volcanic eruptions, plate drift, and topographic changes are external factors. Climate change is global warming and refers to excess greenhouse gases (including carbon dioxide, methane, water vapor, and nitrous oxide) in the atmosphere and ocean. The earth seems to be shrouded in a greenhouse, and heat from the sun is difficult to dissipate, which eventually leads to an increase in temperature. Global warming indirectly triggers extreme weather such as drought, heavy rains, and heat waves.
Humans are a factor that affects climate. Human activities have changed the regional climate, and disasters have also occurred due to climate change. The level of human influence on the natural world has been unprecedented since the Industrial Revolution. In 2013 the United Nations Intergovernmental Panel on Climate Change (IPCC), composed of 1300 independent scientific experts from around the world, stated in its fifth assessment report that there is more than a 95% chance that human behavior is the main cause of warming over the past 50 years. 1 In 2021, IPCC published The Physical Science Basis, 2 which provides an update on what is happening on the planet as the climate warms and why. According to the Summary For Policymakers” of IPCC report, the concentration of carbon dioxide in the atmosphere has reached 410 ppm, or the highest concentration in 1 million years. A large amount of carbon dioxide has accumulated in the atmosphere, and the absorbed heat can significantly increase the surface temperature. Compared to pre-industrial levels, the global surface temperature from 2011 to 2020 has warmed by nearly 1.1 Celsius, or only 0.4 away from the target of 1.5 Celsius. Human-induced global warming is currently increasing at a rate of 0.2°C per decade, with increasing temperatures having severe negative impacts on both the natural environment and human health and well-being. Rising temperatures may result in global environmental catastrophe and have increased human reliance on electricity for energy.
The world has clearly experienced extreme climate changes in recent years. Many natural disasters occurred in 2019. Taking the severe wildfires in California (U.S.), for example, the biggest local power supplier, Pacific Gas Power Company, officially filed for bankruptcy on January 29, 2019, becoming the first company in the world to declare bankruptcy due to climate change. 3
Continuous high temperature weather has caused a surge in demand for electricity consumption by the public and enterprises. According to the International Energy Agency IEA Global Energy & CO2 Status Report 2019, the global pursuit of economic growth, coupled with changes in weather conditions in some parts of the world, has led to an increase in energy demand. Energy demand intensified in 2018, and global energy-related carbon dioxide emissions rose by 1.7% to 33.1 Gt CO2, or a record high. The power sector accounts for two-thirds of total emissions, and coal use in power alone exceeds 10 Gt CO2, mostly used in Asia. 4 Although electricity consumption can increase GDP growth, it also raises the emissions of carbon dioxide and other greenhouse gases, causing high-temperature airflow. For the relationship between power consumption and economic growth and pollution. From 1961 to 2011, GDP growth in China, the United States, and the European Union has affected electricity production, changing the energy structure (Kaivo-oja et al. 5 ). According to Meng et al., 6 it turns out that the increase in total electricity consumption is the most important factor in the growth of carbon dioxide emissions in China's power industry. Boukhelkhal and Bengana, 7 Saint Akadiri et al., 8 Ghazouani et al., 9 Asongu et al., 10 and Xie et al. 11 used the Autoregressive Distributed Lag Cointegration approach to demonstrate that economic growth depends on electricity consumption, which is the main cause of environmental degradation. The result of continuous high temperatures has also seriously affected power generation systems, pushing the price of electricity to continually (Véliz et al., 2017 12 ; Wang et al., 2017 13 ; Emodi et al., 2018 14 ; Zhang et al., 2021 15 ; Liu et al., 2021 16 ; Zhang et al., 2021 17 ; Zhang et al., 2022 18 ; Auffhammer, 2022 19 ). The issue of climate change is no longer a topic that only affects future generations, but is impacting the present-day environment.
The world's largest electricity consumer presently is China. Its electricity demand has increased from 1.39 trillion kWh in 2000 to 7.23 trillion kWh in 2019. The power industry has always been the largest source of carbon dioxide emissions in China, accounting for about 40% of total domestic emissions. China also focuses on the environmental and economic costs brought about by the growth of its power industry. Under the constraints of economic transformation and environmental protection, it has gradually dropped from 90% to 57.7% in 2019.
China today is the second largest economy in the world, and its rapid GDP growth depends on various energy sources for production and creation. Zhang et al. 20 used index decomposition and decoupling approach to confirm a clear positive relationship between China's economic growth and electricity consumption from 1990 to 2016. Wang et al. 21 validated between 2000 and 2017 that economic growth in the east, central, and west regions of China was associated with increased electricity consumption. Without effective countermeasures, the future situation will deteriorate. Solutions not only are relying upon the efforts of environmental protection groups, but also governments and enterprises. Climate change and environmental issues have thus attracted greater attention, driving said governments and enterprises to re-evaluate national policies and the method of operations.
Although its reforms have achieved remarkable results, China's coal production, imports, and total consumption are still the world's largest in 2019. China's total power generation in 2019 exceeded a quarter of the world, and its thermal power generation accounted for more than 70%. China is already one of the few countries that still dominate coal-fired power generation in 2019.
The United Nation launched its Sustainable Development Goals (SDGs) in 2015, setting up 17 goals. Goal 7 is to ensure access to affordable, reliable, sustainable, and modern energy for all. Therefore, we take the sustainability aspect into consideration and evaluate electricity efficiency.
Goal 7 requires a substantial increase in the proportion of renewable energy in the global energy mix by 2030. Facing the huge demand for coal in China, it is equally important to practice sustainable development. According to the 2022 Annual Development Report of China's Power Industry, 22 in terms of power investment and construction, China has added 179.08 million kilowatts of new power generation installed capacity, which is 12.36 million kilowatts less than the previous year. Power supply construction has shifted to new energy and regulated power. In terms of green power development, non-fossil energy power generation was 2.896 trillion kWh, or an increase of 12.1% over the previous year. Coal-fired power units that reached the ultra-low emission limit made up about 1.03 billion kilowatts, accounting for 93% of the country's total installed coal power capacity.
India is a major coal-burning country and also has a large population. It has switched to solar energy, which proves that solar and wind energies are no longer just areas of technology that wealthy developed countries have the ability to develop. In 2019, global solar energy accounted for 45% of total new power generation. The main reason is that the price of solar cell modules fell, which gives solar power economic advantages. Coupled with wind and hydropower, renewable energy accounts for as much as 3/4 of total global new power generation capacity in 2019.
After COVID-19 broke out, China announced that it will not set a GDP growth target for 2020. This is an unprecedented situation since it has announced annual economic growth targets starting in 1990. In April 2020, the resumption rate of enterprises in China was as high as 90%. China's full launch of fiscal and monetary policies to save the economy prompted it to restart coal consumption, because its electricity consumption need to be increased to jumpstart the economy. According to the 2022 Annual Development Report of China's Power Industry, 22 in terms of power consumption and power production, China's social electricity consumption in 2021 were8.331 trillion kWh, or an increase of 10.4% over the previous year. China has committed to a practical energy policy, but faced with the economic impact of COVID-19, some provinces have been unable to implement coal emissions measures. Likewise, countries around the world also face serious challenges, yet sustainable operation is not for a moment; it requires long-term and stable continuous investment. Governments should continue to support clean energy and investment in clean energy to implement SDG Goal 7. The sphere of influence of Goal 7 will not only reduce air pollution and improve the quality of life, but also curb the rapid rise in global temperature.
Most literature on electricity in the past focused on electricity efficiency and pollution issues. Each province in China has a different social culture, economic environment, management model, and production structure, but past literature failed to take into account such regional differences. The biggest contribution of this research is that we not only discuss power efficiency at the economic level, but also pay more attention to environmental issues in different regions.
Global temperatures are rising due to excess greenhouse gases in the atmosphere and ocean. Various extreme weather occurs, such as drought, heavy rain, heat wave, and other problems. Human lifestyles have also changed, and the number of days with high and low temperatures varies greatly throughout the year, resulting in higher electricity consumption and more air pollution.
Based on the above, this study uses the number of days of high temperature and low temperature as exogenous variable to explore the performance of power consumption efficiency and environmental efficiency in China under high temperature and low temperature environments. The framework of the model considers carbon dioxide, the main pollutant common to electricity consumption, as an undesirable output. This study also refers to the European Environment Agency (EEA) report on energy and air pollution 23 and the air quality index formulated by the Ministry of Ecology and Environmental of the People's Republic of China, which both point out that PM2.5 is a common pollution. Based on this factor, this study uses carbon dioxide and PM2.5 as environmental pollution indicators.
From the economic production structure, this study has three contributions to the literature. First, the number of days of high temperature and low temperature, part of global warming, is regarded as an exogenous variable, which is an external influencing factor. This research considers various climate change factors and explores the issue of electricity consumption and environmental efficiency in China. Although there have been studies discussing the impact of climate change on power consumption, most only consider climate change as an endogenous impact.
Second, past research has taken a static regression model to explore the relationship between electricity consumption and temperature (You et al.; 24 Dagnachew et al.; 25 Li 26 ; Fan et al.; 27 Randazzo et al.; 28 Brini 29 ). However they all lack a consideration of the impacts from high and low temperature changes on economic growth, electricity consumption, and air pollution such as CO2 and PM2.5. Past research also has not considered the issue of temporal dynamics and also ignored the external impact of global warming on human life style.
Third, different geographical environments also have different climatic phenomena. Therefore, according to China's geographical environment, this study subdivides its 28 provinces into east, central, and west regions. Doing so can better reflect the power consumption and environmental efficiency of each region.
This study explores the three different dimensions of climate change, economic production, and environmental pollution, employing industrial fixed assets as input and GDP, CO2, and PM2.5 as outputs. Combined with dynamic analysis, this paper discusses the performance of China's electricity consumption and environmental efficiency under high and low temperature climates.
Method
Banker et al. 30 extended the CCR data envelopment analysis (DEA) model of Charnes et al. 32 on constant returns to scale to the assumption of variable returns to scale. Banker et al. 30 established a BCC model that can measure Technical Efficiency (TE) and Scale Efficiency (SE). As CCR and BCC are Radial DEA models, which ignore non-radial slacks, Tone 32 proposed the Slacks-Based Measure (SBM) model, which considers the slack of input and output, and presented SBM efficiency as a single-value non-radial estimation. However, SBM DEA ignores the characteristic of the same proportion of radials when evaluating the efficiency value. In order to solve the shortcomings of the ray and non-ray models, Tone and Tsutsui 33 set up the EBM (Epsilou-Based Measure) DEA model, which can solve the shortcomings of Radial DEA model and Non-radial DEA model.
The traditional DEA assumes that all producers have the same level of production technology, ignoring the differences in conditions often experienced by decision-making units (DMUs). Therefore, Battese and Rao, 34 Battese et al., 35 and O’Donnell et al. 36 applied the concept of meta frontier to the efficiency estimation of DEA, estimated the meta frontier, estimated the group frontier of each group separately, and then measured the technology gap ratio (TGR) by the distance between group frontier and meta frontier.
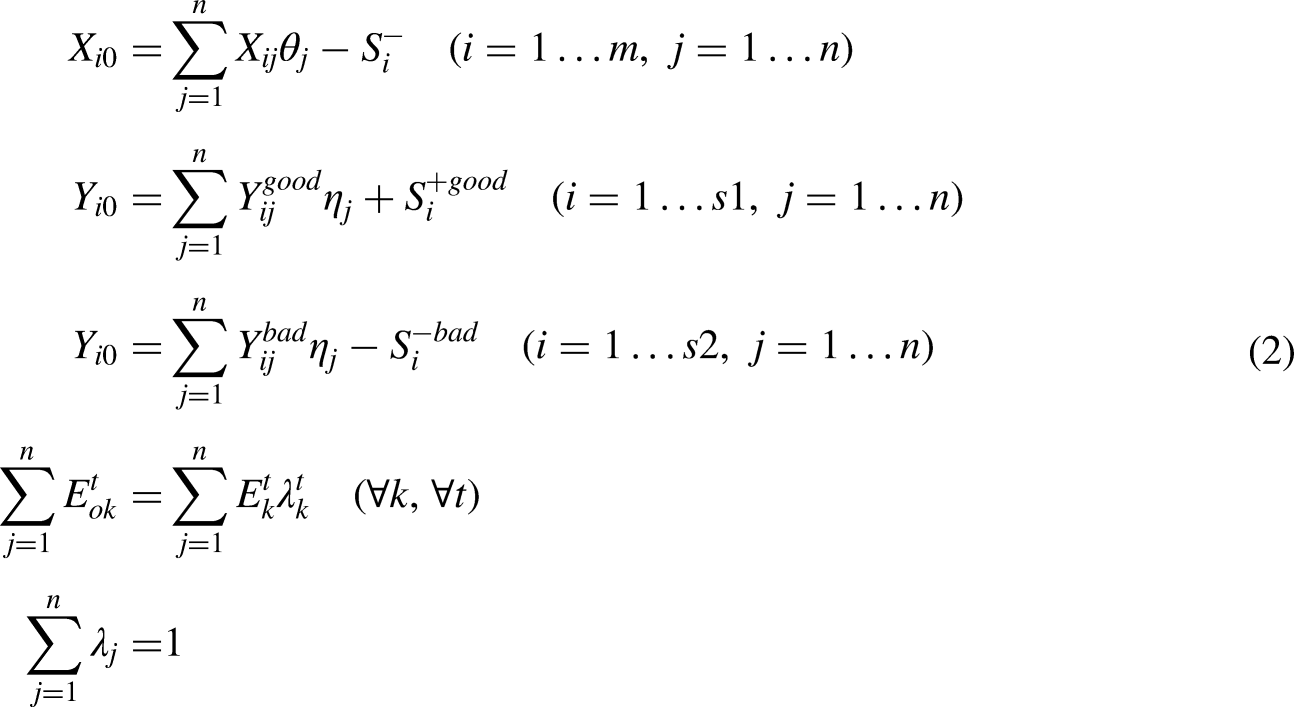
In this paper the evaluation performance of the DEA model based on EBM (Epsilou-Based Measure) is better and can provide more accurate estimation results. Therefore, this study uses Tone and Tsutsui's 33 EBM model and combines it with the meta frontier of O’Donnell et al. 36 and Chang et al. 37 to calculate the meta frontier of TGR in two stages, by considering undesirable output and an exogenous variable. The proposed technique is called the Meta Two-Stage undesirable EBM Under exogenous variable model. This study explores the total-factor, disaggregate efficiency and calculates the TGR in various provinces and regions in China. The formula runs as follows.
Figure 1 is the framework of the model with labor, electricity consumption, and fixed assets as inputs and GDP, CO2, and PM2.5 as outputs. The exogenous variable is high and low temperature days.
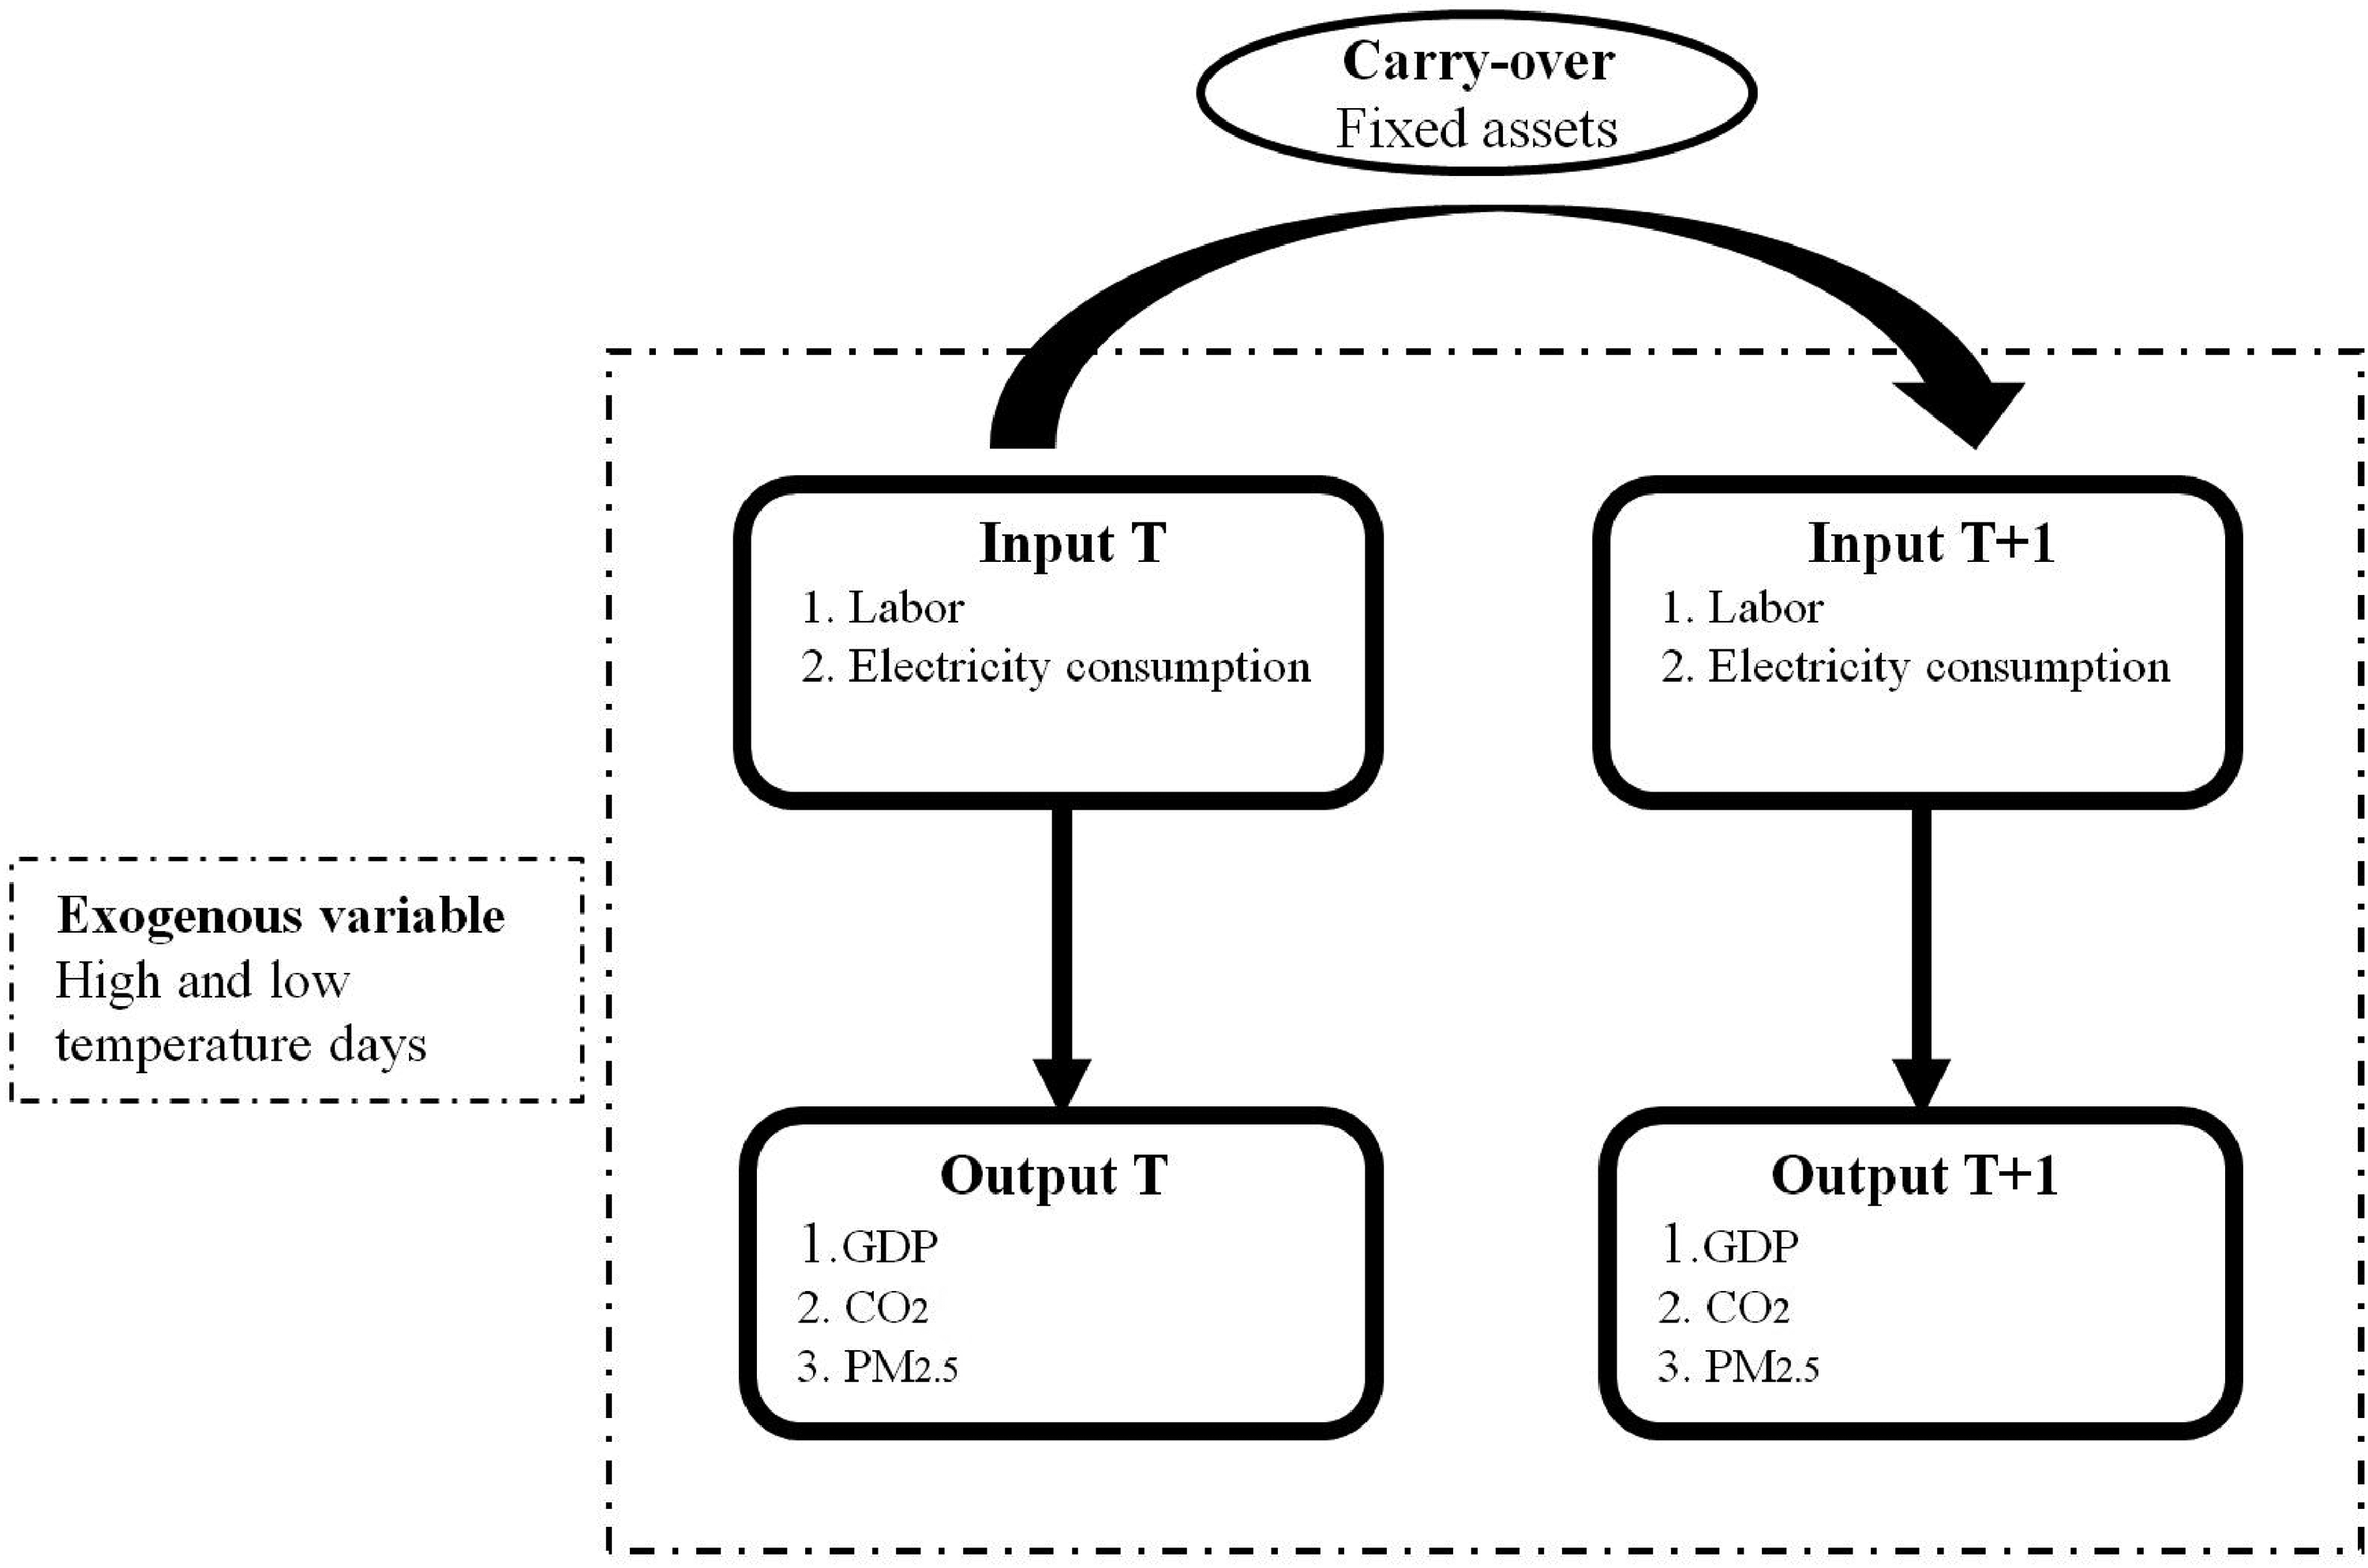
The framework of model.
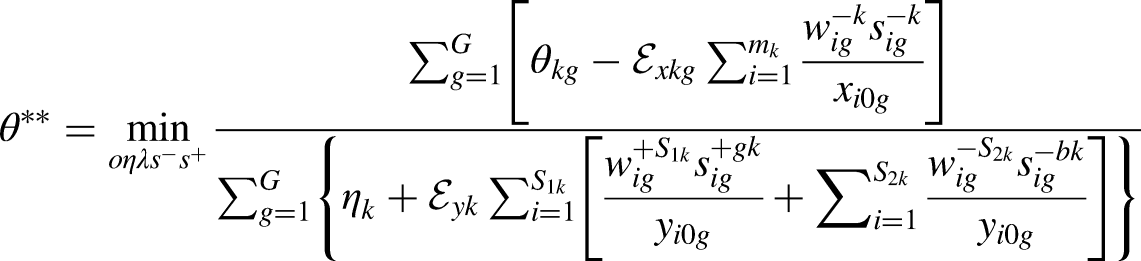
Meta two-stage undesirable EBM under exogenous variable
Referring to the meta frontier of O’Donnell et al.,
36
our study introduces the model architecture of the meta frontier of Chang et al.
37
to calculate TGR in two stages and proposes the Meta Two-Stage undesirable EBM Under exogenous variable model. Regarding this new model, the formula goes as follows.
Meta- frontier Group frontier
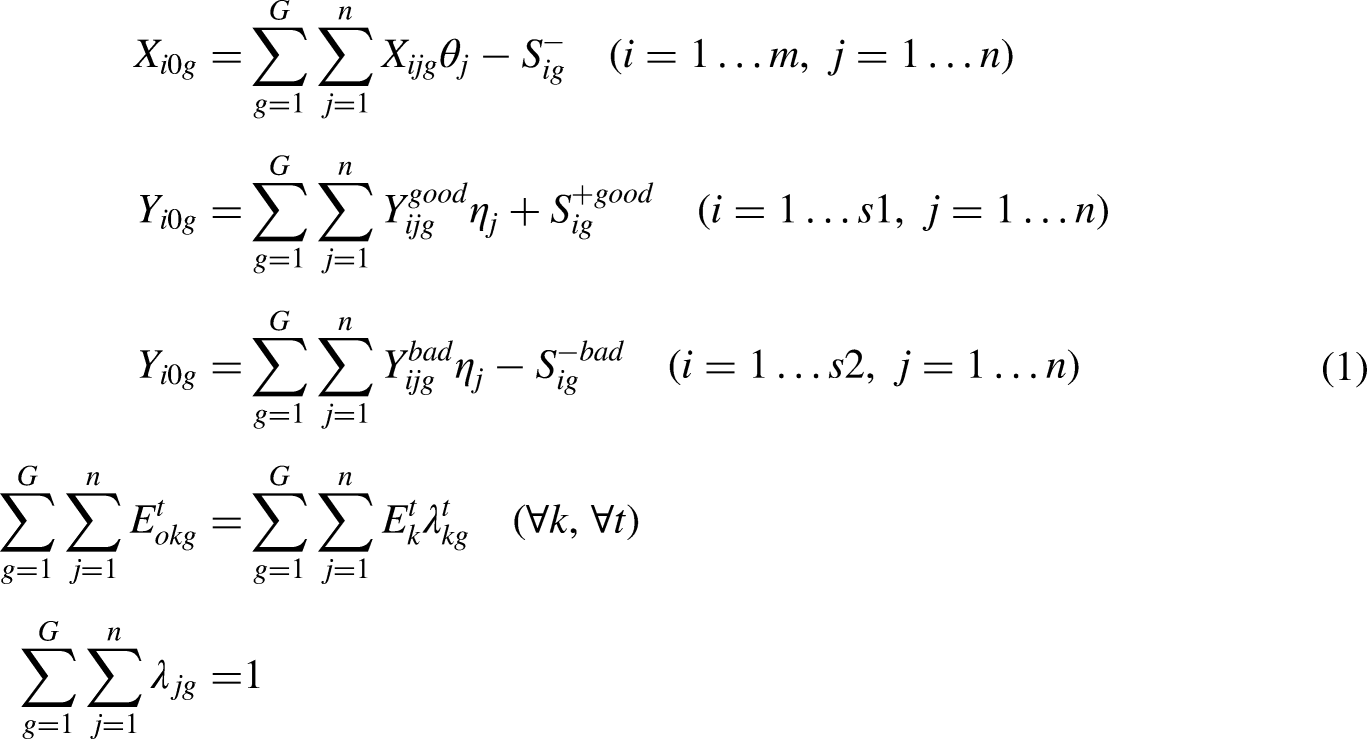
Subject to:
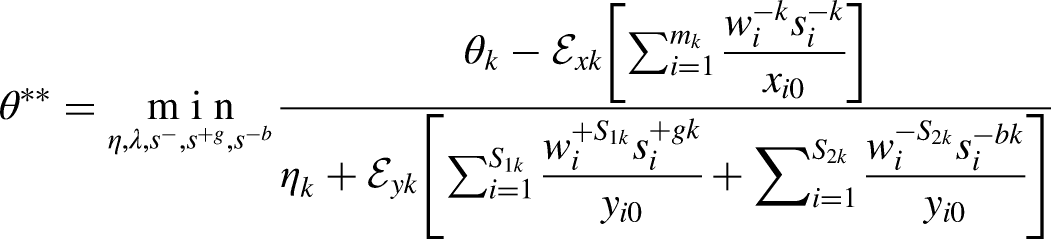
Subject to:
The Technology Gap Ratio of DMU0 shows the technology gap between the group frontier and meta frontier as follows:

The analysis steps of this study are as follows:
Step 1: This step is called the first stage. First, input and output data are collected, and Meta-Frontier Efficiency (MFE) and Group Frontier Efficiency (GFE) are solved according to the Meta Under exogenous undesirable EBM models (1) and (2). Step 2: The Group Frontier Efficiency (GFE) in the above step (first stage) is calculated according to the two-stage TGR analysis model framework of Chang et al.,
28
and the adjusted input and output data are calculated. The formula is: Adjusted Target input = Actual input × Group Frontier Efficiency Adjusted Target output = Actual output × Group Frontier Efficiency Step 3: This step is called the second stage. According to (9) of Chang et al.,
28
enter the adjusted input and output data in the above steps into the Two-Stage Meta Under exogenous undesirable dynamic DDF model to solve Meta Technological Efficiency (MTE) and Group Technological Efficiency (GTE) and use Meta Technological Efficiency (MTE) and Group Technological Efficiency (GTE) to obtain Step 4: According to Hu and Wang's
40
Total-Factor Energy Efficiency Index (TFEE) and O’Donnell et al.'s
36
meta-frontier. Solve TGR under disaggregate efficiency. As for the TGR calculation system under disaggregate efficiency, the Meta-Total-Factor Efficiency and Group-Total-Factor Efficiency are then solved by the formula:
Based on the above content, the method flow chart is as follows. (Figure 2)


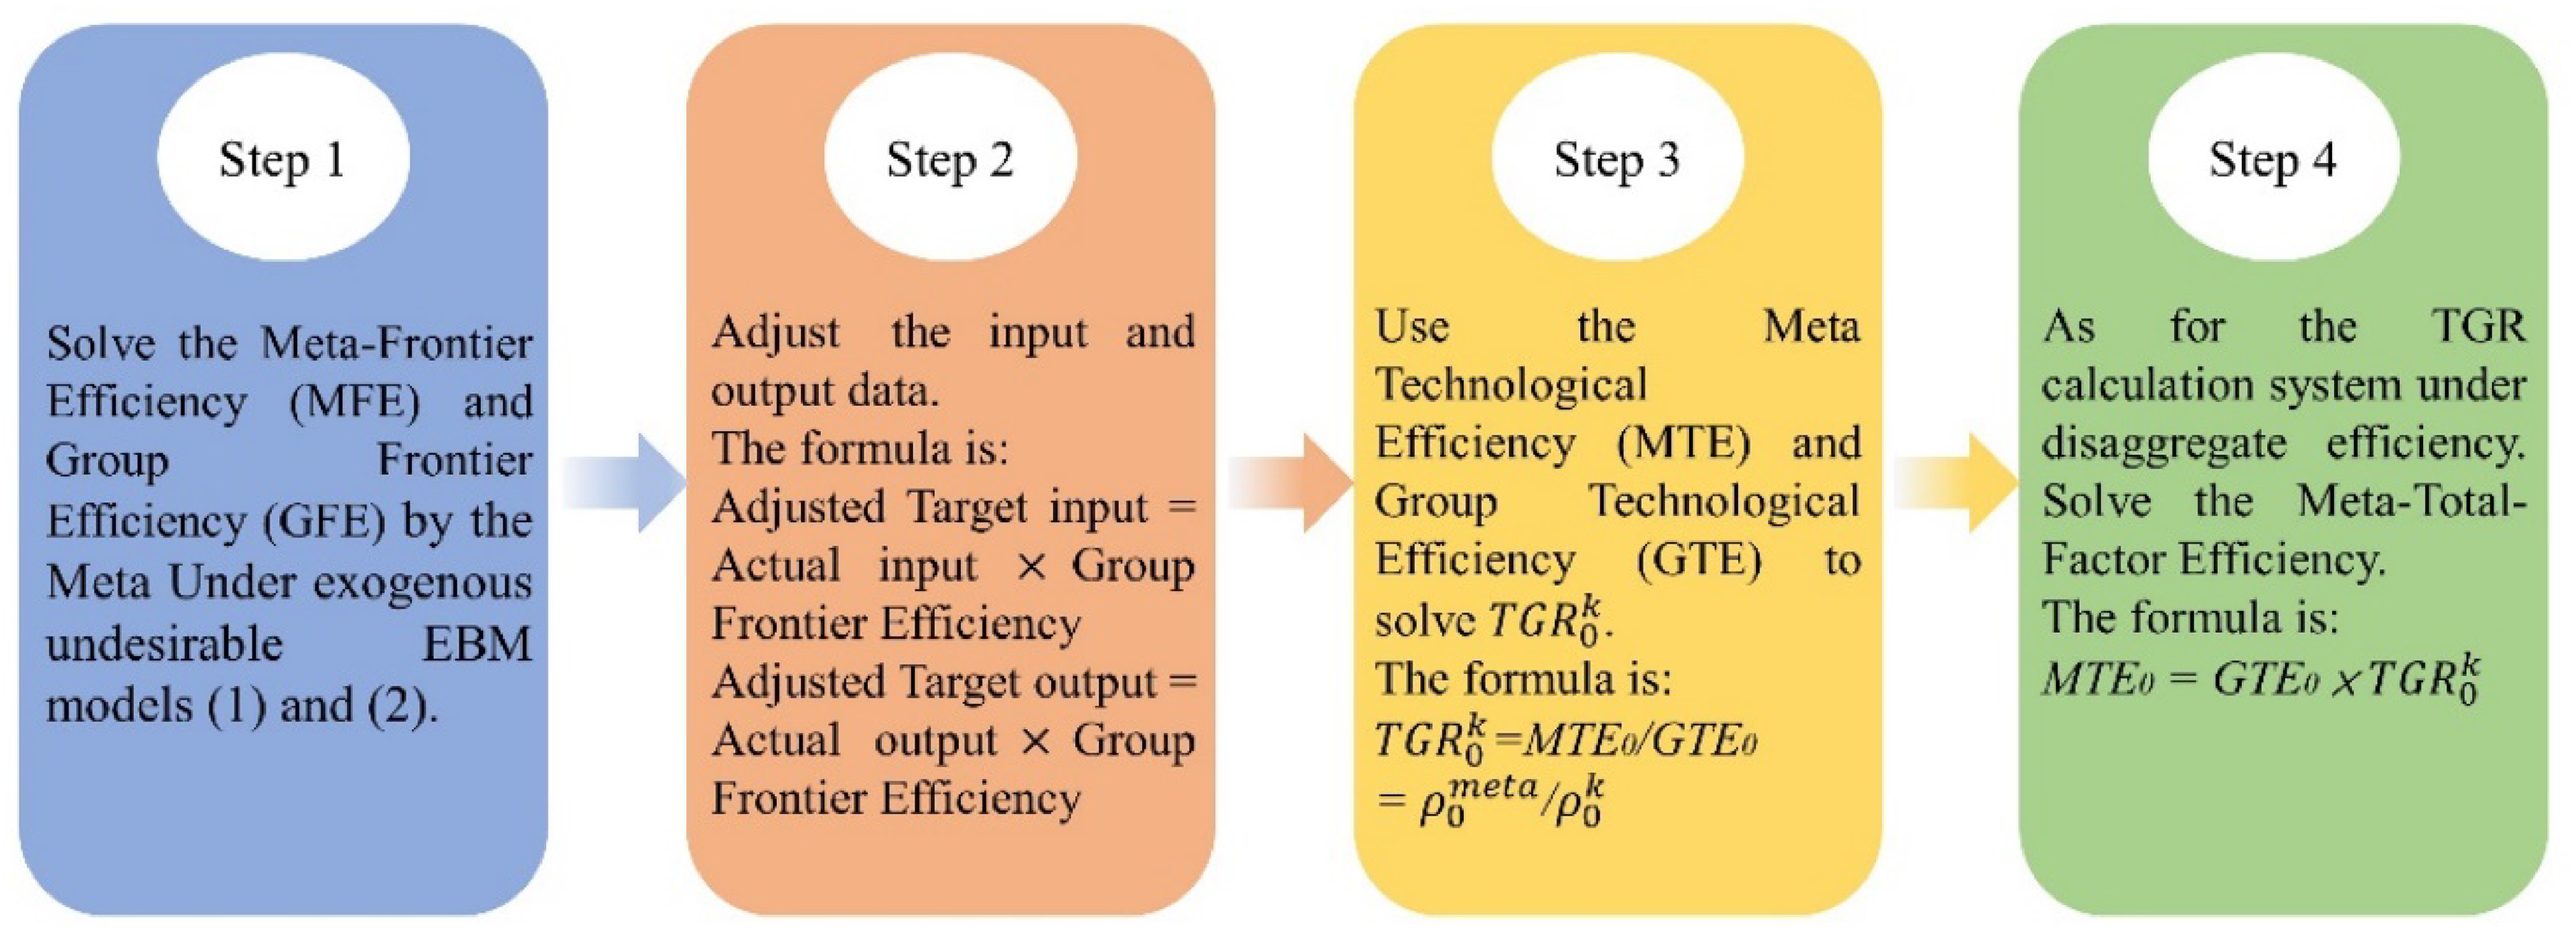
Flowchart of model.
Empirical result
Data source and variable description
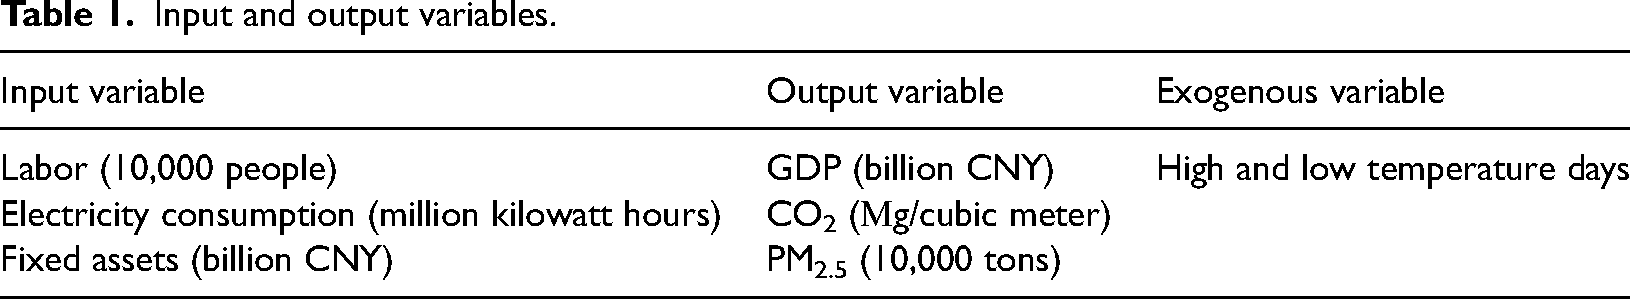
The data sources are China Statistical Yearbook, China Environmental Statistics Yearbook, and China Meteorological Yearbook. This study analyzes the meta efficiency performance, TGR efficiency, regional meta efficiency, and TGR efficiency as well as the exogenous variables in 28 provinces in China from 2013 to 2017 (see Table 1).
Exogenous variables: high and low temperature days (unit: day) We define high and low temperature days as the temperature greater than or equal to 35°C or the temperature less than or equal to 5°C, respectively. The basis for dividing the two groups: geographical location The eastern and central regions include Shanxi, Shandong, Tianjin, Beijing, Jilin, Anhui, Jiangxi, Jiangsu, Hebei, Henan, Zhejiang, Hainan, Hubei, Hunan, Heilongjiang, Fujian, Guangdong, and Liaoning. The western region includes Inner Mongolia, Sichuan, Gansu, Qinghai, Chongqing, Shaanxi, Guizhou, Yunnan, Ningxia, and Guangxi. Input and output variables: Labor: employees in urban units in the production and supply of electricity, gas, and water in various regions. Electricity consumption: Electricity consumption in various regions. Fixed assets: investment in all fixed assets in the production and supply of electricity, gas, and water in various regions. GDP: The gross product of each region. CO2: Calculated by the 2015 national grid average emission factor of 0.6101tCO2/MWh. PM2.5: The annual average concentration of particulate matter (PM2.5) in major cities.
Descriptive statistics of input and output variables
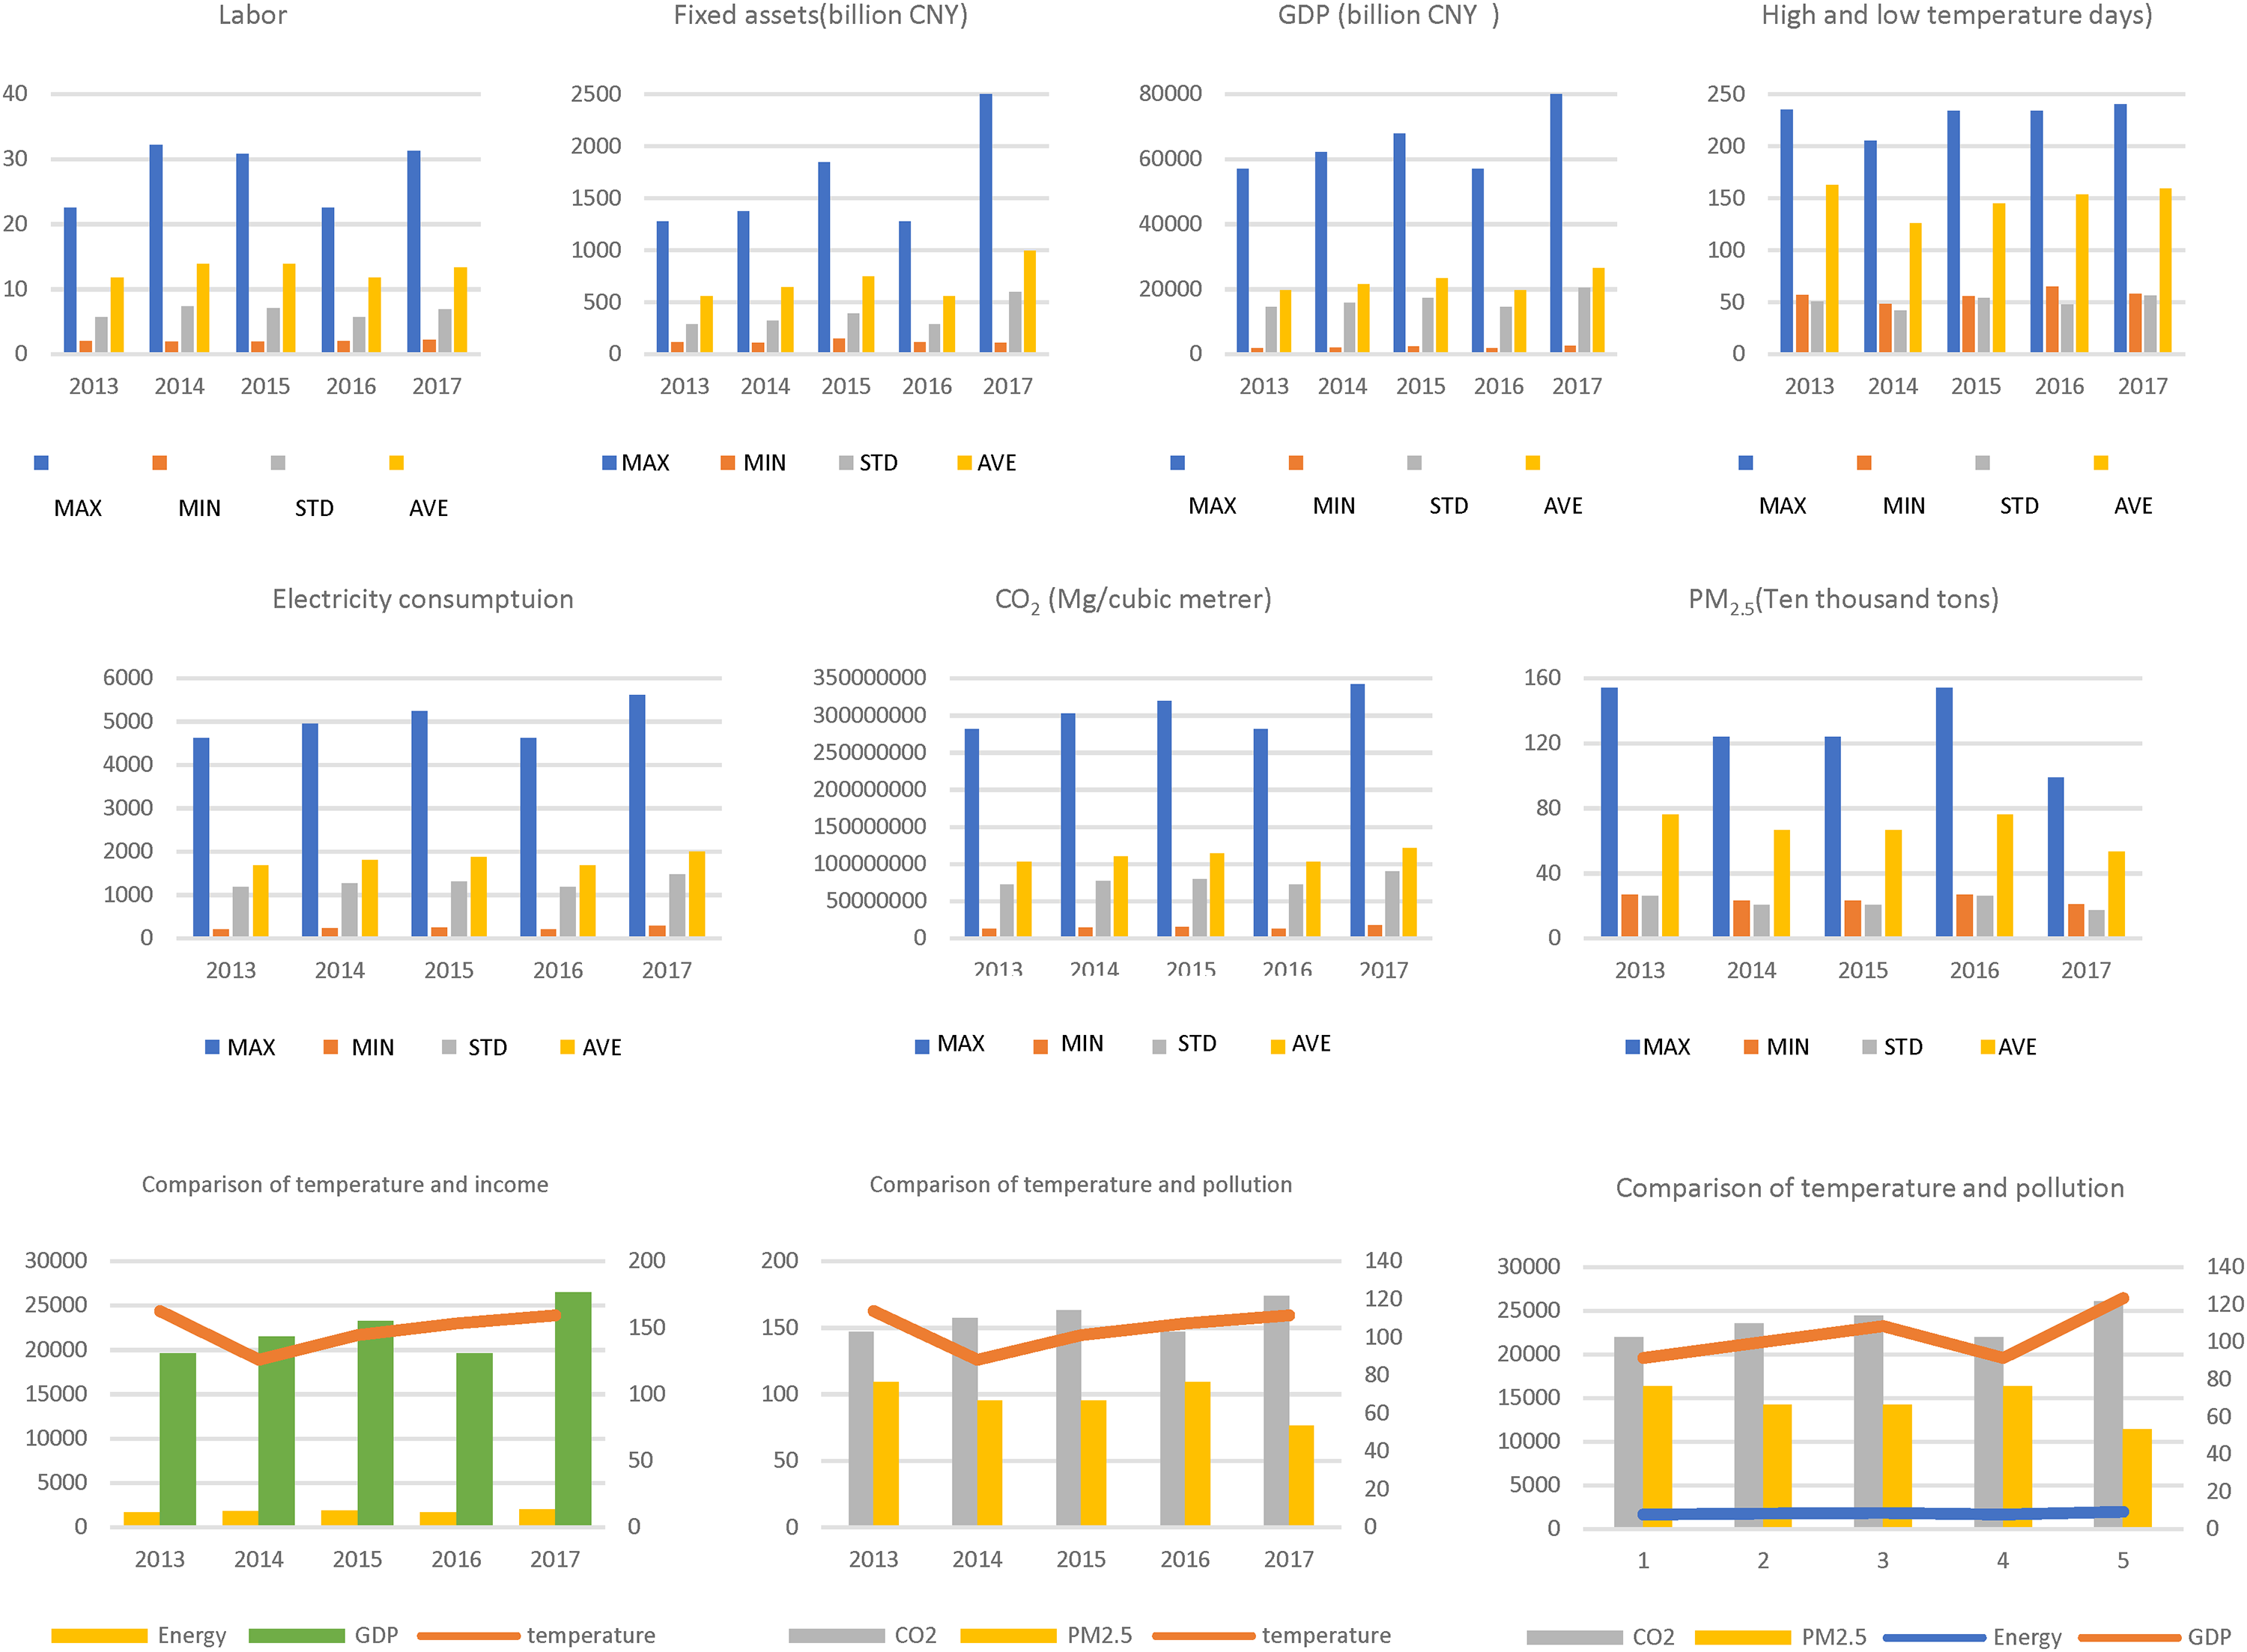
Figure 3 offers the following analysis.
Comparison of temperature and income: The year 2013 was the highest peak of the average high and low temperature days in these five years. The average value of GDP and electricity consumption are the lowest peaks in these five years. Although the high and low temperature days in 2014 significantly fell to the lowest value, they continued to grow until 2017. GDP and electricity consumption continued to grow except for 2016. Comparison of temperature and pollution: In 2013 we see the highest peak of the high and low temperature days and the average PM2.5 in these 5 years. The lowest peak of the average CO2 was in 2013, too. In 2014, the number of high and low temperature days was the lowest, and it grew until 2017. PM2.5 dropped by 660,000 tons in 2014 and 2015, but it increased to the same level that it was in 2013. However, in 2017 it dropped to the minimum value in 5 years. Except for 2016, CO2 also showed growth. Comparison of income and pollution: GDP, electricity consumption, and CO2 pollution levels showed growth in all year excepts 2016. PM2.5 peaked in 2013 and 2016 and showed a downward trend in the following year.
Input and output variables.
The above three results present that the aspects of GDP and electricity consumption, the number of high and low temperature days, and CO2 generally show a growing trend. The monitoring figures of PM2.5 in the pollution aspect have fluctuated in the past five years, and have not shown the same growth trend. The reason may be that it has been subject to the control policies of the China government.
Overall efficiency analysis
From Table 2, the efficiency value of Tianjin, Beijing, Jilin, Jiangsu, Hainan, Hunan, and Guangdong in 5 years is 1, all ranking first in the country. Fujian has an efficiency value of 1 in 3 years and 0.92 in the other 2 years, ranking second in the country. Shandong has a 4-year efficiency value of 1, and a 1-year efficiency value of 0.81, ranking third in the country. Hubei and Liaoning only have a 1-year efficiency value of 1, ranking 4th and 5th in the country. Although Qinghai has an efficiency value of 1 for 4 years, it was only 0.523 in 2014, thus ranking 6th in the country.
Input and output variables.
Overall efficiency of China's 28 provinces from 2013 to 2017.
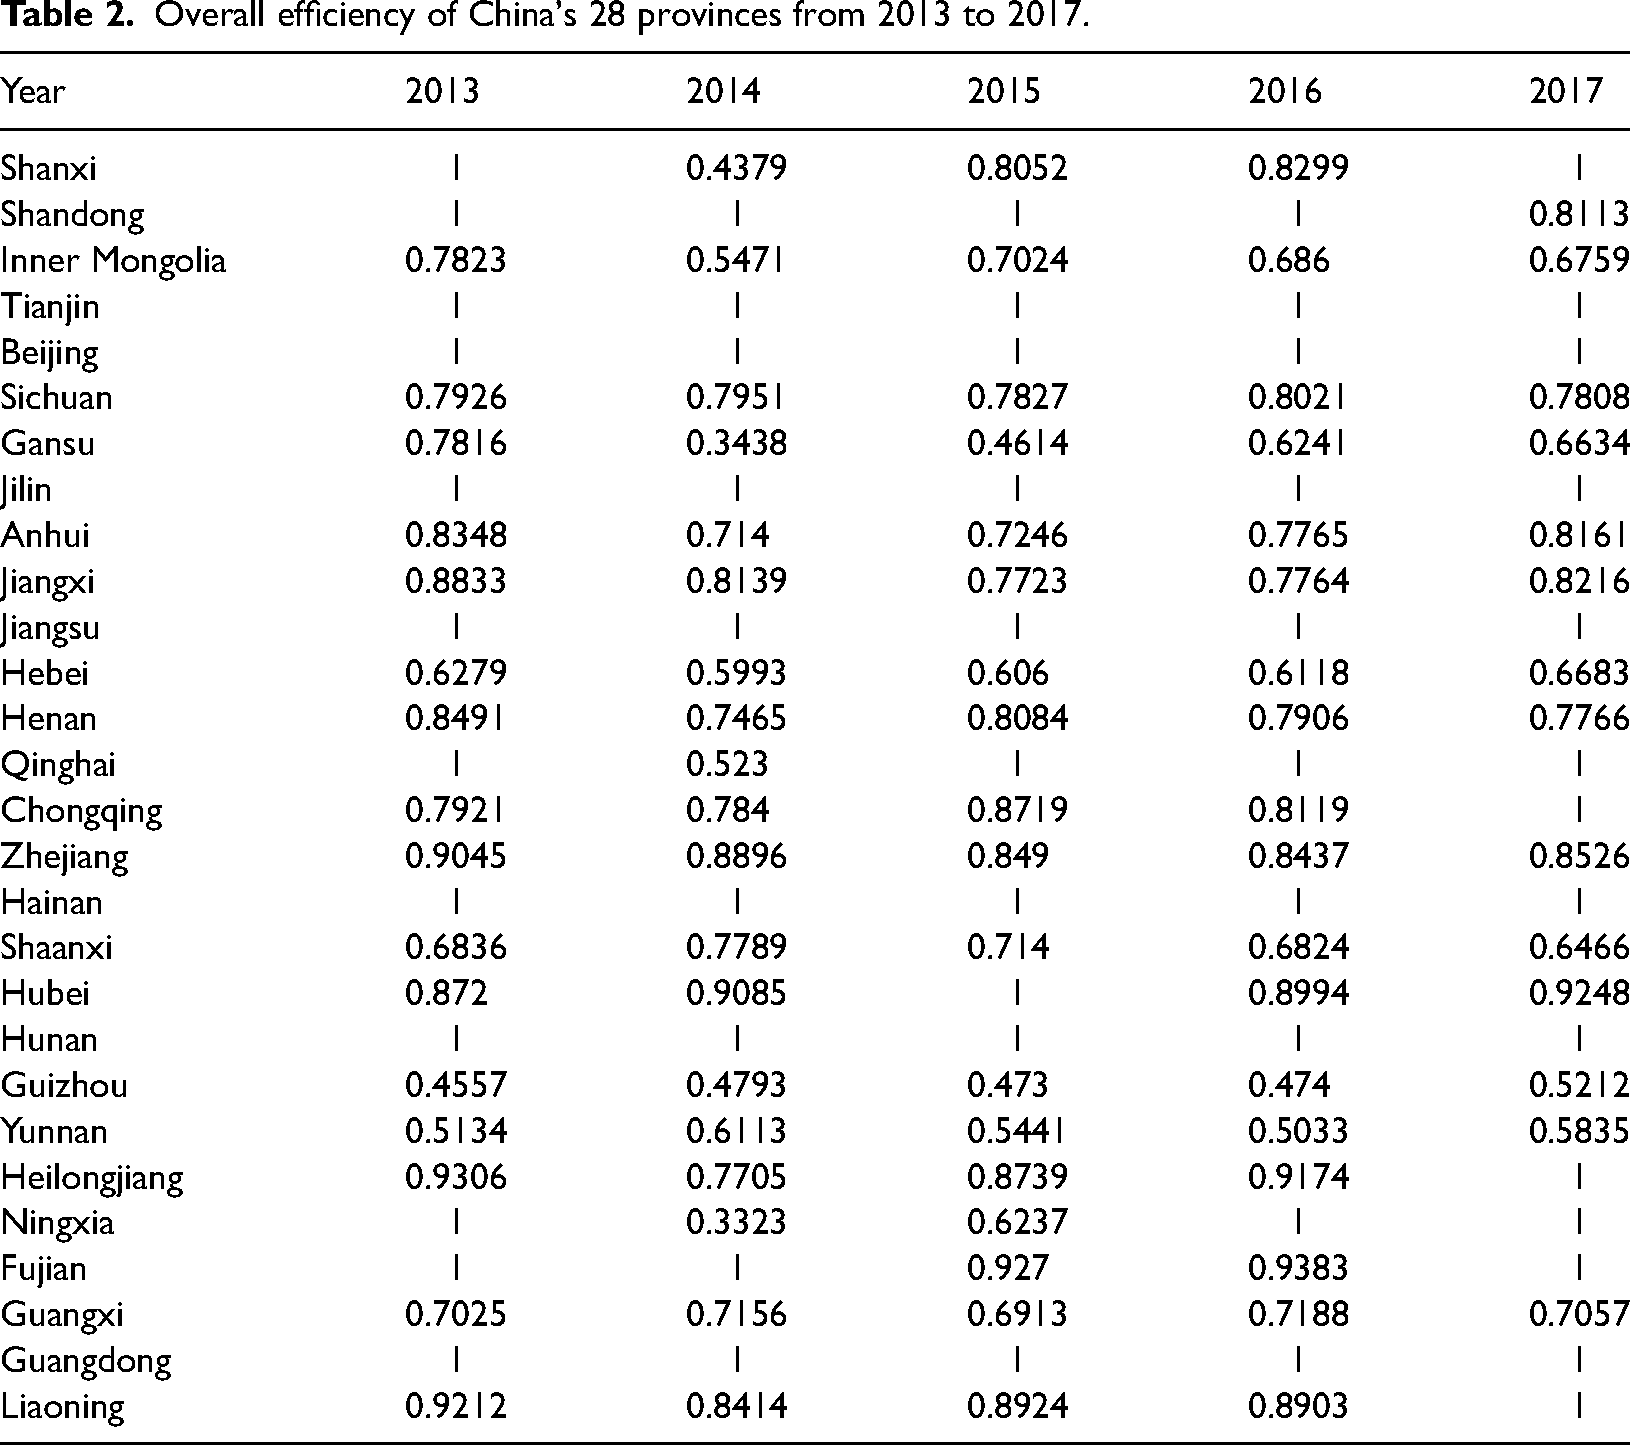
With a total efficiency of less than 0.6, Guizhou, Yunnan, and Gansu ranked first, second, and third from the bottom. Ningxia has three years of efficiency value of 1, but in 2014 it was only 0.33, and in 2015 it was only 0.62. Shanxi had two years of efficiency value of 1, but in 2014 it was only 0.43, and then bounced back to 0.80 and 0.82 in 2015 and 2016.
The efficiency values of Tianjin, Beijing, Jilin, Jiangsu, Hainan, Hunan, and Guangdong are all 1, representing the best economic development, electricity efficiency, and renewable energy in these provinces. These provinces are all in the east region of China. We foundthat the provinces in the east region have high economic efficiency and high utilization efficiency of renewable energy. Because these provinces already have good economic development, the local governments can focus on environmental issues. Therefore, these provinces use more renewable energy to reduce pollution. Some regions have poor economic development, and so their first consideration is to have enough electricity to support economic development. Therefore, renewable energy and environmental issues are not a priority for them, and so their use efficiency of renewable energy is poor.
From the overall perspective of total efficiency, the seven provinces with 5-year efficiency values of 1 are in the east and central regions. The worst overall efficiency in the country is less than 0.6, covering Guizhou, Yunnan, and Gansu, which are all in the west Therefore, the overall efficiency of the east and central regions is much better than that of the west region. The analyses of meta efficiency and TGR efficiency also show that the east and central regions are better than the west
Meta efficiency analysis of each year
Before and after considering exogenous variables, the meta efficiency values of each year, and the two groups. In Table 3, Guizhou, Shanxi, Yunnan, and Gansu have meta efficiency of less than 0.6 and are first, second, third, and fourth from the bottom, respectively. Tianjin, Beijing, Jilin, Jiangsu, Hainan, Hunan, and Guangdong all have a 5-year efficiency value of 1, ranking first Hubei and Fujian have a meta-efficiency value of 1 for 2 years and 0.84 in the other 3 years, ranking 2nd and 3rd. Shandong has a meta efficiency of 1 for 3 years and 0.78 for the other two years, ranking 4th. Qinghai has a meta efficiency of 1 for 4 years, but only 0.52 in 2014, ranking 5th. Liaoning has a 1-year meta efficiency value of 1, ranking 6th.
Meta efficiency of 28 provinces in China from 2013 to 2017.
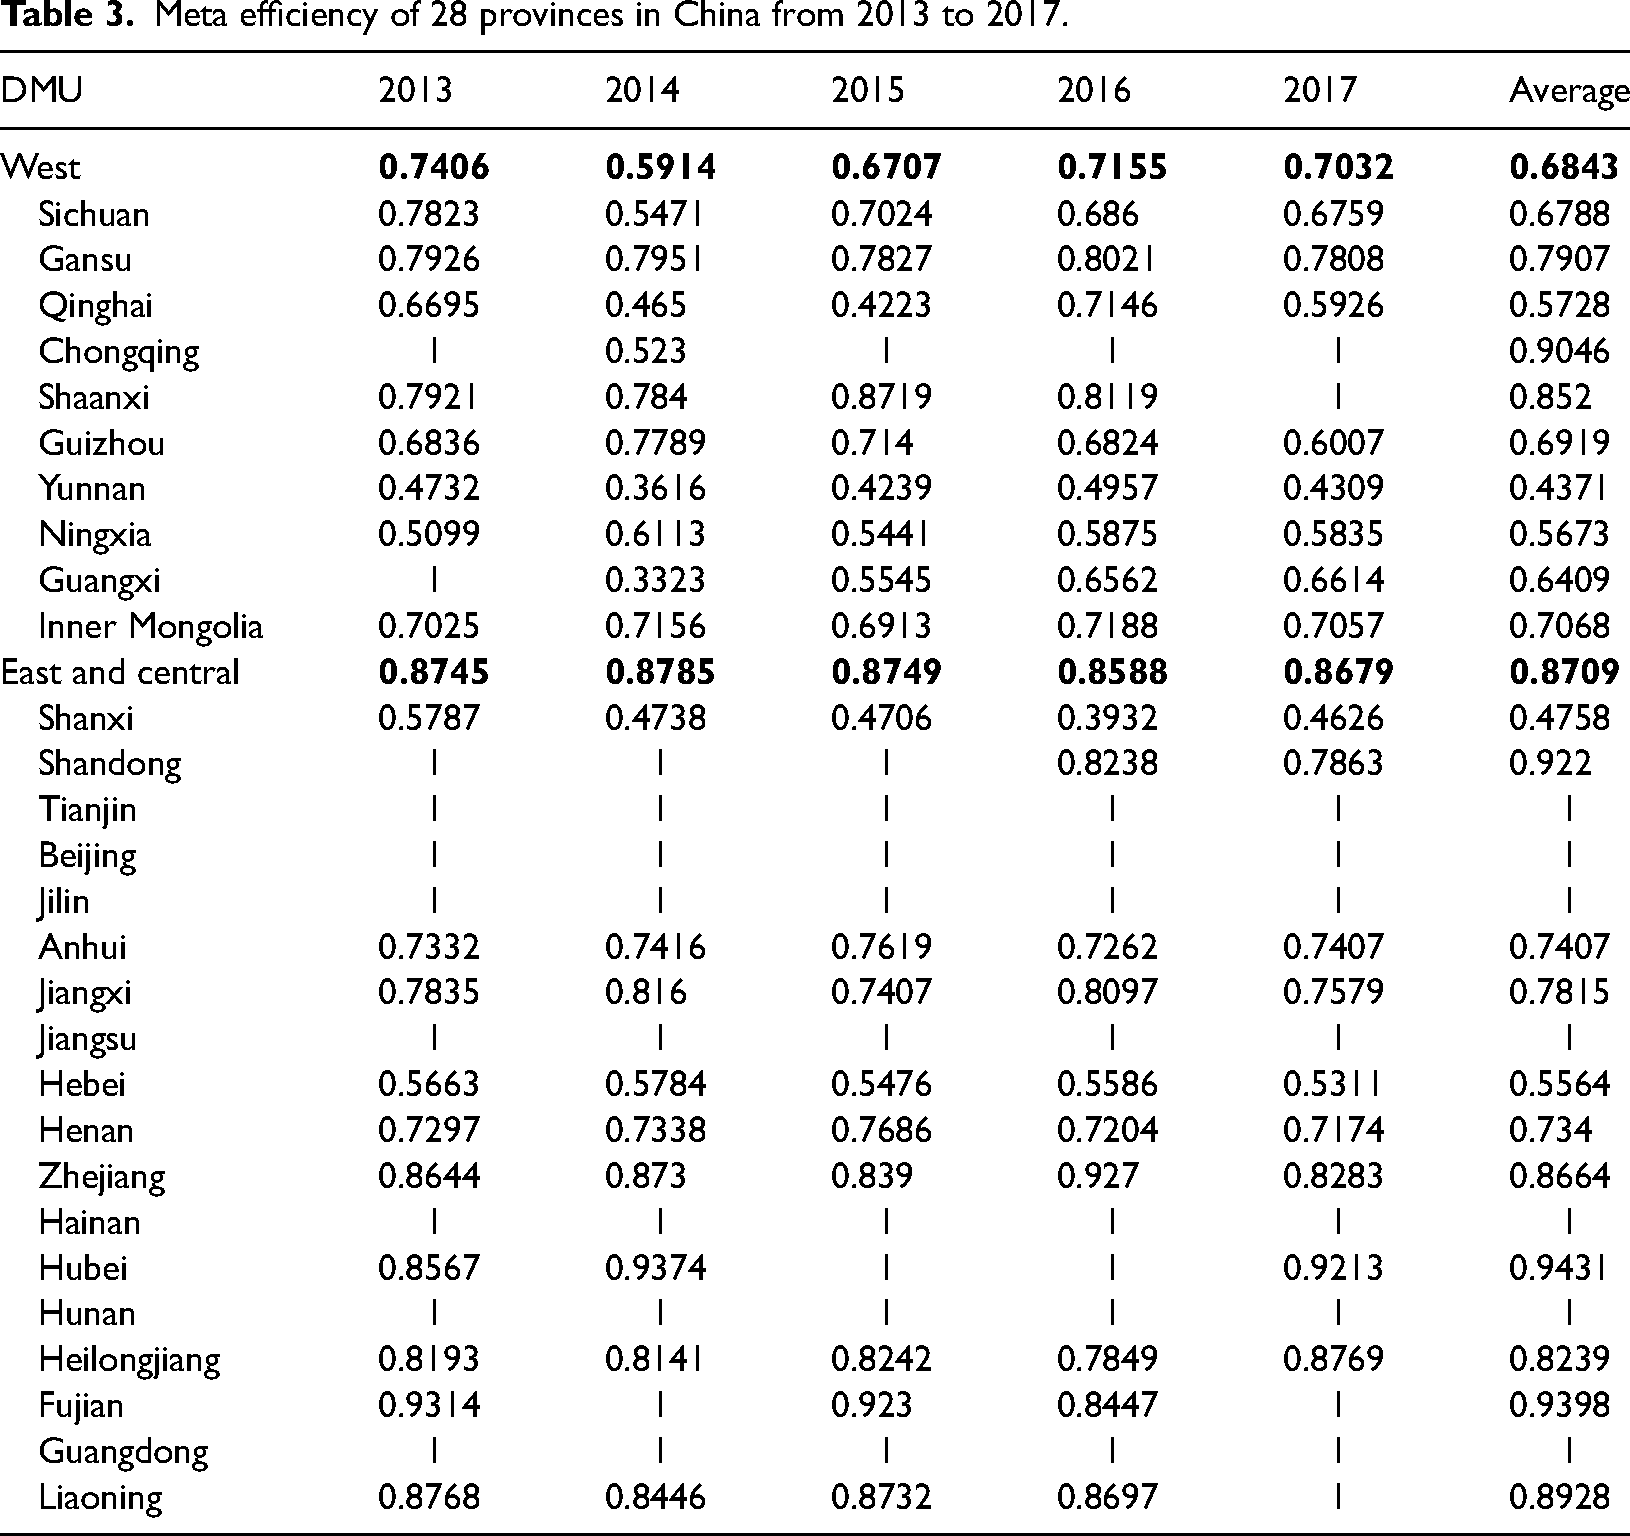
On the whole, the overall meta-efficiency performance of the east and central regions is much better than that of the west regions. The seven provinces with 5-year meta-efficiency values of 1 are all in the east and central regions. Guizhou, Yunnan, and Gansu have the worst meta efficiency in the country at below 0.6 and are all in the west
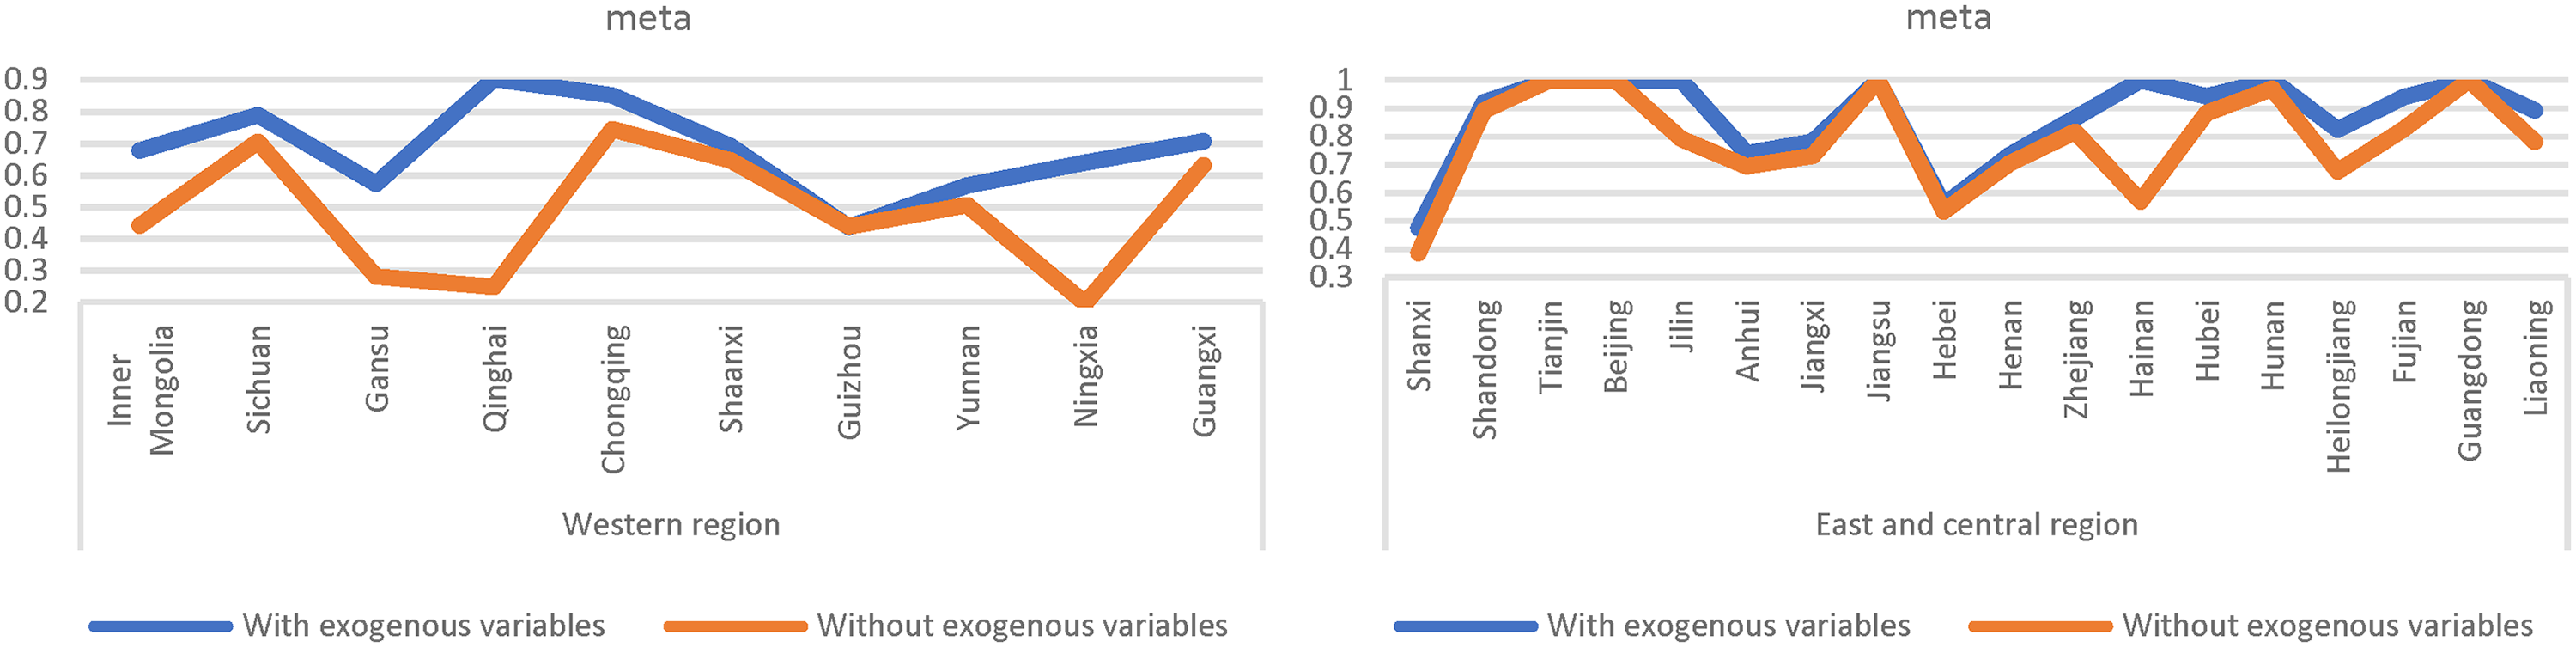
Meta changes before and after considering exogenous variables. In order to effectively measure meta efficiency, this study introduces the number of high and low temperature days as an exogenous variable to understand the impact of global greenhouse effect on economic and environmental meta efficiency. It can be seen from Figure 4 that the result from ignoring climatic factors will lead to overestimation or underestimation of meta efficiency.
Meta changes before and after considering exogenous variables in 28 provinces of China.
If there are no exogenous variables, then there will be errors in all the western regions. Guizhou shows an overestimation, while the remaining 9 provinces are all underestimated - among them, Qinghai (underestimated by 0.65) and Ningxia (underestimated by 0.44). If exogenous variables are not included in the eastern and central regions, then Tianjin, Beijing, Jiangsu, have Guangdong have no errors at all. The remaining 14 provinces are all underestimated. Among them, the most underestimated provinces are Hainan (underestimated 0.43) and Jilin (underestimated 0.20).
Analysis of TGR efficiency in each year
The TGR efficiency values of the two groups in each year and the changes in TGR before and after considering exogenous variables. From Table 4, Guizhou and Yunnan have the worst TGR efficiencies of less than 0.6 and are the first and second from the bottom, respectively. Shandong, Tianjin, Beijing, Jilin, Anhui, Jiangxi, Jiangsu, Zhejiang, Hainan, Hubei, Hunan, Heilongjiang, Fujian, Guangdong, and Liaoning all have a 5-year efficiency value of 1, ranking first Hebei, Henan, and Shanxi have 4-year efficiency value of 1. Their TGR efficiency values are all 1, and so they rank 2nd, 3rd, and 4th, respectively. Qinghai has 4 years of TGR efficiency of 1, but in 2014 it was only 0.522, ranking 5th. Chongqing has 1 year of TGR efficiency, but the remaining 4 years are above 0.78, and so it ranks 6th. Ningxia has a TGR efficiency value of 1 for 3 years, but it was only 0.33 in 2014, and only 0.62 in 2015, ranking 7th.
TGR efficiency of 28 provinces in China from 2013 to 2017.
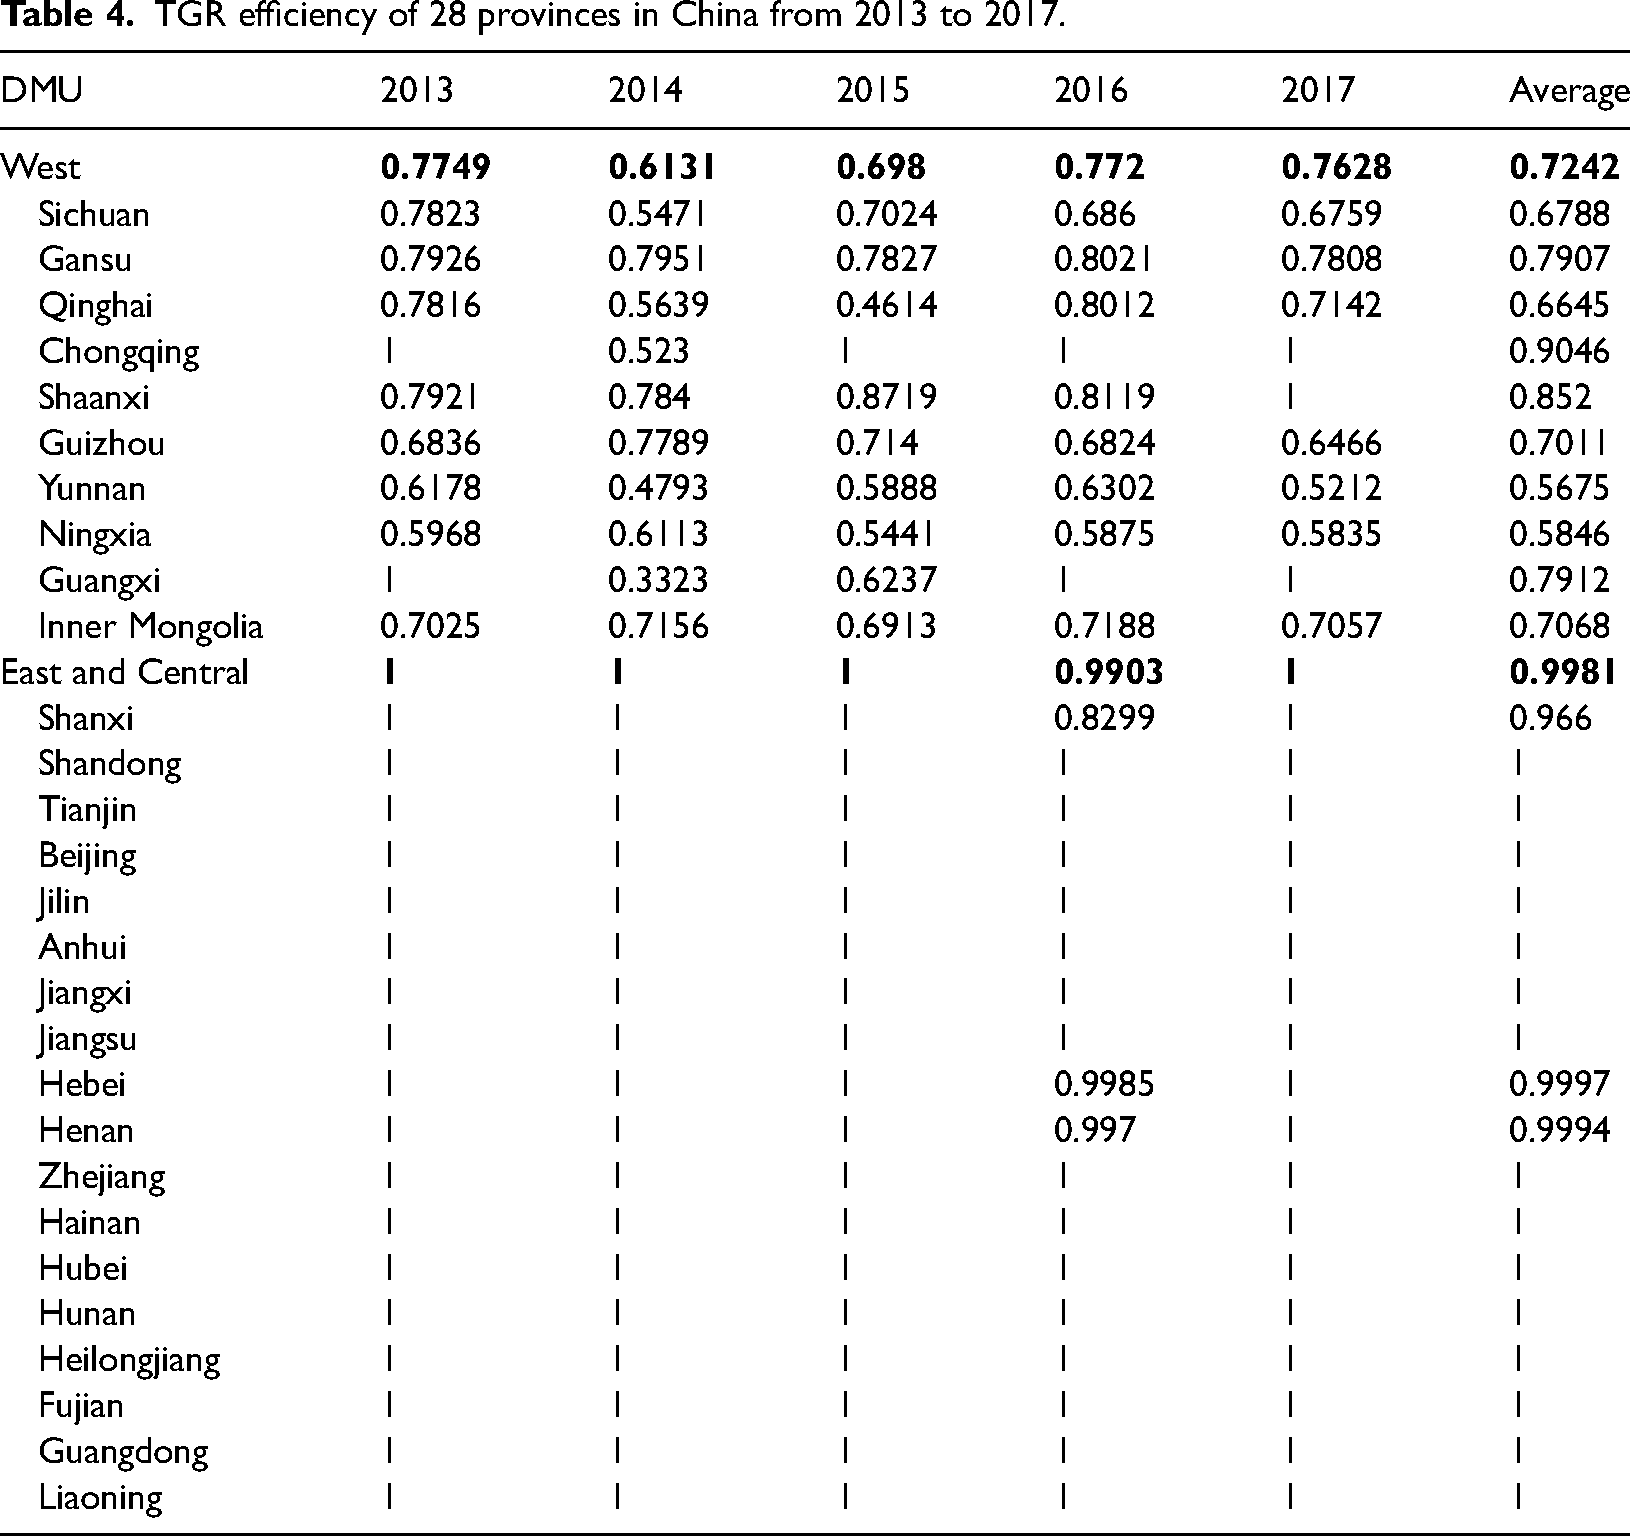
The overall TGR efficiencies of the east and central regions are much better than that of the west region. The 15 provinces with 5-year TGR efficiency values of 1 are all in the east and central regions.
Changes in TGR before and after considering exogenous variables. From Figure 5, we see if there are no exogenous variables, then all west regions will have errors. Among them, Gansu, Shaanxi, and Guizhou are overestimated, while the remaining 7 provinces in the west are all underestimated. The most underestimated provinces are Qinghai (underestimated by 0.35), Inner Mongolia (underestimated by 0.197), and Ningxia (underestimated by 0.193). If exogenous variables are not included in the eastern and central regions, then Tianjin, Beijing, Jiangsu, and Guangdong have no errors. The remaining 14 provinces are all due to the TGR efficiency value of 0.924. Among them, the most underestimated province is Jilin (0.075 underestimated).
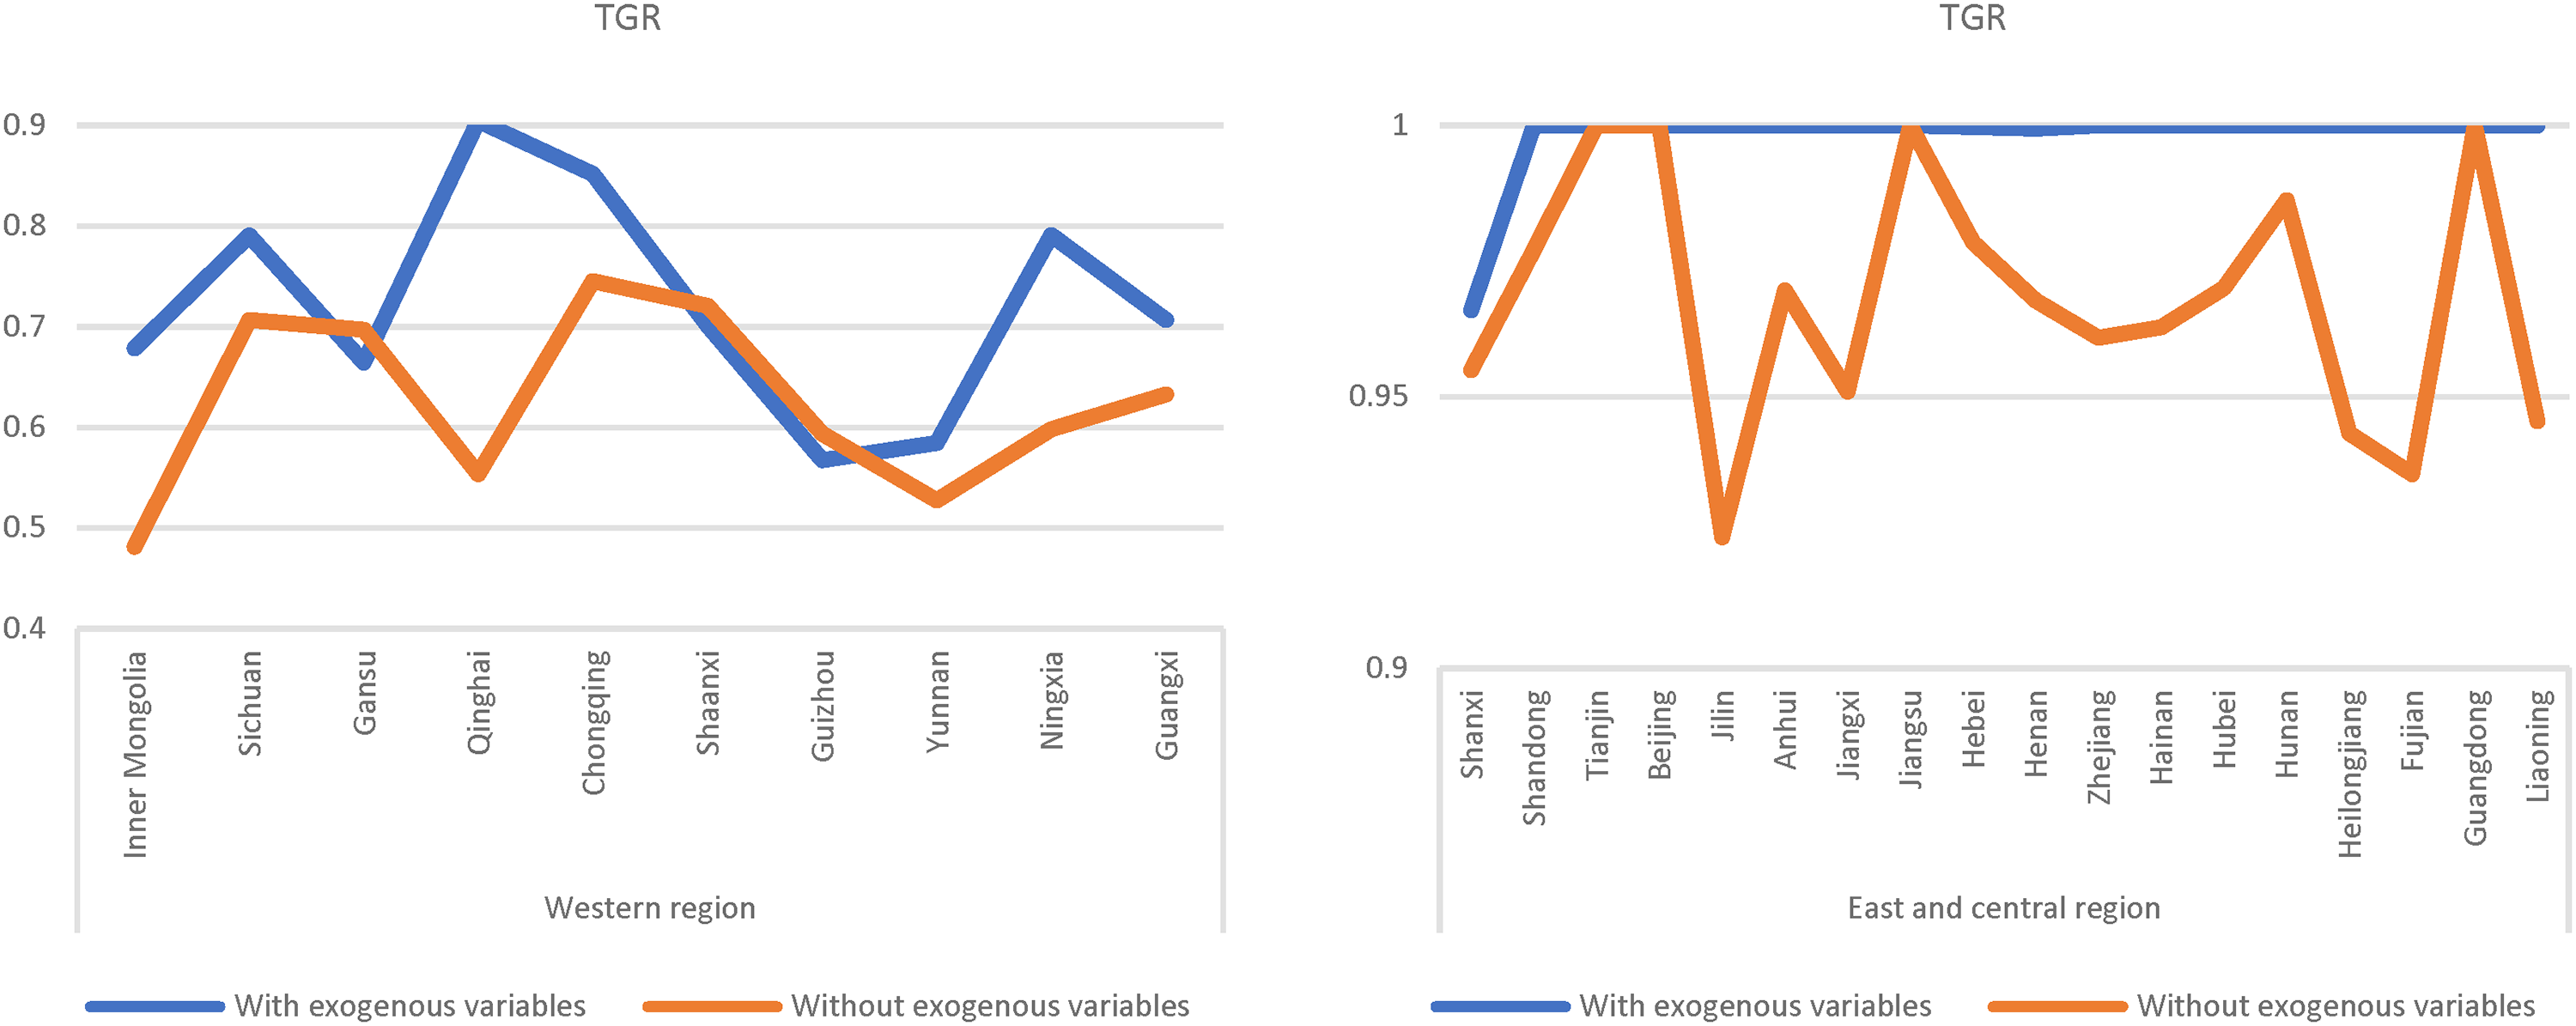
TGR before and after considering exogenous variables in 28 provinces of China.
Variable efficiency
Variables for TGR efficiency and high and low temperature days. From Figure 6, the overall TGR efficiency of 28 provinces in China is consistent with the trend of GDP, CO2, and PM2.5 TGR efficiencies. However, there are still a few provinces affected by electricity consumption or other variables, resulting in different trends. For example, Inner Mongolia's GDP and CO2 TGR efficiency reaches 0.82, PM2.5 reaches 0.7, but its total TGR efficiency is only 0.67. Qinghai's GDP, CO2, and PM2.5 TGR efficiencies are all 1, but its total TGR efficiency is only 0.9. The total efficiency of GDP, PM2.5, and TGR in Gansu falls between 0.61 and 0.67, but the TGR efficiency of CO2 is only 0.57. The TGR efficiency of CO2 in Guizhou reaches 0.66, but the total efficiency of GDP, PM2.5, and TGR is between 0.56 and 0.6.
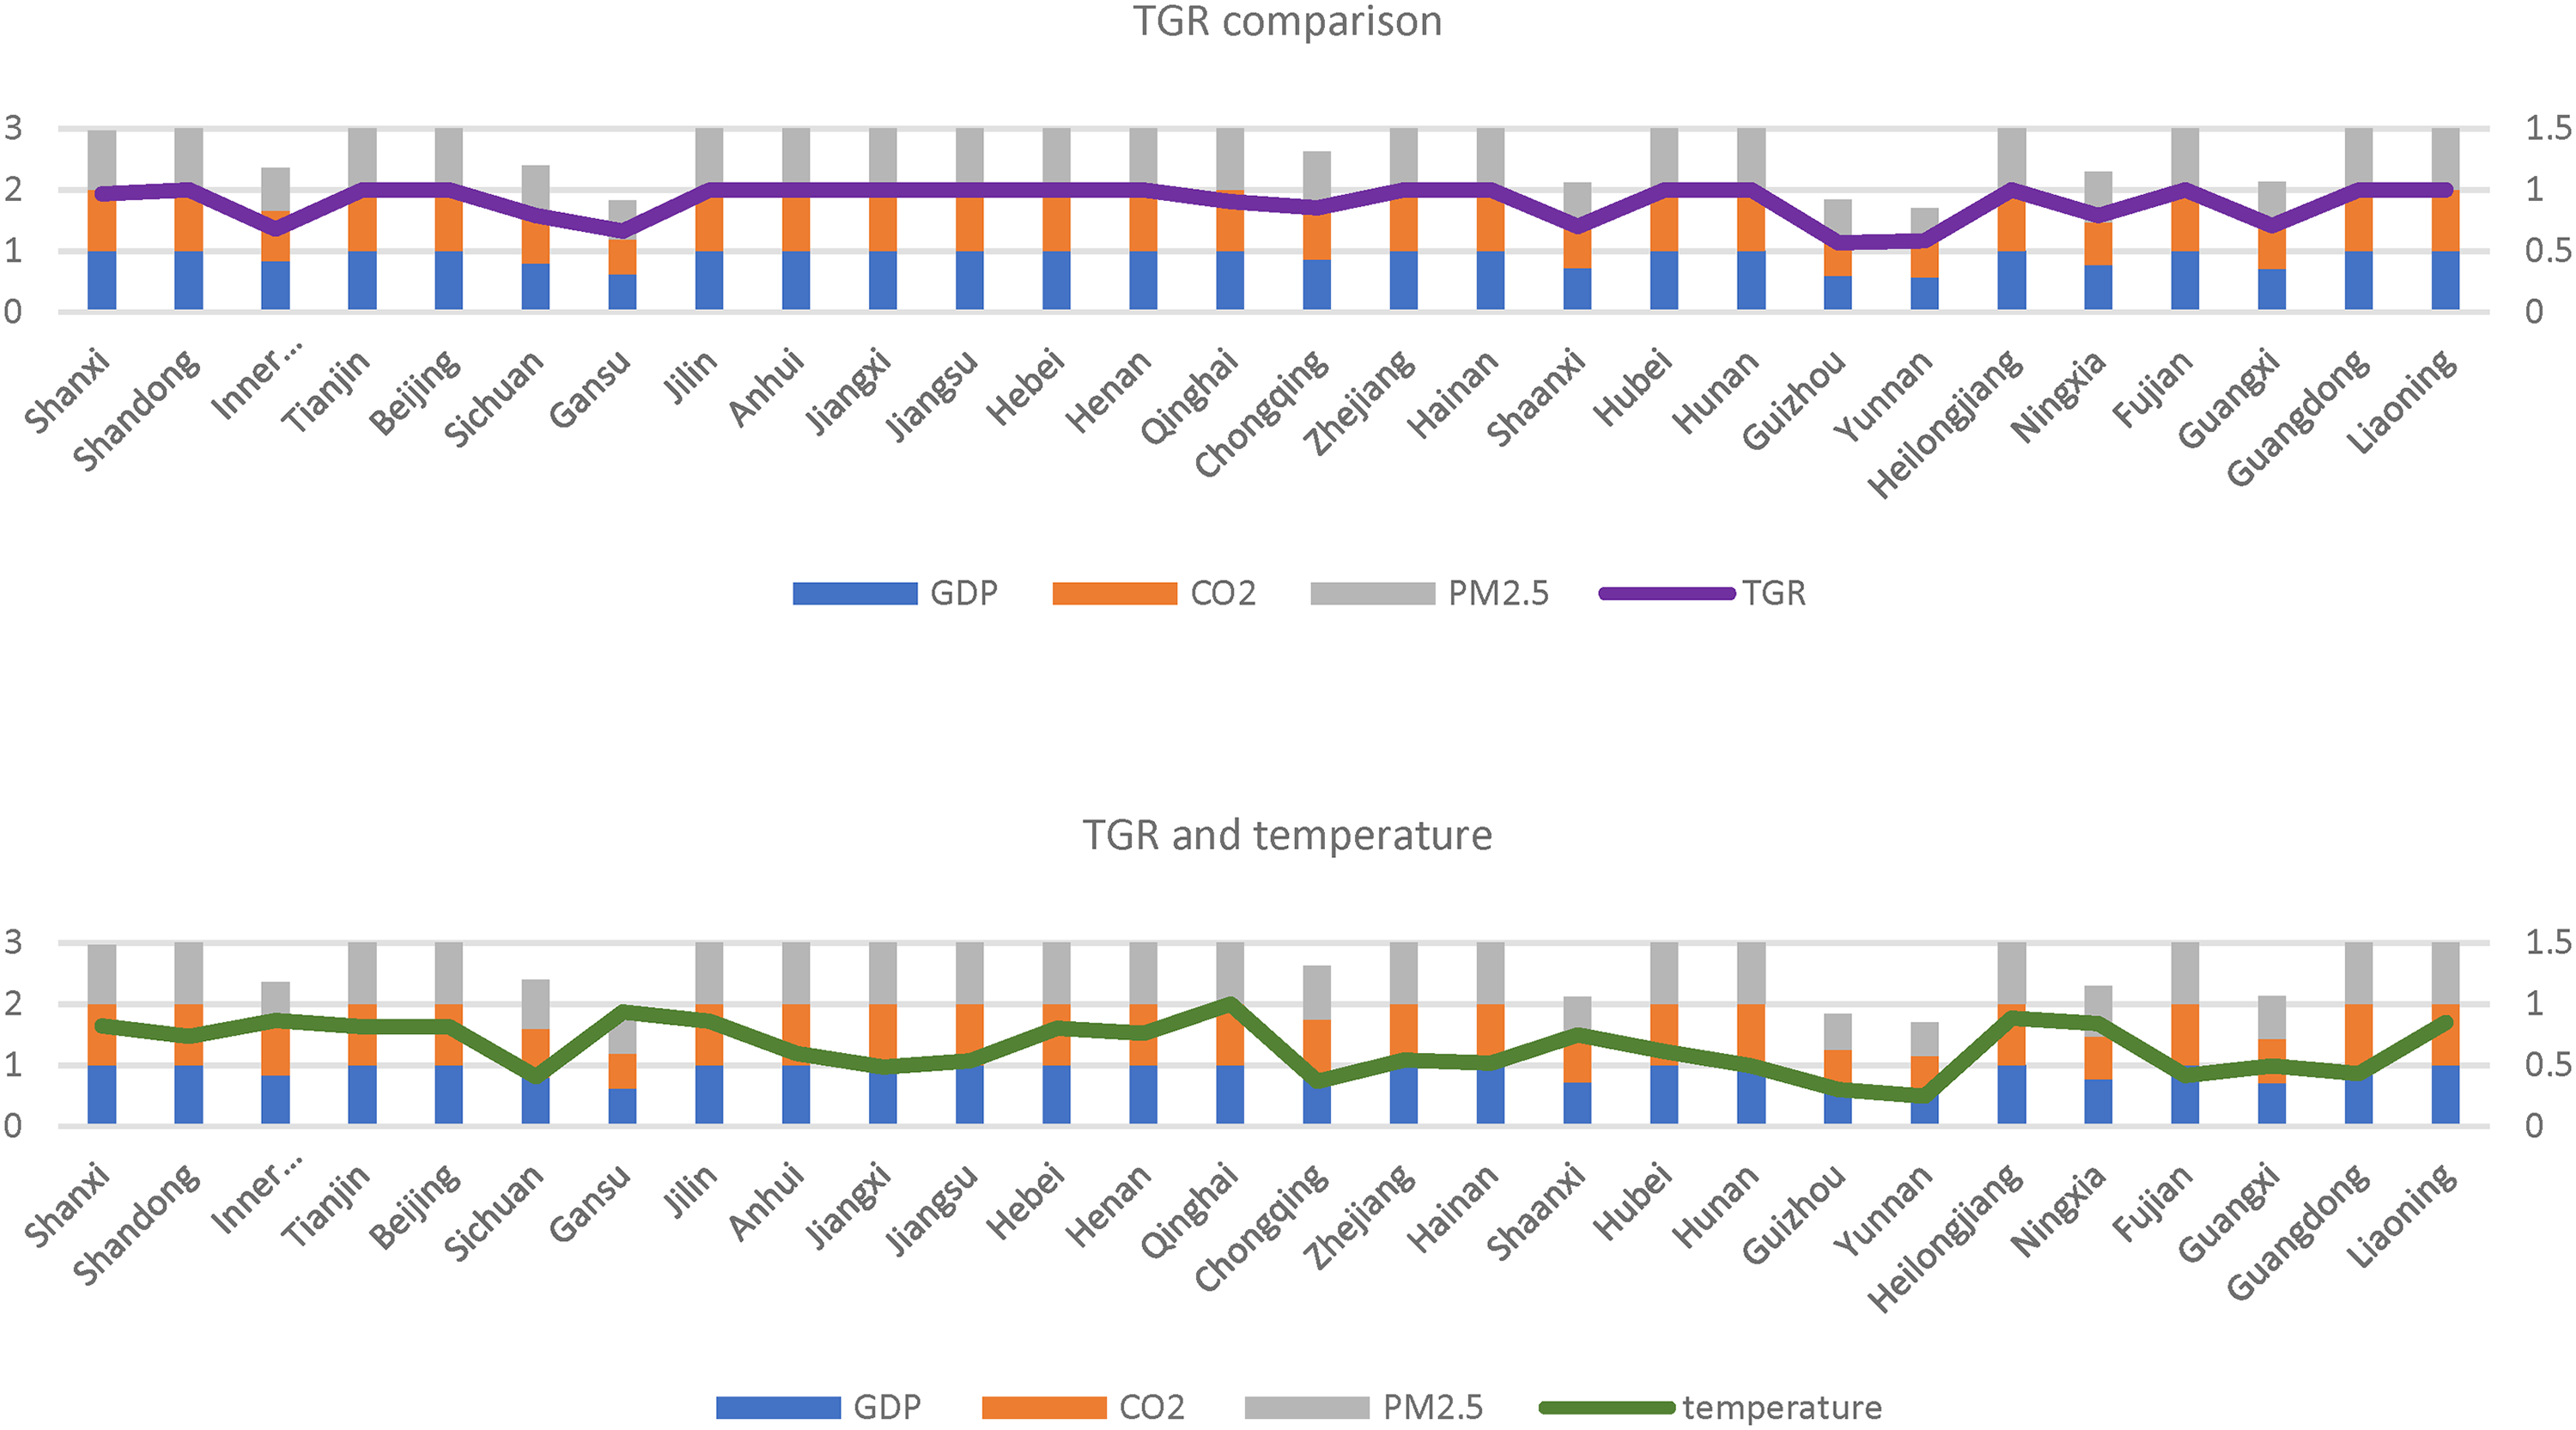
TGR efficiency of GDP, CO2, and PM2.5 and high and low temperature days in 28 provinces of China.
The maximum value of high and low temperature days is all in Qinghai for 5 years (average 229 days), and the minimum value of the 5 years is all in Yunnan (average 56 days). Thus, the abnormal climate is unevenly distributed. To further understand this, we compare the TGR efficiency of individual variables such as GDP, CO2, and PM2.5 in 28 provinces in China with high and low temperature days. The results show that abnormal temperature and TGR efficiency of individual variables such as GDP, CO2, and PM2.5 do not have the same trend, clearly denoting that the climate crisis has no boundaries.
Qinghai, which has the most high and low temperature days, has a TGR efficiency of 1 for GDP, CO2, and PM2.5, but a total TGR efficiency of 0.9. Gansu, which has the second highest number of high and low temperature days, has a CO2 TGR efficiency of 0.57, but GDP and PM2.5 TGR efficiency and total TGR efficiency are between 0.67 and 0.67. In Yunnan, where the number of days of high and low temperature is the least, the TGR efficiency of GDP, CO2, and PM2.5 and the total efficiency of TGR are all between 0.54 and 0.59. Guizhou, which has the second least number of high and low temperature days, has a CO2 TGR efficiency of 0.66, and its total efficiency of GDP, PM2.5, and TGR is between 0.56 and 0.6. Tianjin, Beijing, Jilin, Anhui, Jiangxi, Jiangsu, Zhejiang, Hainan, Hubei, Hunan, Heilongjiang, Fujian, Guangdong, and Liaoning's GDP, CO2, and PM2.5 TGR efficiency and total TGR efficiency are all 1, but high and low temperature days are between 95 days and 203 days. Among the 28 provinces, the ranking of abnormal temperature is roughly in the second category, the first category is concentrated in 3rd to 9th, and the second category is concentrated in 15th to 24th.
The change of the variable TGR before and after consider exogenous variables. From Figure 7, if the exogenous variables are not included, then the TGR efficiency of GDP in the west region will have an error. The most underestimated provinces are Qinghai (underestimated 0.42), Inner Mongolia (underestimated 0.35), and Ningxia (underestimated 0.16). If exogenous variables are not included, then there is no error in GDP in Tianjin, Beijing, Jiangsu, Hunan, and Guangdong in the eastern and central regions. The remaining 13 provinces are all slightly underestimated, because the TGR efficiency value has reached at least 0.94, and the most underestimated province is Jilin (0.057 underestimated).
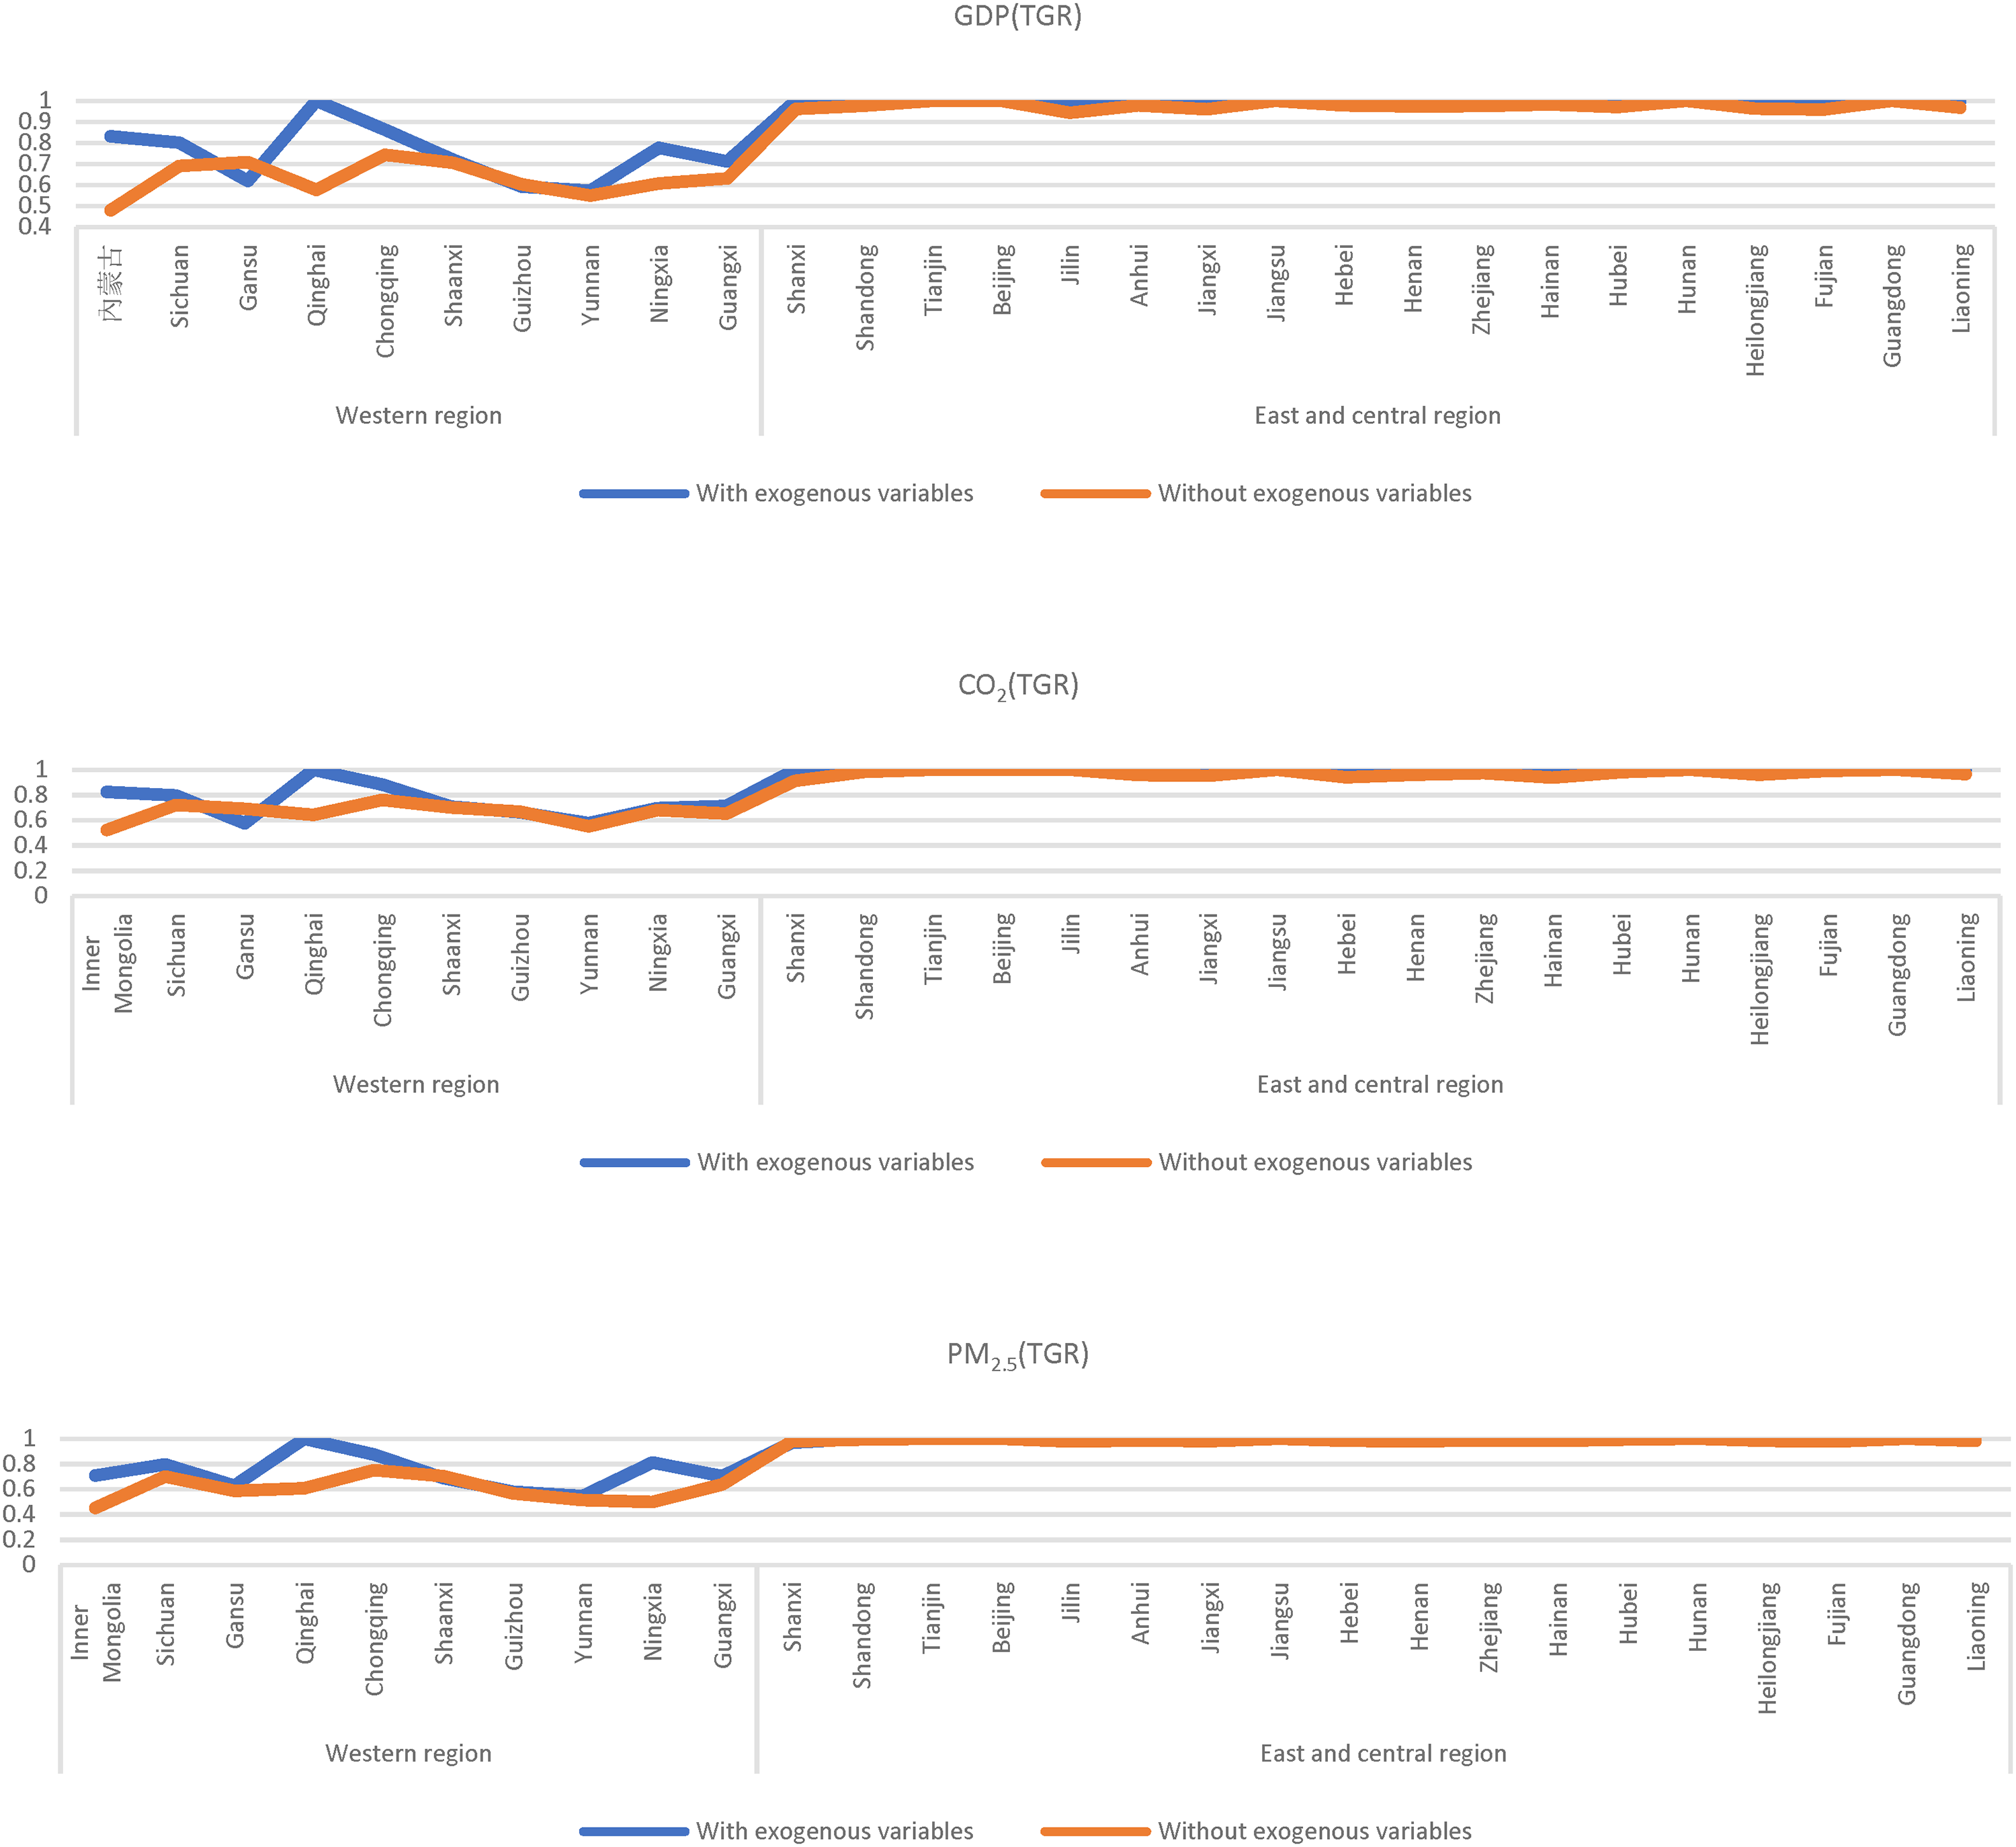
Changes in GDP, CO2, and PM2.5 TGR in 28 provinces in China before and after considering exogenous variables.
If the exogenous variables are not included, then the TGR efficiency of CO2 in the western region will have an error. Among them, Gansu and Guizhou are overestimated, and the remaining 8 provinces are all underestimated. The most underestimated provinces are Qinghai (underestimated by 0.35) and Inner Mongolia (underestimated by 0.3). If exogenous variables are not included, then CO2 in the eastern and central regions of Tianjin, Beijing, Jilin, Jiangsu, Hunan, and Guangdong have no errors. The remaining 12 provinces are all slightly underestimated, because the TGR efficiency value has reached at least 0.91, and the largest underestimated province is Shanxi (0.087 underestimated).
If the exogenous variables are not included, then the TGR efficiency value of PM2.5 in the western region will have an error. Here, Shaanxi is overestimated, and the remaining 9 provinces are underestimated - among them, Qinghai (underestimated by 0.39), Ningxia (underestimated by 0.31), and Inner Mongolia (underestimated by 0.25). If exogenous variables are not included, then PM2.5 is in the east In the central region, only Tianjin, Beijing, Jiangsu, Hunan, and Guangdong have no errors. The remaining 13 provinces are all slightly underestimated, because the TGR efficiency value has reached at least 0.97 or more, and the largest underestimated province is Shanxi (0.0103 underestimated).
From Figure 8 we see for China as a whole that national electricity consumption is almost the same as the TGR efficiency value of CO2, and both are higher than PM2.5. Technology urgently needs to be improved to help lower PM2.5. We further divide the data into two groups for analysis: the west group and the east and central group. The west region's findings are consistent with the aforementioned analysis on a national level. However, in 2013, electricity consumption in the east and central regions was lower than the TGR efficiency value of CO2 and PM2.5. In 2016, the TGR efficiency value of PM2.5 was the lowest in the west region.
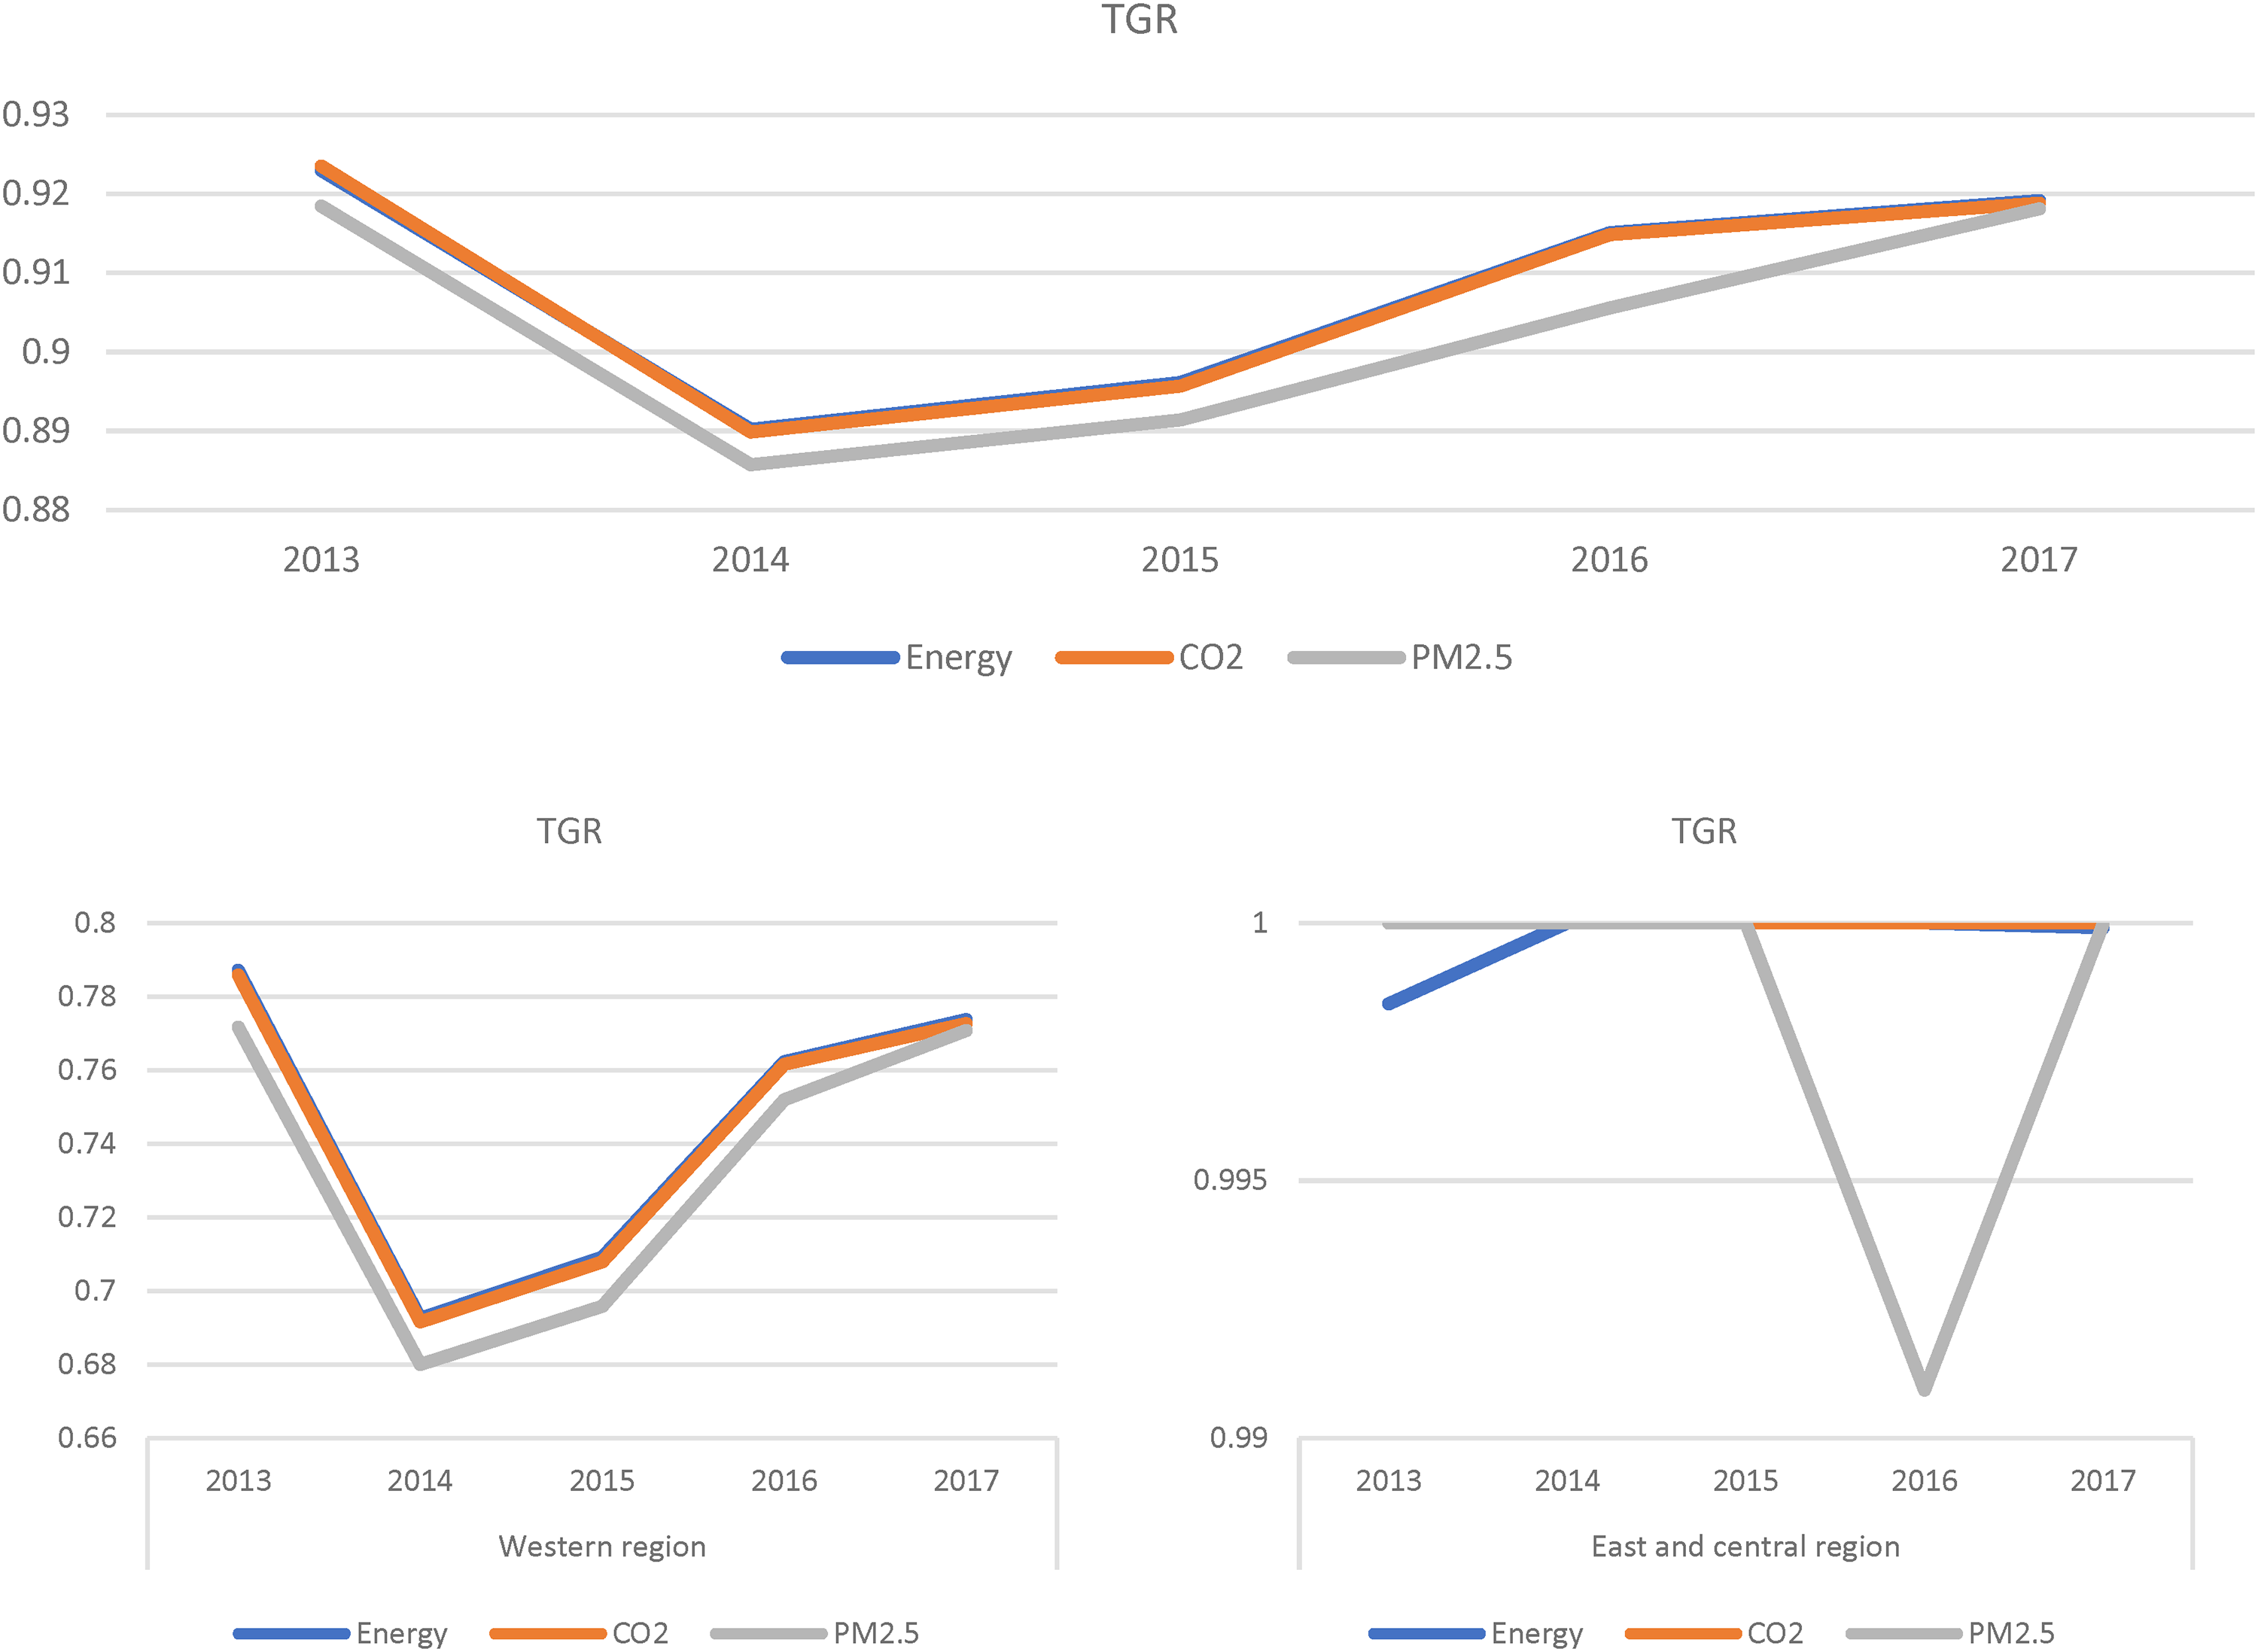
Comparison of TGR efficiency of electricity consumption, CO2, and PM2.5 in 28 provinces in China.
From Figure 9 we see that the TGR efficiency values of GDP, CO2, and PM2.5 in the east and central regions are much higher than those in the west region. In particular, the TGR efficiency values of GDP and CO2 in the east and central regions are all 1 for 5 years, while PM2.5 is 1 in the first three years and 0.99 in the last two years. The TGR efficiency values of GDP, CO2, and PM2.5 in the west region in these five years are all below 0.8. The technology gap in the west region is far greater than that in the east and central regions, and so it urgently must improve its regional technology level.
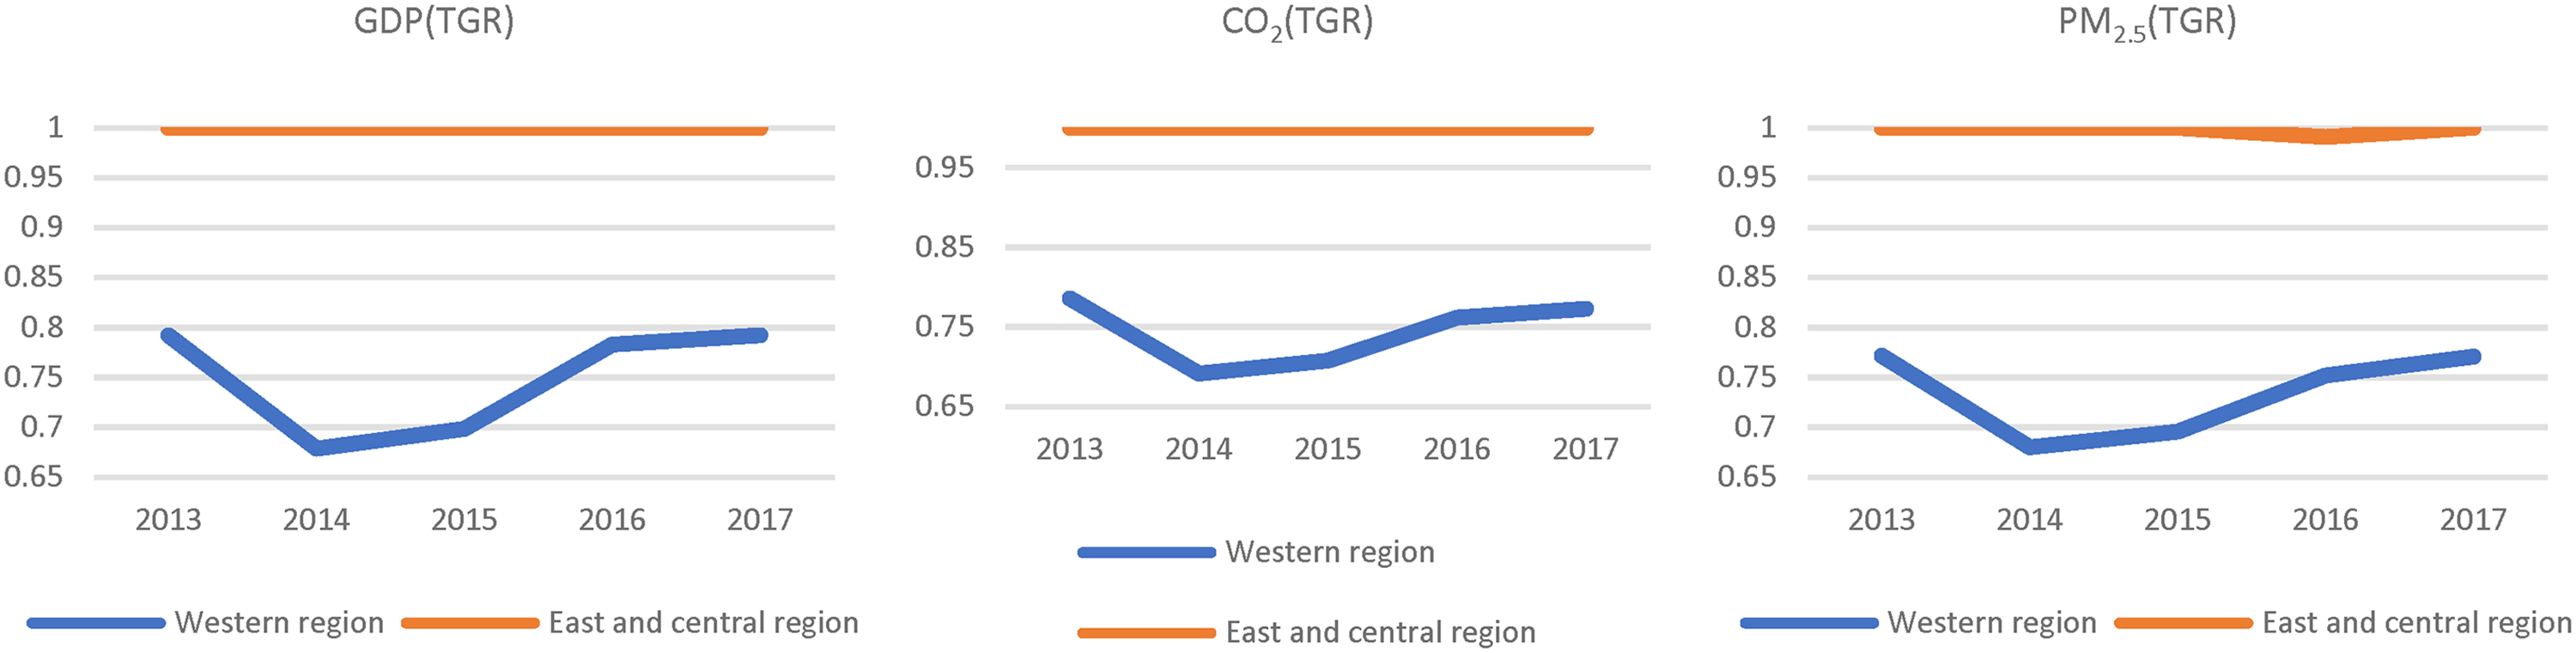
TGR efficiencies of GDP, CO2, and PM2.5 in 28 provinces of China, differentiated by geographic location.
Test the significance of exogenous variables
This study uses the Wilcoxon test to analyze the relationship between high and low temperature days and total efficiency and meta efficiency. The hypotheses are as follows.
H1: High and low temperatures have a significantly positive impact on the overall efficiency of the eastern and central regions. H2: High and low temperature days have a significantly positive impact on the overall efficiency of the western region. H3: High and low temperatures have a significantly positive impact on the meta efficiency of the eastern and central regions. H4: High and low temperatures have a significantly positive impact on the meta efficiency of the western region.
According to Table 5, with the exception of 2014, high and low temperature days have a significant impact on the total efficiency and meta efficiency of the eastern, central, and western regions. The total efficiencies of the high and low temperature days in the remaining four years to the eastern and central regions and the western regions are tested, and the results are all less than 0.05. Thus, hypotheses H1 and H2 are supported.
Wilcoxon test results.
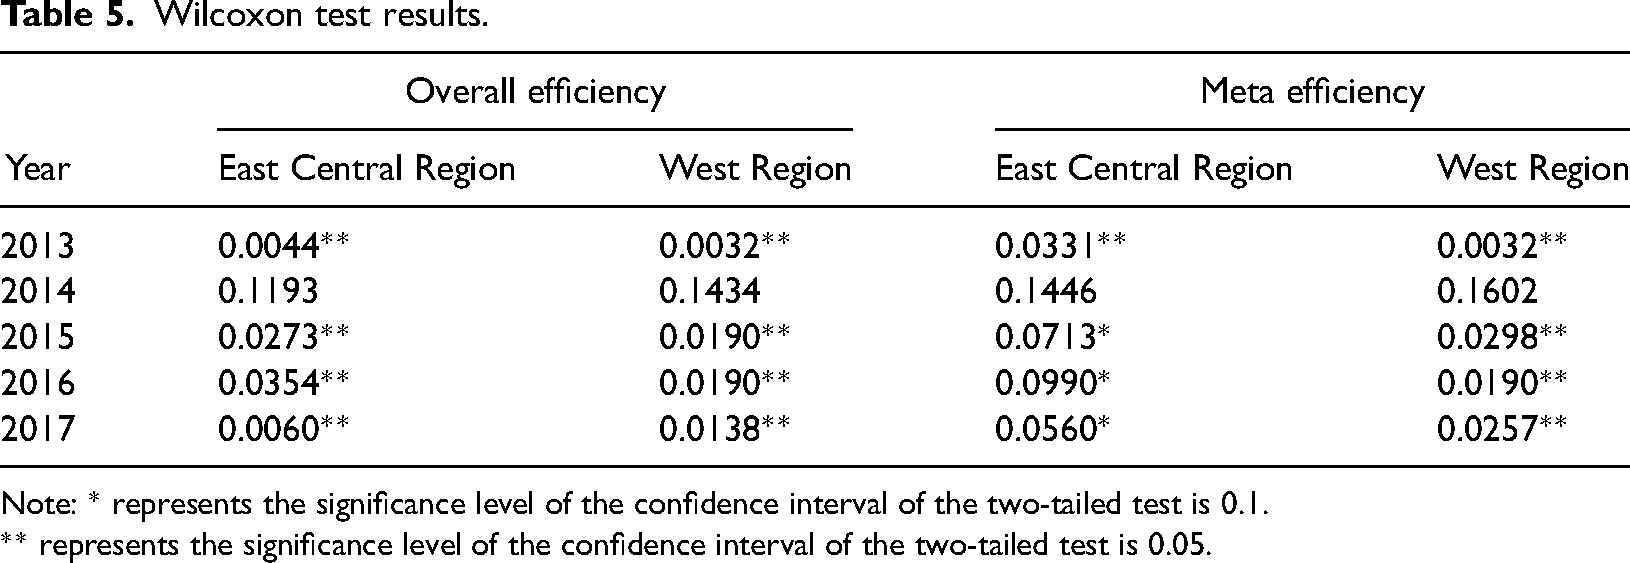
Note: * represents the significance level of the confidence interval of the two-tailed test is 0.1.
** represents the significance level of the confidence interval of the two-tailed test is 0.05.
The test results of the high and low temperature days in the remaining four years on the meta efficiency of the western region are all less than 0.05. Thus, H4 is confirmed. The meta efficiency of the eastern and central regions is less than 0.05 in 2013 and less than 0.1 from 2015 to 2017. Thus, H3 is also confirmed.
The reason why there was no significant impact in 2014 is that 2014 was the lowest in the number of days of high and low temperature during the 5-year period in all three regions. The number of high and low temperature days in the eastern and central regions of 2014 was 129 days, or far below the 5-year average of 153 days. In 2014, the number of high and low temperature days in the western region of 120 days was also far below the 5-year average of 143 days. Therefore, using the results of the Wilcoxon test, the high and low temperature days in 2014 have no significant impact on the total efficiency and meta efficiency of the eastern, central, and western regions.
Conclusions and policy recommendations
China is the world's largest electricity consuming country. This study thus analyzes the impact of climate change on electricity consumption, air pollution, and income efficiency in 28 provinces in China. The conclusions are as follows.
Conclusion
First, in the west region, only Qinghai's GDP, CO2, PM2.5, and electricity consumption have TGR efficiency values of 1 in the 5 years. The other 9 provinces all have technology gaps. For PM2.5, Ningxia's TGR efficiency values in 2013, 2016, and 2017 were all 1, but only 0.49 and 0.56 in the remaining two years, showing a huge technological gap. In terms of electricity consumption, Ningxia's TGR efficiency value was 1 in 2013, but it was only 0.49 in 2014 and 0.59 in 2015, showing a huge technological gap. Ningxia has excellent technical capabilities in both PM2.5 and electricity consumption, but technical management needs to be improved.
Overall total efficiency is less than 0.6 in Guizhou, Yunnan, and Gansu. The meta and total efficiencies of TGR are less than 0.6 in the west region. The 5-year GDP and CO2 TGR efficiency values of the 18 cities in the east and central regions are all 1. This represents that the economic situation and development level of these two regions are very good, and the CO2 is properly controlled. It also shows the necessity of reviewing the policy of transmitting electricity from west to east.
Second, according to statistics, the number of high and low temperature days continues to deteriorate in eastern and central China, but extreme climate in west China presents a trend of ups and downs. Therefore, the impact of the greenhouse effect varies from region to region. However, the empirical results also confirm that the abnormal temperature, meta-efficiency, and TGR efficiency of individual variables such as GDP, CO2, and PM2.5 do not exhibit the same trend performance. The climate crisis has no boundaries. Therefore, all provinces in China need to cooperate in order to play better roles.
Third, China's electricity consumption is consistent with the TGR efficiency of CO2 and is higher than PM2.5. It is obvious that the efficiency of PM2.5 needs to be improved. The TGR efficiency values of GDP, CO2, and PM2.5 in the western region in the past 5 years are all lower than 0.8, and the technology gap is greater than that of the eastern and central regions. The TGR efficiency of GDP is greater than that for electricity consumption, CO2, and PM2.5. Therefore, it appears that China is still pursuing economic growth. This conclusion is consistent with previous research findings, and so China should strengthen its policy efforts to address and pay attention to environmental sustainability issues.
Fourth, if the exogenous variables are not included, then the total efficiency of TGR in the western region will have an error. Among them, Gansu, Shaanxi, and Guizhou are overestimated, and the remaining 7 provinces are all underestimated. If exogenous variables are not included, then only Tianjin, Beijing, Jiangsu, Hunan, and Guangdong have no errors in the total efficiency of TGR in the eastern and central regions, and the remaining 13 provinces are all underestimated. Therefore, it is necessary to introduce climate influence factors. Although China's Policies and Actions on Climate Change was published on October 27, 2021, most past studies have regarded global warming as an endogenous variable. The high and low temperatures that have occurred are irreversible facts. Therefore, electricity consumption should be changed to an external factor. This paper is the first to incorporate exogenous variables into the efficiency impact analysis of power and environment, so as to be closer to the real-world decision-making process.
Policy recommendation
Overall, there are serious problems with the PM2.5 control policy, especially as the western region has great room for improvement. It is necessary for the China government to comprehensively review the power regulatory policy. We offer the following policy recommendations.
First, we know that China's long-term policy of transmitting electricity from the west to the east has caused inter-provincial conflicts. As a result, Yunnan and other regions often rely on the advantages of low-cost hydropower to introduce high-energy-consuming industries, affecting the supply of local electricity. Therefore, China must overcome the problem of contradictory power policy. The government must introduce the concept of sustainable development to ensure cross-regional transactions between east and west and avoid the problem of excessively rising electricity prices.
Second, China should establish a cross-province and cross-regional joint control mechanism, strengthen cross-border cooperation, and play a more critical role in air pollution control in the world. The climate crisis has no boundaries and all provinces in China must collectively fight against it. The TGR efficiency of PM2.5 is low. It is obvious that China has achieved economic results by participating in globalization in the past few decades, but it has also encountered air pollution problems. In particular, PM2.5 is not only affected by human behavior, but also by season and region. Local governments in China should play more critical roles in air pollution control. The central government must continue to provide funding and administrative resources to establish cross-province and cross-regional cooperation. Transnational cooperation can solve the problem of air pollution in China and reduce the transnational transmission caused by it. Especially during the time when the Trump administration's emphasis on “America first” caused a decline in the multinational structure, China could take the opportunity and lead in multilateral cooperation on major global issues. Currently, under the Biden administration the United States still perceives China as a threat to its long-term strategy. China can find more room for cooperation with the United States and other countries on climate change issues.
Finally, China can initiate a policy that guides people's environmental protection awareness and can introduce climate information to overcome the error in efficiency. China still prioritizes the pursuit of economic growth while ignoring environmental responsibilities. Seeing that 2020 was the hottest year in history, China must re-deploy power and resources and strictly regulate the carbon emission benchmarks of various provinces. It must also rely on more education and media to change the culture and psychology of the Chinese people in a fundamental way; otherwise environmental protection actions will ultimately fail.
Footnotes
Declaration of conflicting interests
The author(s) declared no potential conflicts of interest with respect to the research, authorship, and/or publication of this article.
Funding
The author(s) received no financial support for the research, authorship, and/or publication of this article.