
Abstract
During Covid-19 pandemic world economy experienced negative growth rate, therefore energy consumption and consequently emission pollution decreased. According to Environmental Kuznets Curve, it is expected that energy consumption and emission pollution increase in response to Covid-19 economic recovery, even higher than its pre-pandemic level. The goal of this paper is to study the environmental risk of Covid-19 economic recovery. We use an Environmentally-Augmented Global Vector Autoregressive Model (E-GVAR) to trace dynamic effects of Covid-19 economic recovery on pollution emission. Using generalized impulse response functions (GIRFs), we investigated the effect of positive economic shocks in real per capita income in China and USA economies on total
Introduction
Covid-19 pandemic has affected world economy negatively and caused slowdown in economic activities. The transportation sector is most affected by the COVID-19 due to the large-scale restrictions on mobility and aviation.1,2 Decrease in transportation demand and energy consumption resulted in emission pollution production. Iqbal et al.
3
investigated how the COVID-19 pandemic reduces
Emission pollution trend has been increasing during the last two decades except for 2009 in response to 2007–2008 financial crisis and recession. Since the start of the pandemic, because of the decrease in energy consumption, emission production was reversed. Total
Meadows et al. 4 argue that economic growth has negative impact on environment while Dasgupta and Heal 5 provides evidence on complementary relationship between economic growth and environment. Grossman and Krueger 6 show that there is a non-linear relationship between economic growth and environmental degeneration can be presented in a bell-shaped curve, known as Environmental Kuznets Curve (EKC). It is asserted that at the beginning of economic growth, environmental degeneration rises and declines after it reaches its maximum level. Therefore, we expect that at the beginning of the Covid-19 economic recovery, the world economy will experience a sharp increase in environmental pollution emission. Because of the high degree of integration between world economies 1 , any change in leading economies-with high share in the world GDP would be immediately transmitted to the rest of the world. Investigations show that during the last decades growth in large economies such as China has had significant effect on world energy market and growth in China pushed not only the domestic energy consumption but also pushed up energy consumption in resource-based economies. Therefore, it is expected that economic recovery in a large country would be spilled over into other economies.
Since the Covid-19 began, many studies have been conducted to investigate macroeconomic effects of the crisis. McKibbin and Fernando
7
applied a DSGE/CGE model to explore the global macroeconomic effects of the pandemic under different scenarios. Their results highlighted the importance of spillover effect. Bonadio et al.,
8
using data for 64 economies investigated the effect of Covid-19 crisis on the world supply chains. Baqaee and Farhi
9
used a multi-sector model with input-output linkages, nominal wage rigidities and bounded policy rate to study non-linearities in response to Covid-19 pandemic. The model accommodated to the USA data and the results show how negative effects of crisis could be magnified through nonlinearities. Milani
10
applied a GVAR model and demonstrated how important are linkages to amplify the negative effects of crisis on unemployment. The aim of this paper is to investigate the effect of Covid-19 economic recovery on environmental pollution assuming that with vaccination and other measures countries gradually shift to the recovery process. We apply an Environmentally-Augmented Global Vector Autoregressive Model (E-GVARX) to study the dynamic effects of positive economic shocks in large economies, USA, and China, on total
Literature review
Energy is considered as a factor of production and is essential for the world economy to function, thus economic growth is highly correlated to energy consumption.11,12 The relation between economic growth and energy consumption is well documented.13–16 U-shaped relation between economic growth and environmental degradation, well-known as EKC first examined by Grossman and Krueger.
6
The concept, explains that at the initial stage of the economic growth, environment will be degraded and improvement will happen over time. According to the Environmental Kuznets Curve, there is a non-linear relationship between income level and environmental pollution emission. In the early stages of economic growth, emission pollution goes up and because of technological progress in energy appliances, the level of pollution produced at each level of income decreases with increase in per capita income. Therefore the pollution per capita decreases over time after passing its maximum level. The implication of this theorem is that, after any crisis, during the recovery process and with a positive shock in per capita income, the level of pollution will jump to a level higher than its pre-crisis level. Meanwhile, any positive shock in leading economies like China and the the USA could result in increase in energy consumption and
Since the beginning of the pandemic, a series of studies have examined different aspects of this crisis. Studies show that this pandemic has affected economies in different ways including major decline in value chain, production, sales and employment rates.
17
A few studies emphasize on the positive effects of Covid-19 on environment.18–20 These studies highlighted that Covid-19 has decreased the level of
Investigations also provide evidence on reduction of
Data and methodology
To achieve the objective of this study we used an environmentally augmented version of the GVAR model of Dées, di Mauro, Pesaran, and Smith 8 named DdPS. 28 GVAR is a global modeling framework for analyzing the international macroeconomic transition of shocks considering links between different economies, originally proposed by Pesaran et al. 29 and developed by Dees et al. 28 as a tool for credit risk analysis and applied in numerous other studies. It is particularly suitable for analyzing the transmission of shocks from one market, country, or region to other markets and economies. GVAR has a number of interesting attributes that makes it an ideal method for our analysis; (1) the GVAR is able to capture complex national an international interactions and inter-dependencies; (2) it has theoretical consistency for long-run relationships and data consistency in short-run; (3) it handles dimensionality by assuming that most foreign variables are weakly exogenous; (4) it allows for country models to be estimated separately and aggregated later; (5) it can be used for large or small number of countries or different groups of countries” (p.13). 30
GVAR applications in researches include bank stress testing; analysis of China's growing importance for the rest of world economy; 31 international macroeconomic transmission of weather shocks; consequent impacts of oil price shocks 32 as a result of oil supply33,34 and demand driven shocks 35 as well as forecasting.36,37 Chudik et al. 38 developed a threshold augmented dynamic multi country model to analyze macroeconomic impacts of Covid-19. Chudik et al. 39 applied a threshold-augmented Global VAR model to quantify the macroeconomic effects of countries’ discretionary fiscal actions in response to the Covid-19 pandemic and its fallout.
Global energy consumption and emission production
Figure 1 illustrates world energy consumption over the period of 1990–2020.Global energy consumption growth was 2% on average over the period of 2000–2018. In 2019, and alongside to Covid-19 outbreak, it fell to 0.8%. In 2020, global energy consumption decreased by 4%, due to lockdown measures and transport restrictions. Fall in energy consumption growth was not homogeneous between economies. Although it fell in most countries, China, the largest energy consumer which consumed 24% of the global energy in 2020, and rapidly recovered from the Covid-19 crisis had a 2.2% growth in energy consumption, but the momentum was lower than annual average over the 2008–2018 period and +3.4% in 2019. 40
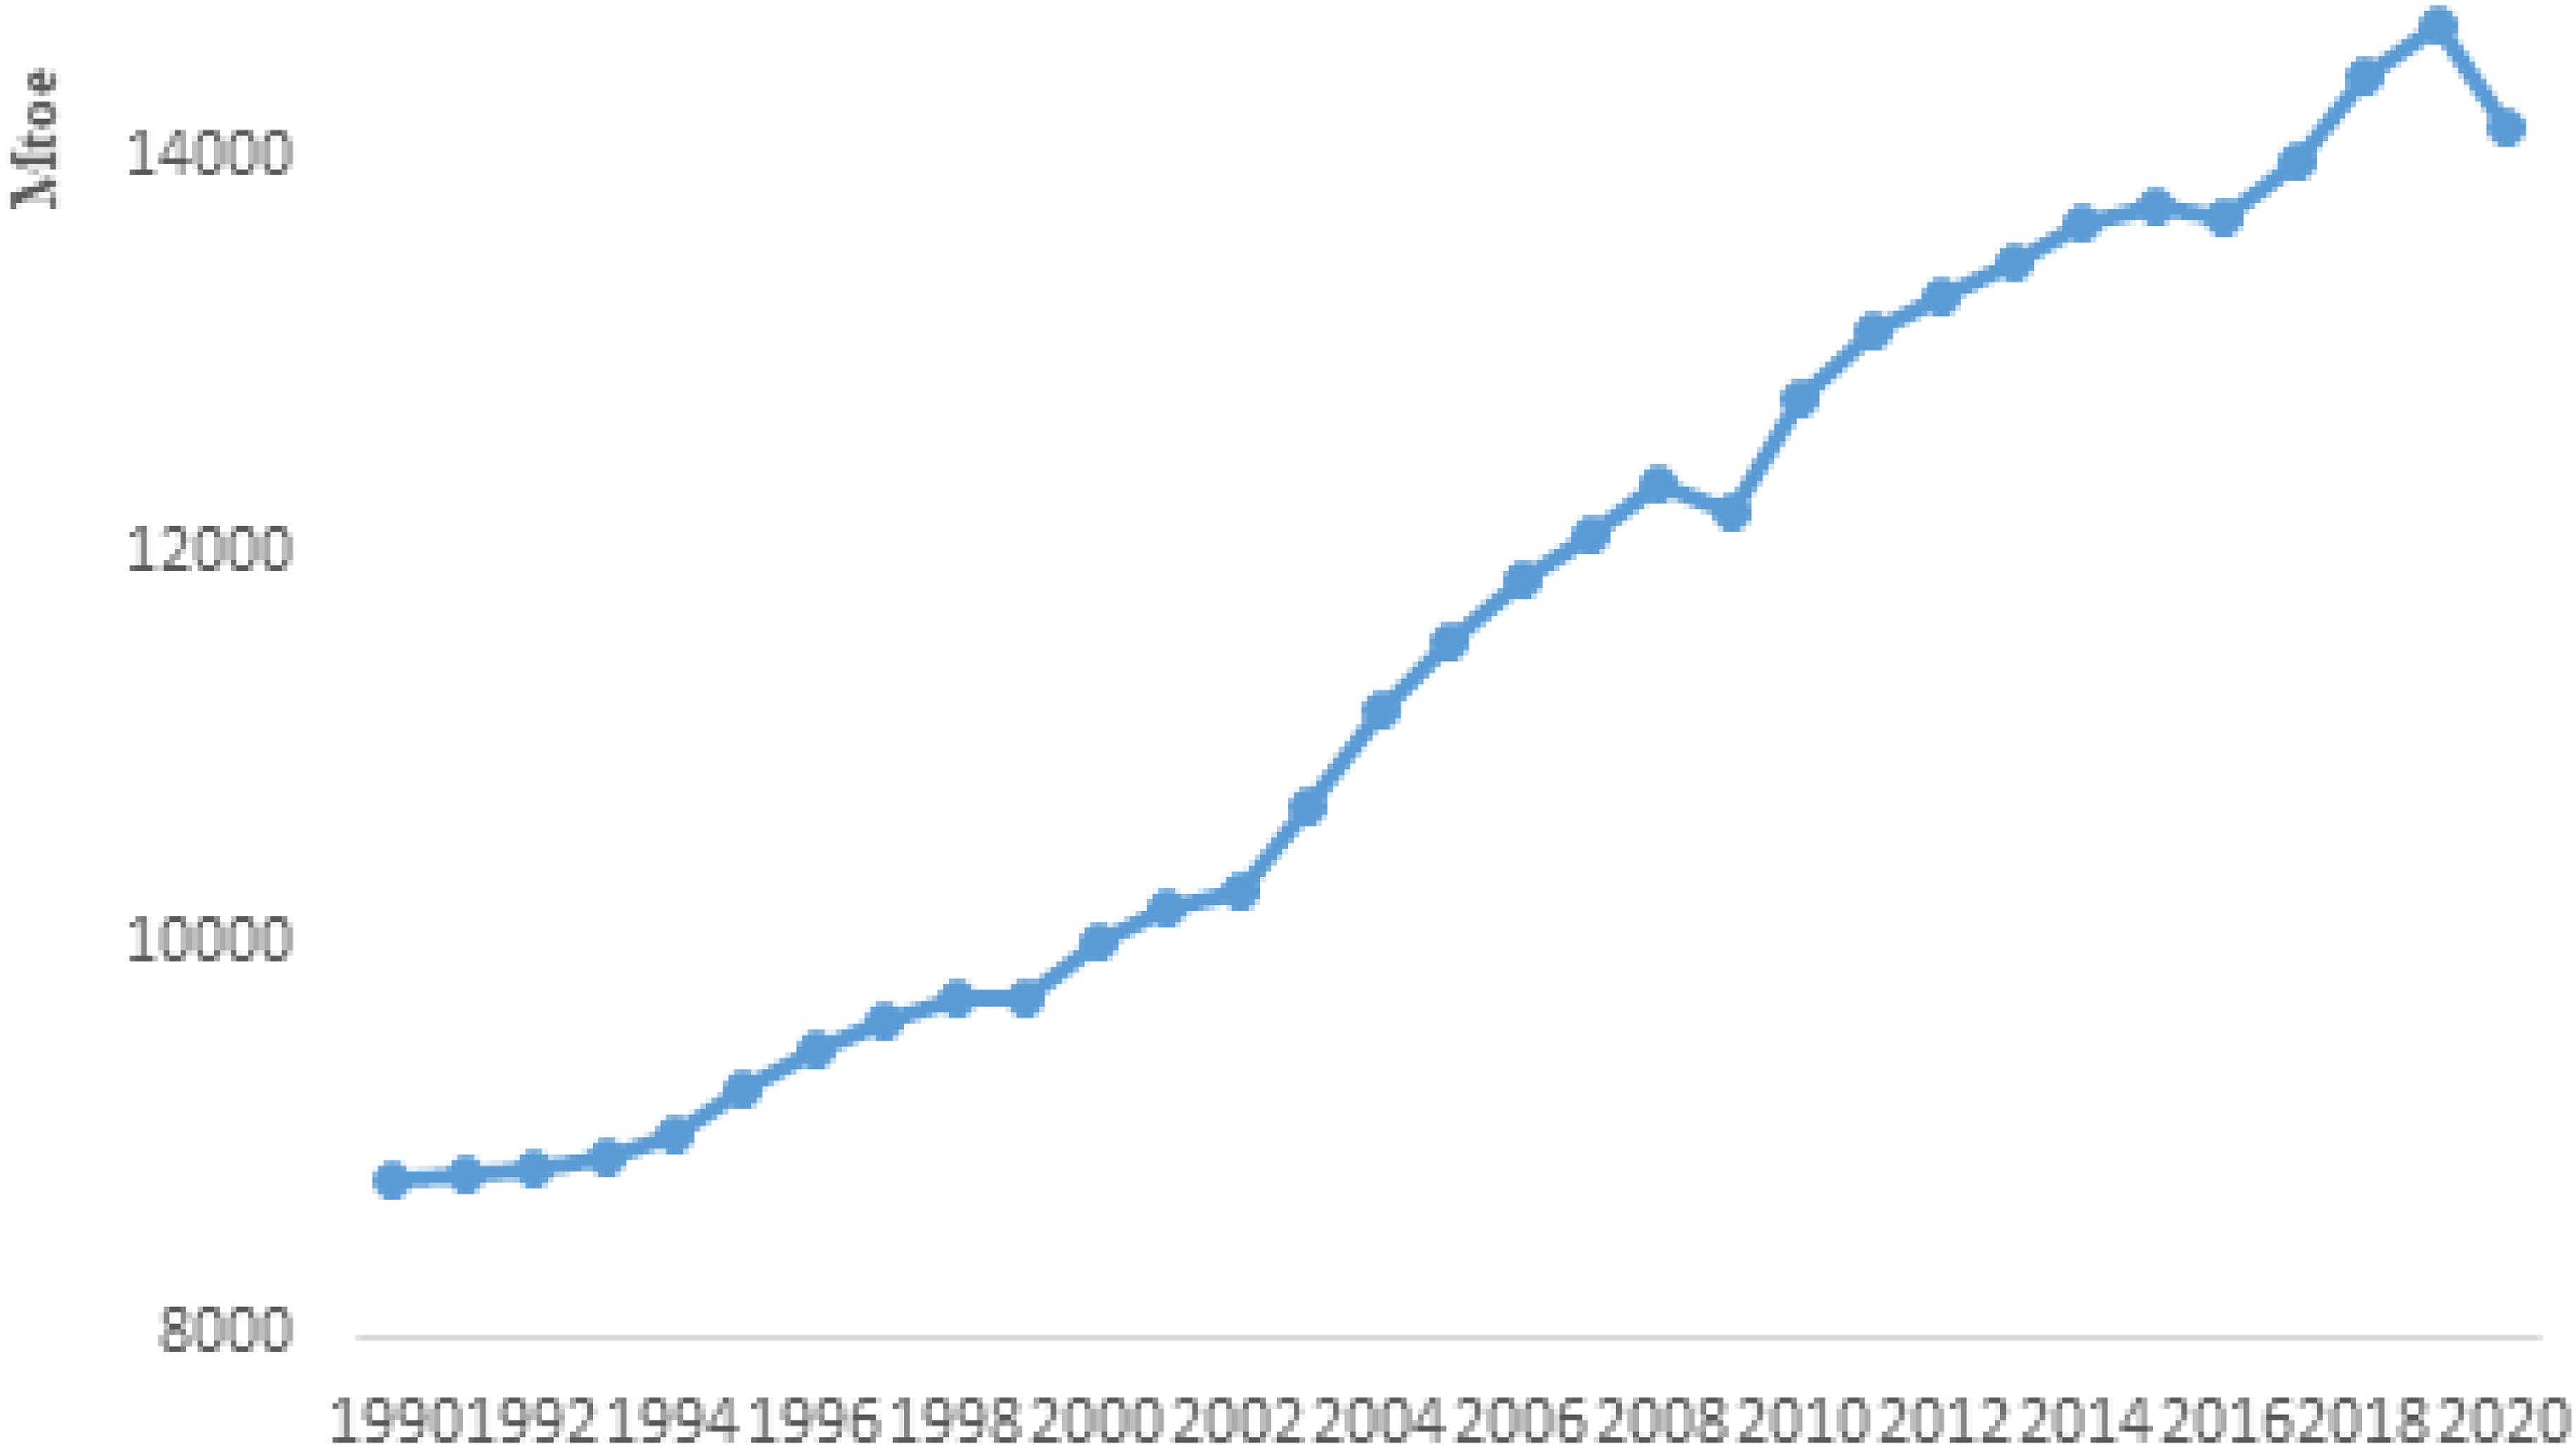
World energy consumption 1990–2020.
In the USA, growth of energy consumption was 0.5% on average over the period of 2000–2018, which dropped to −7.4% in 2020, due to Covid-19 pandemic. North America's response to the pandemic in terms of energy consumption was the same as the USA. Advanced economies including EU members, Japan, and Canada experienced a 7% decrease in energy consumption. Emerging economies including India, South Korea, and in less developed economies namely Saudi Arabia experienced 1.3% decrease in total energy consumption. The growth rate of energy consumption has been around −2% in Australia and Brazil during the pandemic period. In the Middle East and North Africa (MENA), energy consumption also contracted by 1.2%, while it has increased by 4.2% per annum over the 2000–2018 period. The Latin America's rate of energy consumption over 2019–2020 was −6.9% much lower than its annual average growth during the 2000–2018 period. 40
Figure 2 shows total
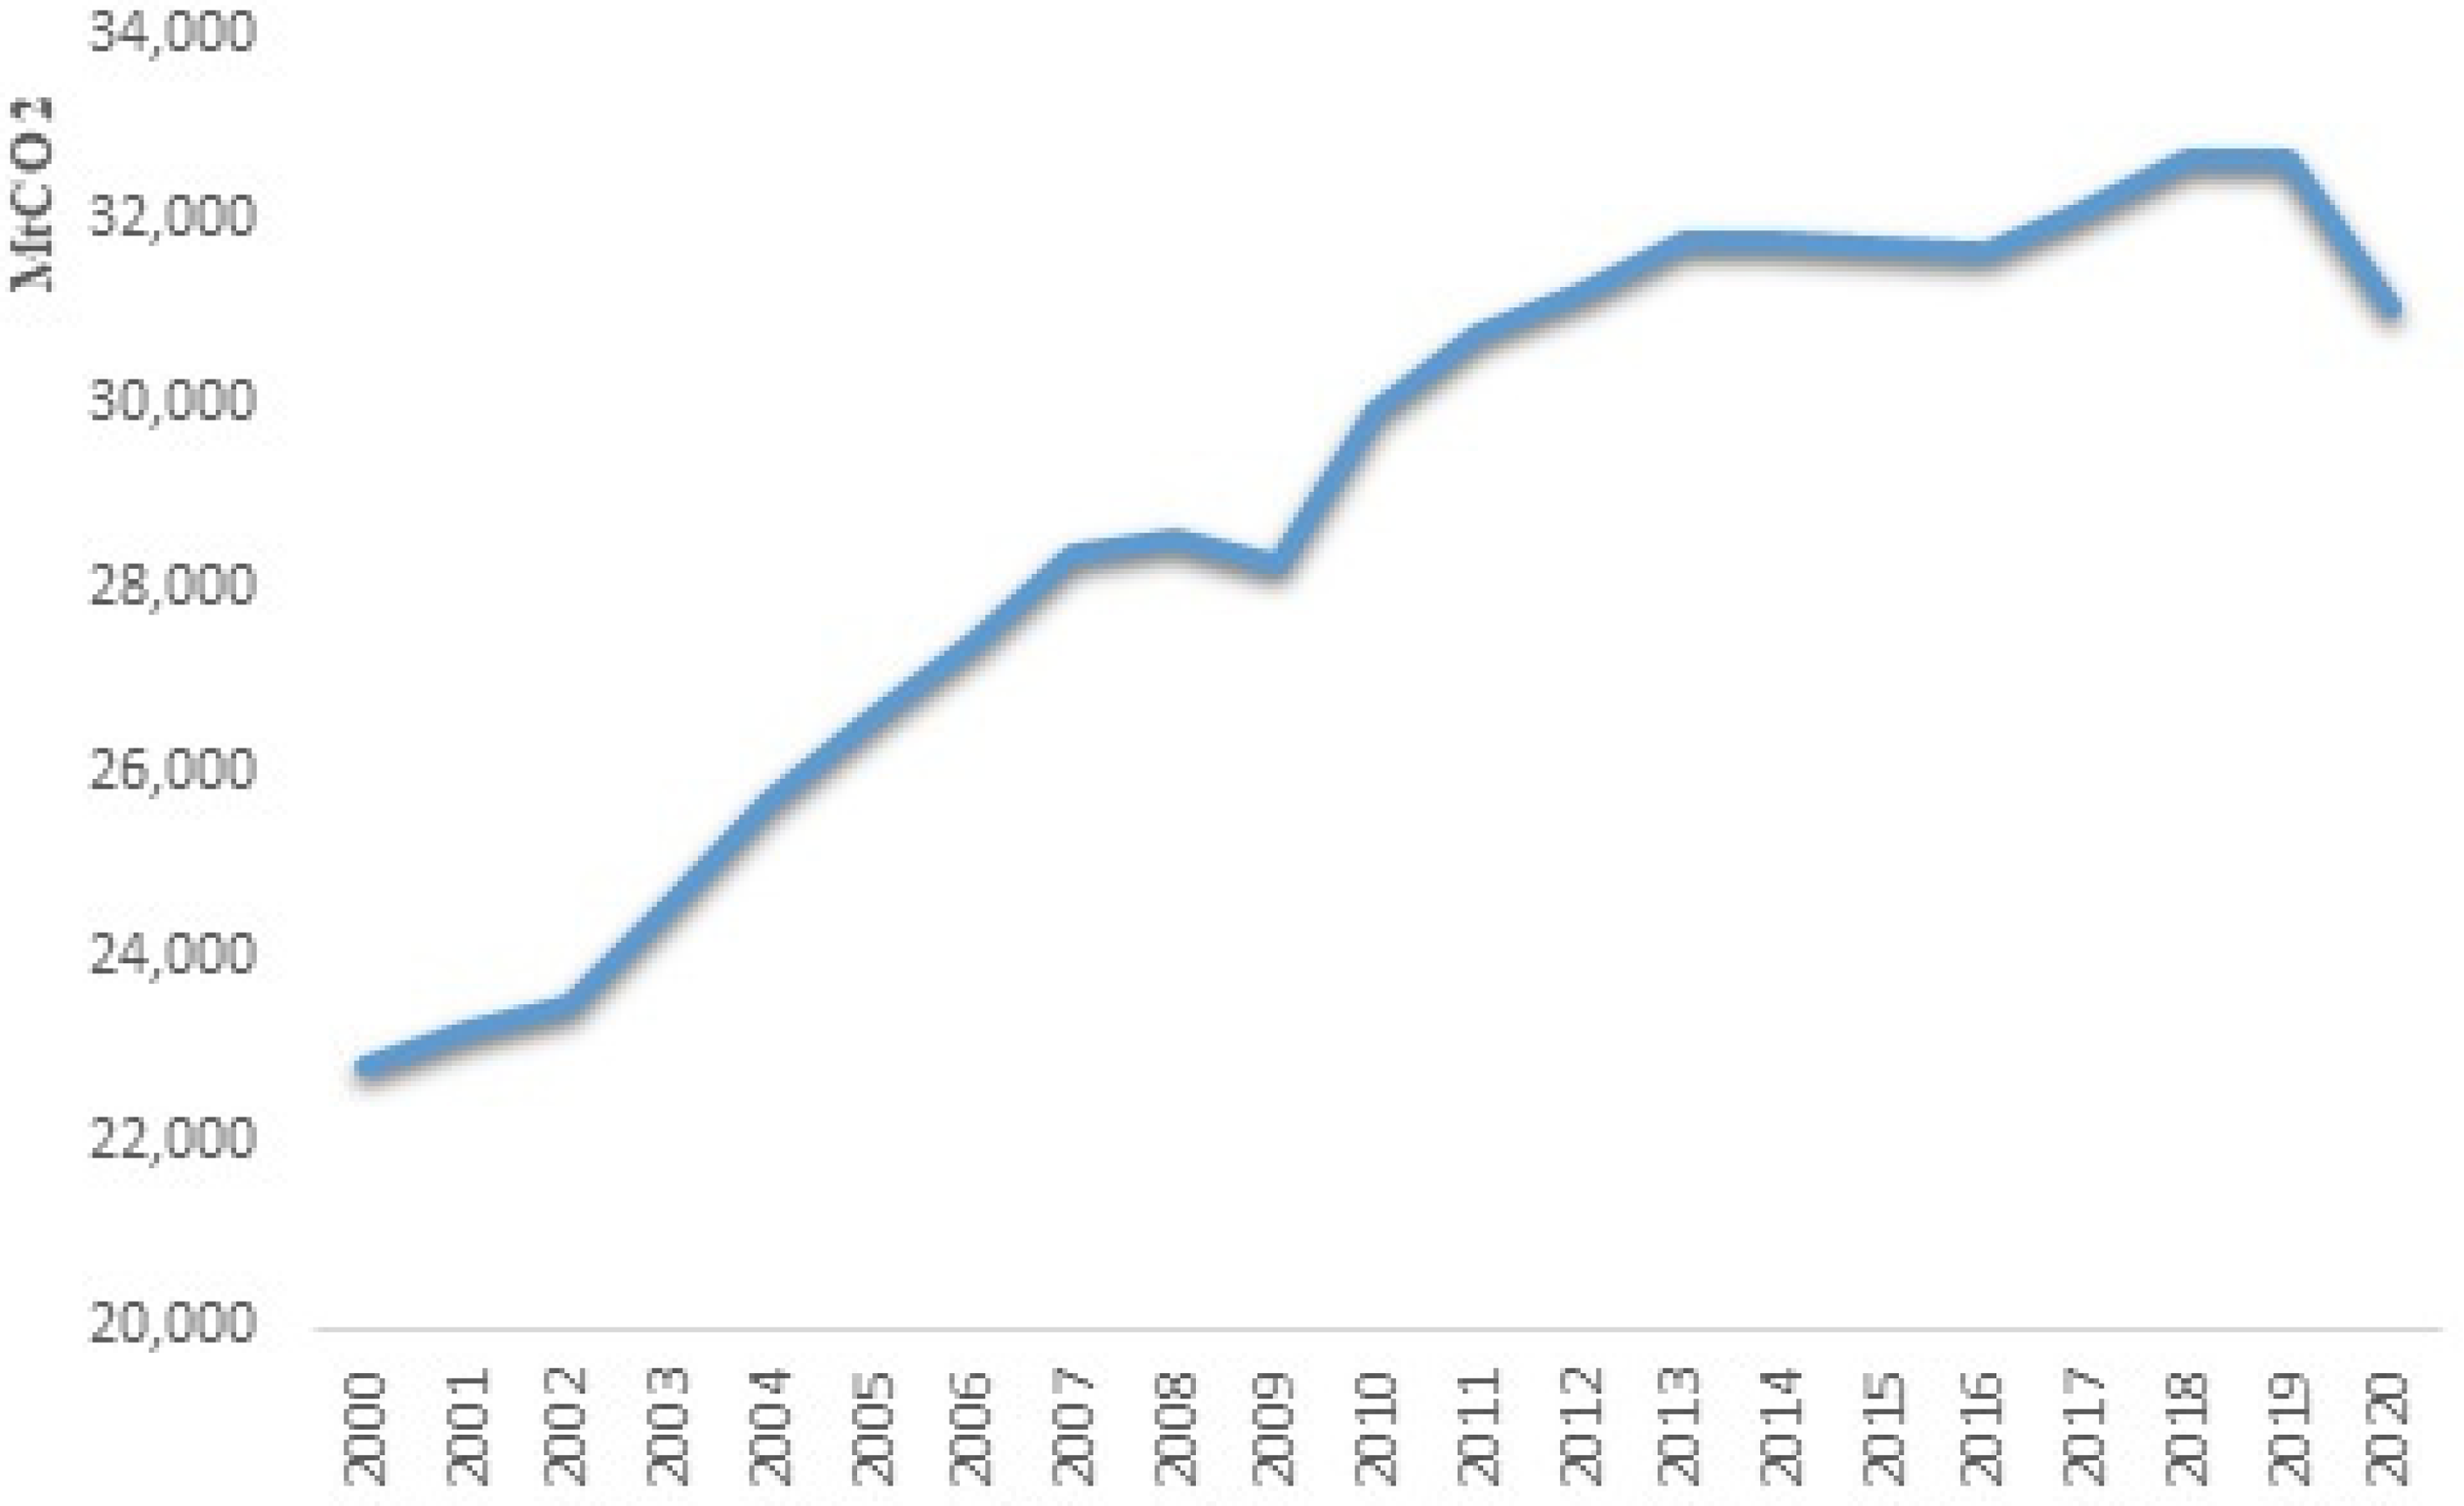
Total
The country-specific VARX* models
The GVAR model applied in this research is an environmentally-augmented version of the DdPS
28
model, which integrates environmental energy related variables into the basic model. The model accepts four domestic variables of DdPS
28
and three global variables. Therefore, our model variables include total per capita
To adapt the GVAR model for the analysis of the environmental risk of the Covid-19 economic recovery, and transition of economic growth in large economies; China and the USA on

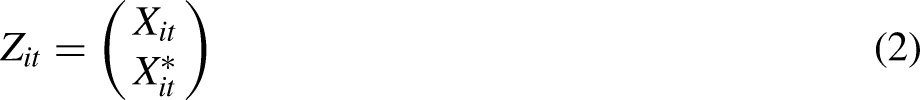
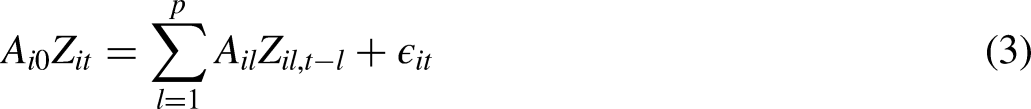

Figure 3 shows schematic framework of N + 1 countries GVAR model which illustrates interactions between countries via a set of variables. Each array shows two-sided effect between each country.
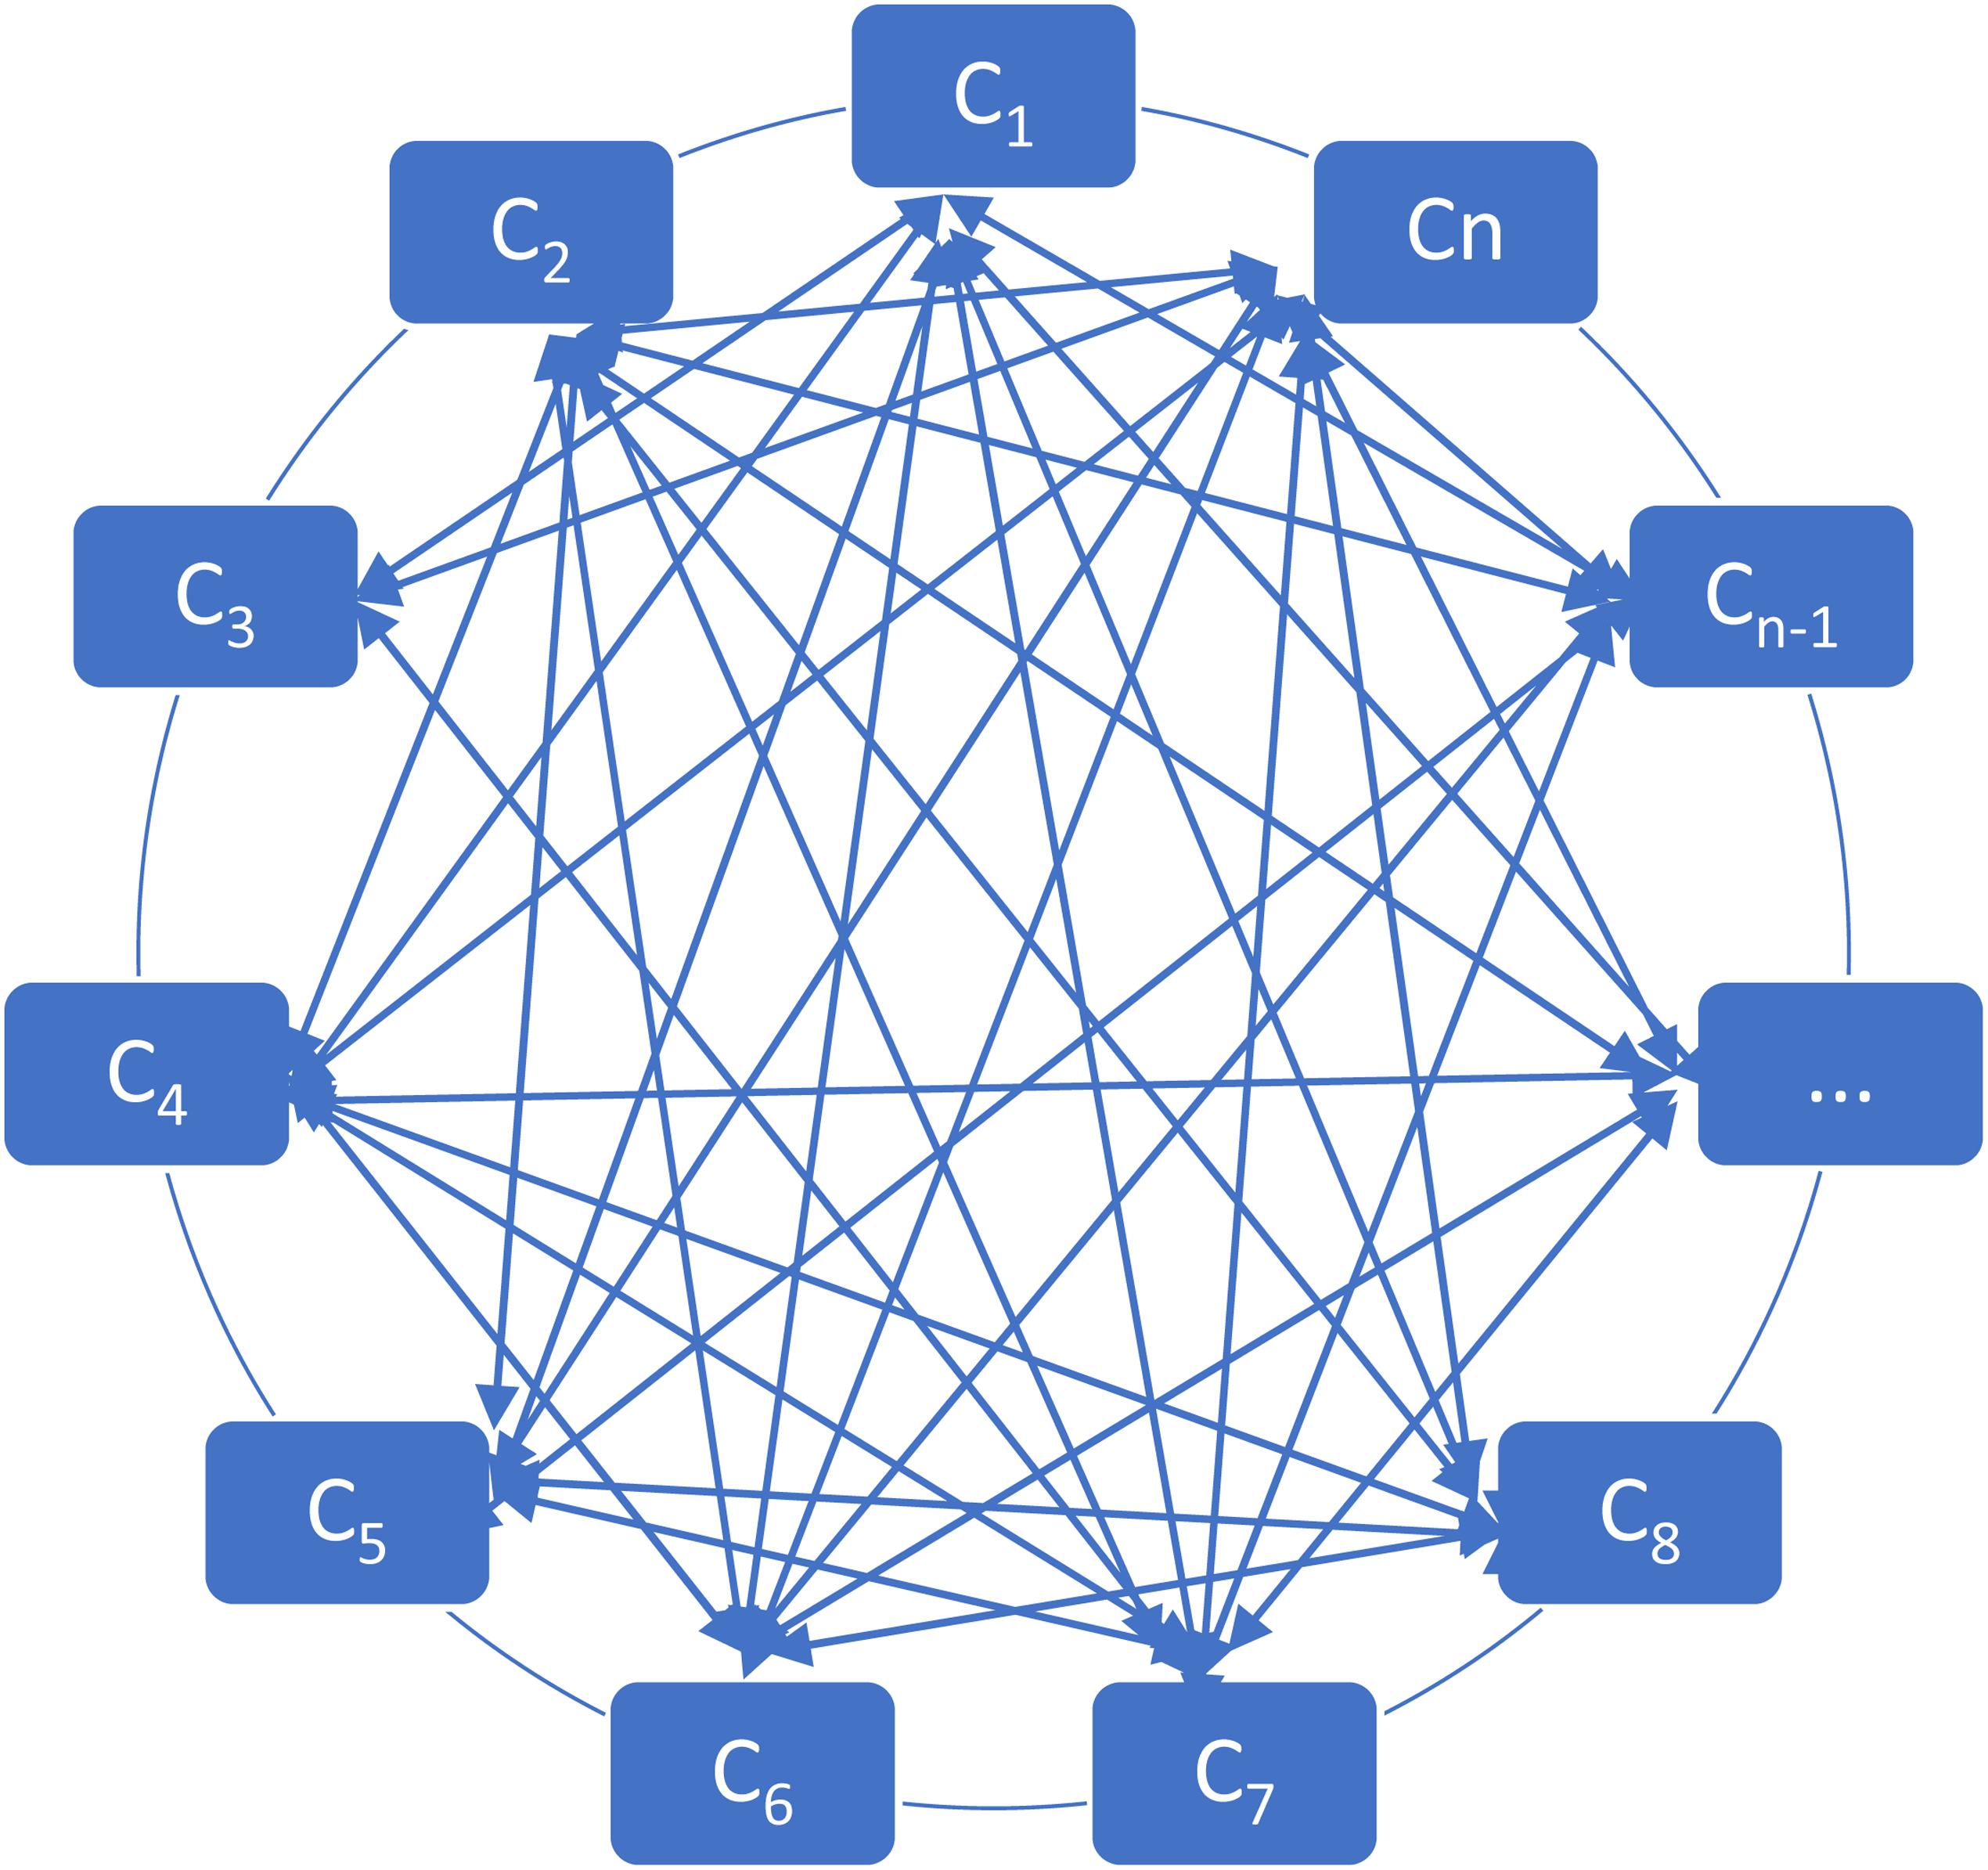
Schematic framework of n + 1 countries GVAR model.
Data
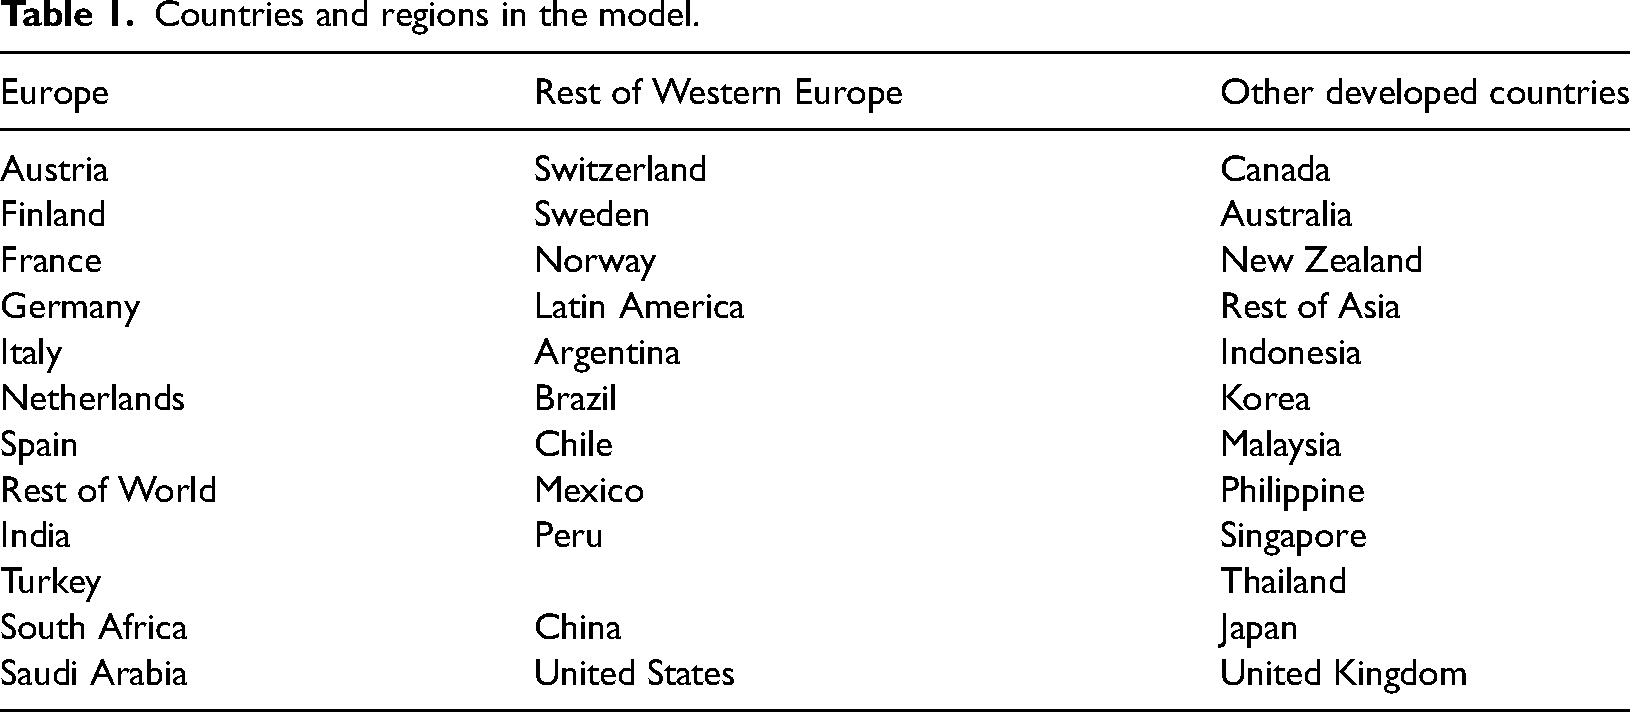
The research uses latest updated version of the Global VAR (GVAR) Quarterly Dataset, for the Ddps,28,48 including quarterly macroeconomic variables for 33 economies over 1979Q2 to 2019Q4. Variables are included in most of the GVAR applications in the literature. These 33 countries cover more than 90 percent of the world GDP. Table 1 shows the countries and regions in the model. In this model large economies including United States, United Kingdom, China, and Japan considered separately. Other countries are categorized into different regions including Europe, Rest of Western Europe, Other Developed Countries, Rest of Asia, Latin America, and Rest of World. Switzerland, Sweden and Norway are not the members of European Union, therefore we put them into a separated European region. India, turkey, South Africa and Saudi Arabia categorized into Rest of World.
Countries and regions in the model.
Database is constructed using data from Haver Analytics, International Monetary Fund's International Financial Statistics (IFS) database and Bloomberg. To make foreign variables of the model, we used weight matrix in updated version of the Global VAR (GVAR) Quarterly Dataset over 2014–2016. Weights are calculated based on bilateral trade between countries. We also extracted total per-capita
Model estimation and scenario analysis
Estimation of a system is not feasible unless for a moderate value of N. Unconstrained estimation of (33) country-specific model includes estimation of a large number of parameters which should not be greater than the number of observations. To solve this problem, and estimate the model feasibly, we assumed model-built fixed weights,
Augmented Dickey- Fuller and Weighted Symmetric Dickey-Fuller unit roots tests introduced by Park and Fuller 51 applies to test for trend and variance stationarity. Evidence provided by Pantula et al., 52 Leybourne et al. 53 and Leybourne et al. 54 show superior performance of the weighted symmetric test statistic compared to the standard ADF test or the GLS-ADF test proposed by Elliot et al. 55 Optimum lags in tests are chosen by AIC and SBC. Test conducted for level, first order and second order differences of model's variables. The results show that model's variables have unit root at level for most of countries, but first difference of all variables are stationary. Therefore, most of variables are I (1). To decide on optimum lags of domestic, foreign and global variables, we used SBC/AIC criteria. Optimum lag for domestic variables differs between country-specific models. Optimum lags for domestic variable of Argentine, China, Indonesia, Korea, Peru, Philippine, South Africa, Saudi Arabia, Sweden, Thailand, Turkey and the USA is 2, while optimum lag of foreign and global variables in all country-specific is 1. We also conducted weak exogeneity test for foreign and global variables at the 5% significance level. Critical values of AIC, SBC and log likelihood are used for selecting the Order of the Weak Exogeneity regressions. The results show that weak exogeneity of all foreign and global variables can not be rejected at 95% confidence interval.
Scenario analysis
Here we run some scenarios regarding the change in the world economy during the recovery from Covid-19 crisis. Any improvement in the world economy could result in energy consumption and pollution production. USA and China stand for more than half of the world GDP and contribute more than 50% of the world GHGs. Backward and forward linkages between these two large economies and spillover of growth in them have significant implication for the world economy, thus in this section we analyzed the effect of one standard error positive shock in per capita real GDP on total
A positive economic shock in China
The research assumes one standard error positive shock in China's per capita GDP. The results show that the economic growth in China affects
IRFs of
The USA economy's responses to positive shock in China is moderate at the beginning of the recovery period and after a while, the total
Our results show that the effect of this shock on the
IRFs of
In Europe, a positive shock in China's real GDP will affect
A positive economic shock in the USA
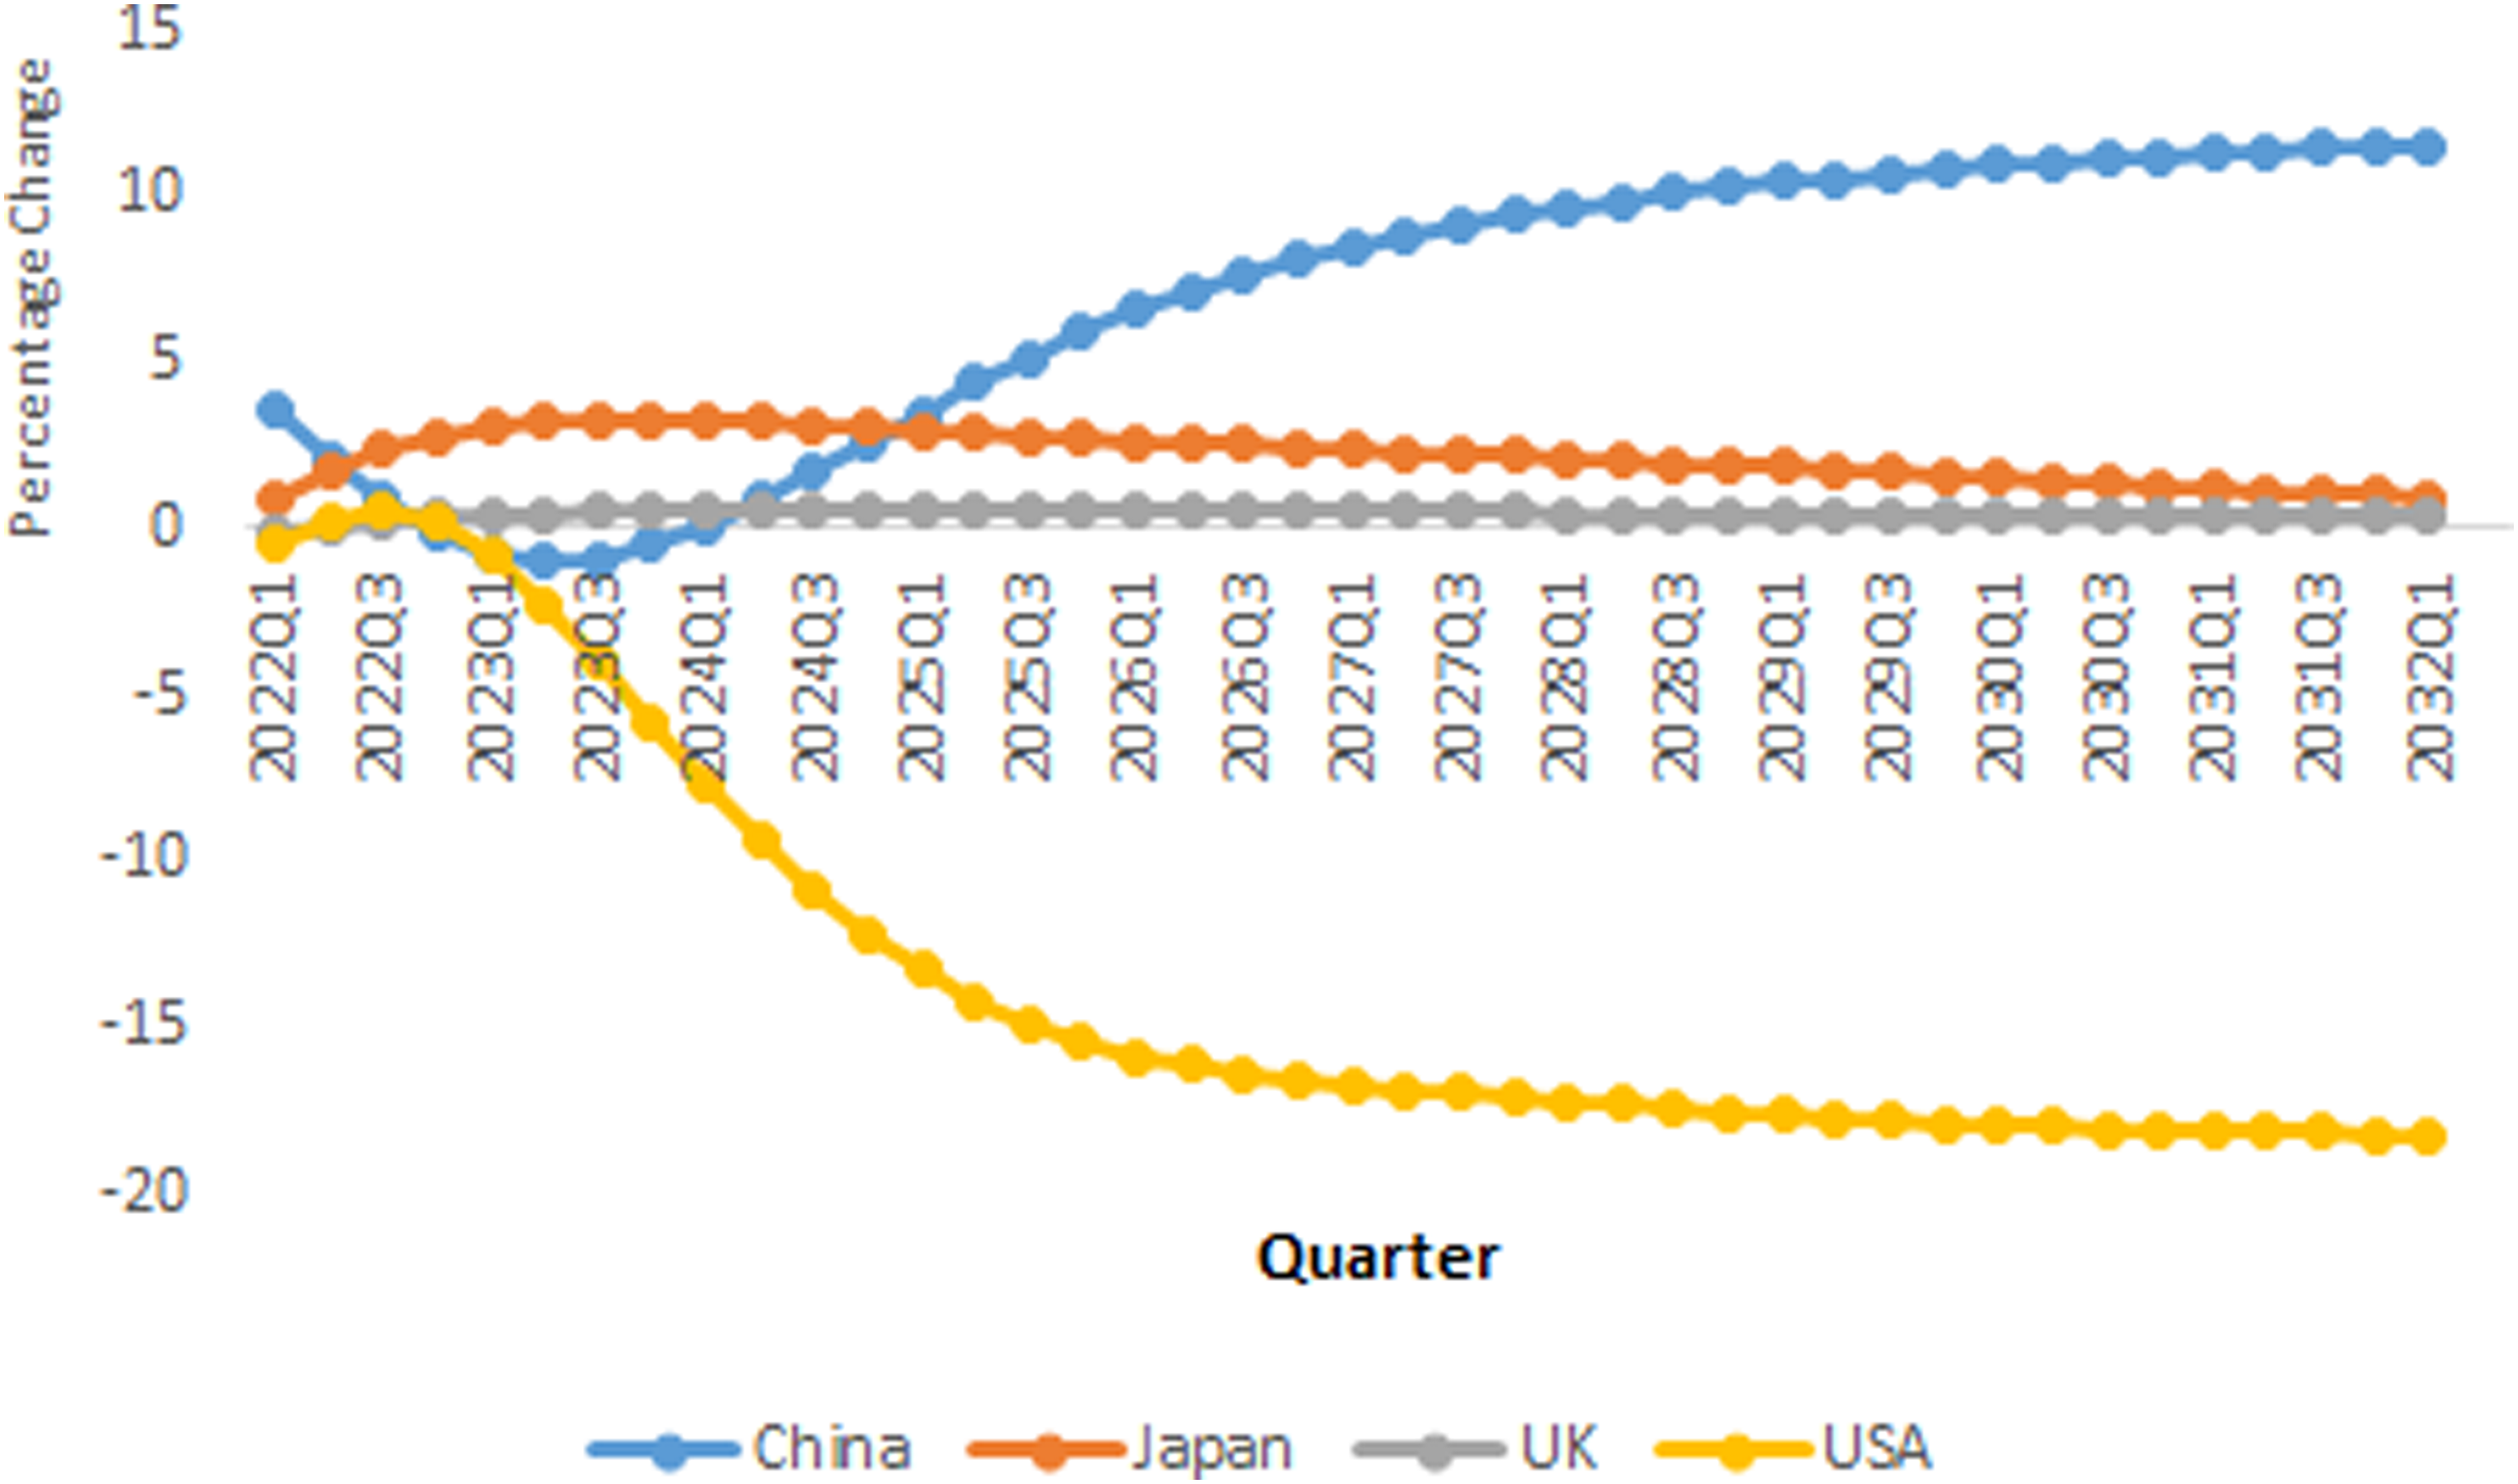
The model assumes one standard error positive shock in the USA per capita real GDP to investigate the environmental risk of recovery induced by the USA. Figure 6 shows GIRFs of emission pollution in USA, UK, Japan, and China in response to one standard error positive economic shock in United states. The results show that this shock has different implication for the global economy with respect to growth shock in China. USA and China's GIRFs of total
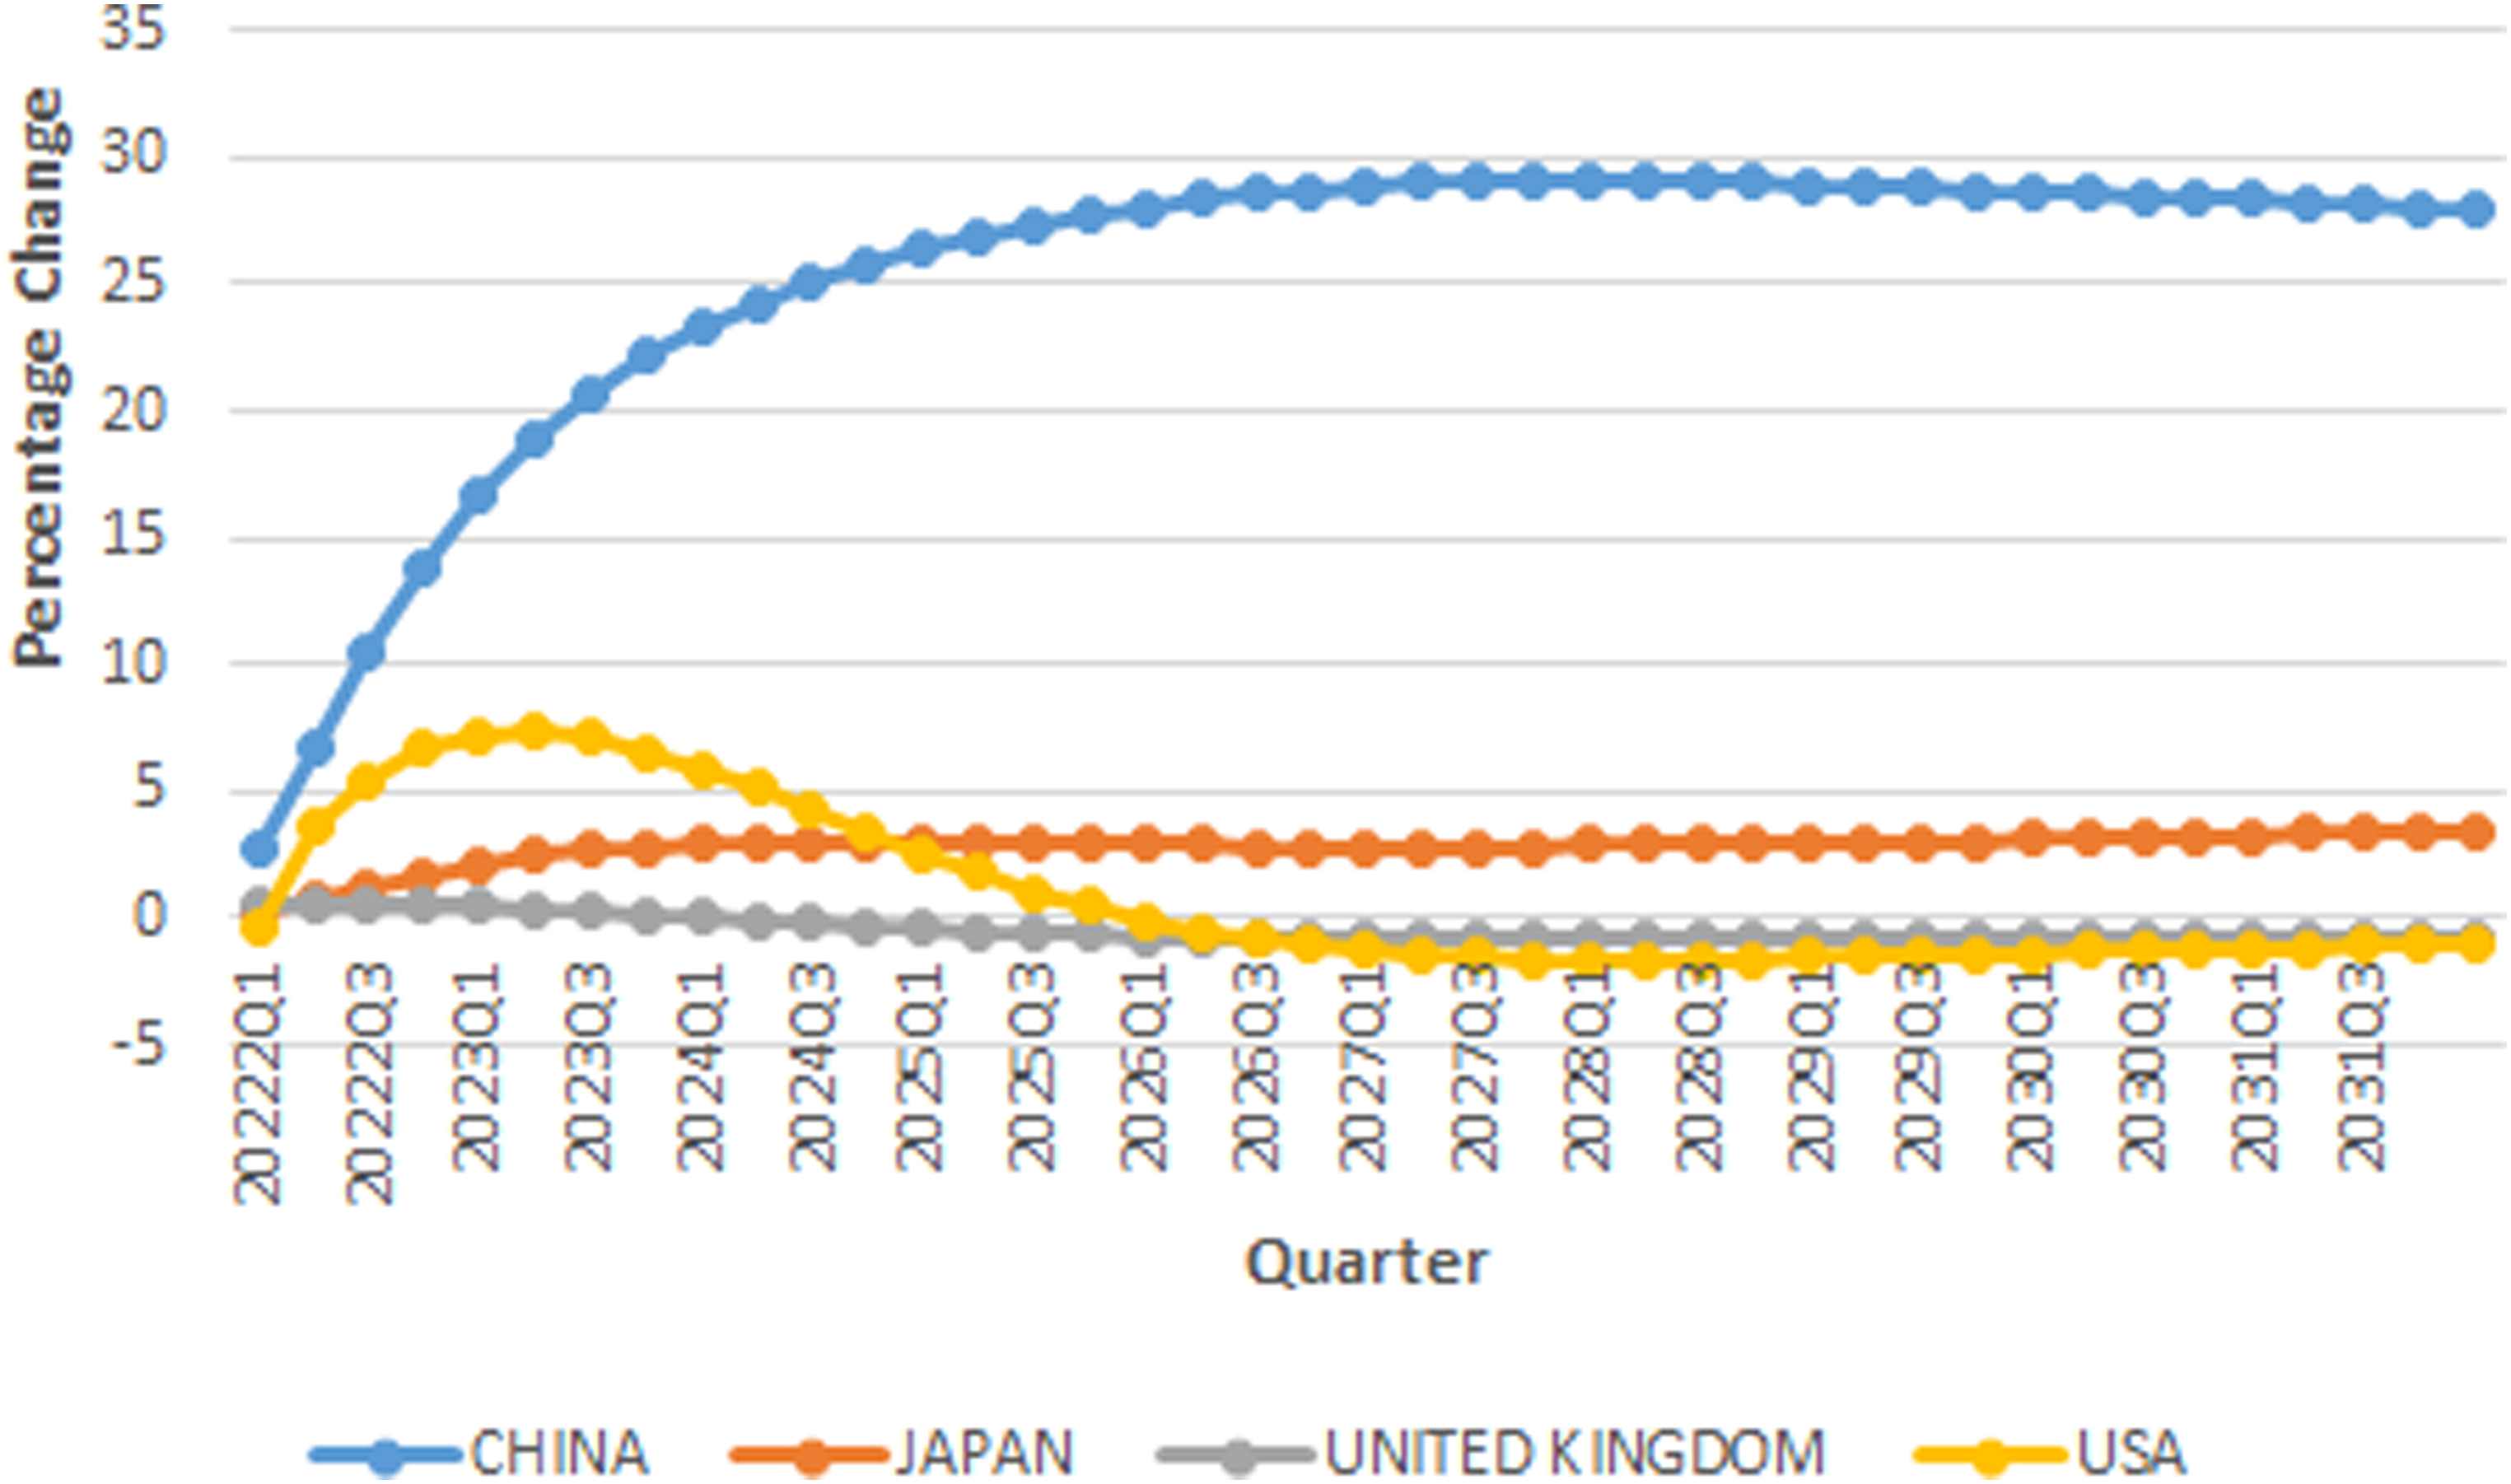
IRFs of
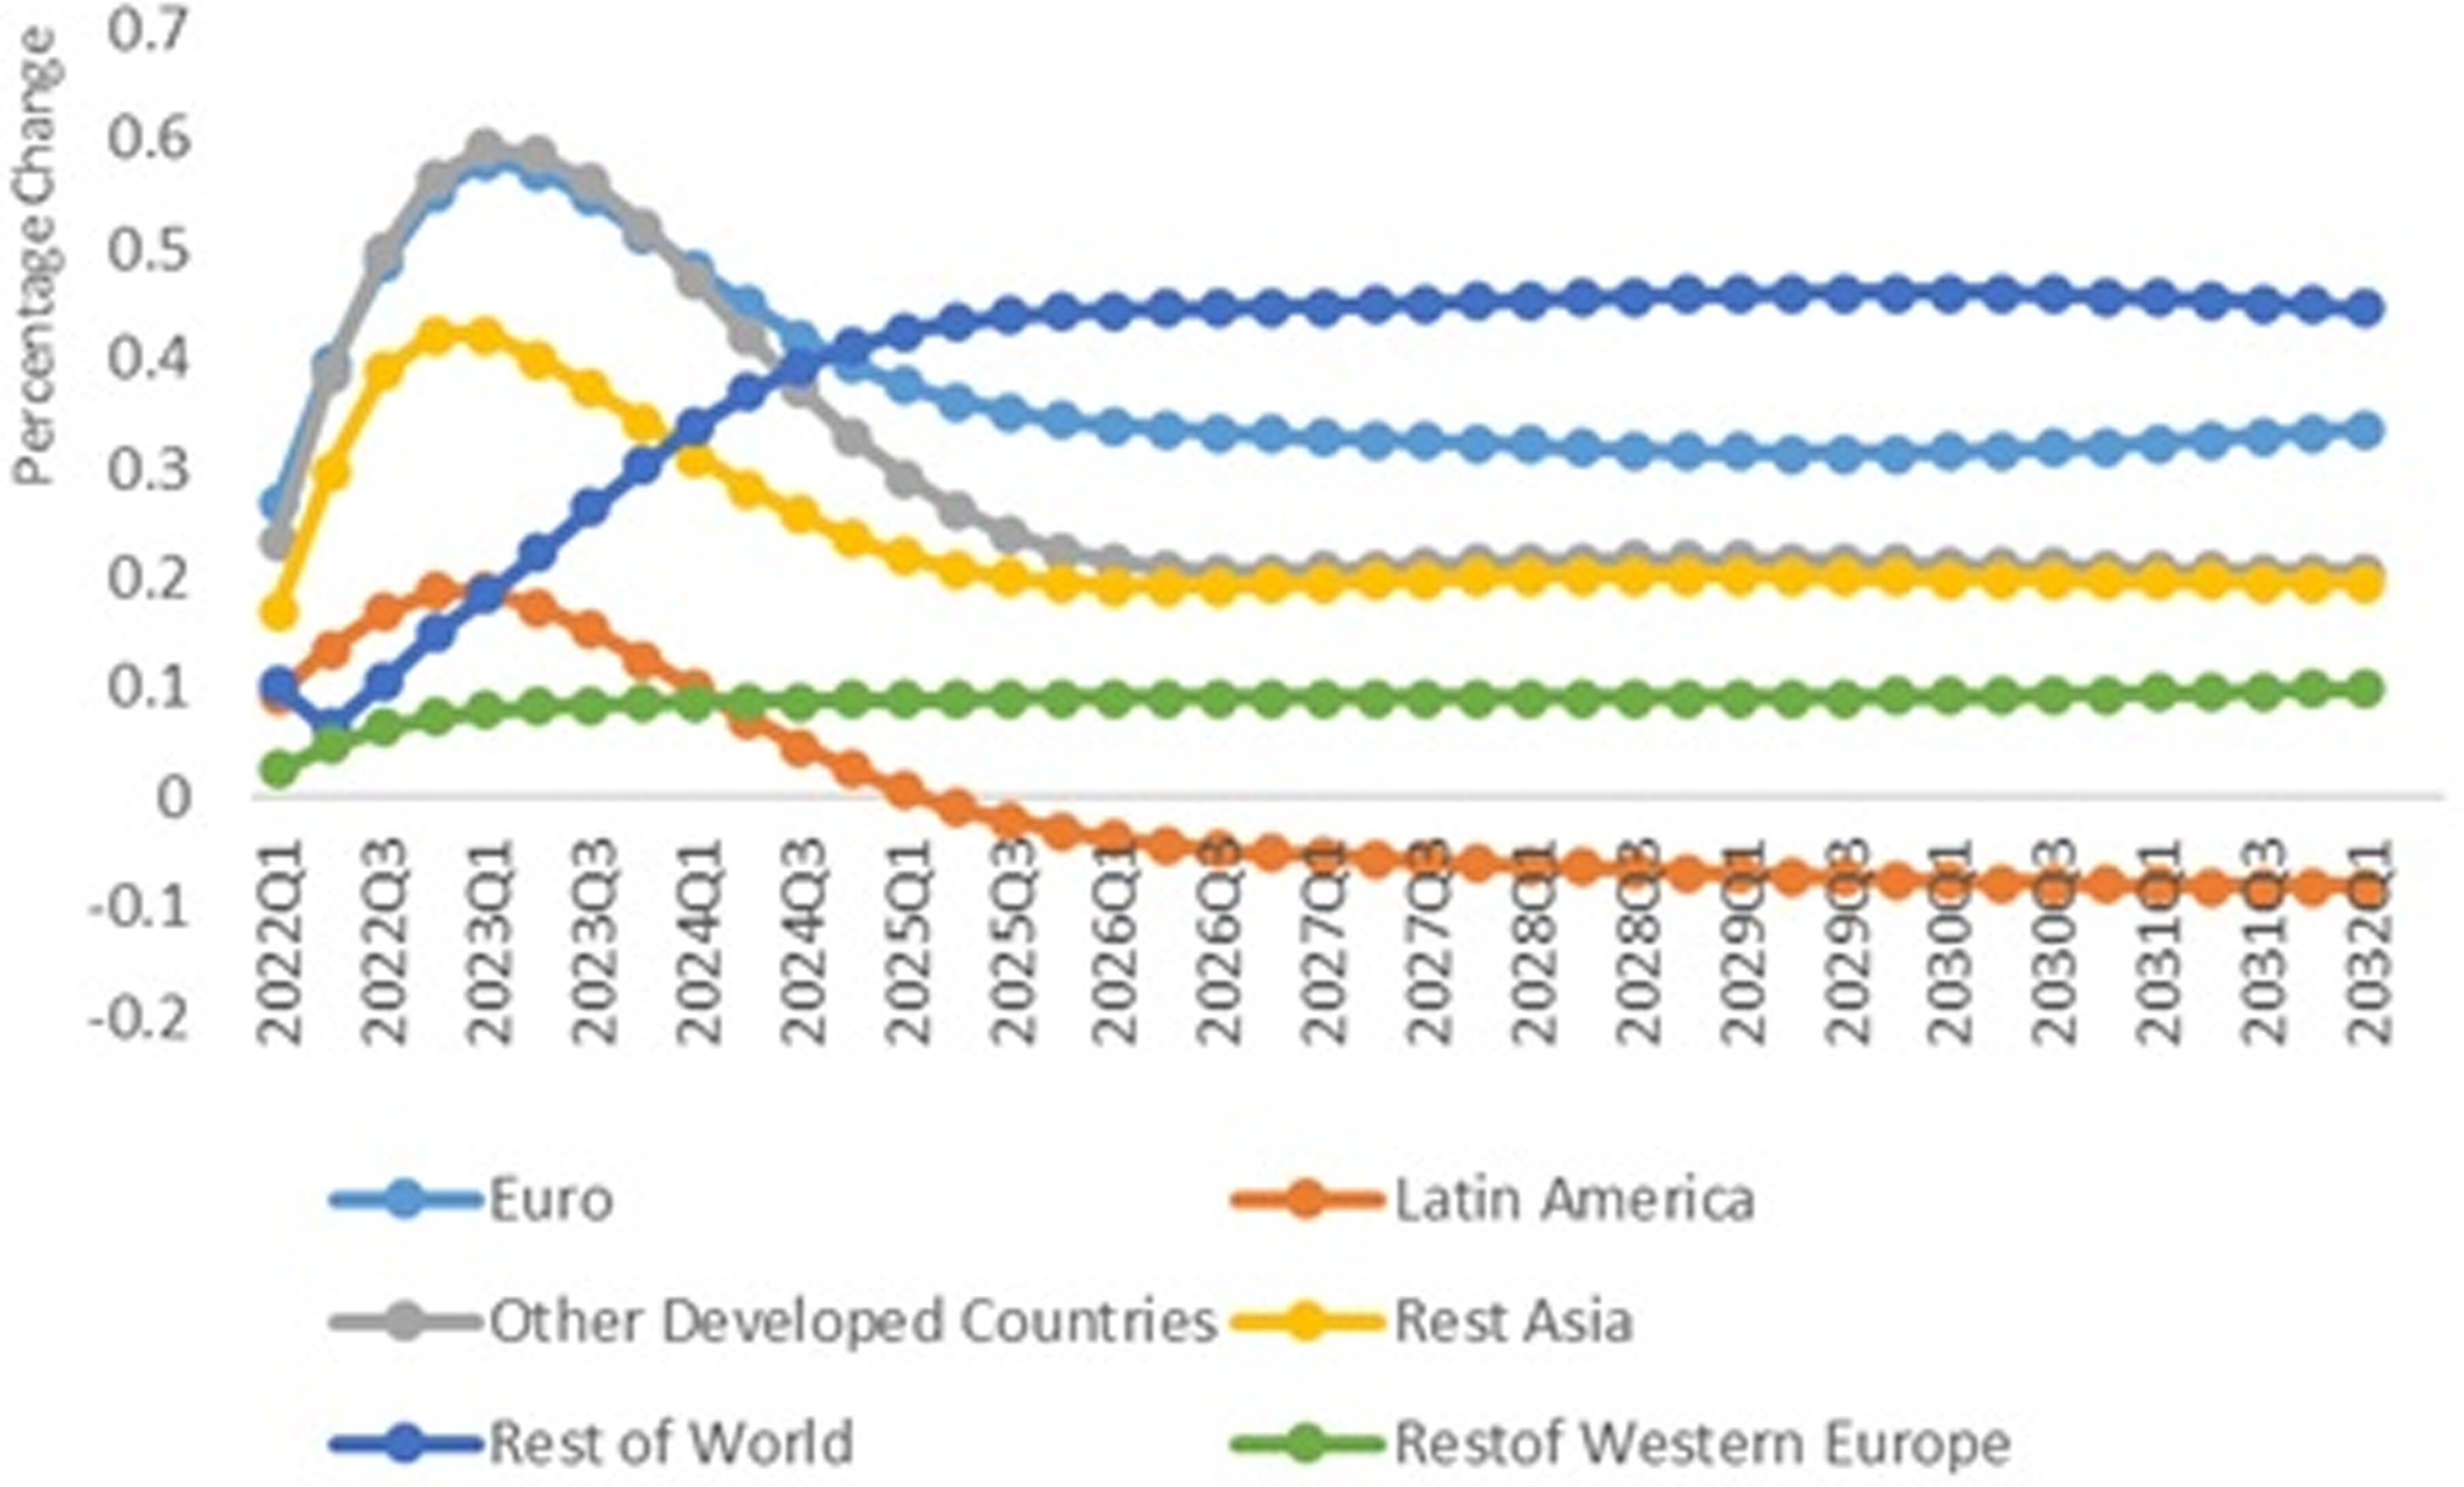
Figure 7 shows compares total
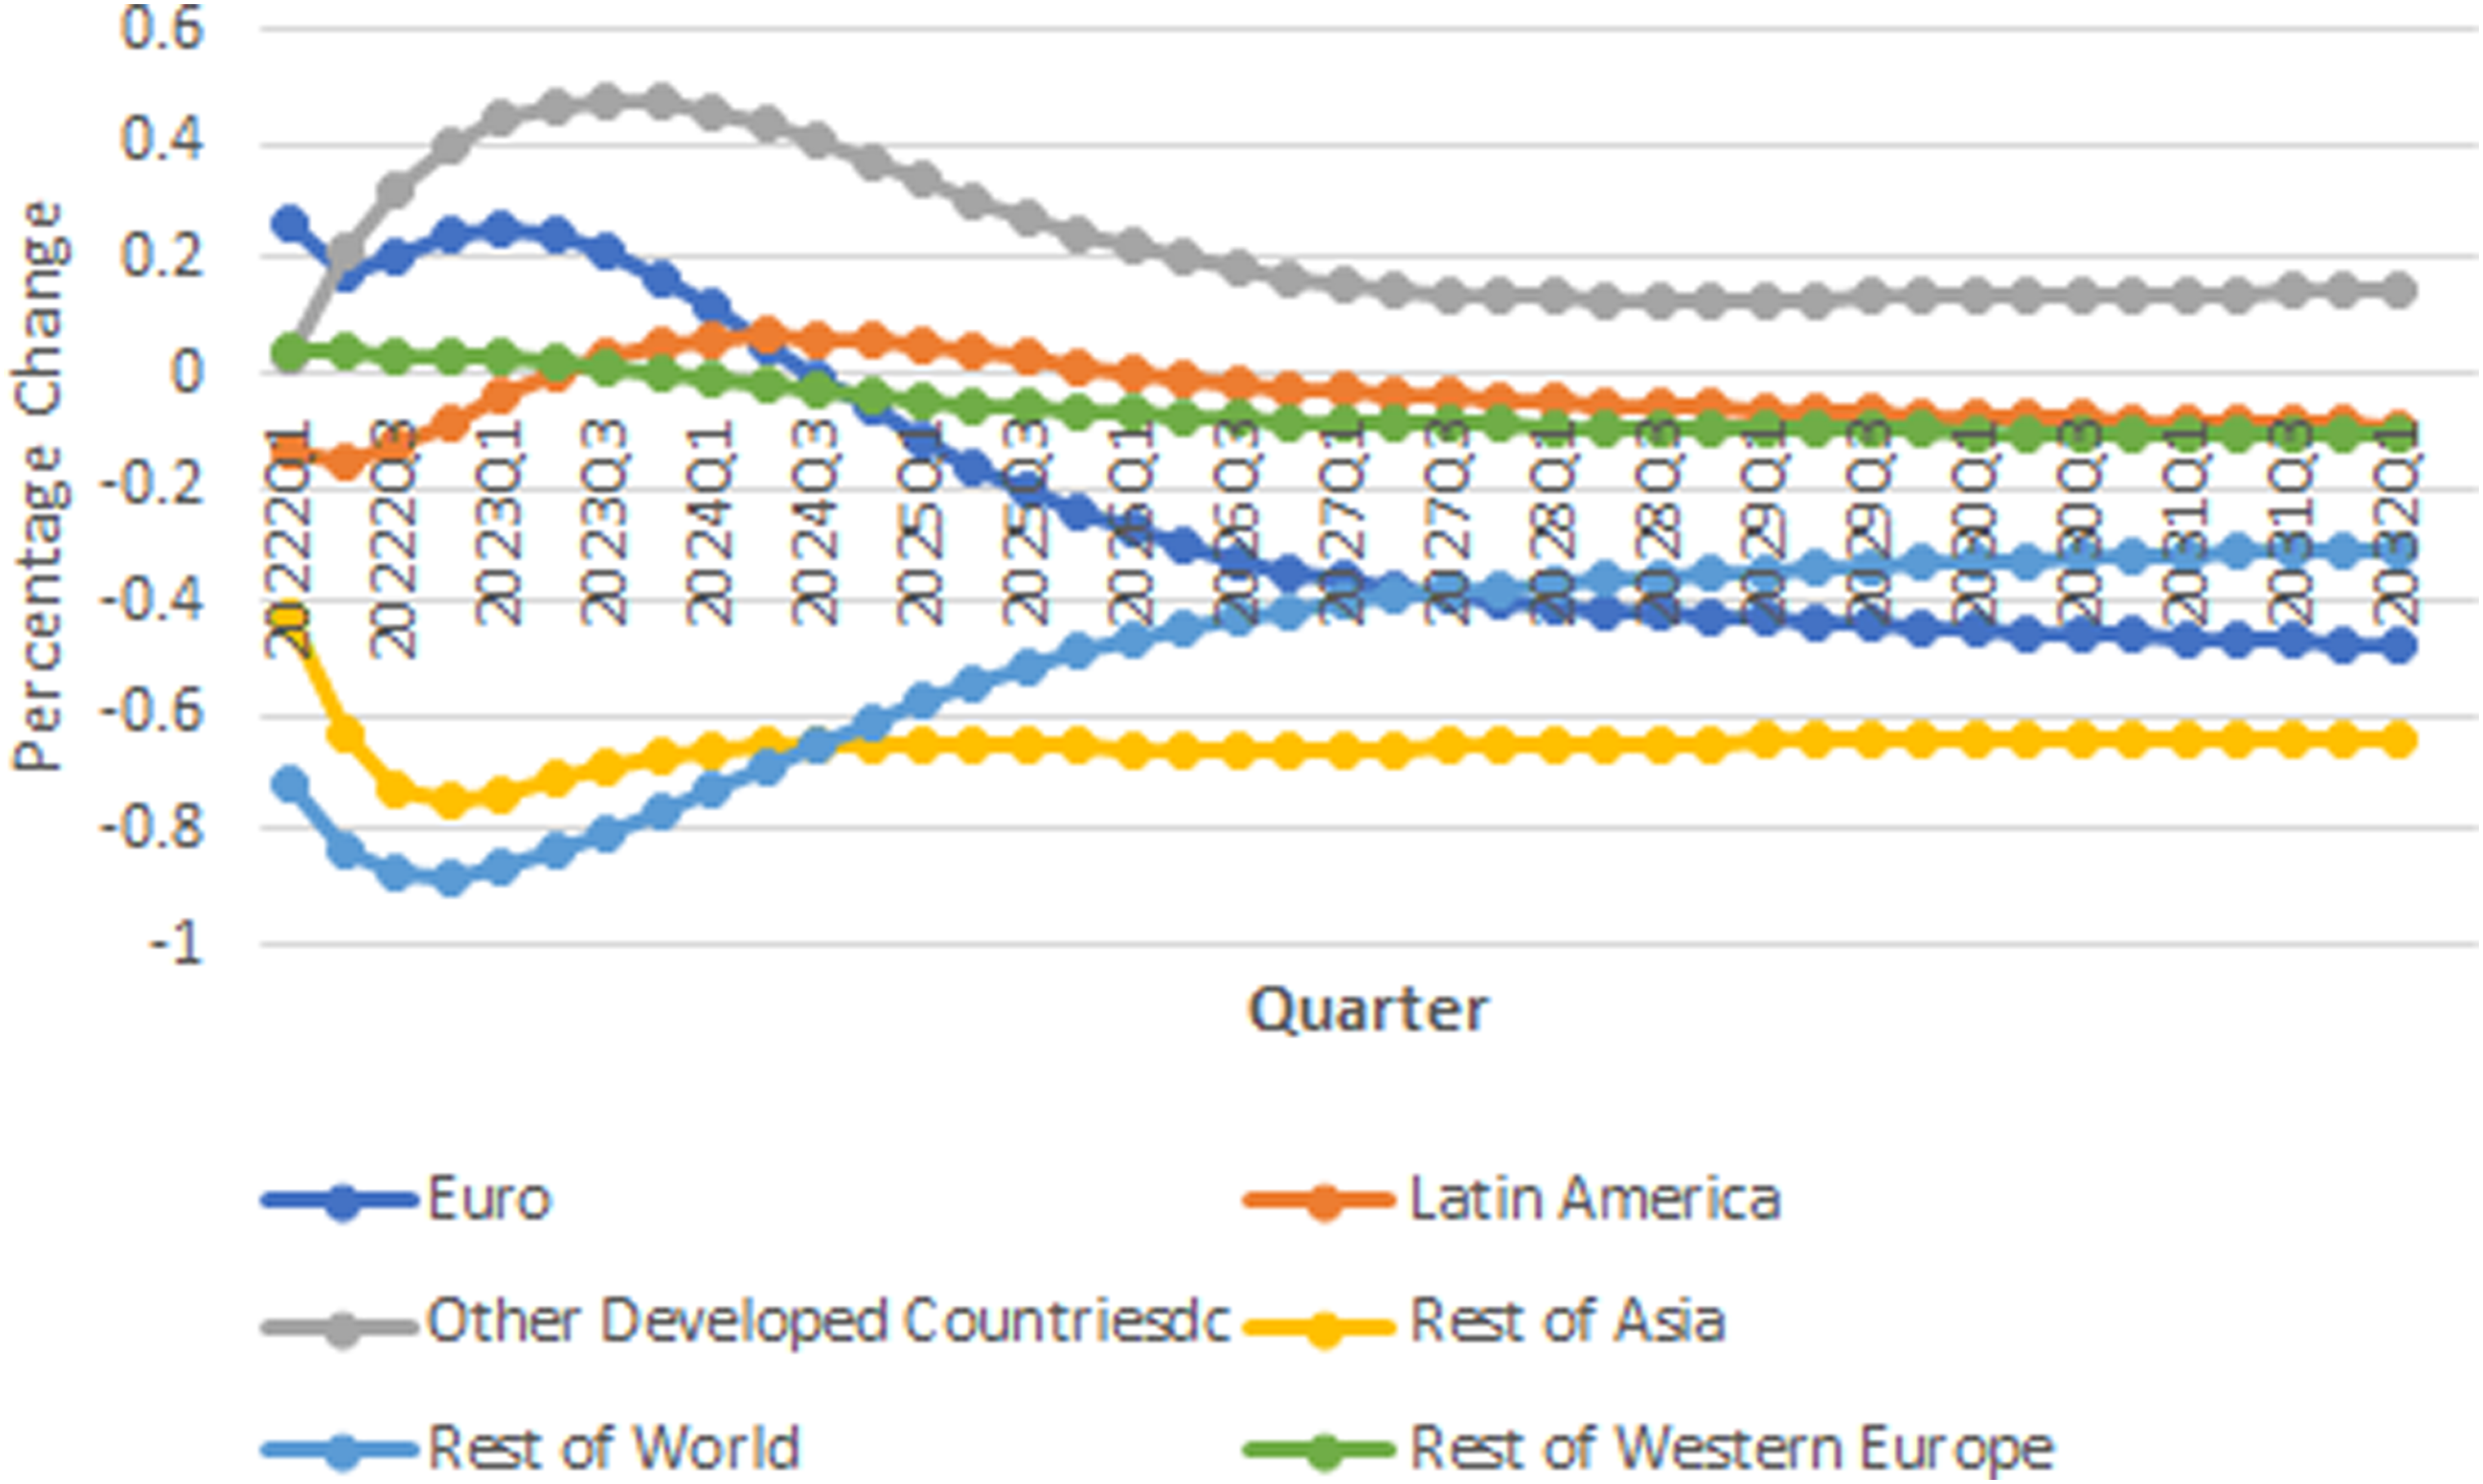
IRFs of
Our results show that pollution emission in Rest of Asia region will decrease in response to economic growth in the USA. This belongs to dependency of these economies on China's economy and the fact that growth in the USA economy replaces China in the word economy and the demand for manufactured products of Asian economies will decrease. Rest of World region will respond negatively to the recovery in the USA economy in short-run, but in long-run pollution emission in these countries will increase in response to a positive shock in the USA economy.
Discussion and conclusion
Investigations show that during the Covid-19 pandemic, energy consumption and consequently pollution emission reduced at the global level. According to the EKC, any increase in real income can increase emission pollution at the first stage of economic growth, thus economic recovery from the pandemic can increase the level of pollution emission even higher than its pre-pandemic level. Therefore, the world economy is exposed to environmental risk of Covid-19 economic recovery.
Vaccine access remains the principal driver for the global recovery and because of the vaccination coverage, it is expected that the world economy will continue the recovery phase in 2022. However, unequal access to Vaccine, heterogeneous support policies, and future variants of the virus, can have different implications for the recovery at global level. The IMF has forecasted that the world economy grows 4.9 percent in 2022 while growth beyond 2022 is projected to be moderate to 3.3 percent over the mid-term. It is also forecasted that advanced economies experience growth rate higher than pre-pandemic due to sizable policy support in the USA. The IMF has also forecasted a 4.5 and a 6.3 percent growth rate for the USA and China in 2022 respectively. In contrast, emerging economies and developing countries will lose output due to lower rate of vaccination and less policy support compared to advanced economies.
This research applied an E-GVAR model for 33 countries which stands for 90% of world GDP to study the environmental risk of Covid-19 recovery. Results show that positive economic shocks in leading economies such as China and the USA have different implications for the world economy and the environment. A positive economic shock will put the world environment at risk of
Our results show that, China's responses to both shocks are significant and China is exposed to a high environmental risk both because of a positive economic shock in China and the USA, but the level of
Since the IMF has already predicted economic recovery in the USA for the 2022, it is expected that the USA is exposed to environmental risk of the recovery. While Japan response to both shocks is significant, the UK responses to this shock will be moderate. European countries response to both shocks will be moderate and heterogeneous between countries within the European Union and other Western Europe's economies. Other developed countries, including Canada, Australia and New Zealand response to both shock will be similar. Different response of Rest of Asia to positive shocks in China and the USA roots in the structure of industries in this region. Industries in this region interconnected to industries in China. Therefore, this region is exposed to environmental risk of recovery in China's economy. In Latin America, response to both shock will be different. A positive shock in China's economy has positive and moderate impacts on countries in this region. This region responses negatively to a positive shock in the USA's economy in short-run. However, the behavior of countries in the region differs from each other. For example Behavior of Brazil's economy in response to positive shocks in China and the USA is different from other countries within the region. Economies in Rest of World group, response to these shocks is not significantly different. During last decades international cooperation on climate change has become more institutionally diverse which create opportunities to control world emission pollution. Improvement in energy intensity and technical progress potentially can contribute to control emission pollution. Academic researchers can evaluate effectiveness of investment in energy efficiency enhancement and effectiveness of these institutional cooperation to control emission pollution in post Covid-19 period.
Supplemental Material
sj-xls-1-eae-10.1177_0958305X221108493 - Supplemental material for Environmental risk of Covid-19 recovery
Supplemental material, sj-xls-1-eae-10.1177_0958305X221108493 for Environmental risk of Covid-19 recovery by Mortaza Baky Haskuee and Ali Asgary in Energy & Environment
Footnotes
Declaration of conflicting interests
The author(s) declared no potential conflicts of interest with respect to the research, authorship, and/or publication of this article.
Funding
The author(s) disclosed receipt of the following financial support for the research, authorship, and/or publication of this article: This work was supported by the LA&PS MinorvGrant 2021, (grant number 0000).
Supplemental material
Supplemental material for this article is available online.
References
Supplementary Material
Please find the following supplemental material available below.
For Open Access articles published under a Creative Commons License, all supplemental material carries the same license as the article it is associated with.
For non-Open Access articles published, all supplemental material carries a non-exclusive license, and permission requests for re-use of supplemental material or any part of supplemental material shall be sent directly to the copyright owner as specified in the copyright notice associated with the article.