
Abstract
This work presents a three-dimensional numerical study on the impact of geometrical parameters of the porous transport layers of a proton exchange membrane fuel cell (PEMFC) on its overall performance using ANSYS Fluent, with the overall current density as the key performance indicator under typical operating voltages of an automotive PEMFC, meanwhile maintaining proper two-phase water transport throughout the transport layers on both electrodes. The coupled charge, mass, momentum, species and energy conservation equations with source terms due to electrochemical reactions and phase change among different phases of water were solved to obtain a steady-state solution, typically using over 1.5 million meshes for the fuel cell, with each transport layer “resolved” in the height direction measuring the layer thickness. The modelling approach is validated against the measured polarisation profile of a PEMFC. Optimising the thicknesses h’s of the porous transport layers is the focus of this study. Without changing other characteristics of these porous media, it would naturally be the first step to optimise the configuration of a fuel cell, which requires the least monetary and knowledge investment but potentially leads to substantial performance improvement, especially if the volume of the fuel cell can be reduced, which is important for automotive applications. Although past numerical studies that usually focused on one transport layer have offered valuable insights into optimising a fuel cell’s configutration to achieve optimal performance, it will be necessary to investigate a fuel cell as an integrated entity when performance optimisation is the objective, since realistic boundary conditions for all porous transport layers are determined in real time rather than assumed. Via an iterative approach, the present study has attempted to optimise the thicknesses of all porous transport layers of a single fuel cell. Optimal performance of the PEMFC was achieved with a reduction of its volume by 5.1%.
Introduction
To address the increasing demand for sustainable energy solutions, the automotive sector is shifting towards innovative technology that offers enhanced performance. Proton exchange membrane fuel cells are an attractive option for vehicle power plants because of their high energy density, high efficiency, near-zero emissions, rapid cold start, and good dynamic response.1,2 In a PEMFC, hydrogen fuel is electrochemically converted into electricity through an electrochemical process. Molecular hydrogen (H2) is oxidised at the anode catalyst layer (H2 → 2H+ + 2e−), the generated hydrogen ions pass through the membrane, and the electrons pass from the anode current collector to the cathode one through the GDL. At the cathode, oxygen is reduced through an electrochemical mechanism involving electrons, hydrogen ions and oxygen supplied from the cathode gas flow channel (O2 + 4H+ + 4e−→ 2H2O).
Improving PEMFC operating safety and efficiency requires careful optimisation of multiple interconnected processes. To understand these phenomena, sophisticated knowledge of coupled transport of fluid flow, species and heat under the impact of electrochemical reactions is required. Moreover, setting up porous media configurations in a fuel cell requires careful design and optimisation across the gas diffusion layer (GDL), microporous layer (MPL), catalyst layer (CL) and proton exchange membrane (PEM), since each of these components has a quite different but equally important role, from distributing reactants to enabling electrochemical reactions.
While significant advances have been made in recent years on experimental techniques to inspect fuel cells, an internal operational scrutiny of a PEMFC remains challenging. In this context, numerical modelling 3 has emerged as a crucial tool, with the potential to offer nuanced analysis and understanding of internal processes within a fuel cell. Early efforts include a three-dimensional (3D) model built by Berning et al., 4 who conducted a parametric investigation of a PEM fuel cell and compared their results with the experimental findings of Ticianelli et al. 5 Several studies have been dedicated to analysing the effects of porous-layer parameters on PEMFC performance, such as the thickness,6–9 porosity, 10 permeability 11 and contact angle.6,12 In addition, efficient two-phase water transport and effective water management are another crucial performance challenge, since poor water management can cause blockages in an FC, which causes reaction sites to be unable to acquire the necessary reactants. Conversely, excess of water might clog the sites of critical chemical processes or even flood the electrodes, which would prevent a fuel cell from functioning effectively. 13
A main component of a PEM fuel cell is the membrane. The proton exchange (or polymer electrolyte) membrane needs to be chemically and physically robust and must exhibit a high proton conductivity and a low ionic conductivity, while acting as a barrier to the mixing of fuel and reactant gases. A polymer membrane’s water content and its structure have a significant impact on its protonic conductivity. Sgreccia et al. 14 created a self-assembling nano-composite organic-inorganic proton conducting sulfonated poly-ether-ether-ketone (SPEEK) based membrane for PEM fuel cells. They have explored a variety of strategies to enhance the morphological stability and the water retention ability of sulfonated aromatic polymers. The mechanical and thermal characteristics, water absorption, and proton conductivity of the novel membrane material are reported. To explore the patterns of current density within the membrane, Dutta et al. 15 used a 3D PEMFC model and found that the axial distribution of current density and the rate of water transport were significantly impacted by the membrane’s thickness and the cell voltage. Water transport across the cathode and anode involves a delicate balance between diffusion and electro-osmosis, which affects the current density distribution along the channel. In a later study of theirs, in which a full fuel cell was simulated with two distinct flow channels for the anode and cathode separated by the membrane electrode assembly, they found that flow distribution in both anode and cathode channels was severely affected by patterns of mass consumption within the membrane electrode assembly. 16
Another most critical component of a PEM fuel cell is the gas diffusion layer, which acts as the support and functional structure for membrane electrode assembly and plays a significant role in determining the performance, durability and the dynamic characteristics of a PEMFC. 17 One of its primary roles is to facilitate the uniform distribution of hydrogen and oxygen gases across the catalyst layer. Its porous structure ensures that reactants reach the active sites efficiently, preventing localised concentration losses and enhancing reaction kinetics. Additionally, the GDL plays a crucial role in water management, allowing for proper membrane hydration while preventing flooding, which could obstruct reactant transport and reduce cell efficiency. The incorporation of an MPL and hydrophobic coatings helps regulate water movement within a fuel cell. Furthermore, it aids in dissipating heat, preventing excessive temperature buildup and maintaining stable operation. Mechanically, the GDL serves as a buffer between the catalyst layer and the bipolar plates, offering structural support and ensuring uniform compression. This mechanical integrity enhances the durability and longevity of a PEM fuel cell. A 3D, single-phase, isothermal model for PEMFCs was developed by Meng and Wang 18 to examine the effect of electron transport over the gas diffusion layer. For the first time, the lateral electronic resistance in GDL has been studied by analysing the electron transport equation in the catalyst, gas diffusion and current collector layers. It became apparent that the electronic conductivity, diffusion layer thickness and gas channel width all experienced an impact of the GDL’s lateral electronic resistance. Also, it was found that at high cell voltages, the lateral electronic obstruction dominated the current transportation, but at low cell voltages, the level of the oxygen concentration showed a significant role. Cindrella et al. 19 have examined the significance of the GDL, and to achieve this, reviewed its essential properties, such as the structure, porosity, hydrophobicity, hydrophilicity, gas permeability, transport characteristics, water management, and surface morphology. After extensive research, they concluded it was essential to create a highly functionalised GDL with self-adjusting features to water retention and draining, as well as with optimal features that would allow the reactant to be continuously supplied. Zhu et al. 20 developed a 3D model for a single PEMFC to study effects of the cathode-GDL thickness on the performance of PEMFCs in both steady-state and load-varying scenarios. Results highlighted that thicker GDLs lead to nonuniform oxygen and liquid water distributions under steady-state circumstances, but increase the resistance of oxygen transport. Moreover, it was discovered that thinner GDLs reduce the current overshoot under load-varying situations, but increase the undershoot valley. After a thorough analysis of these variables, the thickness of the cathode GDL was recommended to be 100 µm to balance the PEMFC performance in various operating scenarios.
Simon et al.’s study 21 examined the transport of oxygen and liquid water in MPLs with various structural configurations. Large pores are found to be the primary means of transporting liquid water, yet both large and small pores may simultaneously be involved in the transfer of oxygen. Furthermore, several unique MPLs, such as self-supporting, 22 crack-free 23 and multilayer MPLs, 24 are developed to enhance the performance of fuel cells. Zhou et al. 25 have investigated the influence of MPL parameters on the fuel cell performance using a two-fluid model. They found that an MPL increased the temperature in the membrane electrode assembly and it enhances water evaporation and back diffusion under a wet condition.
The surface of the catalyst layer is the site where the electrochemical reaction takes place among the three different species - gases, electrons and protons. Therefore, all these three species should be able to smoothly reach the area of the catalyst where the reactions occur. Zhang et al. 26 have suggested a variety of investigational and experimental approaches for assessing catalyst deterioration. Since fuel-cell catalyst layers may consist of distinct bonding relations or chemical states that can be distinguished by quantitative and surface-sensitive X-ray photoelectron spectroscopy (XPS), Zhang et al. 27 used XPS to analyse quantitatively the deterioration of a catalyst layer and the intricate degradation mechanisms that occur during fuel cell operation. A 3D agglomeration model for a PEM fuel cell’s cathode catalyst layer was created by Das et al. 28 A finite element approach has been employed to investigate the oxygen transport mechanism via the cathode catalyst layer and its effect on the activation polarisation with three agglomerate arrangement configurations.
Different from most of the past numerical studies on investigating the effects of geometrical parameters of cell components on PEMFC performance, which usually focused on one transport layer, the present study has used an iterative approach to optimise the configurations of all porous transport layers of a single fuel cell. We focus on the thicknesses of these transport layers, because it would be naturally the first step when a PEMFC is to be optimised, especially when the volume of the unit cell is important, for example for automotive applications. To simplify the optimisation, the thicknesses of the same transport layer on both electrodes have been taken identical. With the overall current density produced by the fuel cell as the key performance indicator under a typical range of operating voltages, the distribution and transport of species, including the multiple-phase water, inside the fuel cell are also scrutinised to better understand the mechanisms behind the identified phenomena and trends. To achieve this purpose, ANSYS Fluent together with its add-on fuel-cell module has been used. The coupled charge, mass, momentum, species and energy conservation equations with source terms due to electrochemical reactions and phase change among different phases of water were solved to obtain a steady-state solution, typically using close to 2 million meshes for the fuel cell, with each transport layer “resolved” in the height direction measuring the layer thickness h. The approach used in the present study is summarised in Figure 1. Approach summary.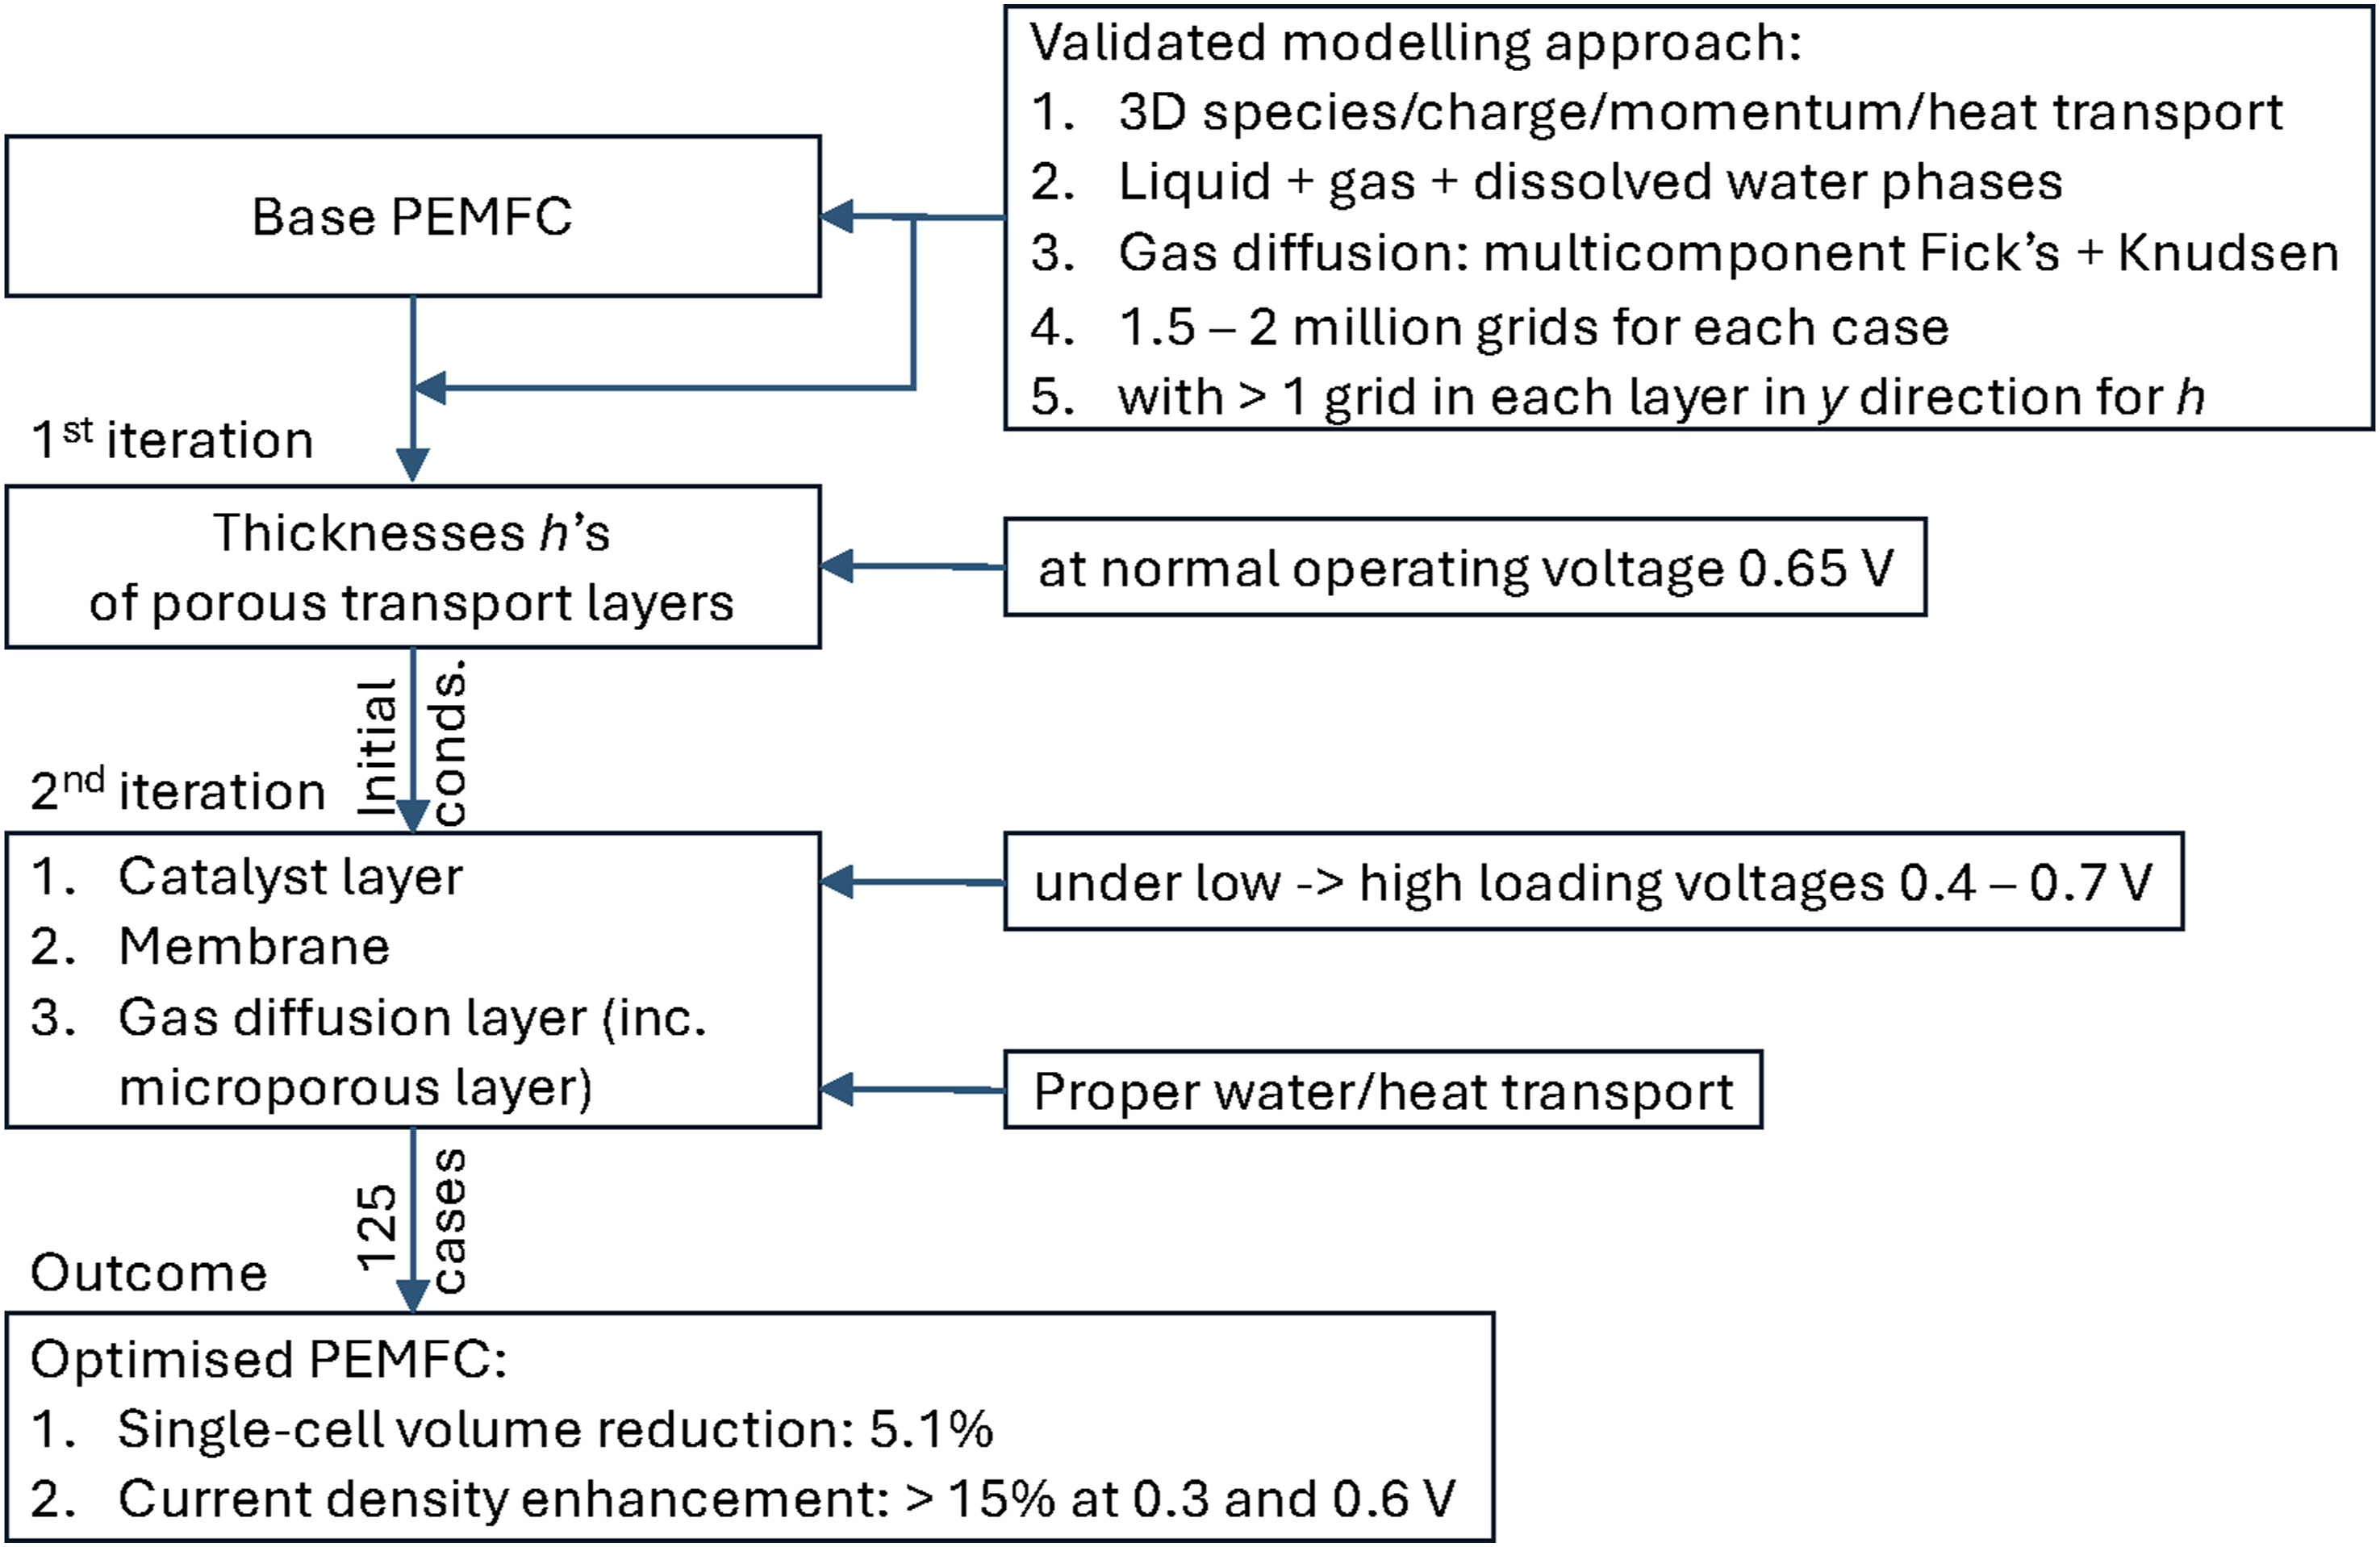
Fuel cell model
Fuel cell
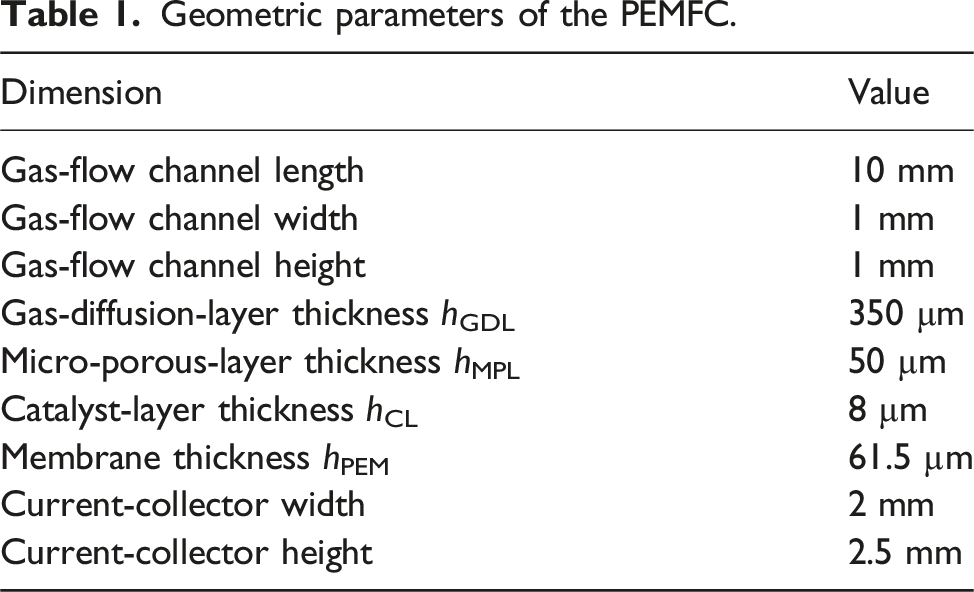
A schematic of the computational domain for a parallel flow field fuel cell is shown in Figure 2. The geometry of the PEMFC was created using ANSYS Design Modeler. Table 1 presents geometrical dimensions of the PEMFC to be optimised, which have referred to a typical automotive PEMFC. As shown, the computational domain consists of eleven sub-domains, including two gas flow channels, two GDLs, two MPLs, two CLs and two current collectors on the anode/cathode sides, together with one proton exchange membrane. Materials are homogeneous and isotropic. Uniform catalyst loading is assumed for the CLs, with constant physical and electrochemical properties. Fuel cell model and boundary conditions.
29
Geometric parameters of the PEMFC.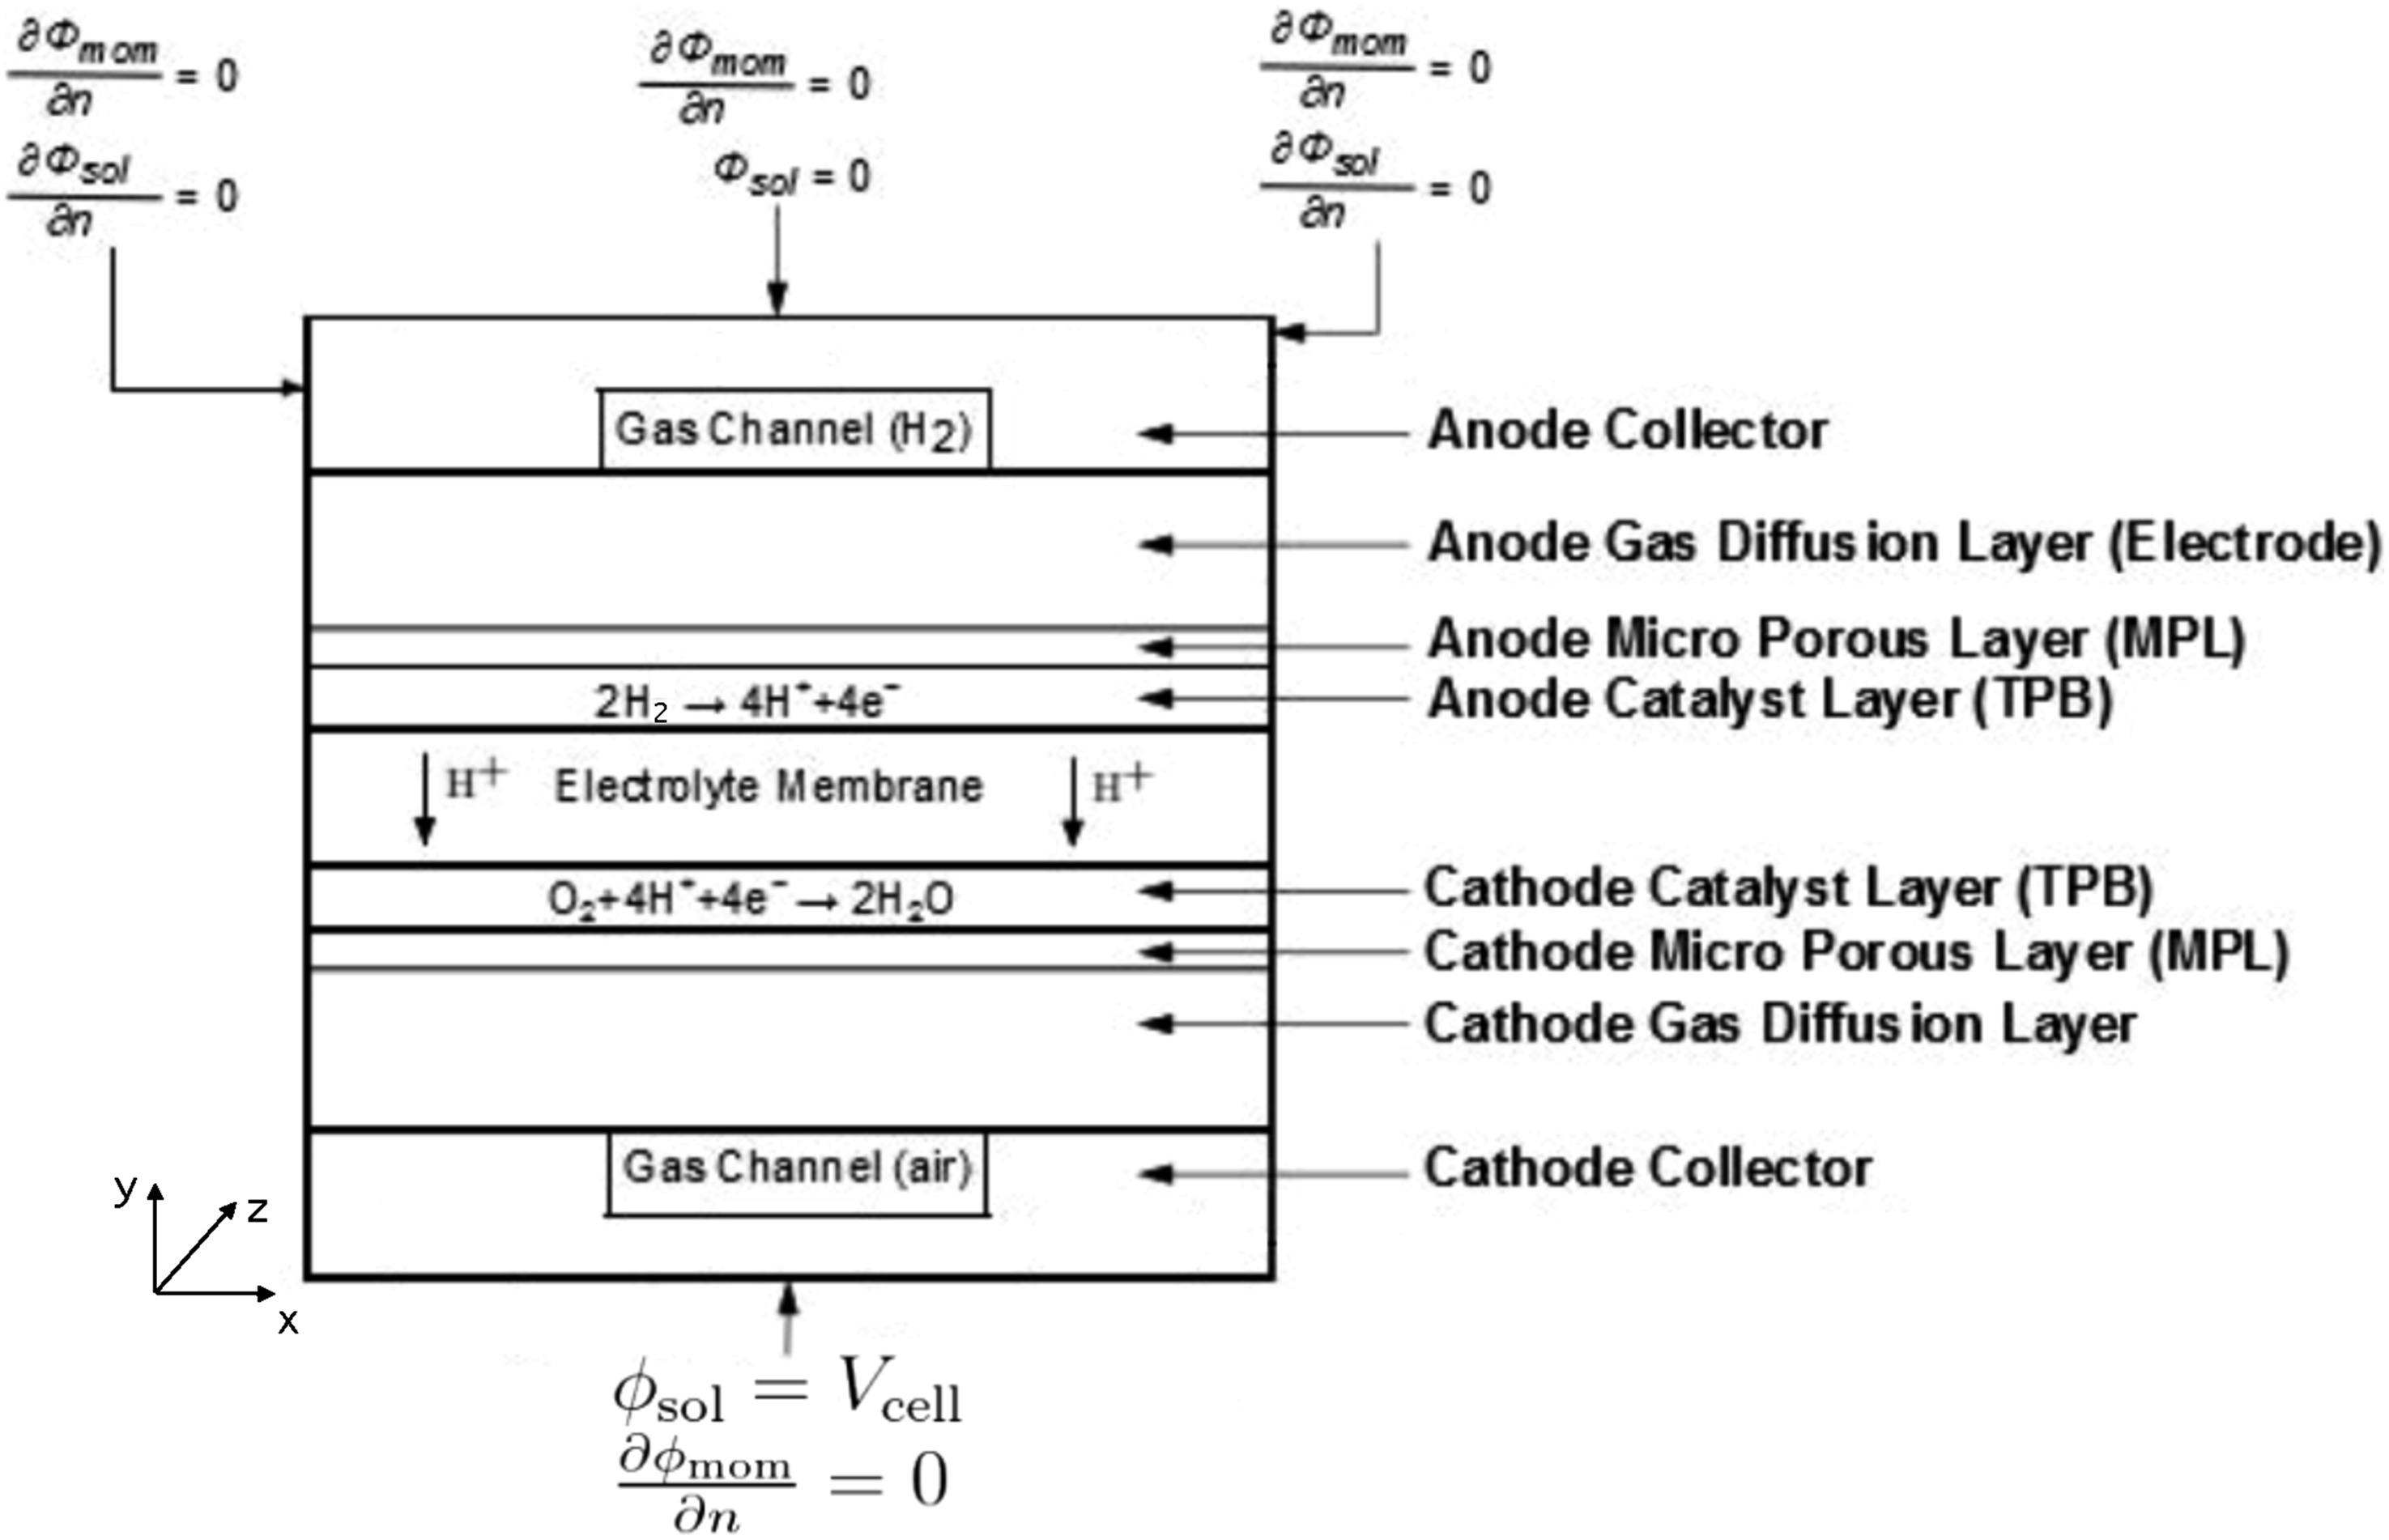
Governing equations29,30
For a PEMFC, the governing equations for the gas phase comprise the conservation of mass, momentum, energy and species, with source/sink terms due to electrochemical reactions and phase change. The source term for the momentum equation is a pressure drop in laminar flows through porous media modelled by Darcy’s Law. Joule heating is included in the energy equation. The effective thermal conductivity κeff is modelled by the volume average of the fluid and solid conductivities. The diffusion coefficient of species i in a mixture
Since the pore size of the polymer electrolyte is ∼O (1) nm, water generated in the cathode catalyst layer tends to be locally accumulated, but less connected as a liquid phase in the small pores. In addition, a generated water molecule cannot be seen in gas phase as well, because it will join a group of water molecules in the vicinity which are already in a condensed state. Therefore, a “dissolved” water phase is modelled, conveniently by the water content λ as the number of water molecules attached to the ionic group
Two electrical-potential equations are solved, with ϕsol (V) for the solid phase transporting electrons and ϕmem for the membrane phase transporting protons. The volumetric transfer current R (A⋅m−3) is determined by the Butler-Volmer equation, and the half-cell potential U0 (V) is computed by the Nernst equation.
Ideal gas is assumed. Gravity effects have been ignored. The gas flows are laminar.
Numerical procedure and boundary conditions
The fuel cell model was solved using ANSYS Fluent 2023 R1. The steady-state model was discretised using the finite volume method and solved on double precision. A first-order upwind scheme was used for the spatial discretisation of the momentum, continuity, potential and energy equations, and the SIMPLE (semi-implicit method for pressure-linked equations) algorithm was employed to manage velocity-pressure coupling in the momentum equations. To maintain convergence stability, an appropriate relaxation factor was applied to each variable. An algebraic multi-grid method with a Gauss–Seidel type smoother is used to accelerate the convergence. The convergence criteria were set to 10−6 for the energy equation and 10−3 for all the others. When the difference between the current generated in the anode and cathode CLs is
The mass flow rates at the cathode air and anode hydrogen inlets are 2.0 and 0.3 µg⋅s−1, respectively.
31
At the anode inlet the gas mixture consists of hydrogen (mass fraction
Validation and grid independent study
The comparison between simulated results and the experimental data of a PEMFC
33
is shown in Figure 3. It can be seen that the model predictions give good agreement with the experimental data on the polarisation curve for the defined geometrical and operating conditions. Validation on polarisation curve of the reference PEMFC.
33
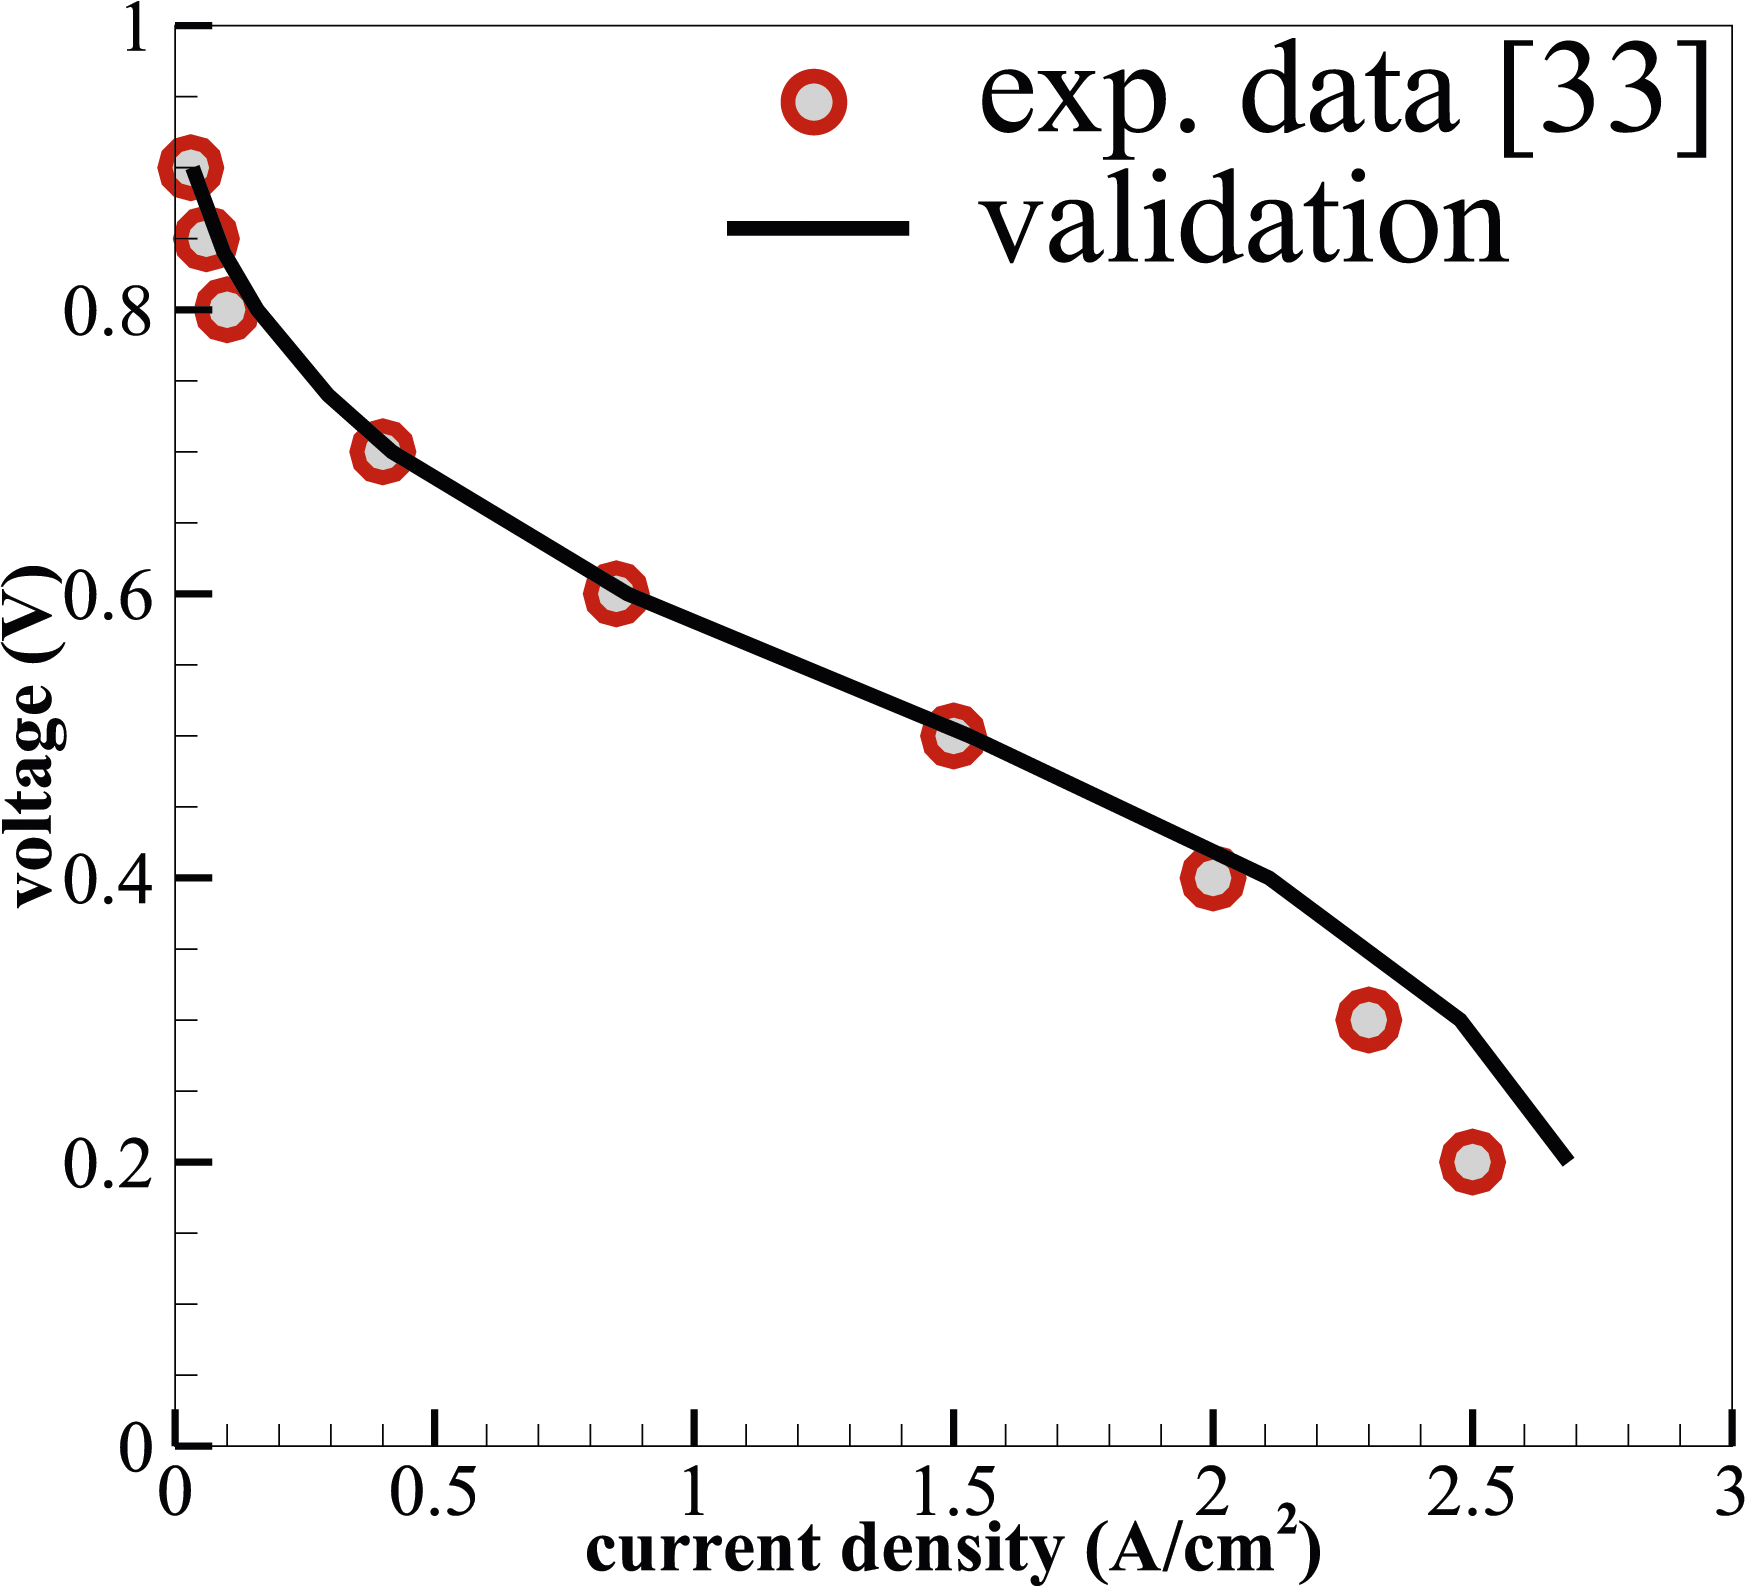
For the PEM fuel cell investigated here (see Table 1 for dimensions), the computational domain was discretised using a hexahedral mesh, starting with 753,830 cells. The grid independence study (not shown) shows that the overall current density increases from 9621 to 9655 A⋅m−2 when the number of elements grows from 753,830 to 1,973,118. Further increasing the number of elements to 2,832,960, the gain in precision improvement is marginal, especially as the solution time is almost doubled. Therefore, ∼2 million mesh elements were used in the ensuing simulations, taking into account both accuracy and cost.
Results and discussion
Initial optimisation of transport layers
In the present study, the optimisation of porous-medium configurations for PEMFC entailed adjustments to the thicknesses of the transport layers, including the microporous layer, catalyst layer, gas diffusion layer and membrane. This procedure aligns with the simplest engineering optimisation approach, that is without changing other characteristics of these porous media, for example porosity, mean pore size, pore size distribution, specific surface area, which in general means different materials or production would be sought otherwise. It would naturally be the first step to optimise a fuel cell’s performance, which requires the least monetary and knowledge investment but potentially leads to substantial performance improvement, especially if the volume of the fuel cell can be reduced, which is important for automotive applications. It should also be mentioned that for the same transport layer on both the anode and cathode sides, we will use the same thickness to simplify the optimisation procedure. The layer thicknesses h’s of the respective porous components were as follows: hMPL = 50 µm, hCL = 8 µm, hGDL = 350 µm, and hPEM = 61.5 µm (see Table 1).
The initial phase in the optimisation process at an operating voltage 0.65 V focused on the MPL first, with all the other layer thicknesses kept unchanged. It was found (not shown) when hMPL increases from 10 to 100 µm, the current density i reduces from just above 0.65 to ∼ 0.645 A⋅cm−2. This suggests that thinner MPLs are better suited for a higher current density, although the gain is limited, and the optimal range would be between 5 and 30 µm. hMPL = 10 µm is chosen, considering structural integrity.
With hMPL = 10 µm, hGDL = 350 µm and hPEM = 61.5 µm, the current density is seen to increase with the thickness of the catalysts layer hCL (not shown), peaking at hCL ≈ 35 µm, following which the FC’s performance begins to decline as the current density begins to fall sharply. The peak implies that an optimal thickness for the catalyst layer would lie between 15 and 45 µm. hCL = 24 µm is chosen.
Now with hMPL = 10 µm, hCL = 24 µm and hGDL = 350 µm, an inverse relationship is seen between the current density and the membrane thickness hPEM (not shown). As the membrane thickness grows up to 90 µm, the current density reduces considerably from ∼2.1 to 0.52 A⋅cm−2. This suggests that a thinner membrane tends to be more beneficial for current density, the key indicator of the PEMFC’s performance. hPEM = 48 µm is chosen, considering structural integrity.
Finally, with initially optimised thicknesses of the other transport layers, that is hMPL = 10 µm, hCL = 24 µm and hPEM = 48 µm, the current density is found to increase, rapidly, with the thickness of the GDL until it reaches a peak at ∼150 µm, after which it begins to decline, slowly (not shown). Therefore, the optimal range for GDL thickness would be between 80 and 300 µm. We have chosen hGDL = 240 µm, taking into account structural integrity.
To summarise, the initial optimisation of the transport layers, using current density i as the key indicator of the PEMFC’s performance and considering structural integrity, results in hGDL = 240 µm, hMPL = 10 µm, hCL = 24 µm and hPEM = 48 µm.
The second iteration will now be started to ensure that the outputs converge. The initial thickness values of the transport layers are taken to be the identified optimal thicknesses of the GDL, MPL, CL and membrane after the initial optimisation. The second iteration will also expand analyses important to water and thermal management of the FC, which will bring out a more vivid focus regarding the performance and efficiency of the system. Moreover, as different operating voltages denote different power requirements, the response of the fuel cell to these loads must be known to optimise the efficiency, durability and reliability of the device. The present work will thus identify an effective thickness of each layer under various load conditions so that high performance and stability of the fuel cell can be obtained within the entire load range. Therefore, thickness optimisation will be investigated under five load conditions ranging from 0.4 to 0.7 V, spanning typical low to high loads of an FC. Under each voltage, the current density variation with different thicknesses will be investigated to determine an overall optimal thickness of the transport layer. This extended approach summarised in Figure 1 allows further investigation into the interrelationships between the multiple layers of the PEMFC and their effects on the FC’s performance.
Catalyst-layer optimisation
The catalyst layers significantly impact the performance, durability, and cost of a PEMFC, as well as technical difficulties to commercialisation. Figure 4 shows the variations of the current density at different operating voltages and catalyst layer thicknesses hCL. The current density increases from 8 to 30 µm in catalyst layer thickness at the highest operating voltage of 0.7 V. Past this thickness, however, a drop in current density is seen. A comparable pattern is seen when the voltage is lowered to 0.65 V, where the current density increases with an increase in catalyst layer thickness up to a maximum value of 0.84 A⋅cm−2 at hCL = 26 µm. This optimal thickness is slightly less than at 0.7 V and thus shows the sensitivity of the CL thickness to the operating voltage. Following this tendency, it can be seen that with further decreased operating voltages, the optimum catalyst thickness continues to decrease. The peak values of the current density i, that is 1.08, 1.38 and 2.08 A ⋅cm−2, are found at the CL thickness hCL = 23, 20 and 17 µm when the operating voltages are 0.6, 0.55 and 0.4 V, respectively. Current density i variation with catalyst layer thickness hCL under different operating voltages. The red symbols indicate the produced imax at each voltage.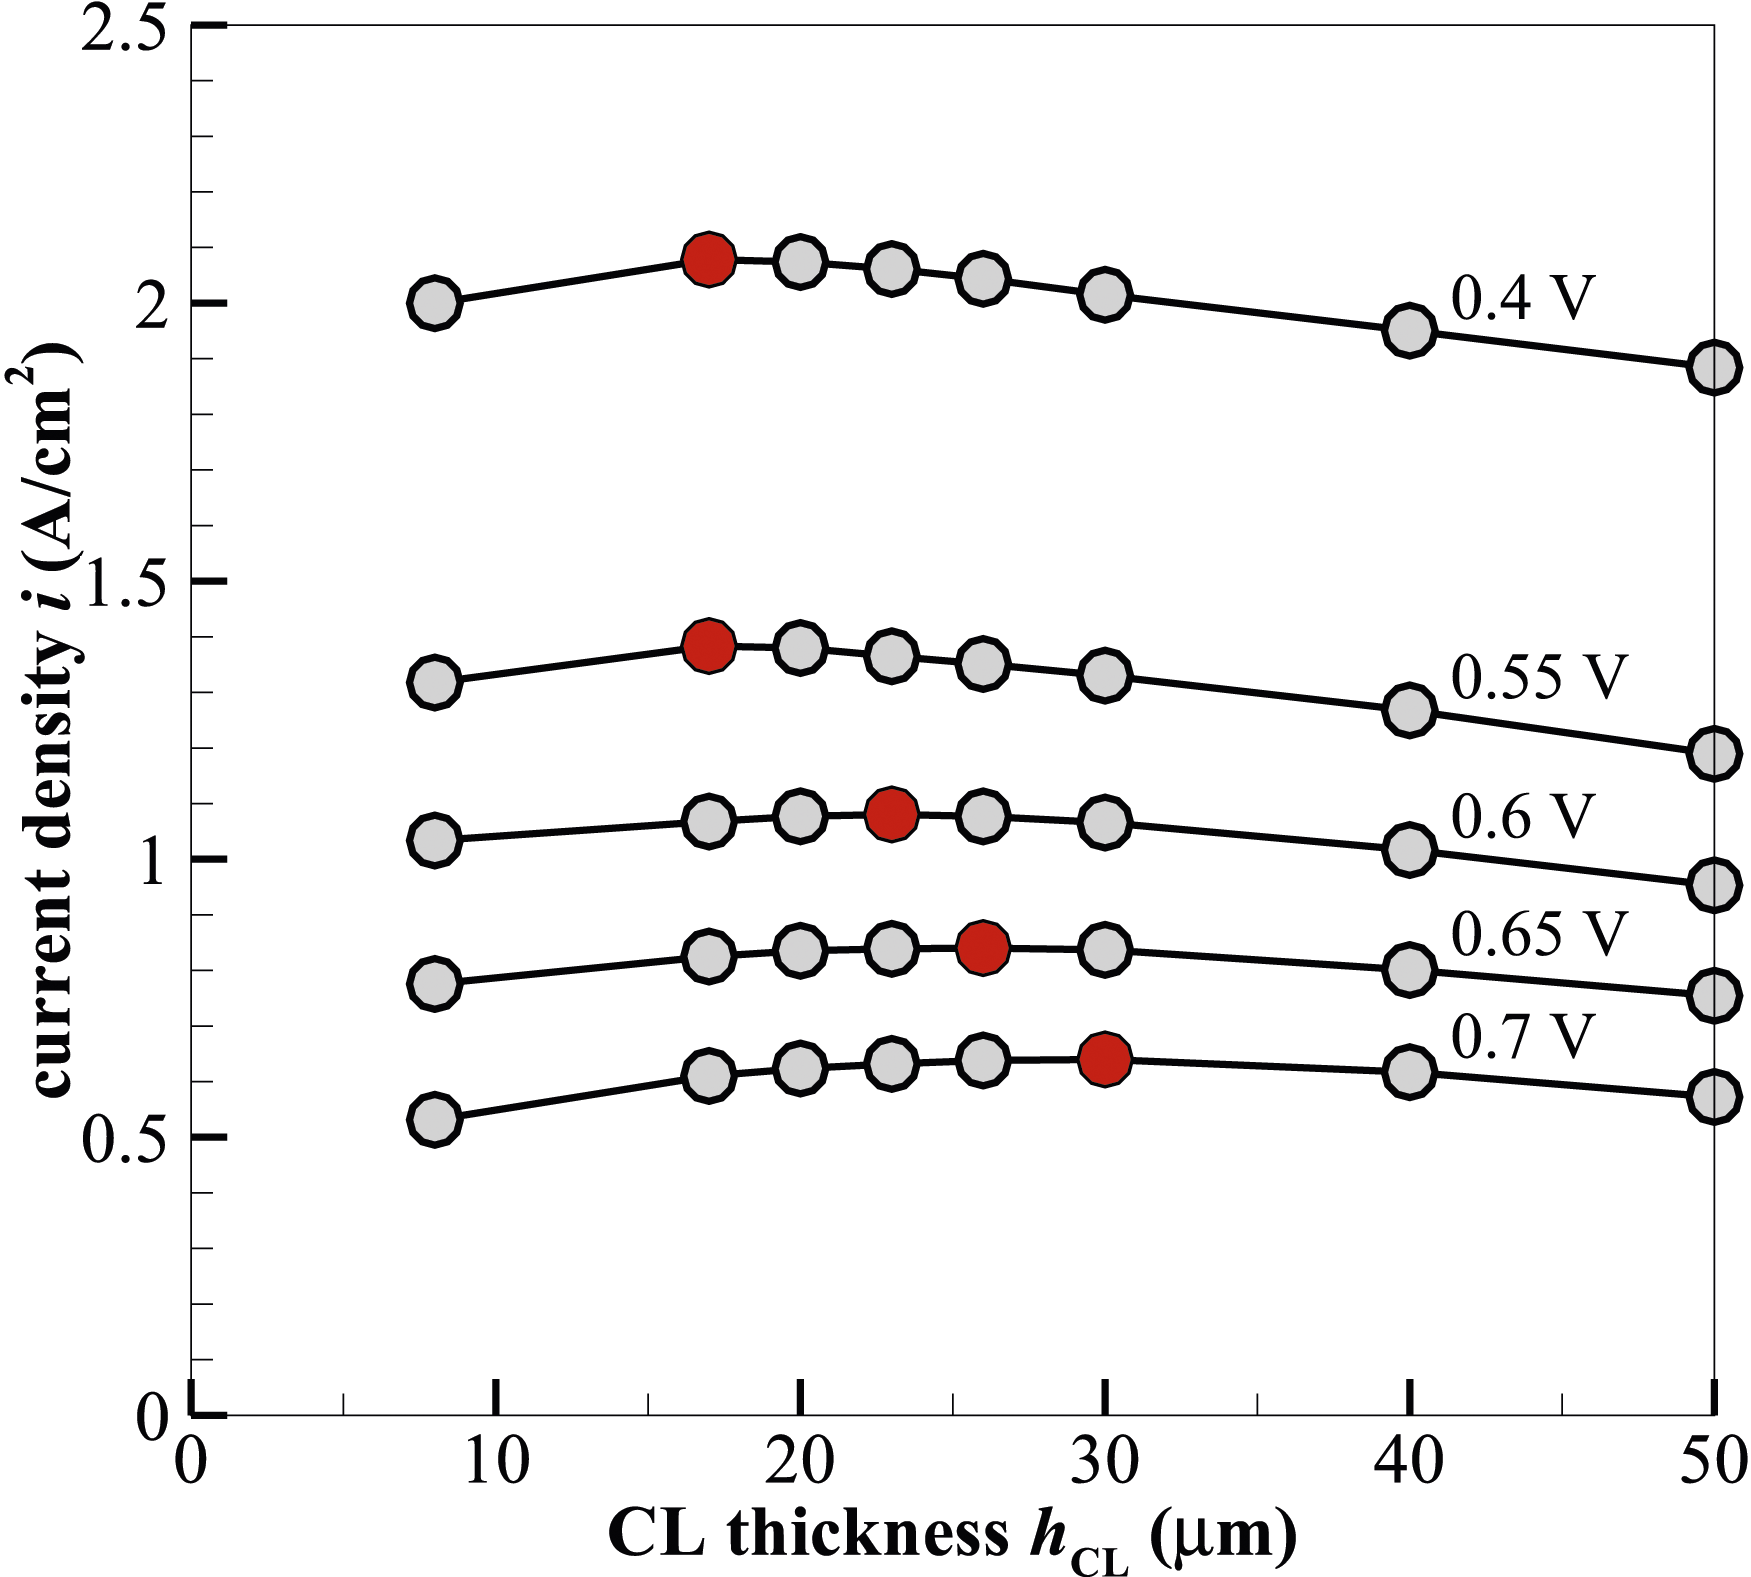
To further understand the current density characteristics, Figure 5 illustrates the variation of the current density i magnitude in the mid X–Y aCL (anode side) – membrane – cCL (cathode side) plane of the PEMFC along the cell depth z direction at hCL = 20 µm and 0.4 V. The current density distribution shows similar characteristics at other CL thicknesses, for example 17 and 30 µm, under the same operating voltage. High current densities are seen in the membrane, with the maximal values located at around the x location where the reactant-gas flow channels ends. The i distribution at higher voltages is not shown, because there are no significant variations along cell width x direction (see Figure 6(b)). Current density magnitudes (A ⋅cm−2) in the mid CL–PEM–CL plane along cell depth z direction under 0.4-V load. hCL = 20 µm. The maximal and minimal values of the shown line contours are given. Current density magnitudes at y = 0.5ycell (in the middle of the membrane along y) and z = 0.5zcell. (a) 0.4 V. (b) 0.7 V.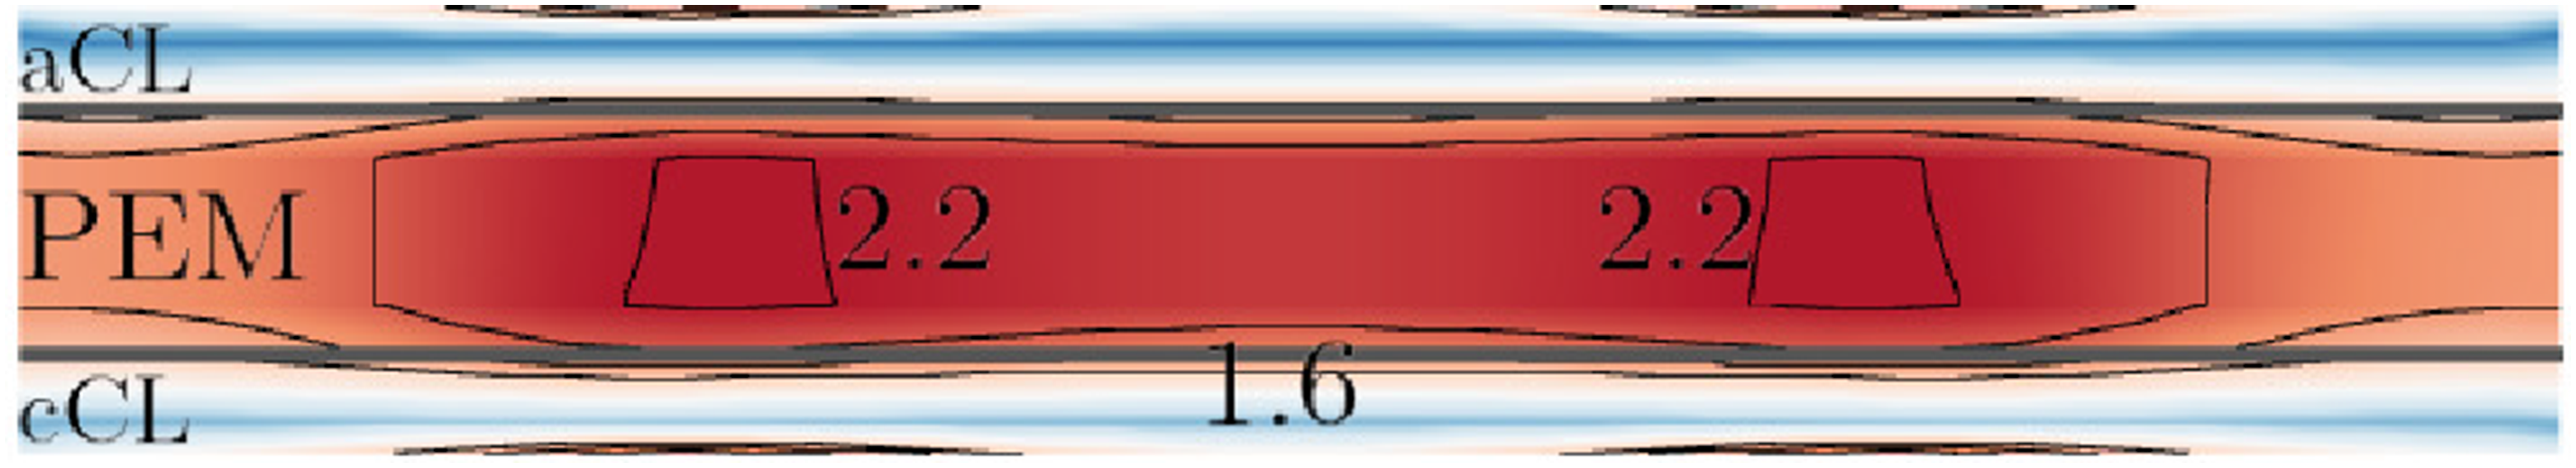
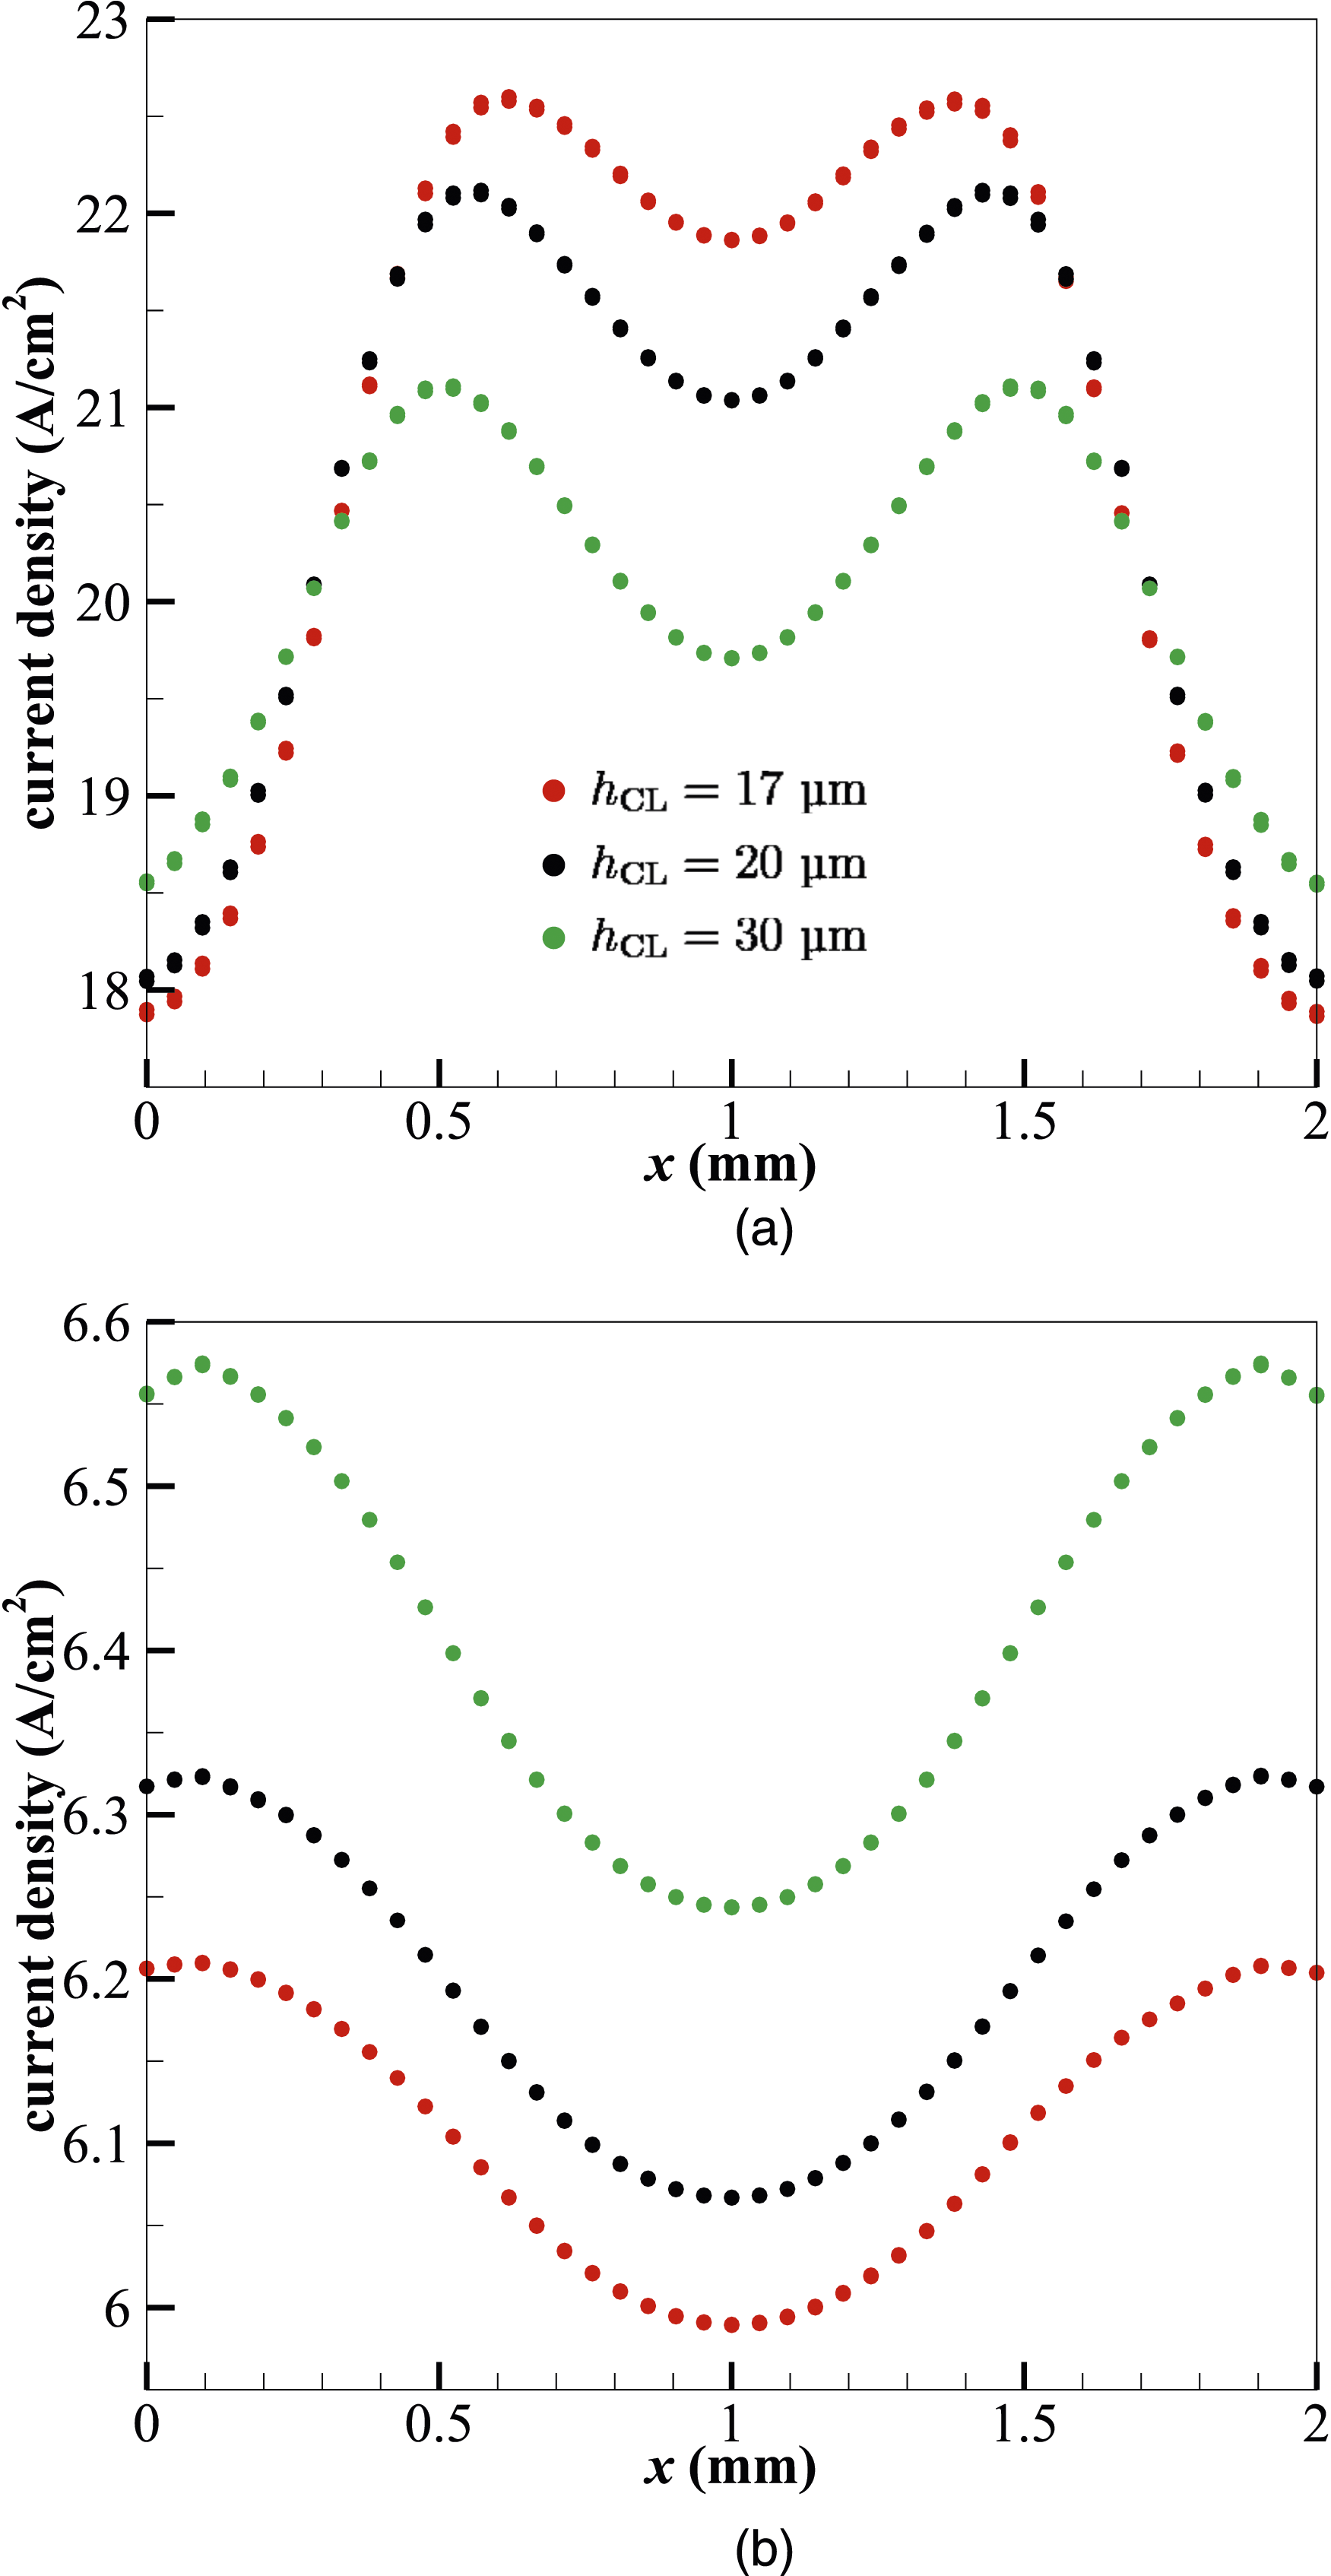
Figure 6 presents the distribution of i along cell width x in the middle of the FC in y and z directions. The plotted line is therefore also in the middle of the membrane along both cell height y and cell depth z directions. It shows the CL thickness hCL affects the current density i in an opposite way under low (0.4 V) and high (0.7 V) voltages, although the effects are more significant at 0.4 V. That is, a thicker CL produces lower i’s at low voltages, while the opposite is true at high voltages. In addition, at 0.4 V, regions of high current densities are located inside the cell; at 0.7 V, these regions are at cell sides.
The molar concentration Molar concentration Molar concentrations 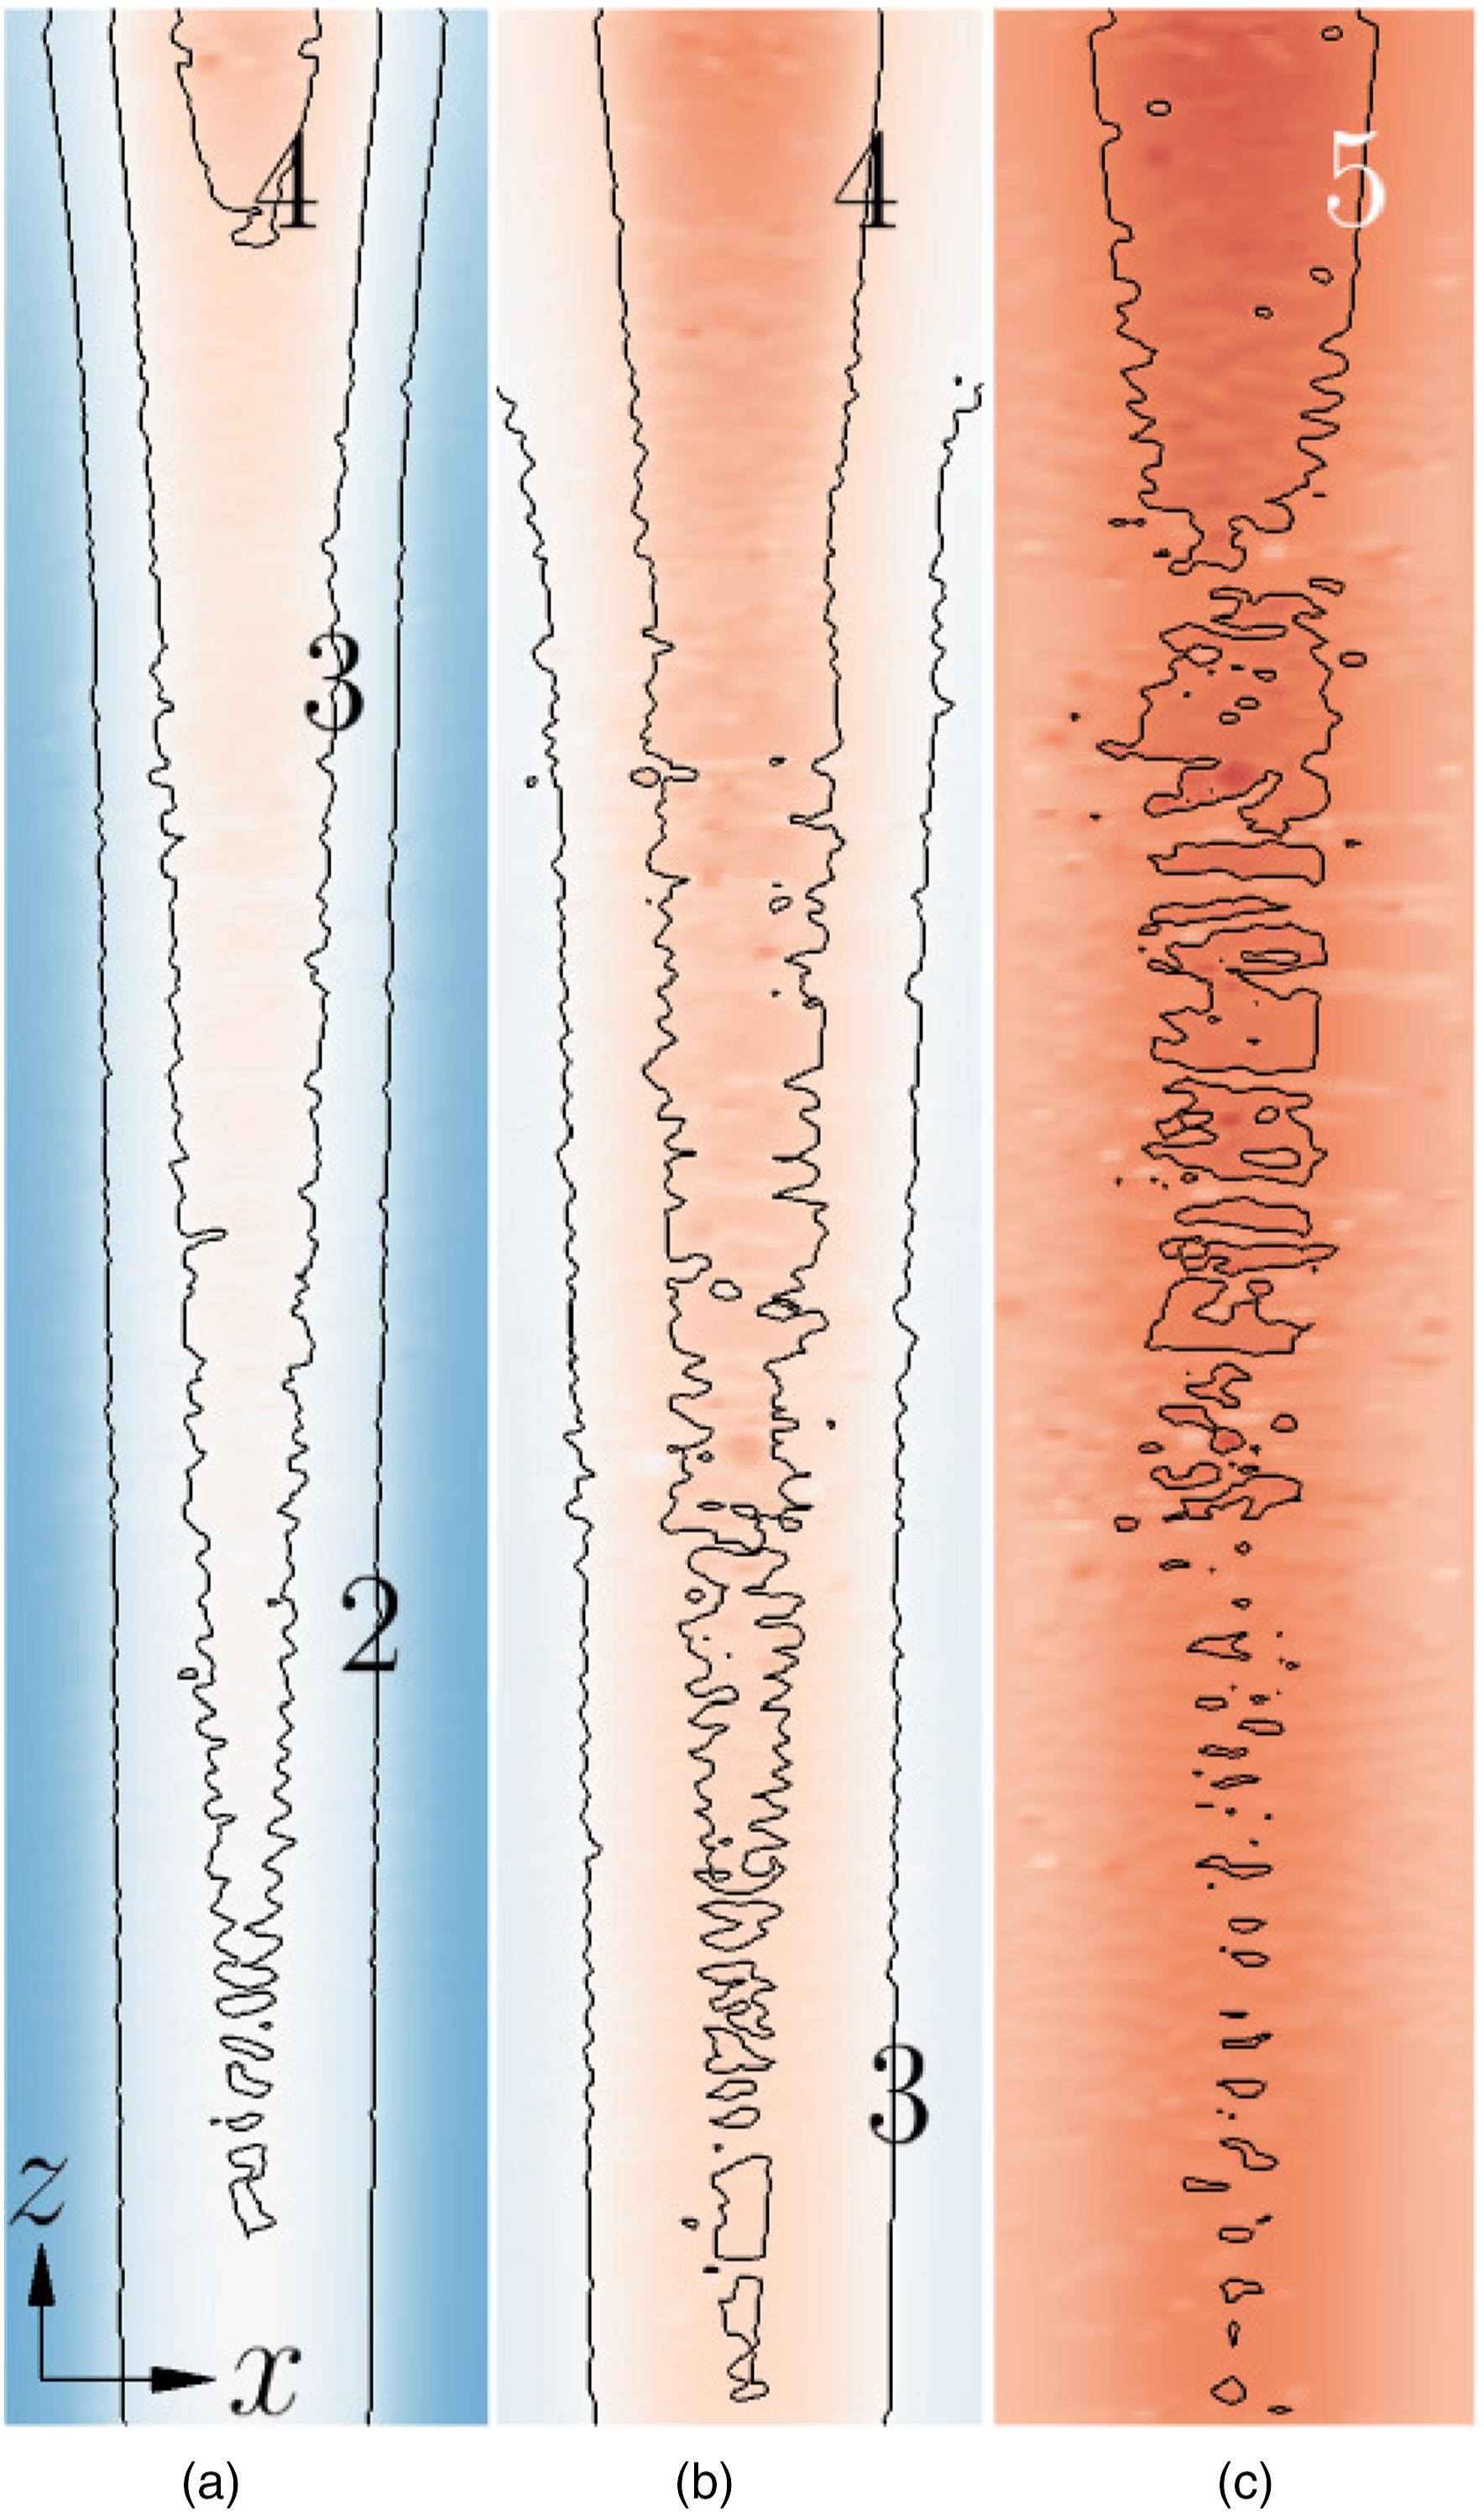
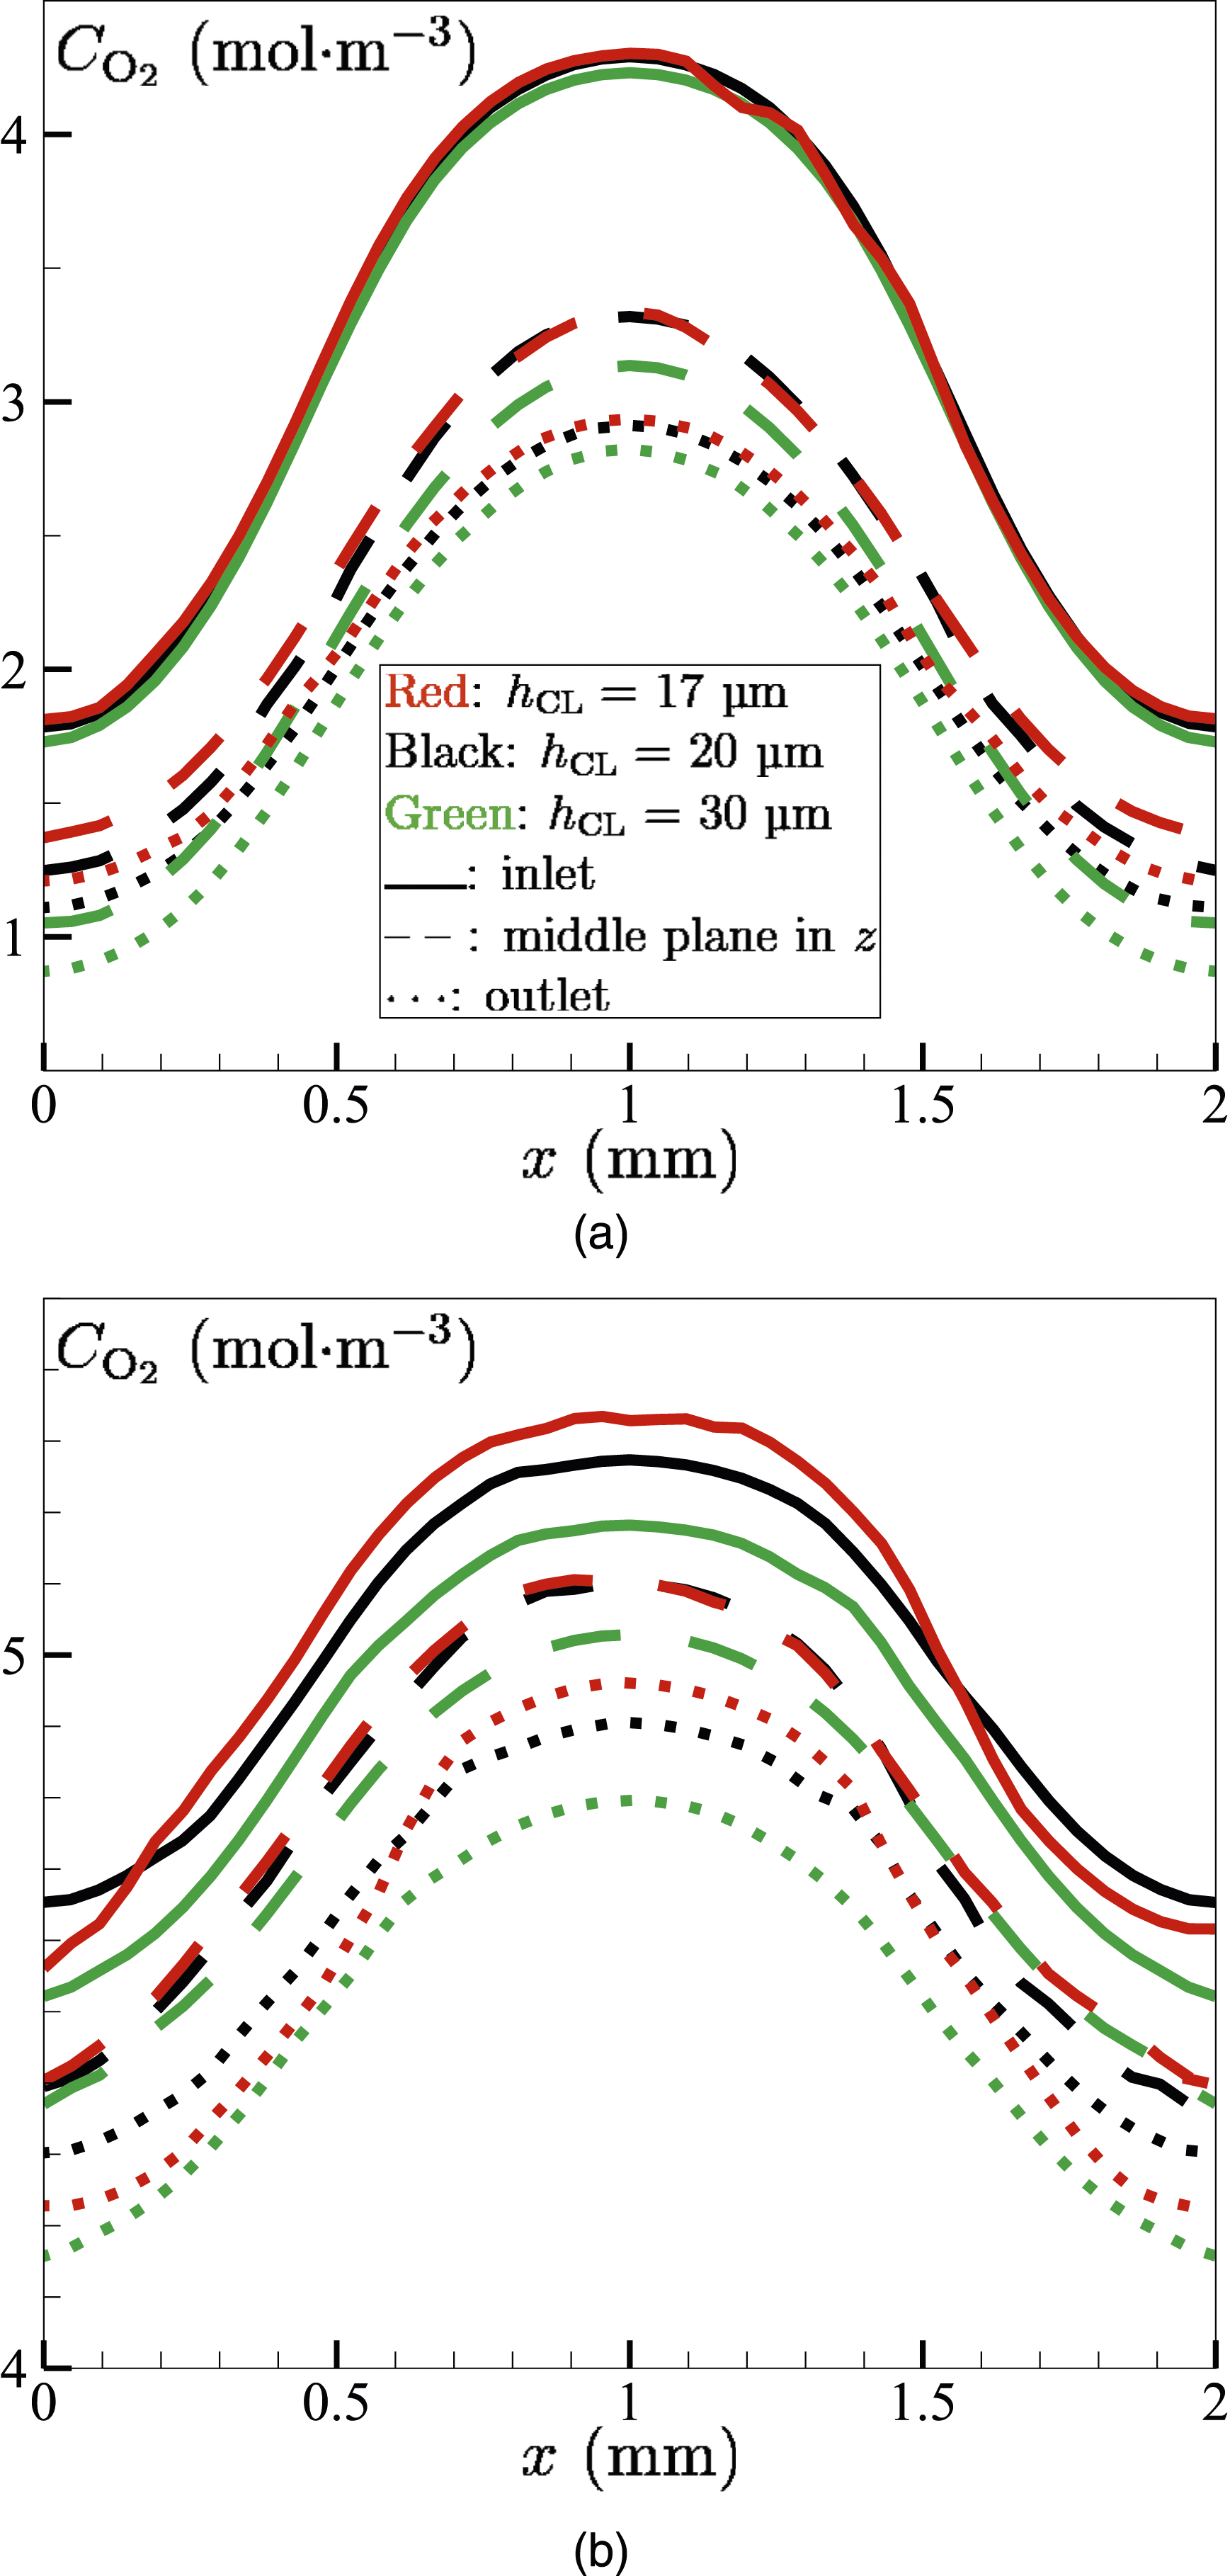
Figure 9 shows the molar concentrations (mol⋅m−3) of oxygen Molar concentration 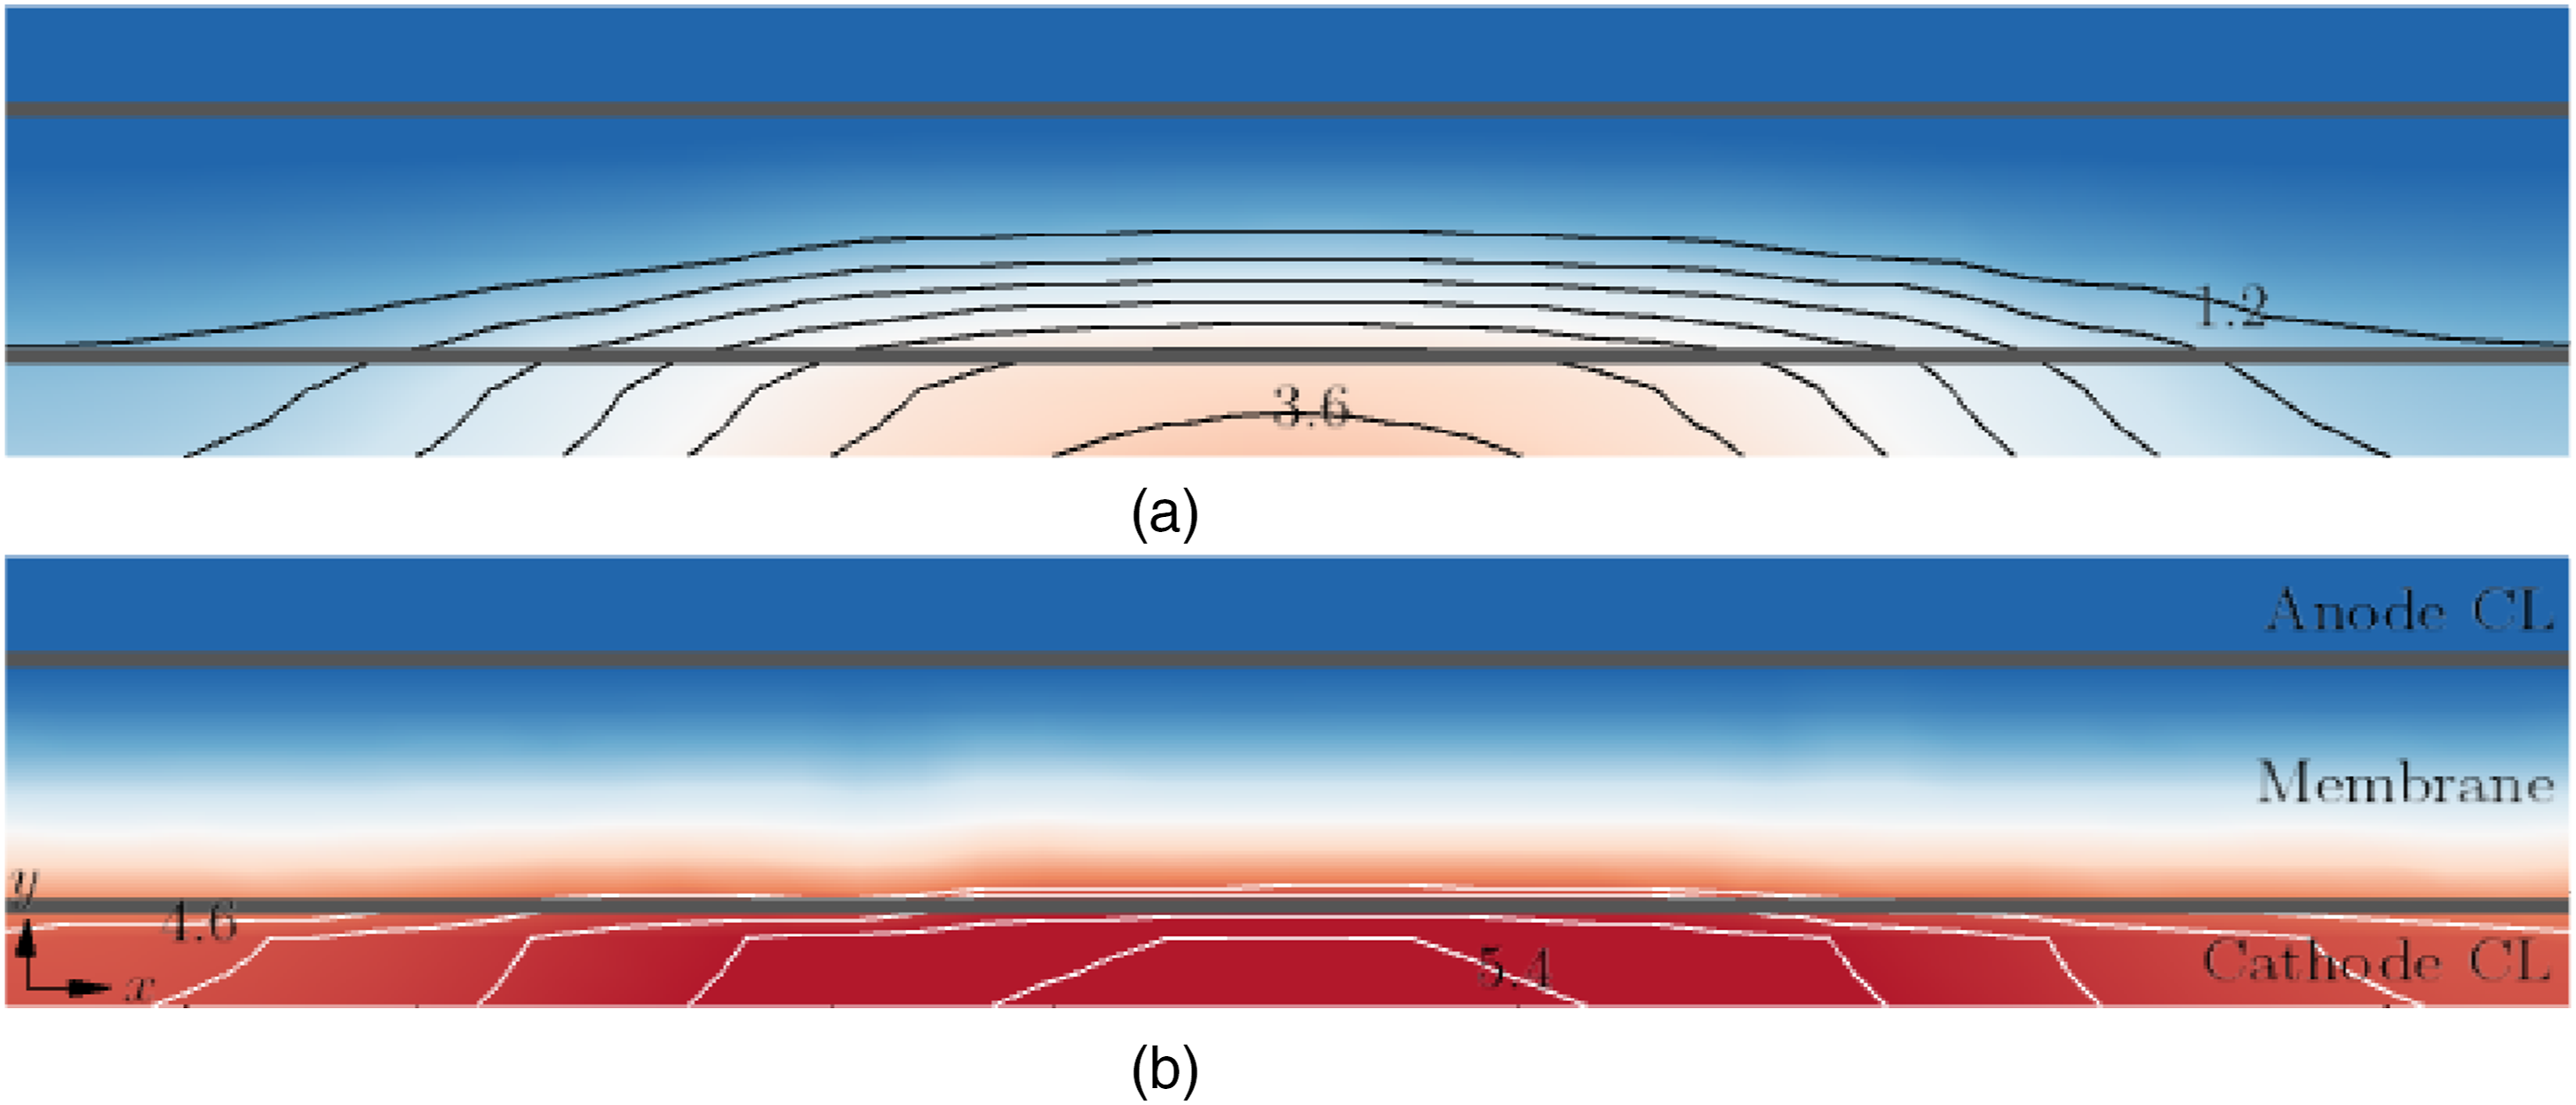
Similar to
For all CL thicknesses,
The overpotential η distributions in the mid X–Y cathode-CL plane along cell depth z at different operating voltages are depicted in Figure 10. The additional voltage needed to propel electrochemical processes beyond the thermodynamic equilibrium potential is referred to as the overpotential,
34
which therefore reflects the losses in the cell and is a crucial factor affecting a PEMFC’s performance and efficiency. It is influenced by both electrochemical kinetics and mass transport limitations. The pace at which these reactions occur is accelerated by a rise in the overpotential, which raises the current density.
34
Figure 10 demonstrates that the overpotential is large at a low voltage 0.4 V, which indicates considerable energy losses as well as a strong driving force to overcome activation energy barriers, especially for the cathode’s sluggish oxygen reduction process. The overpotential drops as the voltage rises to 0.7 V, leading to a weakening of the electrochemical processes’ driving power, which lowers the current density. Overpotential η (mV) in the mid CL plane along the cell depth z direction. hCL = 20 µm. The maximal and minimal values of the shown line contours are given. (a) 0.4 V. (b) 0.55 V. (c) 0.7 V.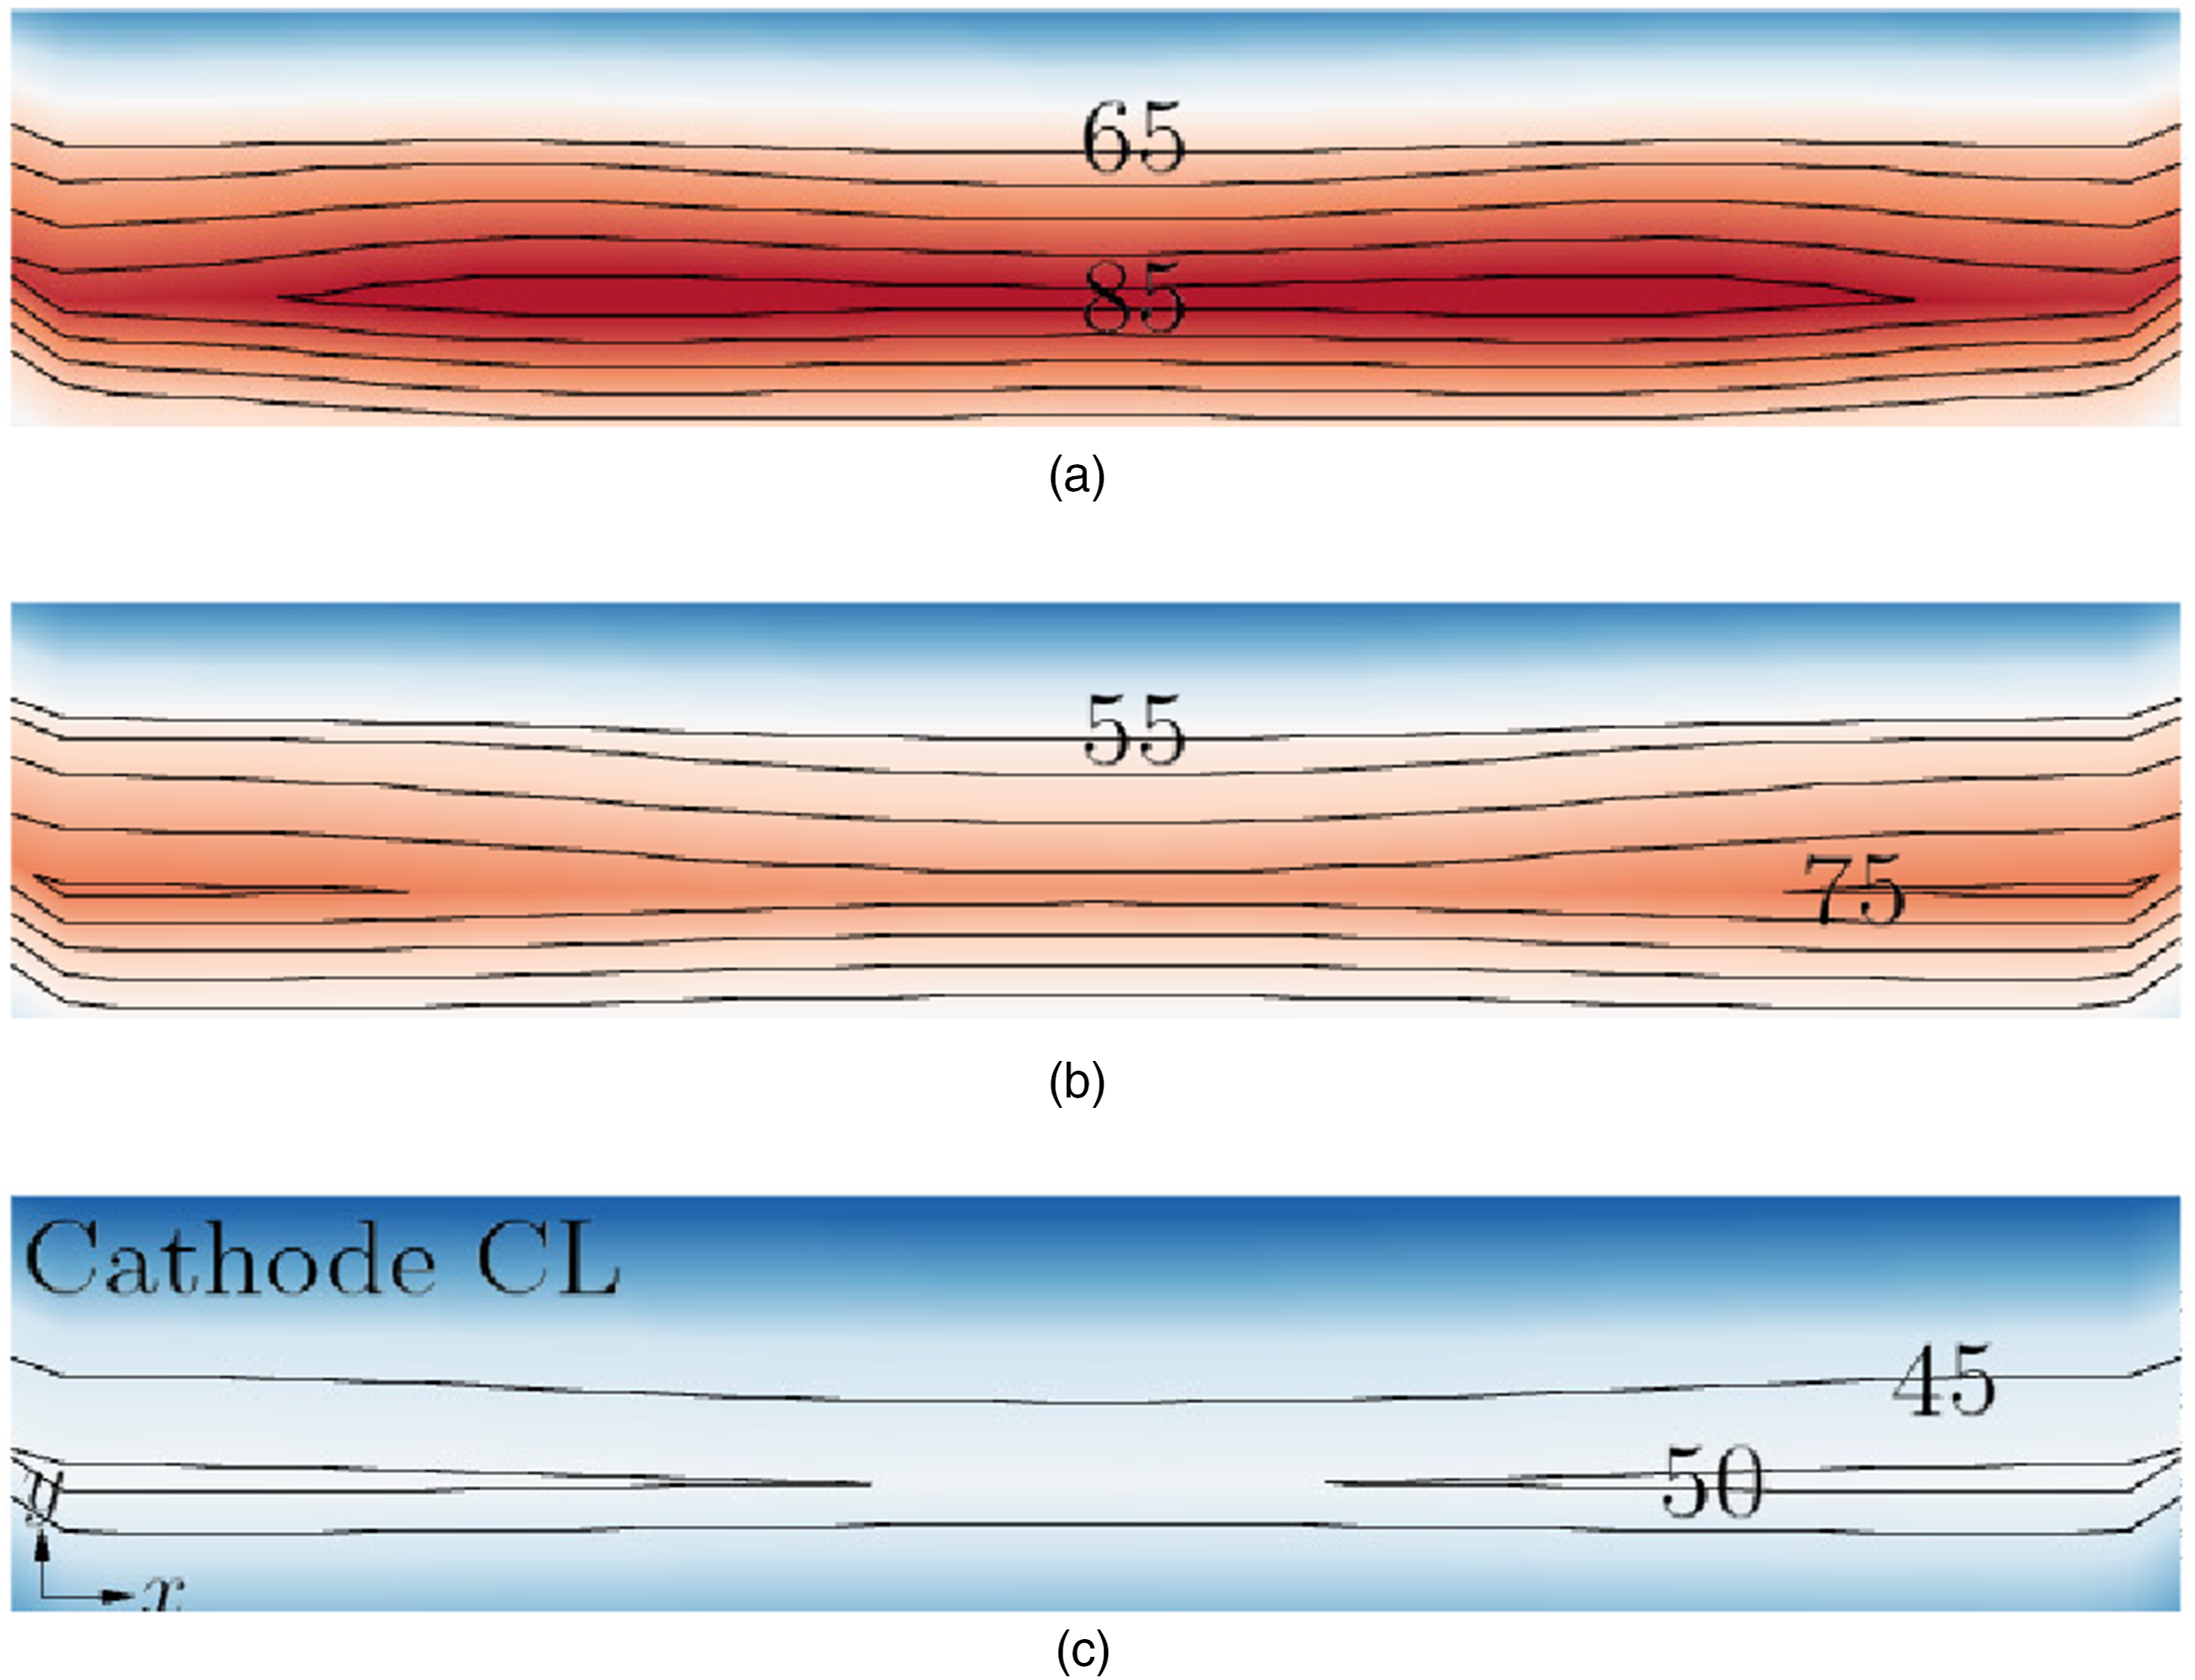
The temperature profiles across cell width x at the membrane/cathode–CL interface plane show a similar profile at the inlet, middle and outlet of the cell along z for all the CL thicknesses (not shown), with
Figure 11 shows the molar concentration of water Molar concentration Molar concentration (mol⋅m−3) of water 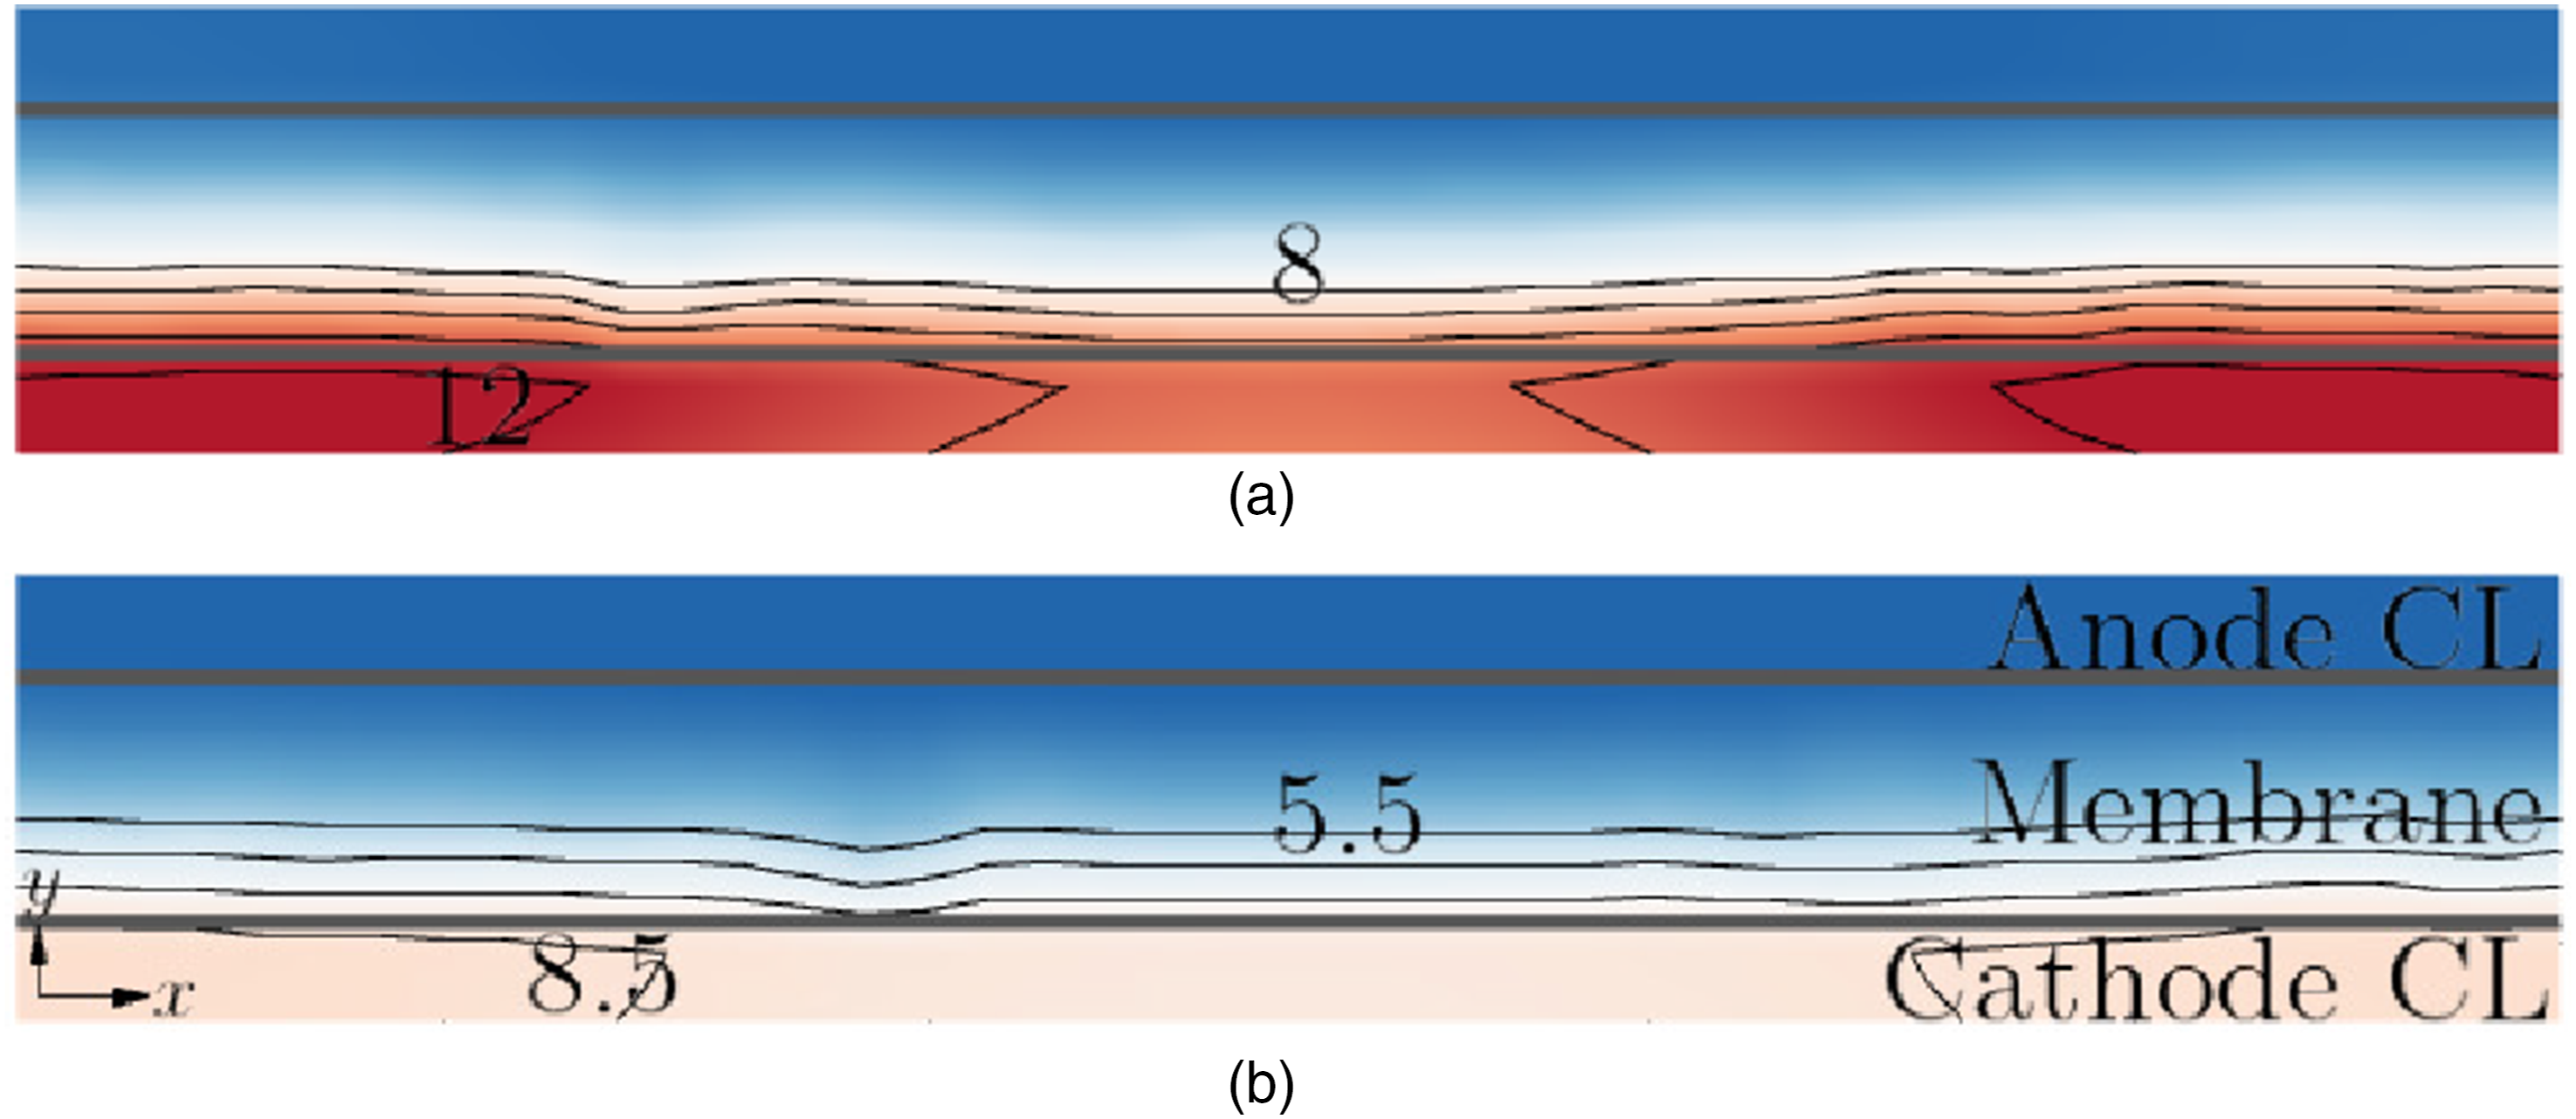
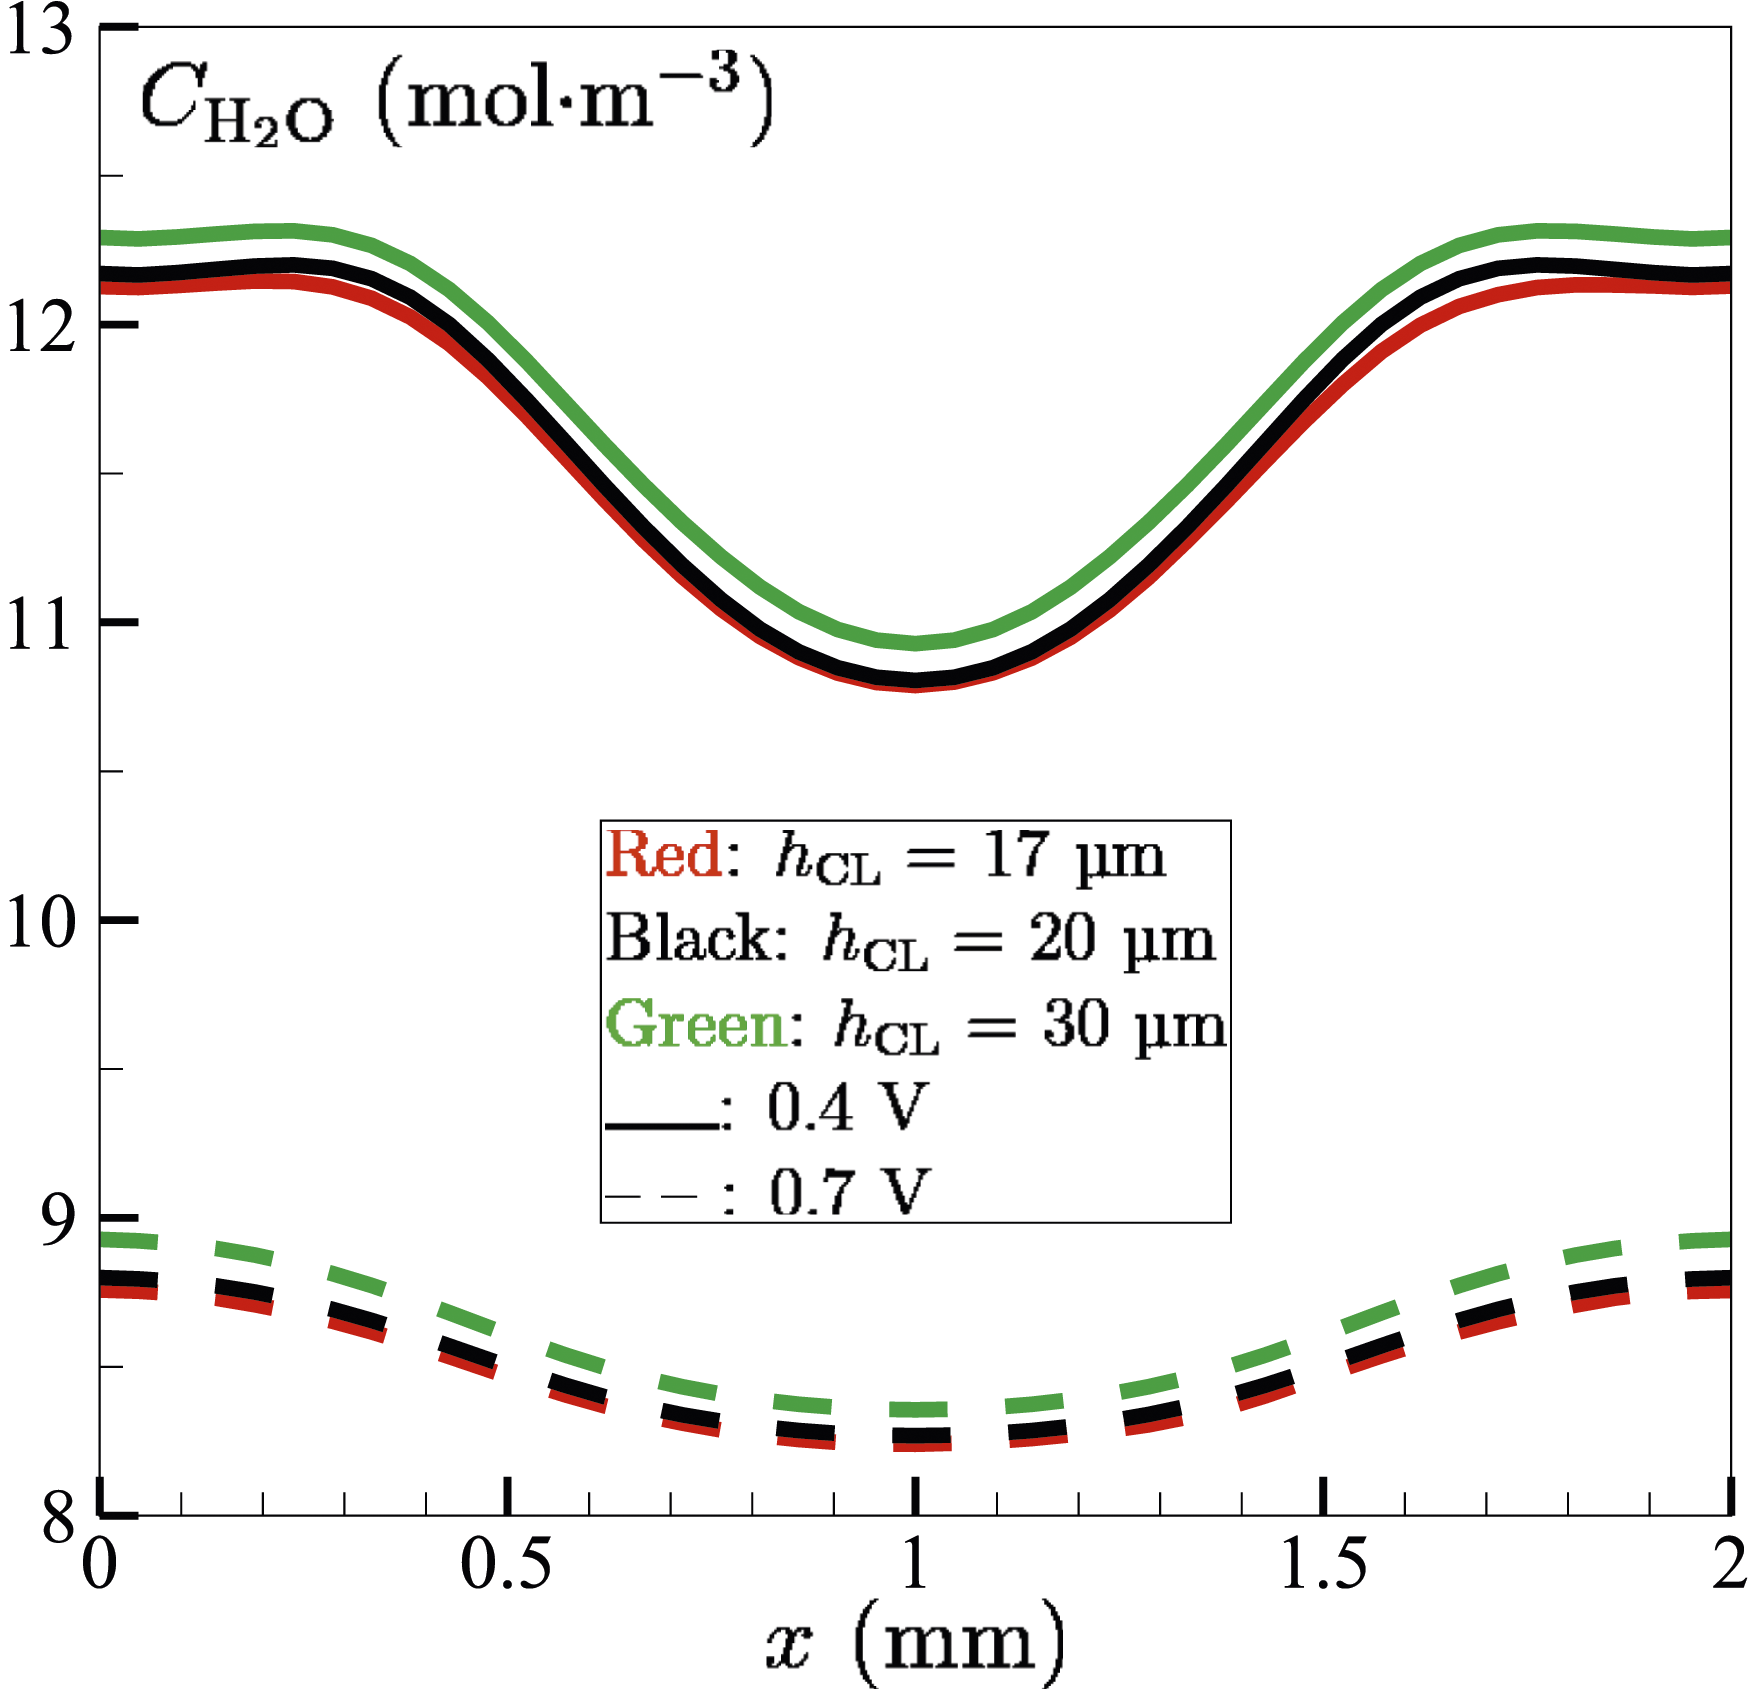
It is interesting to note that
The measured trends of oxygen concentration, overpotential, and temperature distribution are coherent with the general performance of PEMFCs and current density variation. Lower voltages, in this case, 0.4 V, show higher current densities due to enhanced electrochemical reaction rates and consequent higher oxygen consumption, higher overpotential, and higher temperatures; while these factors are also responsible for larger losses. There is an improvement in initial performance with catalyst layer thickness owing to increased catalyst utilisation and the reaction surface area. However, performance starts to deteriorate beyond a certain thickness due to diffusional limitations and transport resistances, which hinder reactant availability, increasing the resistance of proton transfer to the membrane. At higher voltages, the performance decreases because the reaction rates drop, which can be observed by lower current densities due to reduced oxygen consumption and overpotential. Thicker catalyst layers have high mass transport resistances; hence, the performance is poor compared to thinner layers. These observations underline the importance of optimising the thickness of the catalyst layer in achieving balanced catalyst utilisation and reactant transport for the best PEMFC performance across various operating voltages.
Membrane optimisation
Figure 13 depicts the variation of current density i with the thickness hPEM of the proton exchange membrane under various loads. The membrane’s principal function is to transport protons from the anode to the cathode, meanwhile blocking the passage of electrons and reactant gases. As the membrane thickens, the path that protons must travel through grows longer, creating a more difficult barrier for proton diffusion. This higher resistance can directly affect the pace of electrochemical processes, resulting in a lower current density. As observed in the figure, the current density drops when the membrane thickness increases under any operating voltage. The drop is more marked at lower voltages, and thinner membranes show much higher current densities. For instance, at 0.4 V, the current density is ∼4 A⋅cm−2 at hPEM = 8 µm. While at hPEM = 75 µm, i ∼ 1.5 A⋅cm−2. This inverse relationship relates to the fact that thinner membranes offer less protonic resistance, hence conduction of protons becomes much more accessible from the anode to the cathode. Accordingly, the electrochemical reactions take place at a faster rate, thus promoting operation at high current densities. Examining the performance under different voltages shows that higher voltages tend to show lower current densities at any given membrane thickness. This is because the overall resistance, including ohmic and activation losses, also grows at higher applied voltages. At hPEM = 8 µm under 0.7 V, the current density is 1.3 A ⋅cm−2. Whereas, for a 75-µm membrane, i < 0.5 A ⋅cm−2 under the same operating voltage. This indicates that thinner membranes are consistently superior at sustaining greater performance levels at different operating voltages. We aim to identify a membrane thickness that provides for a good balance between the conduction of protons and mechanical stability. hPEM = 48 µm is chosen. This choice balances the needs of maintaining a high current density and mechanical robustness, which is required for long-term operation and reliability of the fuel cell. At hPEM = 48 µm, the current density remains relatively high at practically all voltage levels. The remaining transport layers, including MPL and GDL, will be further optimised with hPEM = 48 µm (and hCL = 20 µm). Current density i variation with membrane thickness hPEM under different operating voltages.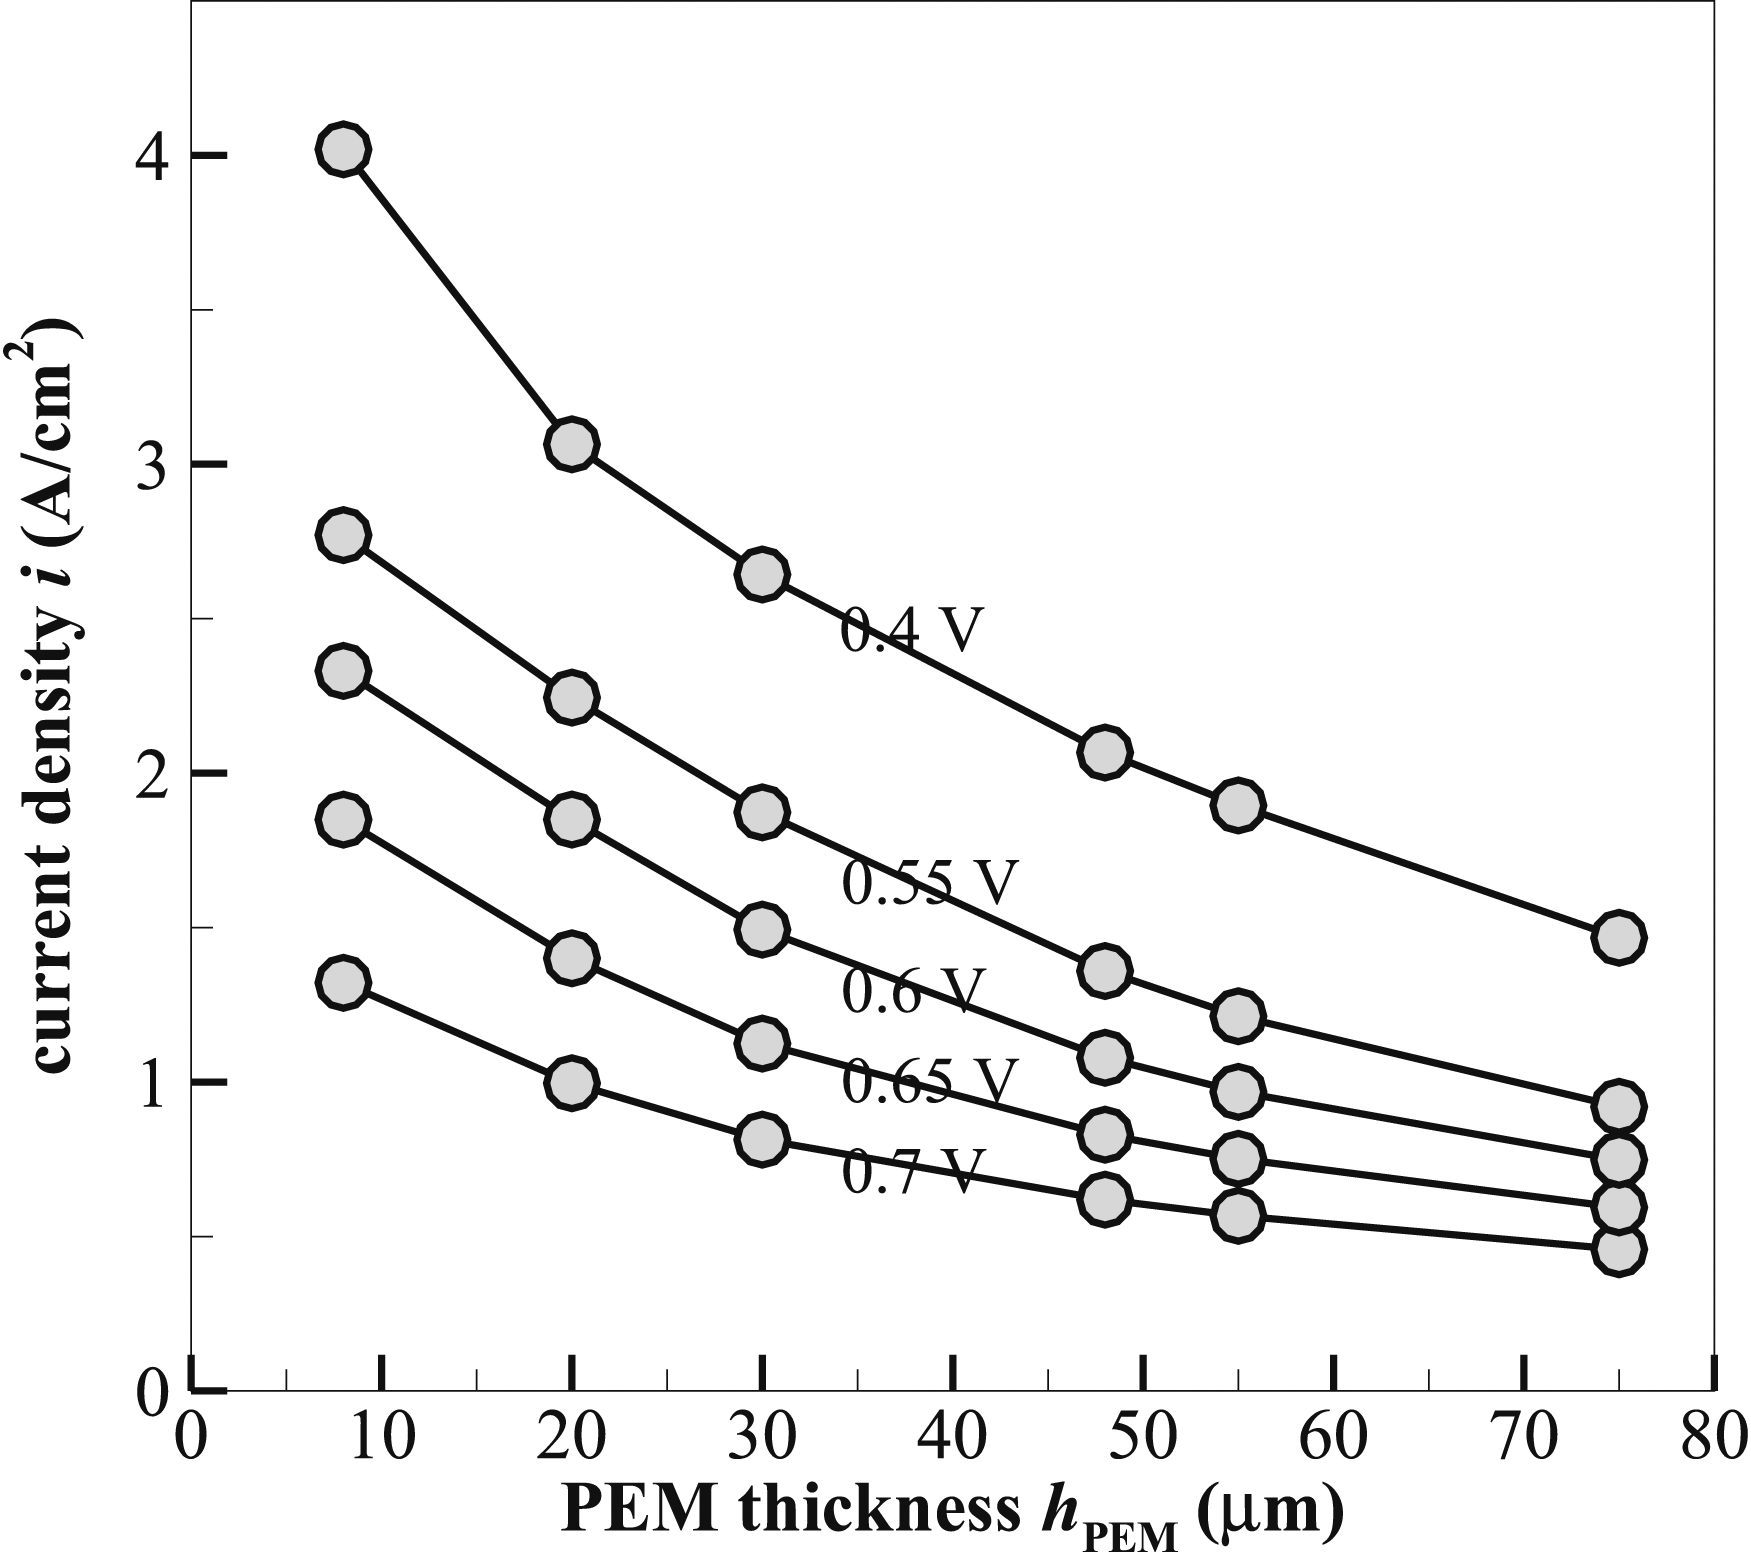
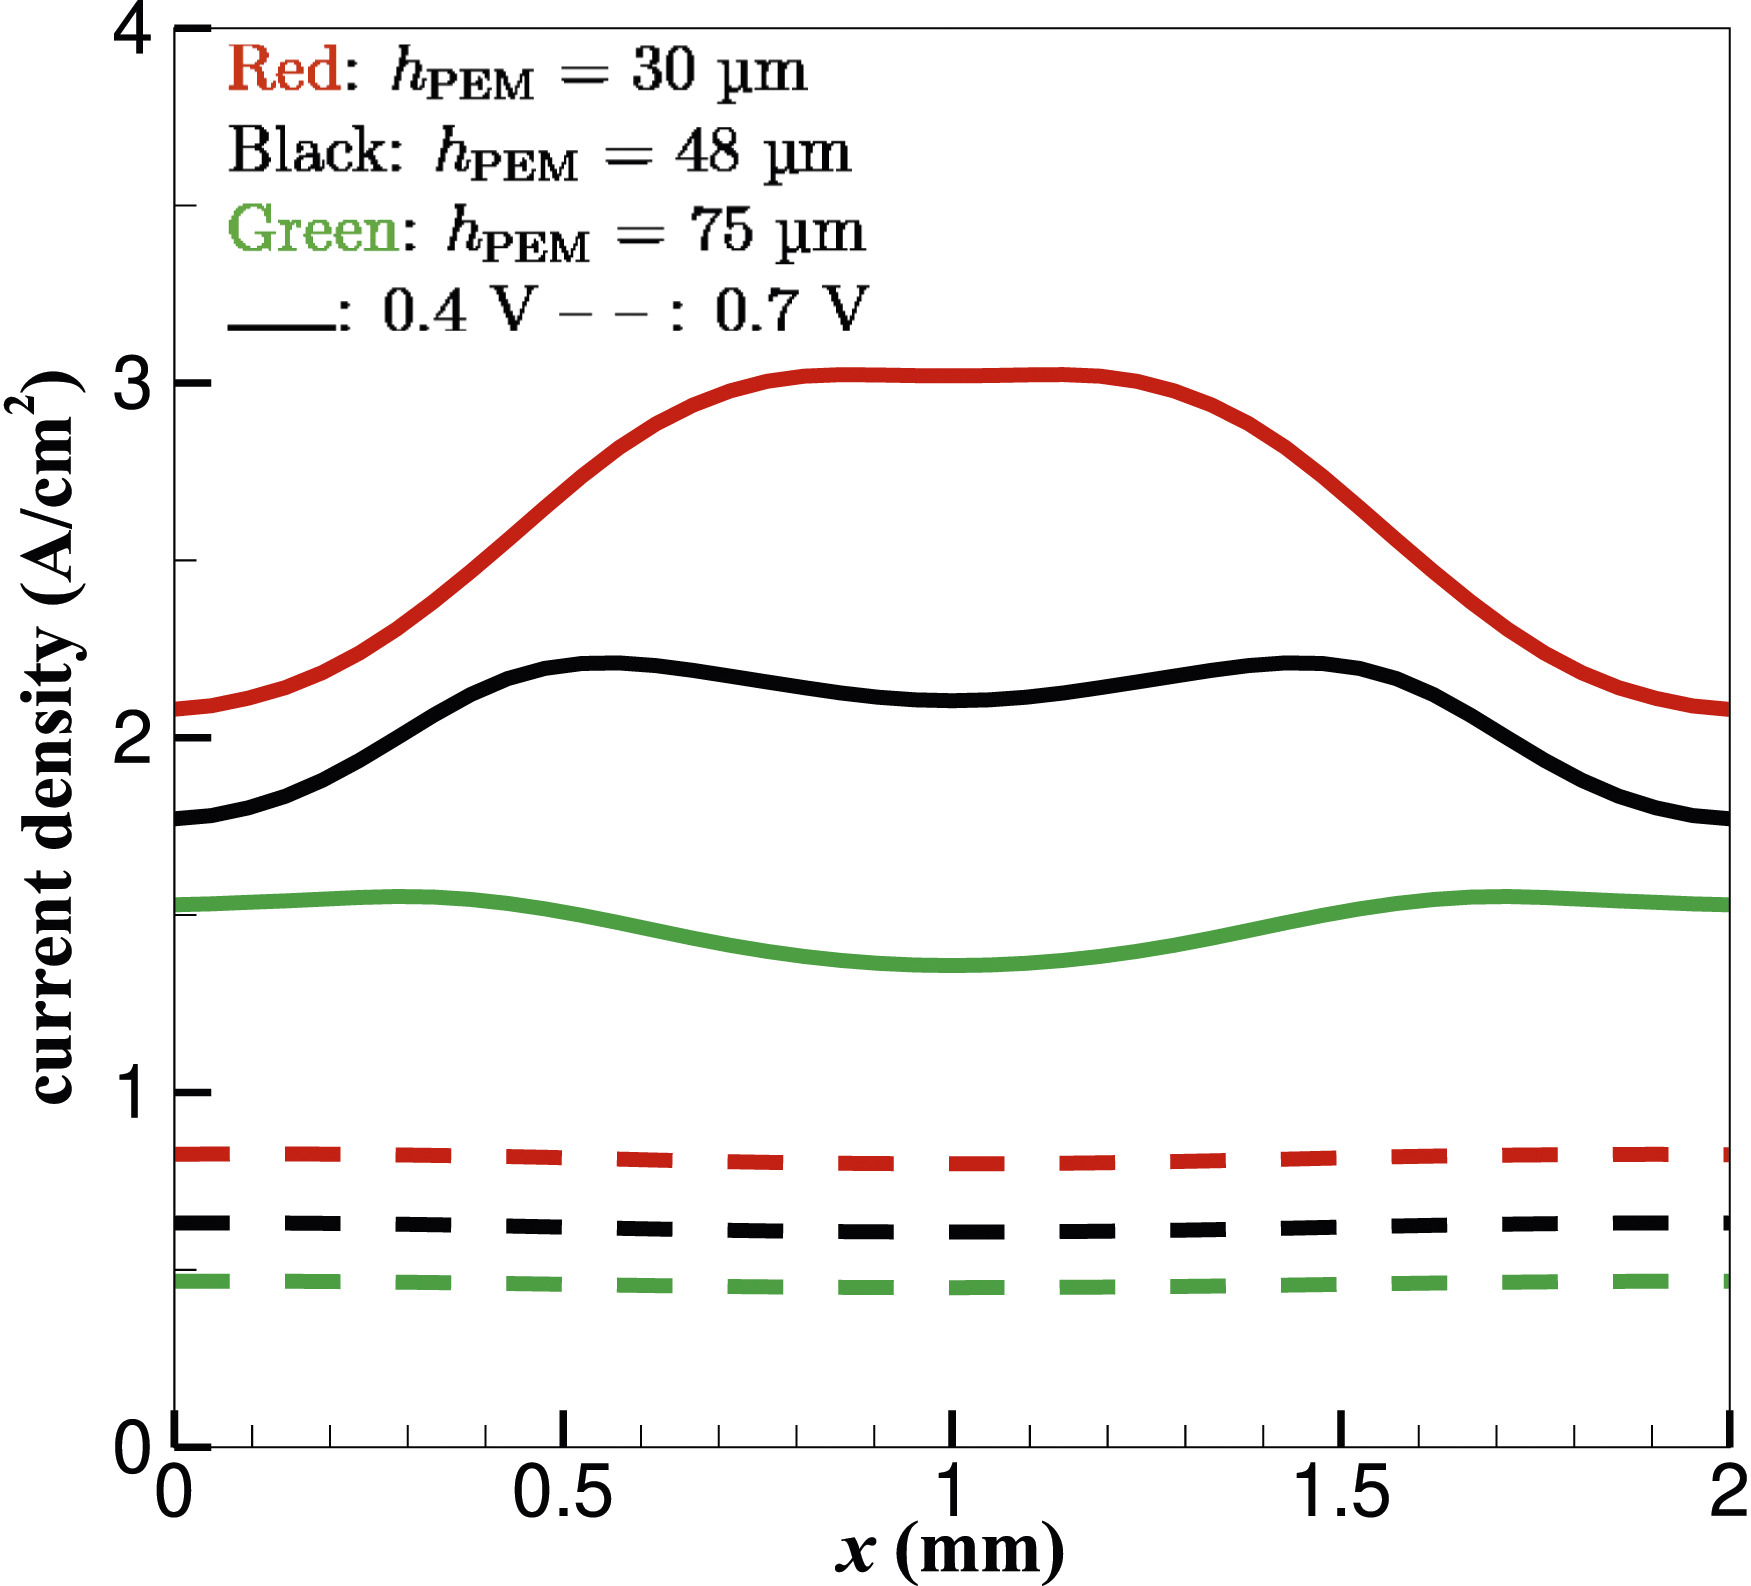
The distribution of the current density inside the membrane at hPEM = 30 µm under 0.4 V is depicted in Figure 14. The 2D contours are drawn for the mid X–Y membrane plane along the cell-depth z direction. The current density magnitude declines as the membrane thickness increases at 0.4 V [refer to Figure 5 for |i| at hPEM = 48 µm (and hCL = 20 µm)]. Figure 14 demonstrates that with a thinner PEM, the highest |i| is found in the central region of the PEM, compared to a double-peak distribution inside a thicker membrane shown in Figure 5, where the peak magnitudes appear in regions above and beneath the edges of the H2 and air flow channels along the cell-width x direction, respectively. Figure 15 shows as the membrane further thickens (e.g. at hPEM = 75 µm), |i| is minimal in the central region of the PEM, although the magnitude difference diminishes in x direction compared to thinner-PEM cases. At 0.7 V, the current density magnitude is overall much lower than at 0.4 V. Regardless of membrane thickness, therefore, the current density drops at higher voltages. Higher current densities are possible through thinner membranes, especially at lower voltages. At 0.7 V, |i| is always higher towards cell boundaries in x direction than in the central region of the PEM, although with a small ∼4% difference. Current density magnitudes (A⋅cm−2) in the mid PEM plane along cell depth z direction under 0.4-V load. hPEM = 30 µm. The maximal and minimal values of the shown line contours are given. Current density magnitudes at y = 0.5ycell and z = 0.5zcell.
The variation of the molar concentration Molar concentration (mol⋅m−3) of water 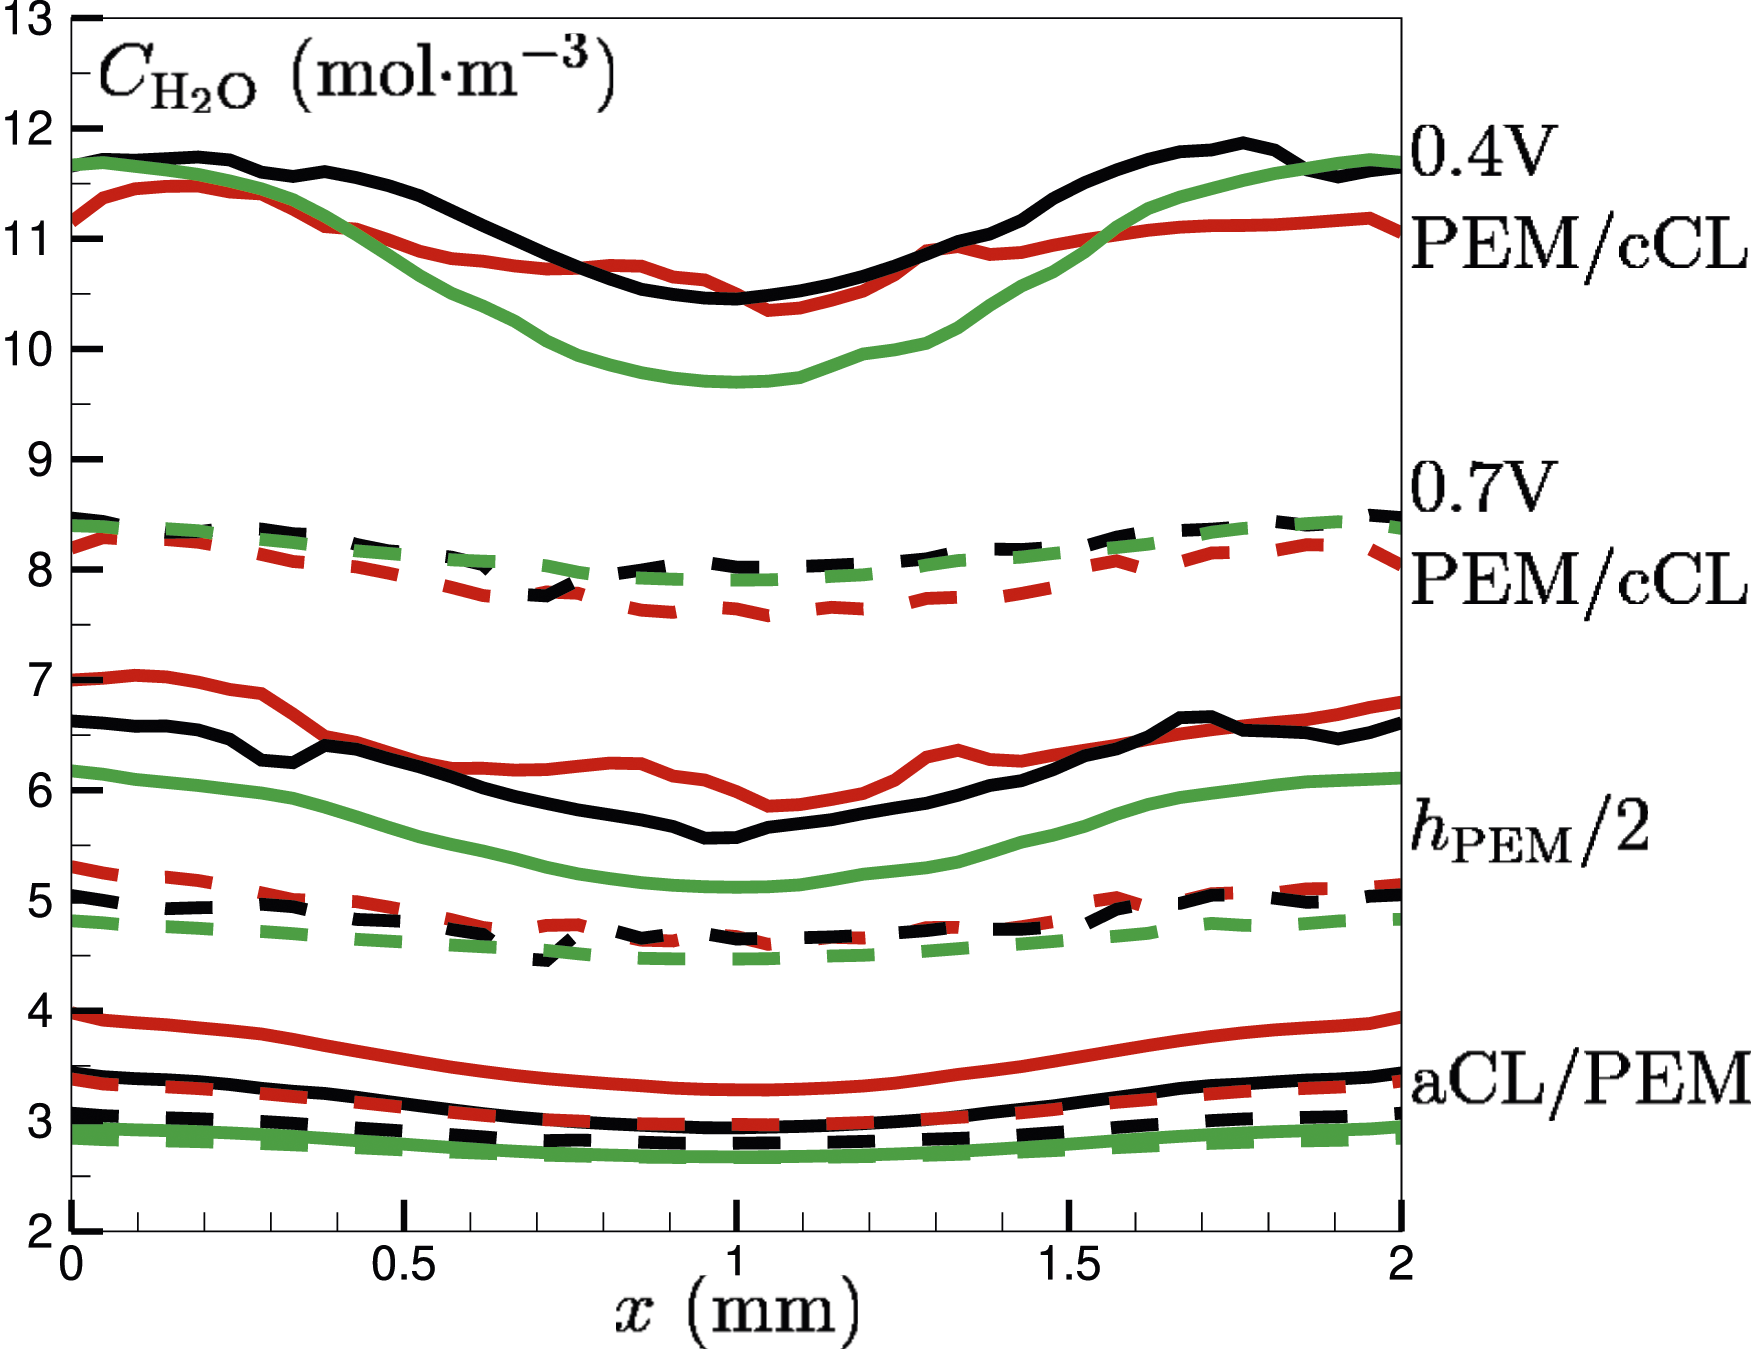
It can be seen that towards the x-boundaries of the fuel cell,
Overall, an increase in membrane thickness is directly accompanied by a decrease in water concentration and current density (see Figure 15) of the fuel cell. Current density depends on factors such as proton conductivity and reactant availability. Thick membranes, which are favourable for the volume of water being retained, exhibit high ionic resistance due to the extended diffusive pathway for protons. This increased resistance will impede proton diffusion and hence lead to the reduction of overall current density, as shown in Figure 15.
At a lower potential difference of 0.4 V,
Overall, the thickness of the proton-exchange membrane in a fuel cell is thus directly related to the resistance to proton transport across it, and has a marked effect on the net transport of water across the membrane. The effect identified here is to allow more water to diffuse from the anode to cathode side as the membrane is made thinner. On the other hand, the elevated water formation may rapidly dehydrate the anode side, consequently increasing ohmic overpotential loss. Although reducing membrane thickness could improve cell performance by reducing the resistance to proton transport and increasing cell voltage, one would have to pay special attention to water management to avoid dehydration-induced overpotential losses. 36
Gas-diffusion-layer optimisation
Water transport between the CL and GDL is balanced by the MPL. In this study, we have seen that the overall current density does not vary significantly with the MPL thickness hMPL (not shown). Especially at higher voltages (≥0.55 V), the current density variation is
The relationship between the GDL thickness hGDL and current density at different operating voltages is shown in Figure 17. The graph demonstrates that the current density changes dramatically with the GDL thickness, especially at lower voltages. For the lowest voltage 0.4 V, the current density increases sharply with an increasing GDL thickness up to ∼350 µm, where i reaches 2.1 A⋅cm−2, after which it begins to decrease. At other intermediate voltages, for example 0.55 V, the current density reaches a maximum value ∼2.07 A⋅cm−2 at a thickness of 240 µm, but starts to flatten out with a small decreasing trend. Similarly, at 0.6 V, the current density starts to level out at a GDL thickness of 120 µm after reaching a high of 1.08 A⋅cm−2. There seems to be an optimum thickness of the GDL that maximises performance, but an extra thickness in the GDL does not contribute to further improvement in performance. At higher voltages including 0.65 and 0.7 V, the corresponding current density is significantly lower, with much less dependence on the GDL thickness. The current density varies by almost the same little increment with an increasing GDL thickness, followed by nearly constant values. The trends obtained make a GDL thickness of 240 µm more justifiable for the rest of the analyses. The current density for intermediate voltages peaks at ∼240 µm and remains constant towards higher voltages. This thickness finds a compromise between preserving structural integrity and allowing enough gas diffusion. Current density i variation with GDL thickness hGDL under different operating voltages.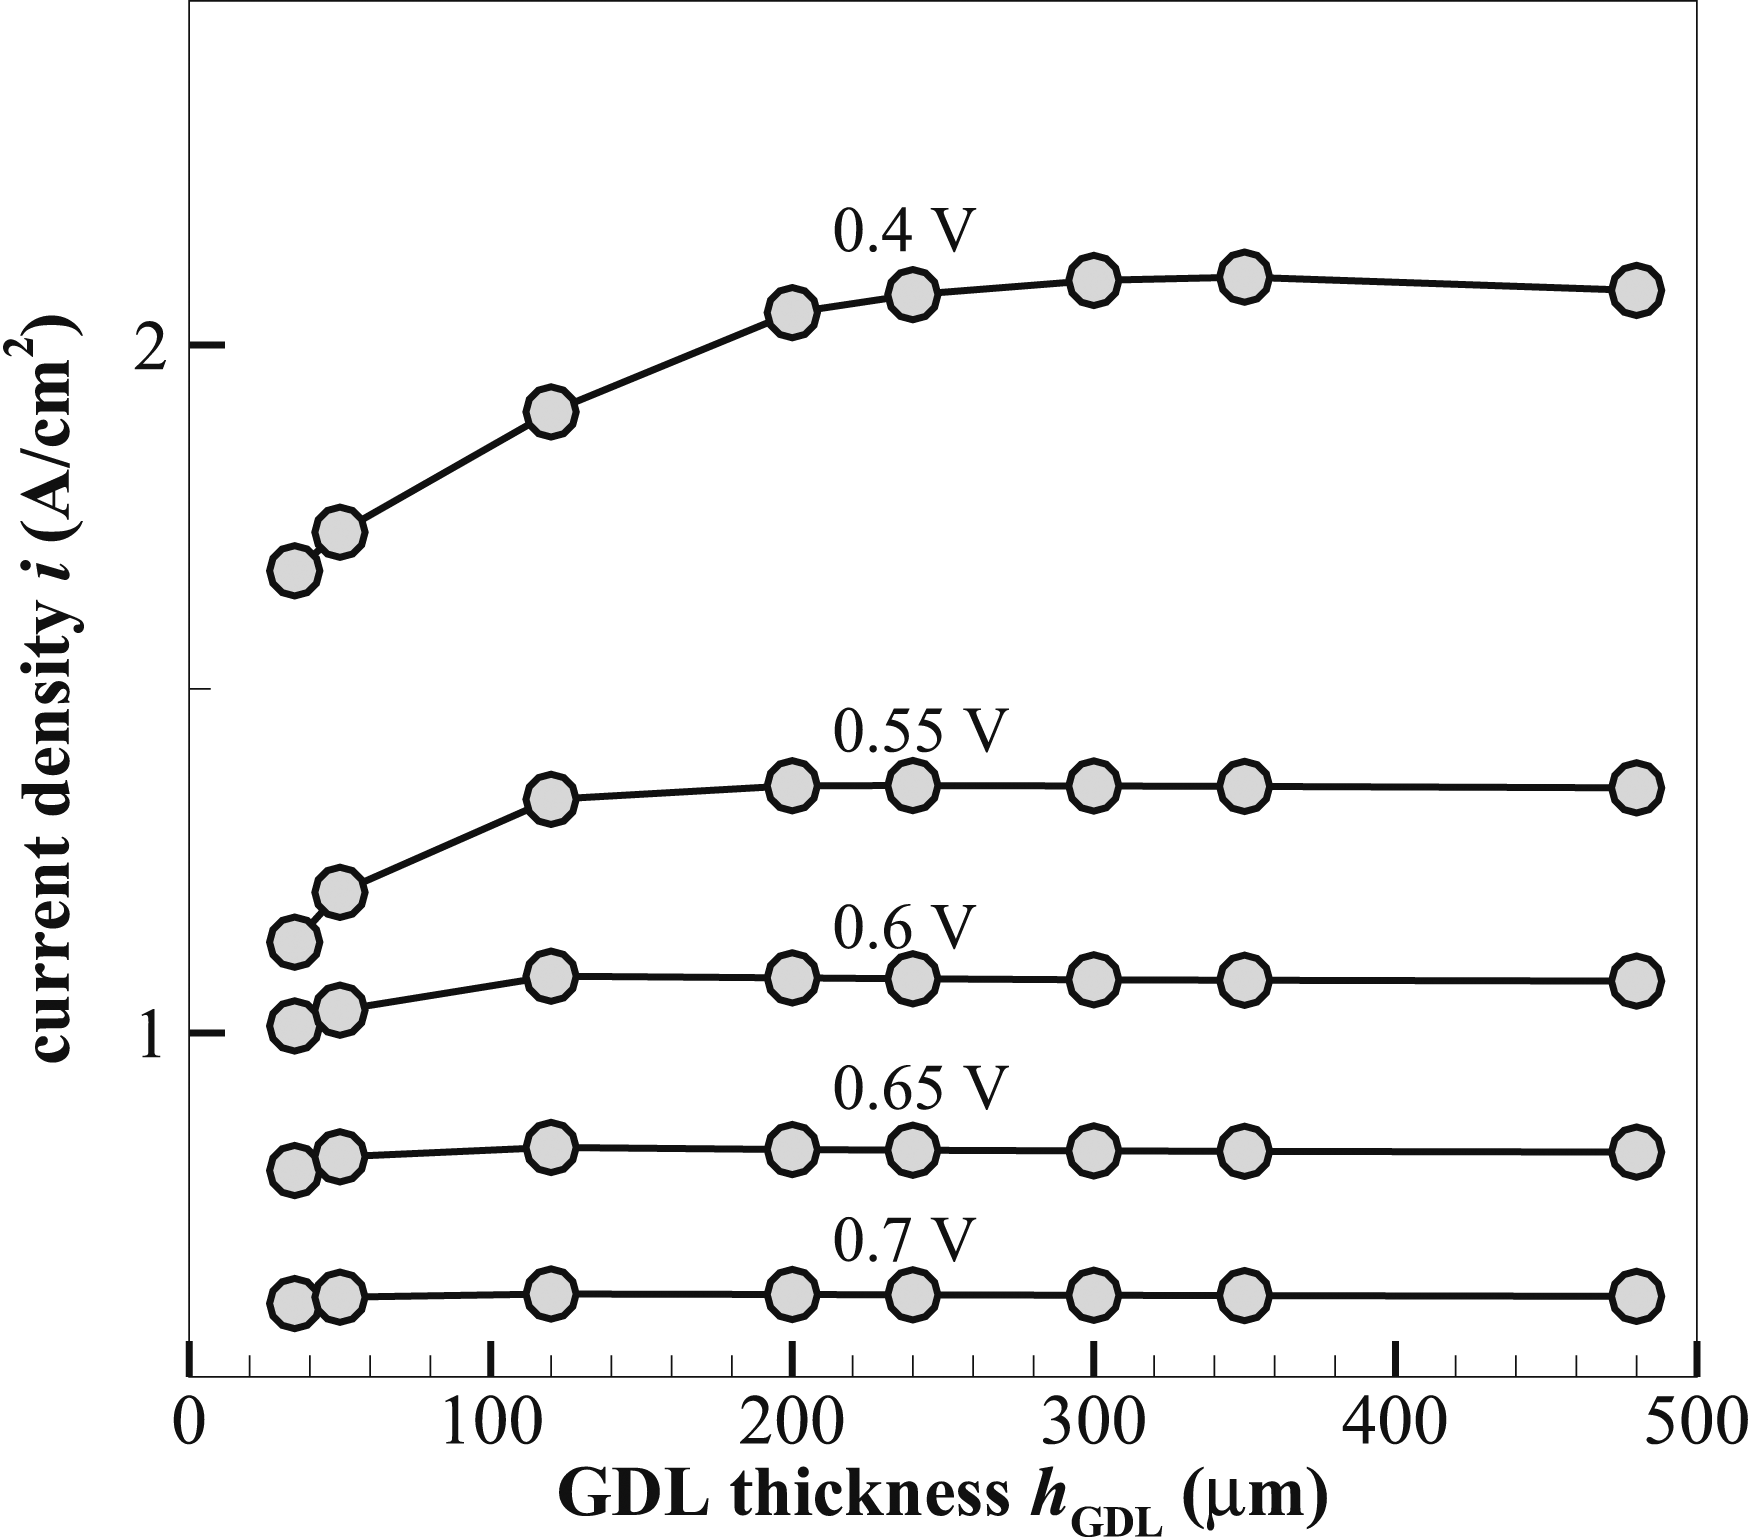
Figure 18 illustrates that when the voltage decreases from 0.7 to 0.4 V, the membrane water content increases proportionally for all GDL thicknesses. The membrane water content is defined as the number of water molecules per SO3H group. For instance, at 0.7 V, the membrane water content for a 120-µm-thick GDL is ∼4.72 and rises to 7.51 at 0.4 V. Similarly, for 480 µm, the GDL thickness corresponds to an increase in water content from ∼4.68 at 0.7 V to 8.18 at 0.4 V. This trend indicates that at low voltages corresponding to high membrane water contents, most likely due to a reduction of the electro-osmotic drag, less water is carried toward the anode and more stays in the membrane.
37
Based on the data, there is little fluctuation in membrane water content with GDL thickness at 0.7 V, with values most seen in the range of 4.66–4.72. This means that the effect of GDL thickness on water content is also minimal at higher voltages. As the load voltage reduces to 0.65 V, the water content marginally decreases from ∼ 5.26 for the thinnest to 5.16 for the thickest GDL. However, at 0.4 V, the trend is more highlighted, that thicker GDLs would have a much higher membrane water content. for example 7.51 for 120-µm-thick GDL and 8.18 at hGDL = 480 µm. Overall, at a higher load voltage of 0.7 V, the data suggests that the membrane water content is higher in thinner GDLs. However, the trend changes as the load voltage decreases to 0.4 V, leaving one with GDLs of thicker construction higher membrane water contents. Variation of membrane water content with GDL thickness hGDL at various load voltages.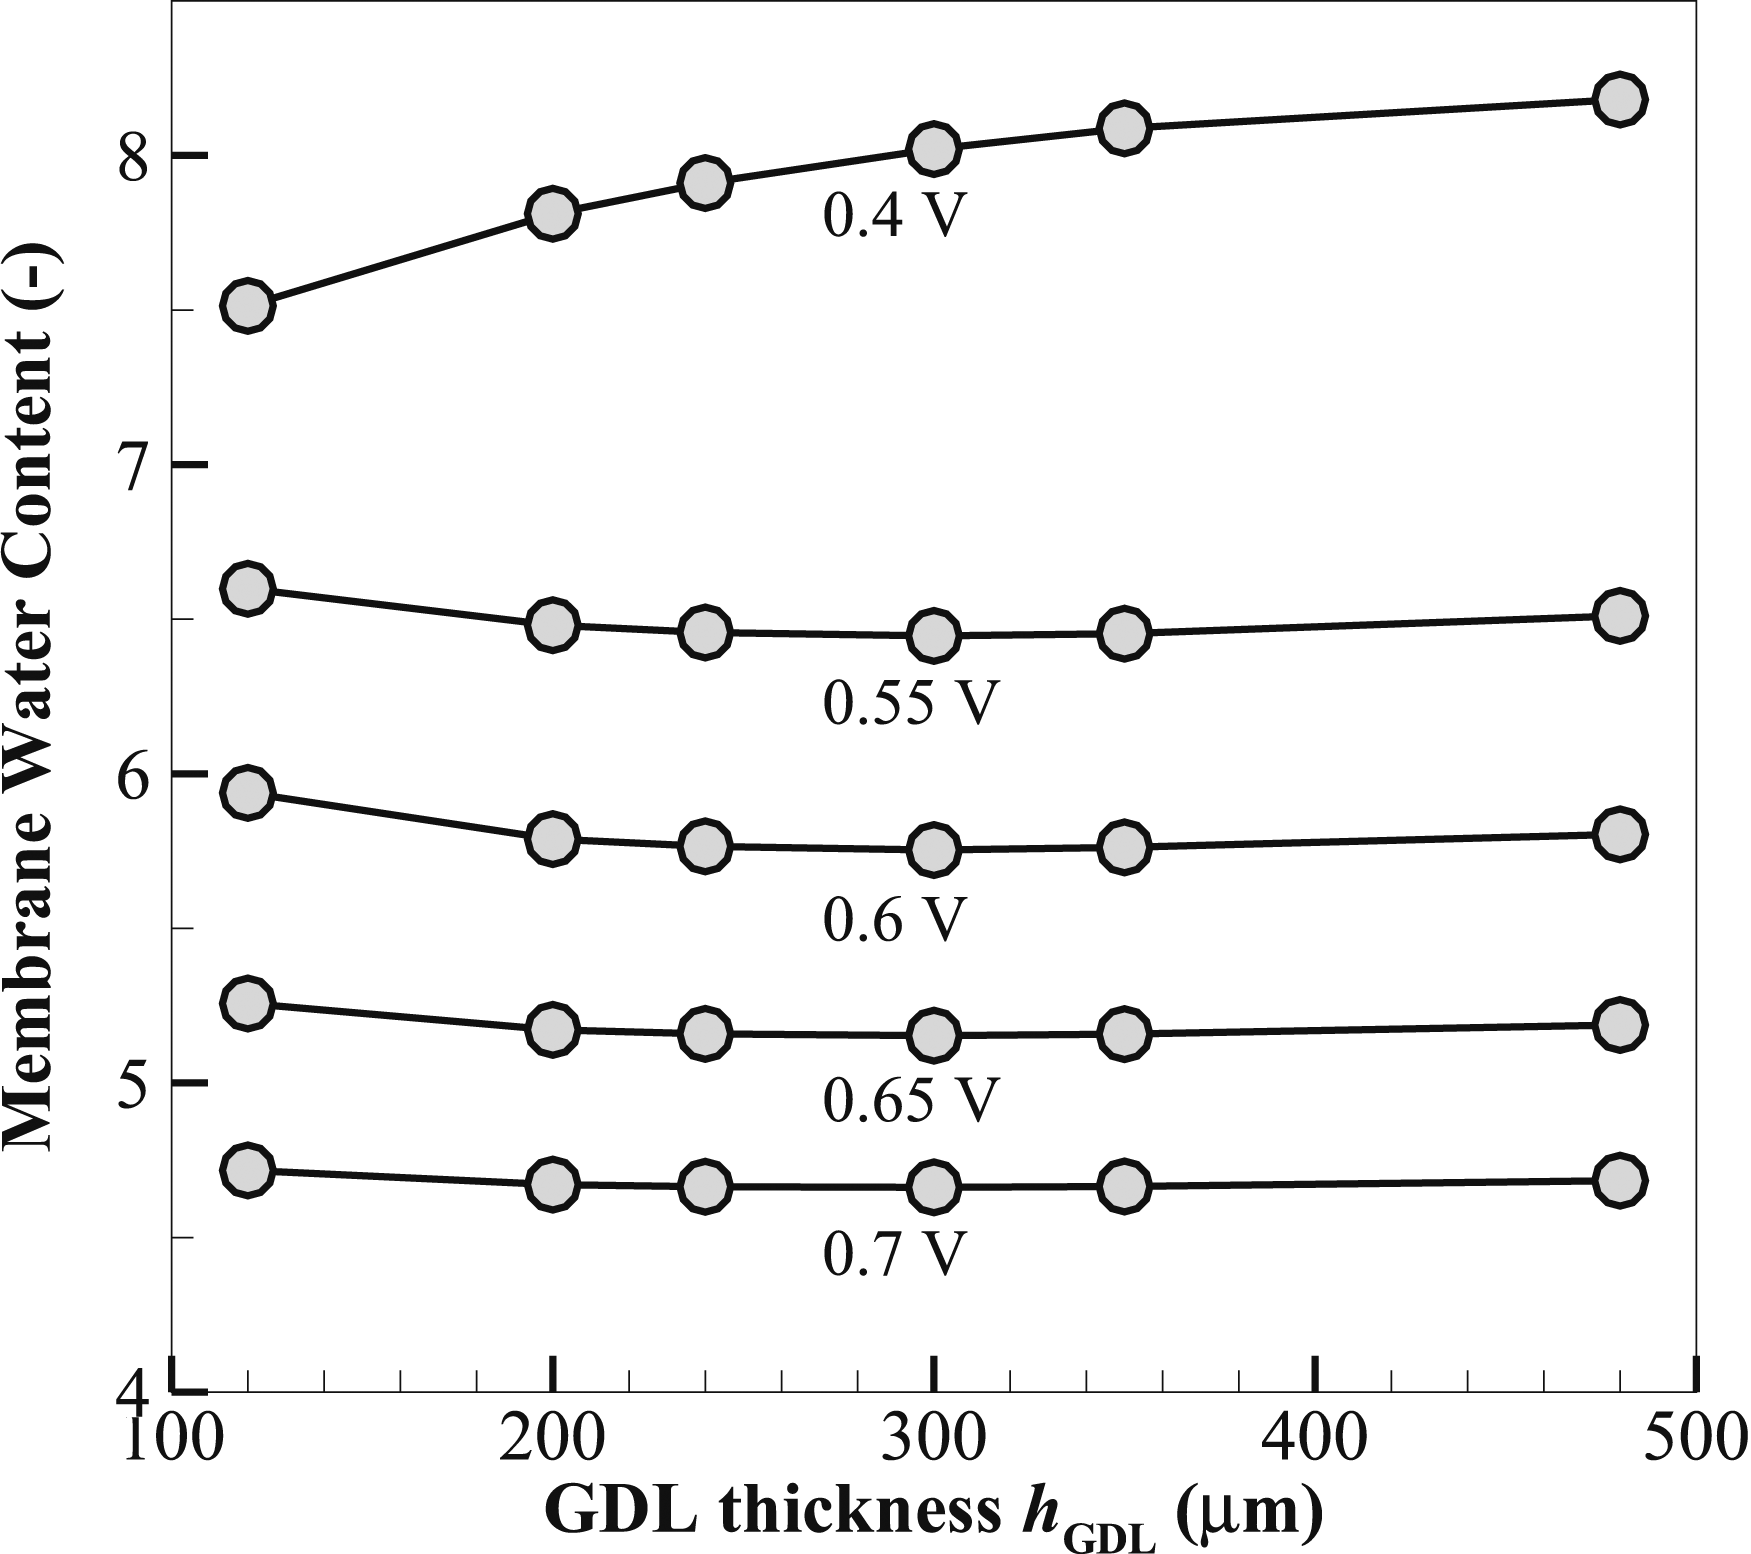
Figure 19 illustrates the variation of the molar concentration of oxygen Variation of oxygen molar concentration on the cross line between the mid X–Y and Y–Z planes across half cell (GDL + MPL + CL) on the cathode side at different CL thickness and voltage conditions.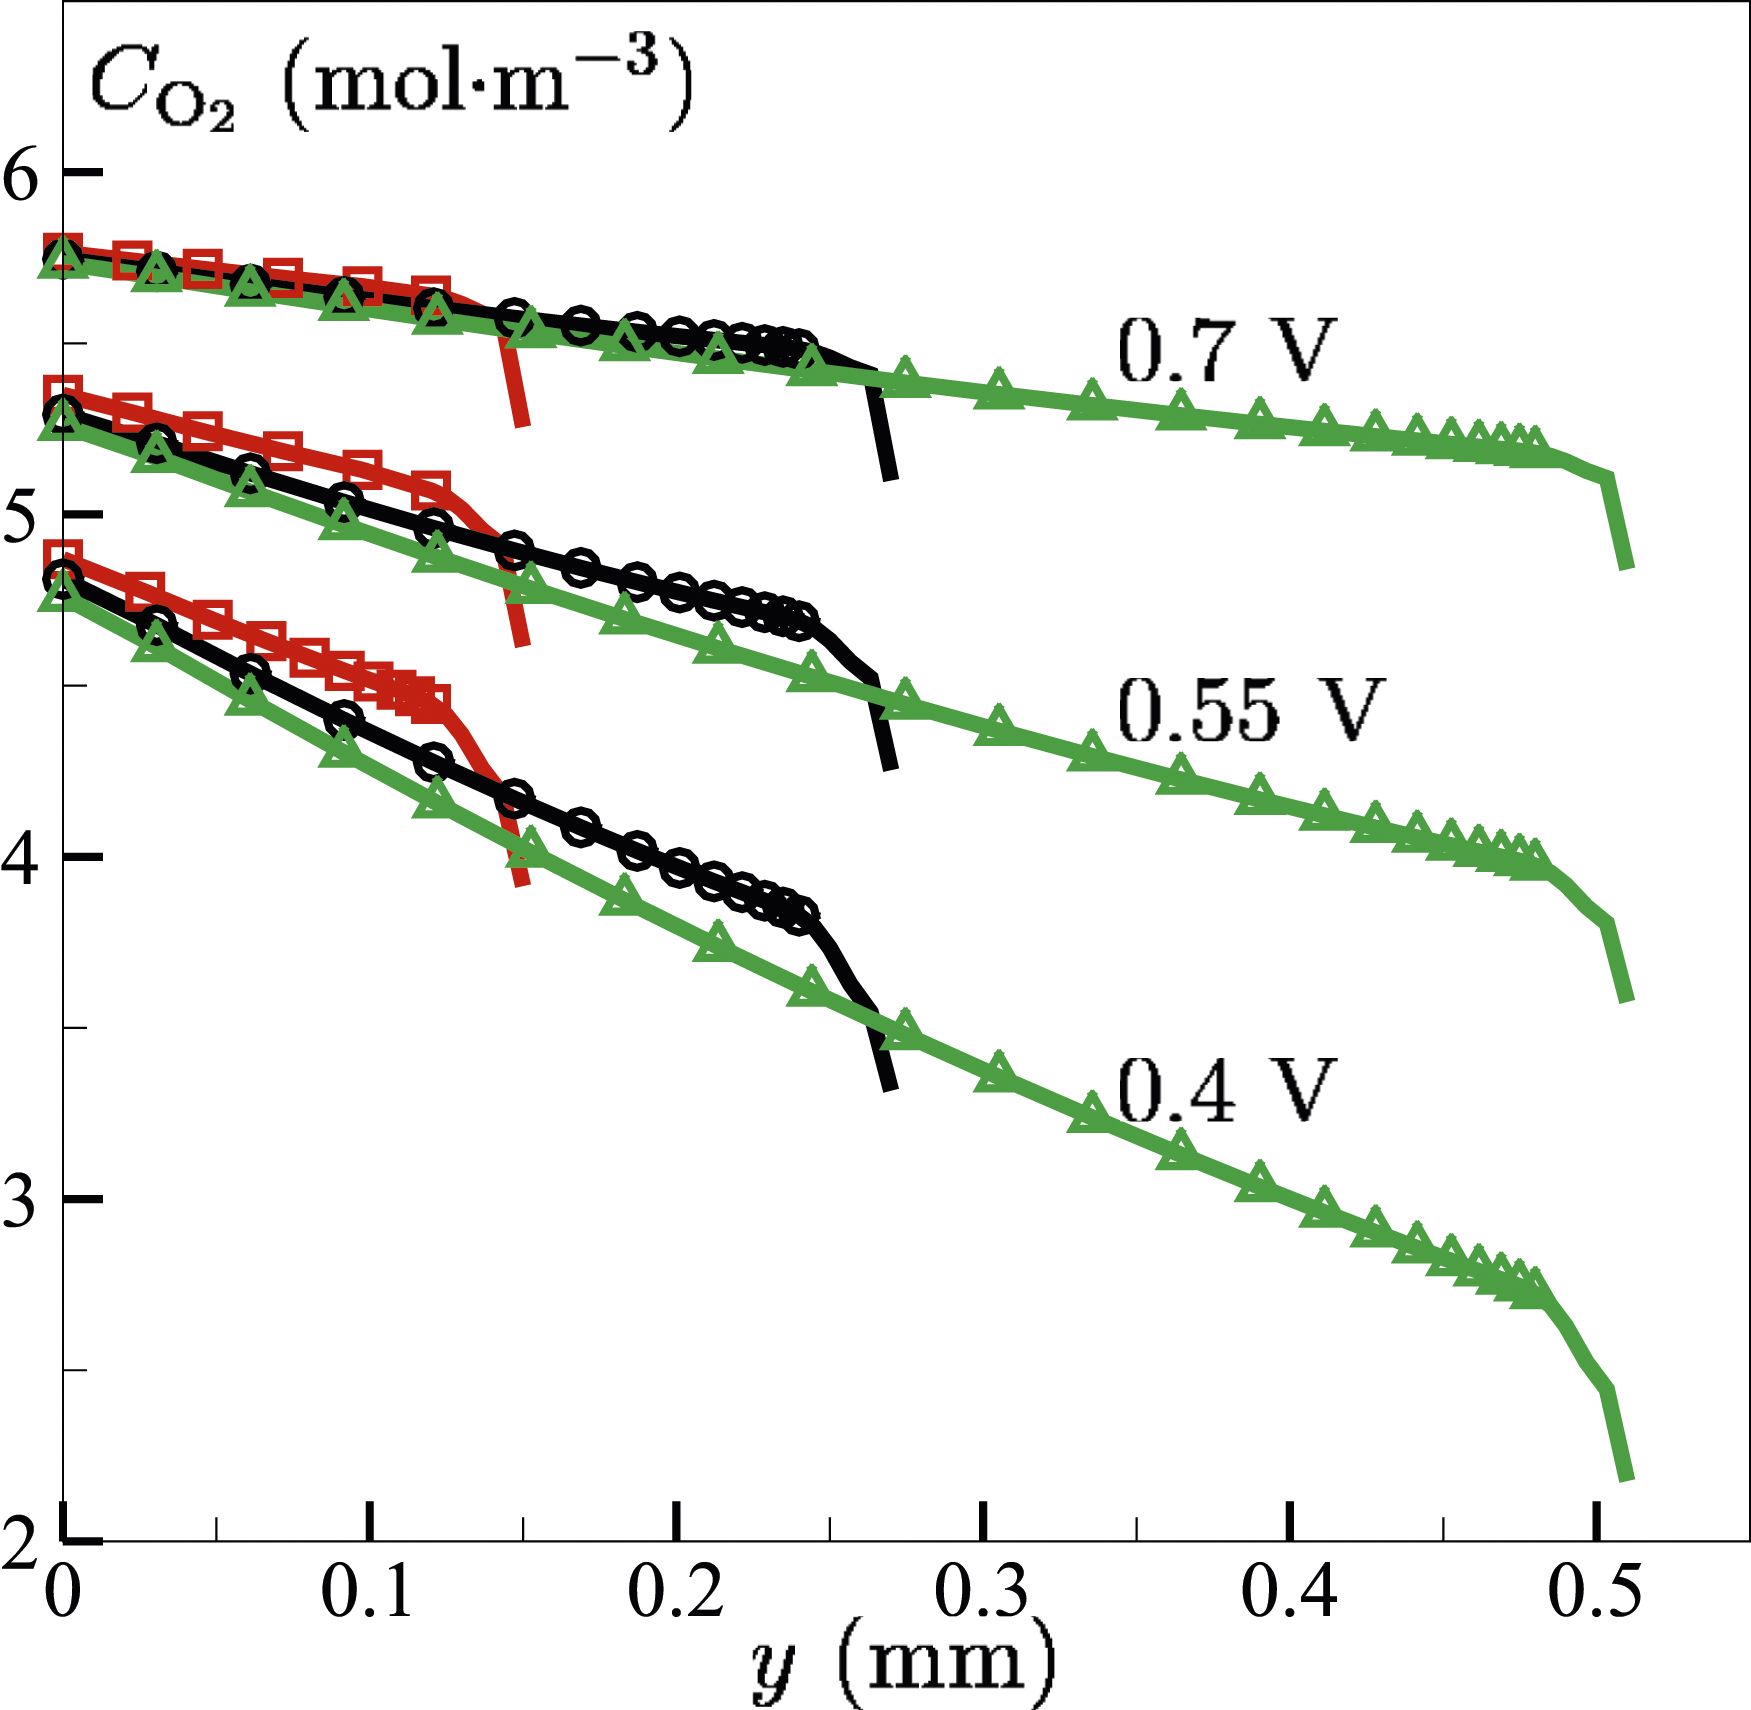
Performance comparison
Figure 20 presents the performance comparisons between the optimised and original fuel cells. For the base model, the layer thicknesses of the respective porous components are 350 µm, 50 µm, 8 µm, and 61.5 µm for the GDL, MPL, CL and PEM. For the optimised model, these are hGDL = 240 µm, hMPL = 10 µm, hCL = 20 µm, and hPEM = 48 µm. With the optimisation, the volume of the single fuel cell will be reduced by 5.1%. The overall current density under all typical operating voltages of the PEMFC is higher for the optimised model, for example with 18.11% and 16.06% increases at 0.6 V and 0.3 V, respectively. Both the temperature and water distributions across the fuel cell have been checked, with similar profiles between the two models (not shown). Polarisation curves of the original and optimised PEMFCs.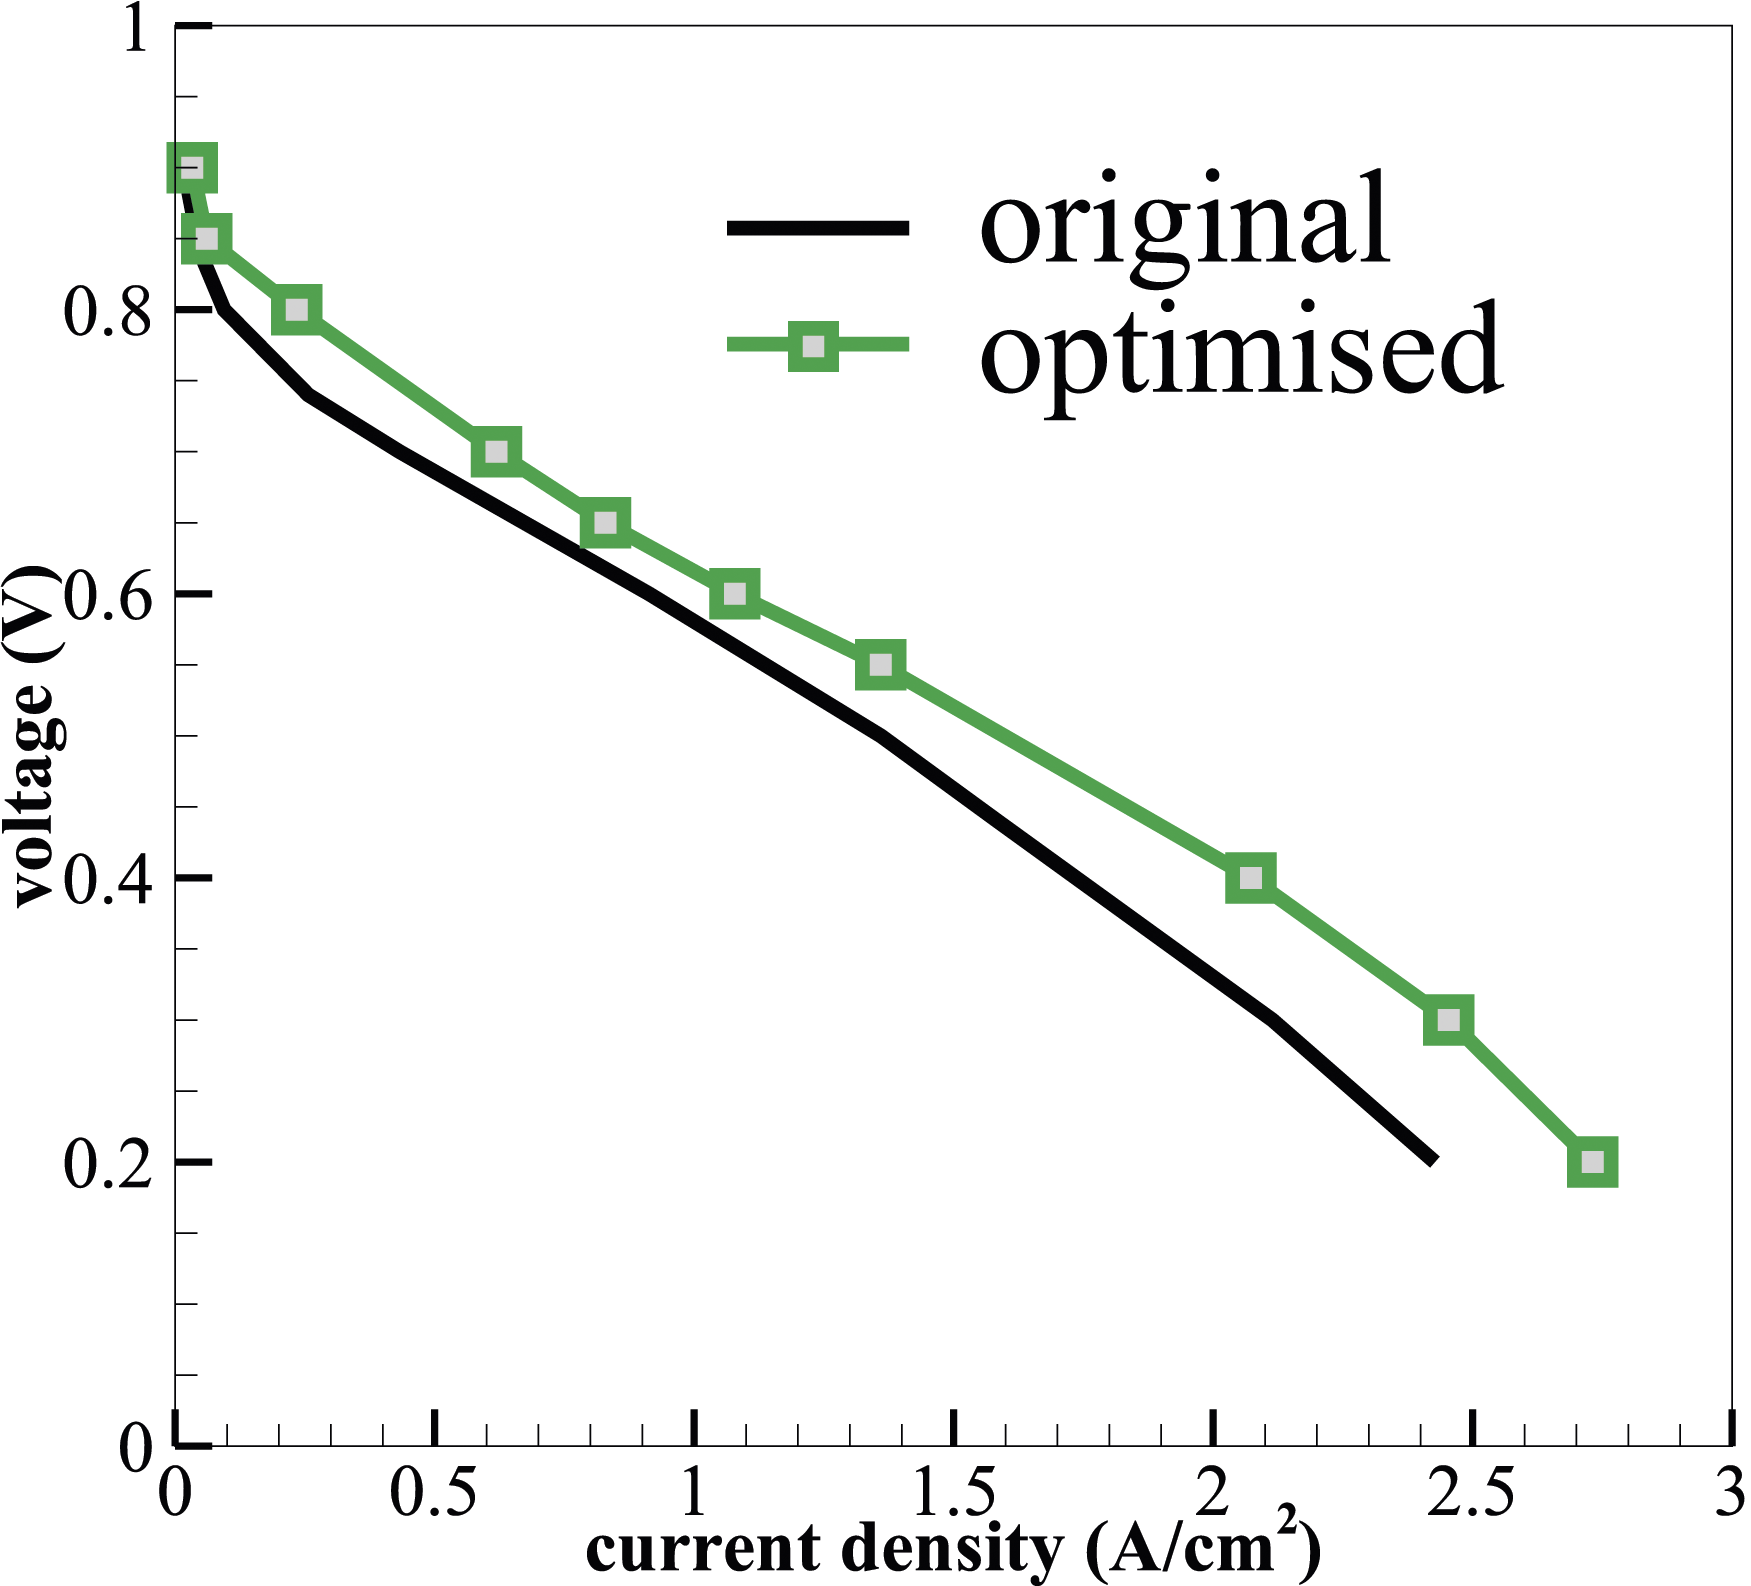
Conclusions
Coupled diffusion-controlled transport of reacting species, with water in multiple phases, through a three-dimensional proton exchange membrane fuel cell has been modelled. The modelling approach is validated against the measured polarisation curve of a PEM fuel cell. Our aim is to optimise the thicknesses of porous transport layers of a reference fuel cell to achieve optimal performance in the overall current density, per unit volume, under typical load voltages. The transport-layer thicknesses h’s of the reference fuel cell are hMPL = 50 µm, hCL = 8 µm, hGDL = 350 µm, and hPEM = 61.5 µm.
An iterative approach is taken, with the first iteration on choosing a proper thickness under a normal operating voltage 0.65 V. The outcomes will serve as the initial conditions for the second iteration, which also incorporates the analysis of reactant/multiphase-water transport and electrochemistry inside the fuel cell, under typical operating voltages from 0.4 to 0.7 V.
The catalyst layer is the focus of the analysis due to its key role in electrochemical activities and water production. There is always an optimal thickness that produces the highest current density under each voltage, appearing with a thicker catalyst layer towards higher voltages. An optimal thickness of the CL ensures balanced oxygen transport and electrochemical reaction surface areas. For the current case hCL = 20 µm is chosen. Compared to oxygen transport, the effects of the CL thickness on hydrogen transport are less important, as expected. The water distribution in the cathode-CL shows normal characteristics at both low and high voltages, which is affected by both production and diffusion of water. Overall, this thickness offers a well-controlled, almost constant temperature distribution, a controllable overpotential, and a consistent oxygen content.
For membrane, a monotonic profile is found between the current density and membrane thickness at all voltages, that is i decreases with an increasing hPEM. The optimal thickness is therefore chosen at hPEM = 48 µm, also considering mechanical robustness. Overall, a thicker membrane has a better capacity to retain water, although the local concentration of water can be lower than in a thinner membrane. Thinner membranes consistently give higher current densities due to decreased protonic resistance. At this optimal thickness, the water concentration
It is found that the microporous layer shows the least important role in affecting the overall current density among all the porous transport layers in the present study, with |i| varying by only a few percentages at both high (1.5%) and low (7%) voltages. For the gas diffusion layer, the effects are more evident at lower voltages than at higher ones, for which the current density remains almost constant at different GDL thicknesses. hGDL = 240 µm is chosen, considering both reactant gas diffusion and structural integrity. The GDL thickness affects the water content in the membrane, modelled as the dissolved phase in the present study, in a different way at low and high voltages. In addition, at low voltages, the diffusion resistance is higher for oxygen, which also increases as hGDL increases. This is, on the other hand, not evident at high voltages.
Following the optimisation, the volume of the single fuel cell can be reduced by 5.1%. The overall current density of the PEMFC under all load voltages is improved for the optimised model, for example 18.11% and 16.06% higher at 0.6 V and 0.3 V, respectively.
Footnotes
Author contributions
C. Polgolla: Conceptualisation, Data curation, Formal analysis, Investigation, Methodology, Software, Validation, Visualisation, Writing - original draft, Writing - review & editing. J. Xia: Conceptualisation, Formal analysis, Investigation, Methodology, Project administration, Resources, Supervision, Validation, Visualisation, Writing - original draft, Writing - review & editing. X.Z. Jiang: Conceptualisation, Resources, Writing - review & editing.
Declaration of conflicting interests
The author(s) declared no potential conflicts of interest with respect to the research, authorship, and/or publication of this article.
Funding
The author(s) received no financial support for the research, authorship, and/or publication of this article.