
Abstract
In seven studies, we investigated how reporting partial vote counts influences perceptions of election legitimacy. Beliefs in election fraud, as in the 2020 U.S. presidential election, may be fueled by the cumulative redundancy bias (CRB), which skews perceptions toward early leaders in partial vote counts. In line with this prediction, participants (Prolific adult participants from the United States and the United Kingdom) consistently rated early leaders more favorably and were more likely to suspect fraud when the eventual winner gained a late lead. This effect persisted across simulated elections (Studies 1–3) and real-world vote counts from the 2020 election in Georgia (Study 4). It is important to note that fraud suspicions already arose before the count was completed (Study 5) and persisted despite explanatory interventions (Study 6). Partisanship did not eliminate the CRB’s influence on fraud beliefs (Study 7). Our findings suggest that the sequential reporting of vote counts may amplify false perceptions of election fraud and could be mitigated by revising how results are communicated.
Keywords
Introduction
The 2020 U.S. presidential election was a highly controversial election. It stirred widespread allegations of election fraud, culminating in the January 6th attacks on the Capitol. Several years later, more than a third of Americans are convinced that election fraud took place (Weiner et al., 2024).
Research across psychology, sociology, and political science has provided different explanations for why people believe in election fraud. As one example, political leaders’ messages influence their partisans’ beliefs (e.g., Donald Trump claiming there was election fraud; Sinclair et al., 2018). Another factor is the winner effect, which suggests that the perceived (il)legitimacy of an election hinges on whether one’s preferred party won or lost (Sances & Stewart, 2015). On a related point, research on motivated reasoning highlights that people’s desire to maintain positive perceptions of themselves and their affiliated party can make them question the legitimacy of a lost election (Bowler & Donovan, 2024; Edelson et al., 2017; Enders et al., 2021). Finally, research has also pointed to personality differences, suggesting that some people are predisposed to view events as the result of a conspiracy (Edelson et al., 2017; Enders et al., 2021).
In addition to such motivation- and personality-based explanations, we propose that cognitive mechanisms may have contributed to fraud allegations in the 2020 U.S. presidential (and other) elections. These cognitive mechanisms operate when news agencies (e.g., the Associated Press) report partial results while ballots are still being counted. For example, on the night of the 2020 election, Donald Trump was initially ahead of Joe Biden in key battleground states, including Georgia (Curiel et al., 2020). He fell behind Biden only after most ballots had already been counted. In response to his shrinking lead, Trump made a series of allegations about election fraud on Twitter, demanding that authorities “STOP THE COUNT!” (Trump, 2020b). Trump also held press conferences on election night in which he explicitly justified the fraud allegations with his shrinking lead in the vote counts: “It’s a corrupt system. [. . .] They want to find out how many votes they need, and then they seem to be able to find them. They wait and wait, and then they find them. And you see that on Election Night. We were ahead in votes in North Carolina by a lot — tremendous number of votes. And we’re still ahead by a lot, but not as many because they’re finding ballots all of a sudden” (Trump, 2020a).
The cumulative redundancy bias
We propose that fraud allegations in the 2020 election may have been fueled by cumulative redundancy bias (CRB; Alves & Mata, 2019; Alves et al., 2023). CRB suggests that when people observe the progression of a competition, their impressions are influenced by previous standings. Research on the CRB has found that in competitions—whether between sports teams, stocks, or computer algorithms—competitors who were in the lead during the competition receive more favorable evaluations and are expected to perform better in the future, even after the outcome of the competition is known. The repeated observation of a competitor being ahead seems to leave a lasting impression on observers that is not entirely erased by the final result. This can skew the evaluation of competitors, because the progression of a competition can be influenced by arbitrary factors, such as the order in which points or votes are added to the cumulative scores.
In the 2020 election, ballots counted earlier often favored Trump, whereas ballots counted later favored Biden. This was partly because Biden voters made more use of mail-in voting, and many counties counted the mail-in ballots last (Curiel et al., 2020). Additionally, urban counties were slower in counting their ballots and reporting them publicly compared with rural counties (Curiel et al., 2020).
Figure 1a illustrates how the vote count unfolded in the battleground state of Georgia. Trump was ahead early and lost his lead only after more than 99% of ballots were counted. Figure 1b illustrates a close approximation of how the vote count would have unfolded if the ballots had been counted in reverse order. In that scenario, Joe Biden would have been the leader long before eventually securing the win. Note that both trajectories are based on the same vote counts and differ only in the counting order. The CRB suggests that the impression of Trump as the more popular candidate in Georgia was repeatedly reinforced during election night by the partial results communicated via news media. Although state representatives quickly provided explanations for why later-counted ballots leaned toward Biden, research indicates that observers’ impressions of leading competitors remain affected, even when observers were provided with explanations for the lead (e.g., the “leader” had a head start; Alves et al., 2023).
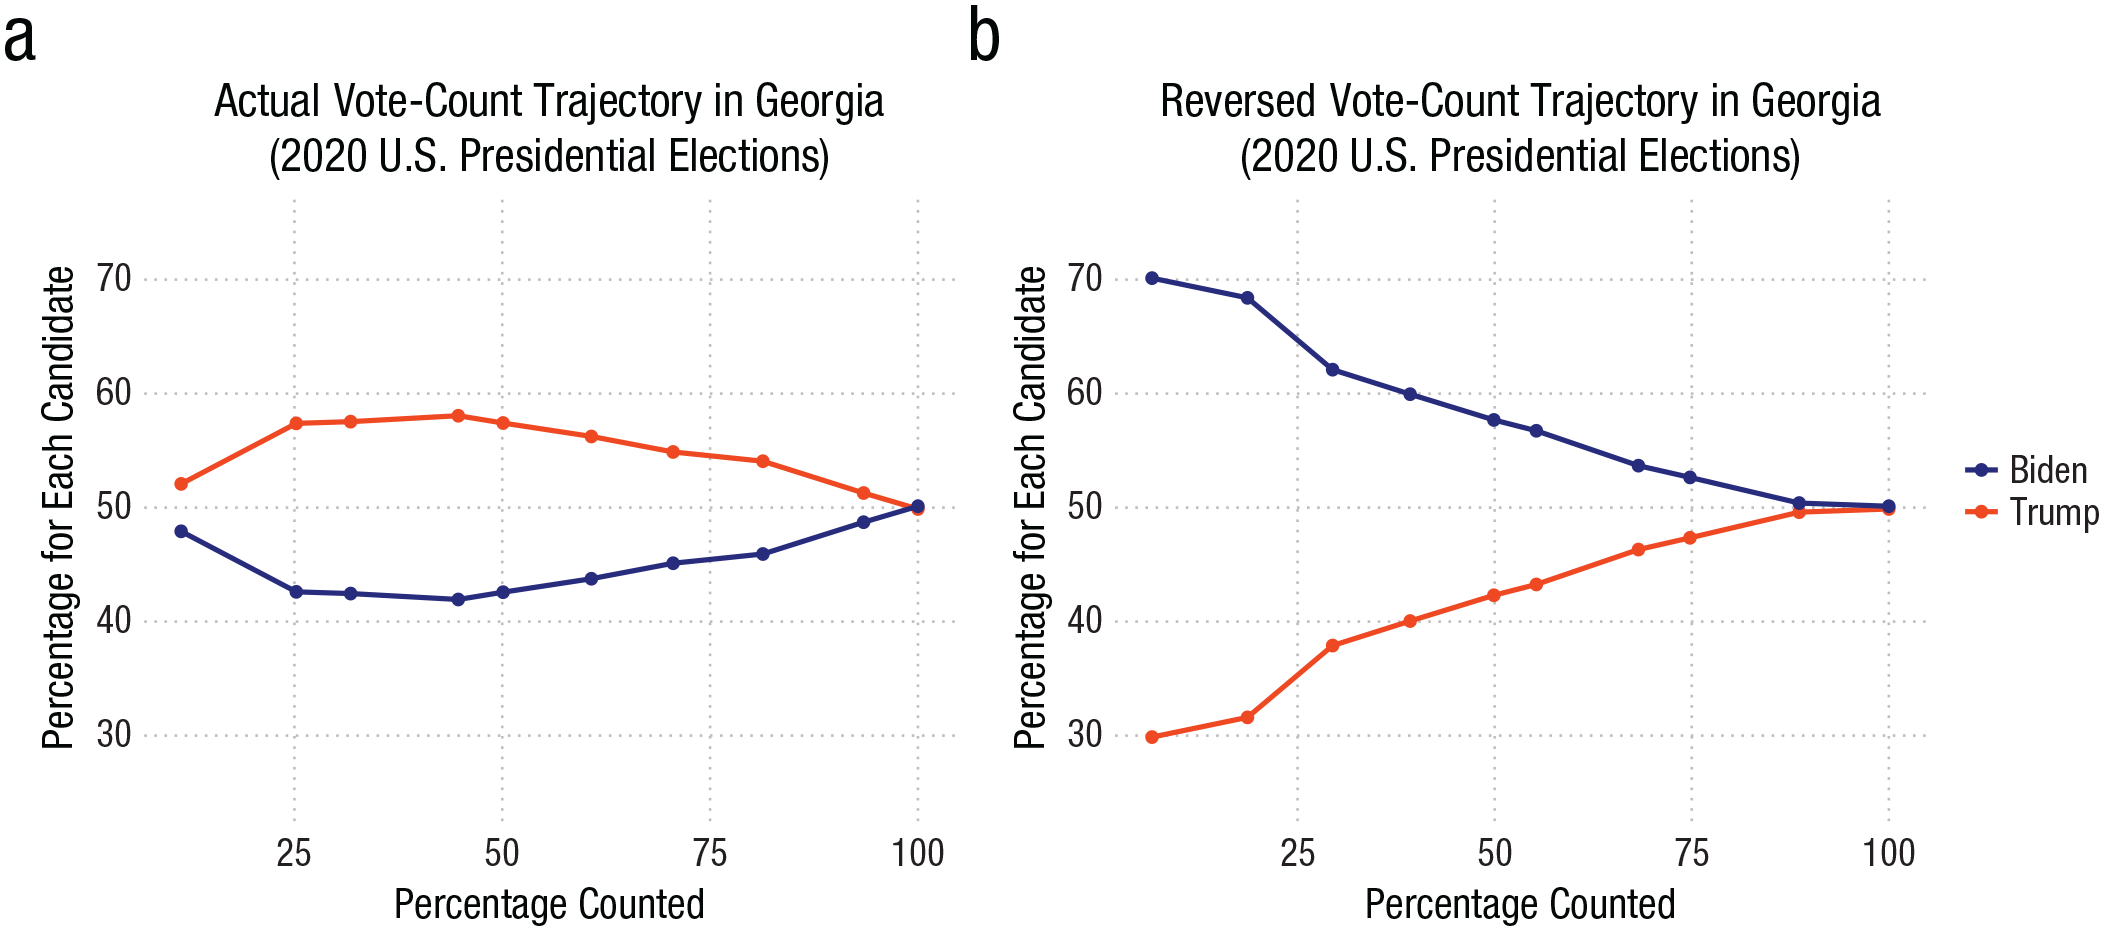
Actual (a) and reversed (b) vote-count trajectory in Georgia (2020 U.S. presidential election).
The present work
We tested whether the CRB, resulting from the continuous reporting of partial results in an ongoing election, contributes to beliefs in election fraud and may, consequently, have contributed to the widespread belief in a fraudulent 2020 U.S. presidential election. For this to be the case, a few conditions must be met. First, the CRB must emerge in a vote-count scenario in which an early leader becomes a late loser. Second, the CRB not only needs to generate more favorable impressions of the leading candidate but also must increase belief in fraud when that candidate ultimately loses. And third, the CRB’s influence needs to persist, even when explanations are provided for why the early leader ended up losing and even when perceivers have a partisan relationship with the winning candidate.
To test these hypotheses, we conducted seven studies in which participants followed the progression of vote counts for two candidates (i.e., percentage of the votes counted that was in favor of each candidate) as more votes were added to the total count. Crucially, participants were assigned to either a late-lead condition, in which the winner took a late lead (e.g., Fig. 1a), or an early-lead condition, in which the winner took an early lead (e.g., Fig. 1b). This design allowed us to test whether the order in which votes are counted influences participants’ impressions of the candidates and participants’ beliefs in the legitimacy of the election.
Research Transparency Statement
General disclosures
Study 1 disclosures
Study 2 disclosures
Study 3 disclosures
Study 4 disclosures
Study 5 disclosures
Study 6 disclosures
Study 7 disclosures
Study 1: Candidate Perception
Study 1 tested whether the CRB emerges in a vote-count scenario in which perceptions of the winner or loser are influenced by which candidate had an early or late lead in the vote count.
Method
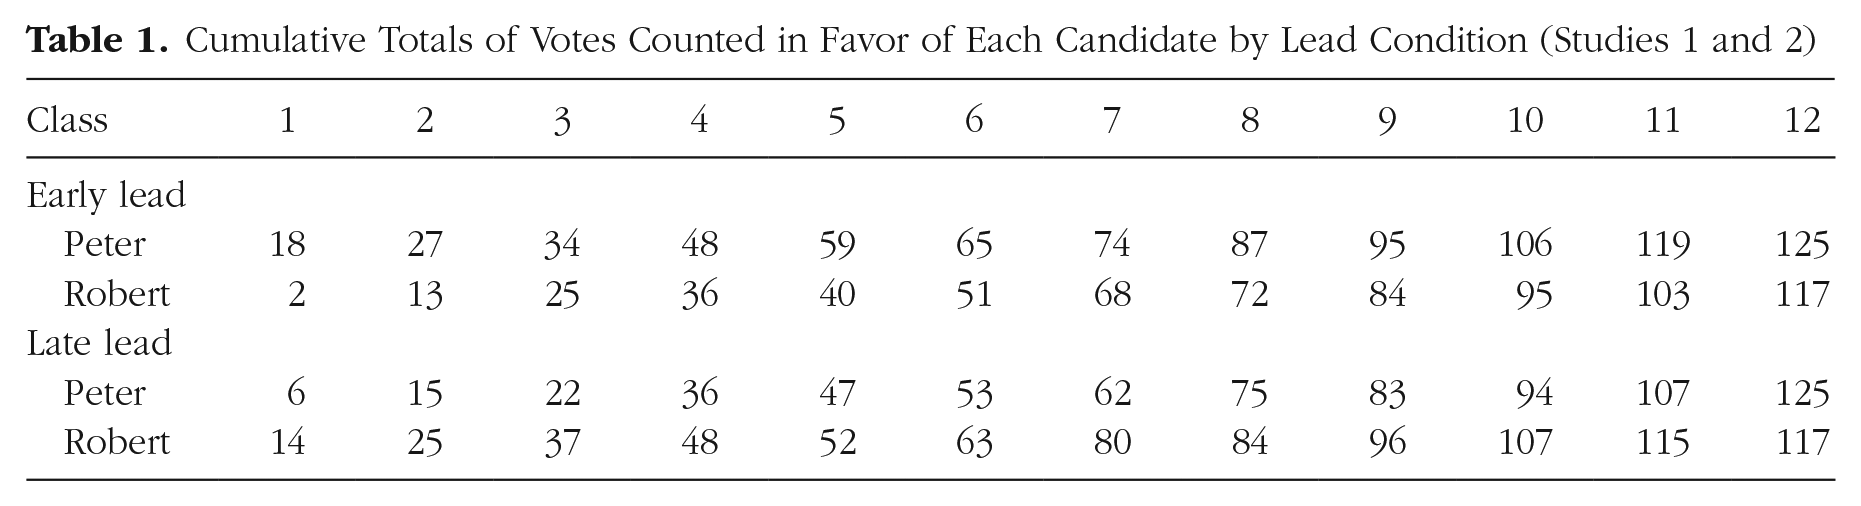
We adapted an existing CRB paradigm (Alves et al., 2023) that presented participants with the election of a school representative, featuring two candidates: Peter and Robert. Participants were informed that the students were distributed across 12 classes. After all students had cast their votes, the total vote counts would be updated class by class. Participants viewed these updated vote counts on 12 separate screens. We designed two conditions that varied the unfolding of the vote count “race” (see Table 1). The vote counts within each of the 12 classes were identical across both conditions, and Peter always won the election by the same margin. The only difference between the two conditions was the order in which two key classes (1 and 12) were counted: One of the classes strongly favored Peter, whereas the other strongly favored Robert. In the early-lead condition, the Peter-favoring class was counted first, and the Robert-favoring class was counted last, resulting in Peter leading from the start and maintaining the lead. In the late-lead condition, this order was reversed, with Peter trailing throughout the vote count and securing the win only after the final class was counted. Hence, a rational agent should not draw different conclusions from the two conditions (for details on the normativity discussion, see Alves & Mata, 2019). At the end of Study 1, participants were asked to evaluate both candidates and predict how well each would perform in future elections.
Cumulative Totals of Votes Counted in Favor of Each Candidate by Lead Condition (Studies 1 and 2)
Study 1 and all subsequent studies were approved by the Ethics Committee of the Faculty of Psychology of Ruhr University Bochum. The hypotheses, methods, sample size, exclusion criteria, and analysis plan were preregistered prior to data collection at https://aspredicted.org/mj44-rb7n.pdf.
Sample and design
We recruited 200 United Kingdom participants from Prolific (110 female, 89 male, 1 nonbinary; Mage = 45.02 years, SDage = 12.82 years); they took part in the study via Qualtrics. Consistent with our preregistration, we excluded 20 participants from the analyses because they failed a memory-based attention check, resulting in a final sample of 180. Participants were randomly assigned to one of two lead conditions: early or late.
Procedure
After providing informed consent, participants were informed that they would witness the election of a school representative. Specifically, they were told that they would see the vote counts for each of the two candidates (“Peter” and “Robert”) as the votes from 12 classes were counted and added to the total. When participants were ready, the vote-counting simulation began, and the votes from each class were added to the running cumulative totals (see Table 1).
After all the votes were counted, participants read that Peter won and were asked to evaluate the two candidates on two measures: evaluation—“How good of a candidate is Peter [Robert] in your view on a scale from 1 (very bad) to 10 (very good)?”; and success—“How successful do you think Peter [Robert] will be as a candidate in a future election on a scale from 1 (very unsuccessful) to 10 (very successful)?” Participants first completed the evaluation measure for both candidates before moving on to the success measure.
Finally, participants answered an attention check (“Before you finish, we want to check if you remember who won the election of the school representative”; the options were “Peter,” “Robert,” and “Don’t remember”). They then provided demographic information (age and gender).
Results
We entered the evaluation and success measures (Fig. 2) into a 2 (Lead: Early vs. Late, between-participants) × 2 (Candidate: Winner vs. Loser, within-participants) mixed analysis of variance (ANOVA). On the evaluation measure, we found a main effect of candidate, F(1, 178) = 23.20, p < .001, η p 2 = .12, qualified by the predicted Lead × Candidate interaction, F(1, 178) = 79.90, p < .001, η p 2 = .31. Exploratory pairwise comparisons showed that, in the early-lead condition, participants judged the winner as being better than the loser, t(178) = 9.78, p < .001, d = 0.73. In the late-lead condition, however, the loser was judged as being better than the winner, t(178) = 2.90, p = .004, d = 0.22. The main effect of the lead condition was not significant, F(1, 178) = 1.11, p = .293, η p 2 < .01.
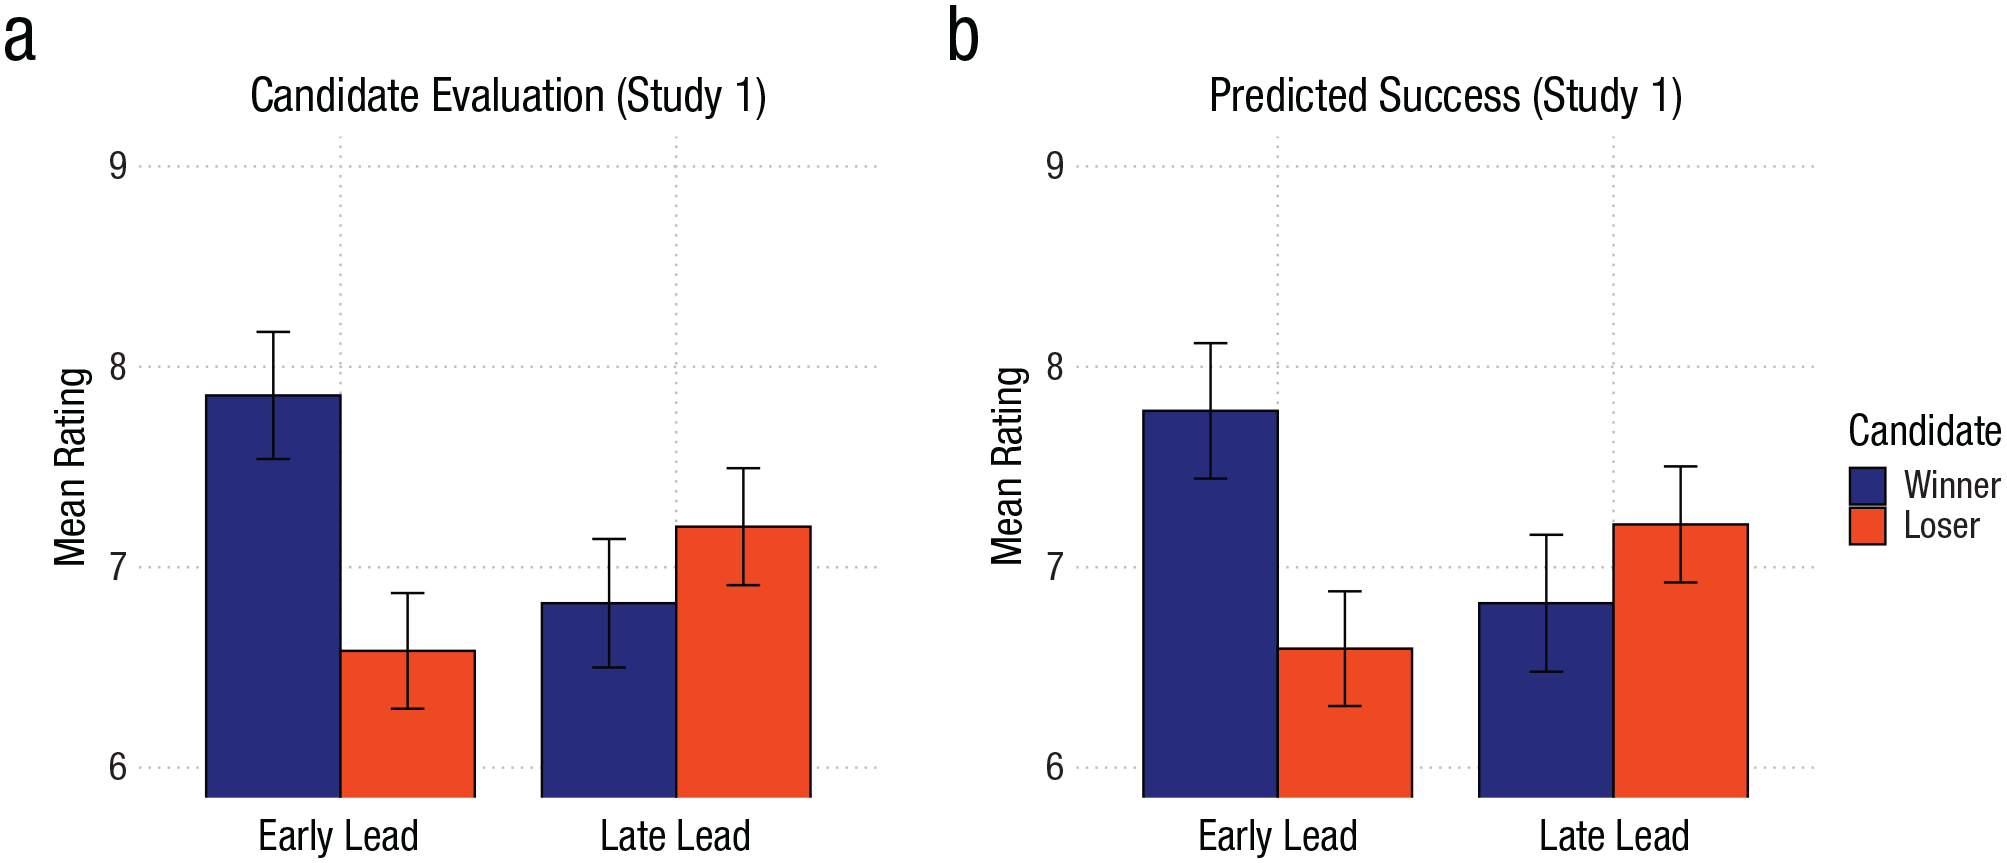
Candidate evaluation and predicted success in Study 1. Error bars represent 95% confidence intervals. At left, the range is 1 = very bad, 10 = very good; at right, the range is 1 = very unsuccessful, 10 = very successful.
On the success measure, we obtained similar results. Again, we found a main effect of candidate, F(1, 178) = 13.67, p < .001, η p 2 = .07, qualified by the predicted Lead × Candidate interaction, F(1, 178) = 54.18, p < .001, η p 2 = .23. Exploratory pairwise comparisons showed that participants predicted more success for the winner than the loser in the early-lead condition, t(178) = 7.86, p < .001, d = 0.59. This difference was reversed in the late-lead condition (i.e., the loser was judged as being better), t(178) = 2.58, p = .011, d = 0.19. The main effect of the lead condition was again not significant, F(1, 178) = 0.73, p = .393, η p 2 < .01.
Discussion
In line with the CRB, participants judged an election winner more favorably if the winner had an early lead in the vote count. Crucially, the CRB even overruled the actual election result. Participants in the late-lead condition gave more favorable ratings to the loser of the election than to the winner.
Study 2: Perceptions of Fraud
In the next step, we tested whether the CRB induced by the vote-count order also affects people’s beliefs in election fraud.
Method
Study 2 was similar to Study 1, except that we directly probed people’s beliefs about whether the vote count was manipulated and the wrong candidate won. The hypotheses, method, sample size, exclusion criteria, and analysis plan of Study 2 were preregistered prior to data collection: https://aspredicted.org/yb9z-98qd.pdf. We recruited 201 U.K. participants from Prolific (119 female, 81 male, 1 nonbinary; Mage = 40.97 years, SDage = 13.76 years) who took part in the study via Qualtrics. Consistent with our preregistration, we excluded from the analyses 28 participants who failed the attention check, resulting in a final sample of 173.
The study’s design and procedure were identical to Study 1’s, with one difference. After the vote count was finished, participants were informed that there were rumors of voting fraud: “Shortly after the vote count was finished, rumors emerged that the vote count may have been rigged and that the wrong candidate won as a result. The people responsible for the vote count, however, denied the allegation.” Participants were then prompted to rate the likelihood of fraud in two measures: a vote-manipulation measure—“How likely do you think it is that the vote count was manipulated, on a scale from 1 (very unlikely) to 10 (very likely)?”—and a wrong-candidate measure—“How likely do you think it is that the wrong candidate won, on a scale from 1 (very unlikely) to 10 (very likely)?” Participants finished by completing the same attention check as in Study 1 and providing their demographic information.
Results
As predicted (see Fig. 3), participants in the late-lead (versus early-lead) condition found it more likely that the votes had been manipulated, t(165.28) = 6.57, p < .001, d = 1.00, and that the wrong candidate won, t(149.45) = 7.68, p < .001, d = 1.18.
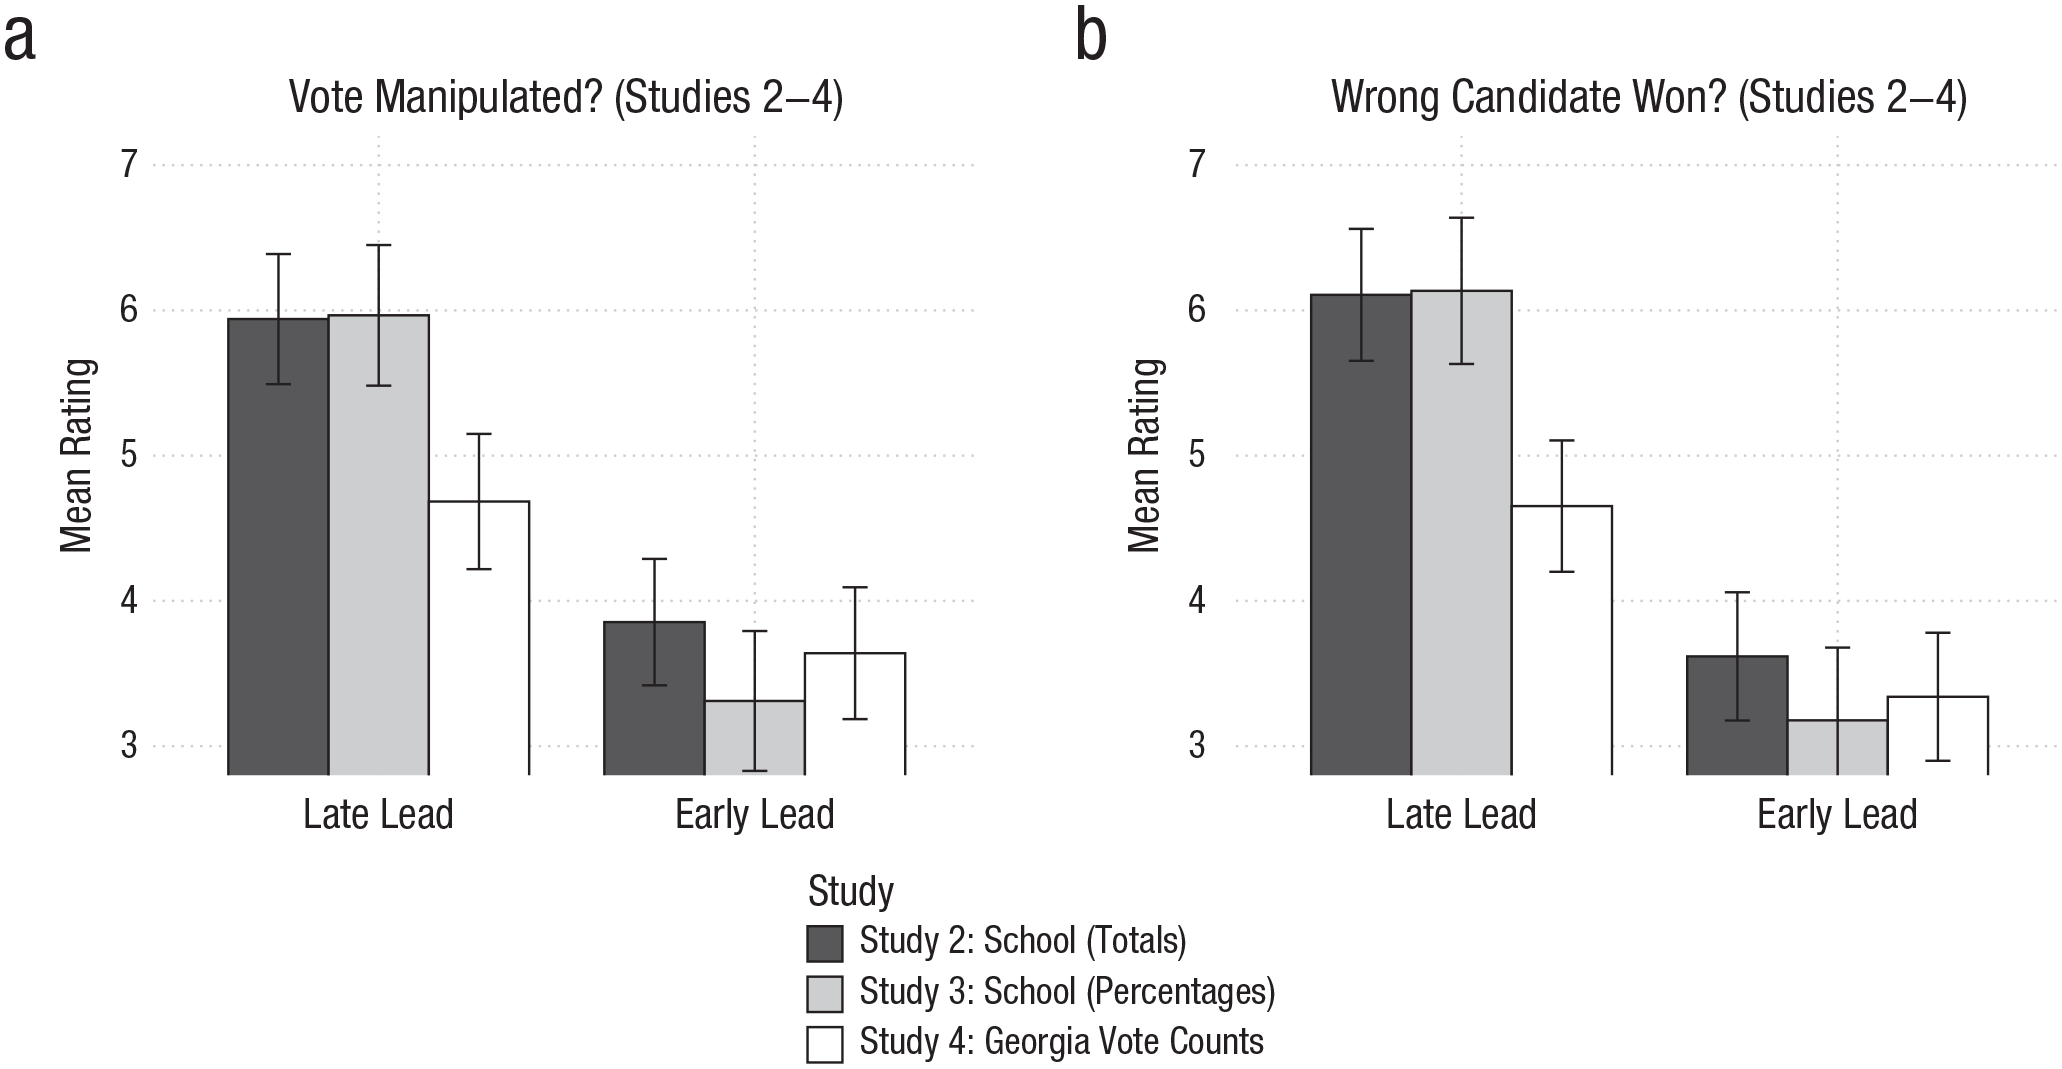
Results from Studies 2 through 4. In both graphs, the range is from 1, very unlikely, to 10, very likely. Error bars represent 95% confidence intervals.
Discussion
Study 2 provides initial evidence that the CRB not only influences people’s impressions of the candidates but also affects the perceived legitimacy of the election. When the election winner took a late lead, participants perceived fraud as more likely.
As correctly pointed out by an anonymous reviewer, Study 2 did not explicitly instruct participants that the voting process had finished before the votes were counted and that the vote-count order was randomly determined. We therefore ran Study 2 again with more explicit instructions and replicated the effects from Study 2. We report the study’s details and results in the Supplemental Material.
Study 3: Percentage Format
In real life, partial vote counts are usually communicated as percentages rather than raw totals, which is what we implemented in Study 3.
Method
Study 3 replicated Study 2 but presented the vote-count progression not as the (absolute) total number of votes that each candidate received, but in the form of percentages—that is, at each point in time, what percentage of the total votes counted were in favor of one candidate or the other (Table S1)? The hypotheses, method, sample size, exclusion criteria, and analysis plan of Study 3 were preregistered prior to data collection: https://aspredicted.org/3pc3-6tw7.pdf. We recruited 200 U.K. participants from Prolific (119 female, 79 male, 2 nonbinary; Mage = 44.15 years, SDage = 24.91 years) who took part in the study via Qualtrics. Consistent with our preregistration, we excluded 21 participants who failed the attention check, resulting in a final sample of 179. The study’s procedure was similar to Study 2’s but with vote-count percentages instead of totals.
Results
Again (see Fig. 3), participants in the late-lead (versus the early-lead) condition found it more likely that the vote counts were manipulated, t(130.51) = 7.65, p < .001, d = 1.15, and that the wrong candidate won, t(126.93) = 8.19, p < .001, d = 1.23.
Discussion
Study 3 replicated the findings from Study 2 when the results were communicated in percentages.
Study 4: Vote-Count Reporting From Georgia
To bring our paradigm even closer to the real world, Study 4 featured a presidential-election scenario, in which participants observed actual vote-count trajectories from the 2020 U.S. presidential election.
Method
Study 4 featured a presidential-election scenario, using real data collected from the vote-counting progression of the 2020 U.S. presidential elections in the state of Georgia. As a cover story, we told participants that the data was coming from a recent presidential election that took place in a country in Eastern Europe. The hypotheses, method, sample size, exclusion criteria, and analysis plan of Study 4 were preregistered prior to data collection: https://aspredicted.org/w923-yrsp.pdf. We recruited 201 U.S. participants from Prolific (117 female, 80 male, 4 nonbinary; Mage = 37.31 years, SDage = 11.69 years) who took part in the study via Qualtrics. Consistent with our preregistration, we excluded 6 participants who failed the attention check, resulting in a final sample of 195.
We received the vote-count reporting data published by the New York Times from the MIT election data and science lab (Curiel et al., 2020). From the raw data, we selected data points that reflected roughly 10 to 100% of the votes counted (in increments of 10 percentage points) and extracted the absolute number of votes that favored Biden (vs. Trump) at each of those increments. From those totals, we computed the percentages. 1 In the late-lead condition, we presented the votes as they occurred, so the losing candidate was in the lead throughout the vote counting and lost only in the last 10% of votes counted. In the early-lead condition, we reversed the order of the voting increments such that the relative percentages now placed the winning candidate in the lead from the start (see Table S2 in the Supplemental Material). In this study, participants were told that they would follow the vote counting of “a recent presidential election that took place in a country in Eastern Europe.” The two candidates were called “Miroslav K.” and “Lukas P.”; both “Miroslav” and “Lukas” are common names in Eastern Europe. We counterbalanced which one was the winning or the losing candidate. Except for the specific percentage values and the decrease from 12 to 10 vote-count updates, the procedure was identical to that of Study 3.
Results
As illustrated in Figure 3, participants in the late-lead (versus the early-lead) condition found it more likely that the vote counts were manipulated, t(170.66) = 3.14, p = .002, d = 0.45, and that the wrong candidate won, t(160.49) = 4.06, p < .001, d = 0.59.
Discussion
Study 4 replicated the effect of vote-count order on perceptions of election fraud using actual vote-count reporting data from the 2020 U.S. presidential election. Hence, allegations of election fraud during that election may indeed have been fueled by the order in which votes were counted and then reported. Had the ballots been counted in reverse order, fraud allegations might not have been as pervasive.
Study 5: Stop the Count!
Study 5 tested whether vote-count order influences election fraud beliefs even while the vote count is still ongoing, as was the case during the 2020 election.
Method
In Study 5, participants judged the plausibility of election fraud before the vote count had ended. Because the election winner was not yet known, we had to adapt the wording of the dependent variables. We asked participants to judge the likelihood that the vote count had been manipulated in favor of each candidate. The hypotheses, method, sample size, exclusion criteria, and analysis plan of Study 5 were preregistered prior to data collection: https://aspredicted.org/mgcz-t49t.pdf. We recruited 200 U.S. participants from Prolific (125 female, 72 male, 3 nonbinary; Mage = 45.16 years, SDage = 13.61 years) who took part in the study via Qualtrics. Consistent with our preregistration, we excluded 34 participants who failed the attention check, resulting in a final sample of 166.
We used the same vote-count data as in Study 4. This time, however, we structured it so that participants saw the updates every 3 hrs after the voting booths closed—starting 3 hrs after closing (when about 50% of the votes had been counted) and ending 60 hrs after closing (when 99.25% of the votes had been counted), for a total of 20 updates. In the late-lead condition (see Fig. 4a), the percentages again reflected the real vote-count progression that was observed in the 2020 presidential elections in Georgia. This placed the losing candidate (i.e., Trump) ahead from the first update, with the lead steadily decreasing until, 60 hrs after closing, the winning candidate (i.e., Biden) took the lead. In the early-lead condition (see Fig. 4b), we changed the order of the votes counted prior to the first update, and the votes counted between updates 1 through 20. In other words, the percentages presented to participants now reflected what would have happened if the second half of the votes had instead been counted before the first half. Because we did not know how the first 50% of votes (i.e., those that were counted in the first 3 hrs after closing) would have been distributed across time if they had been counted later, we spread them throughout the 20 updates in a distribution that was similar to the one observed in the late-lead condition (see Table S3 in the Supplemental Material).
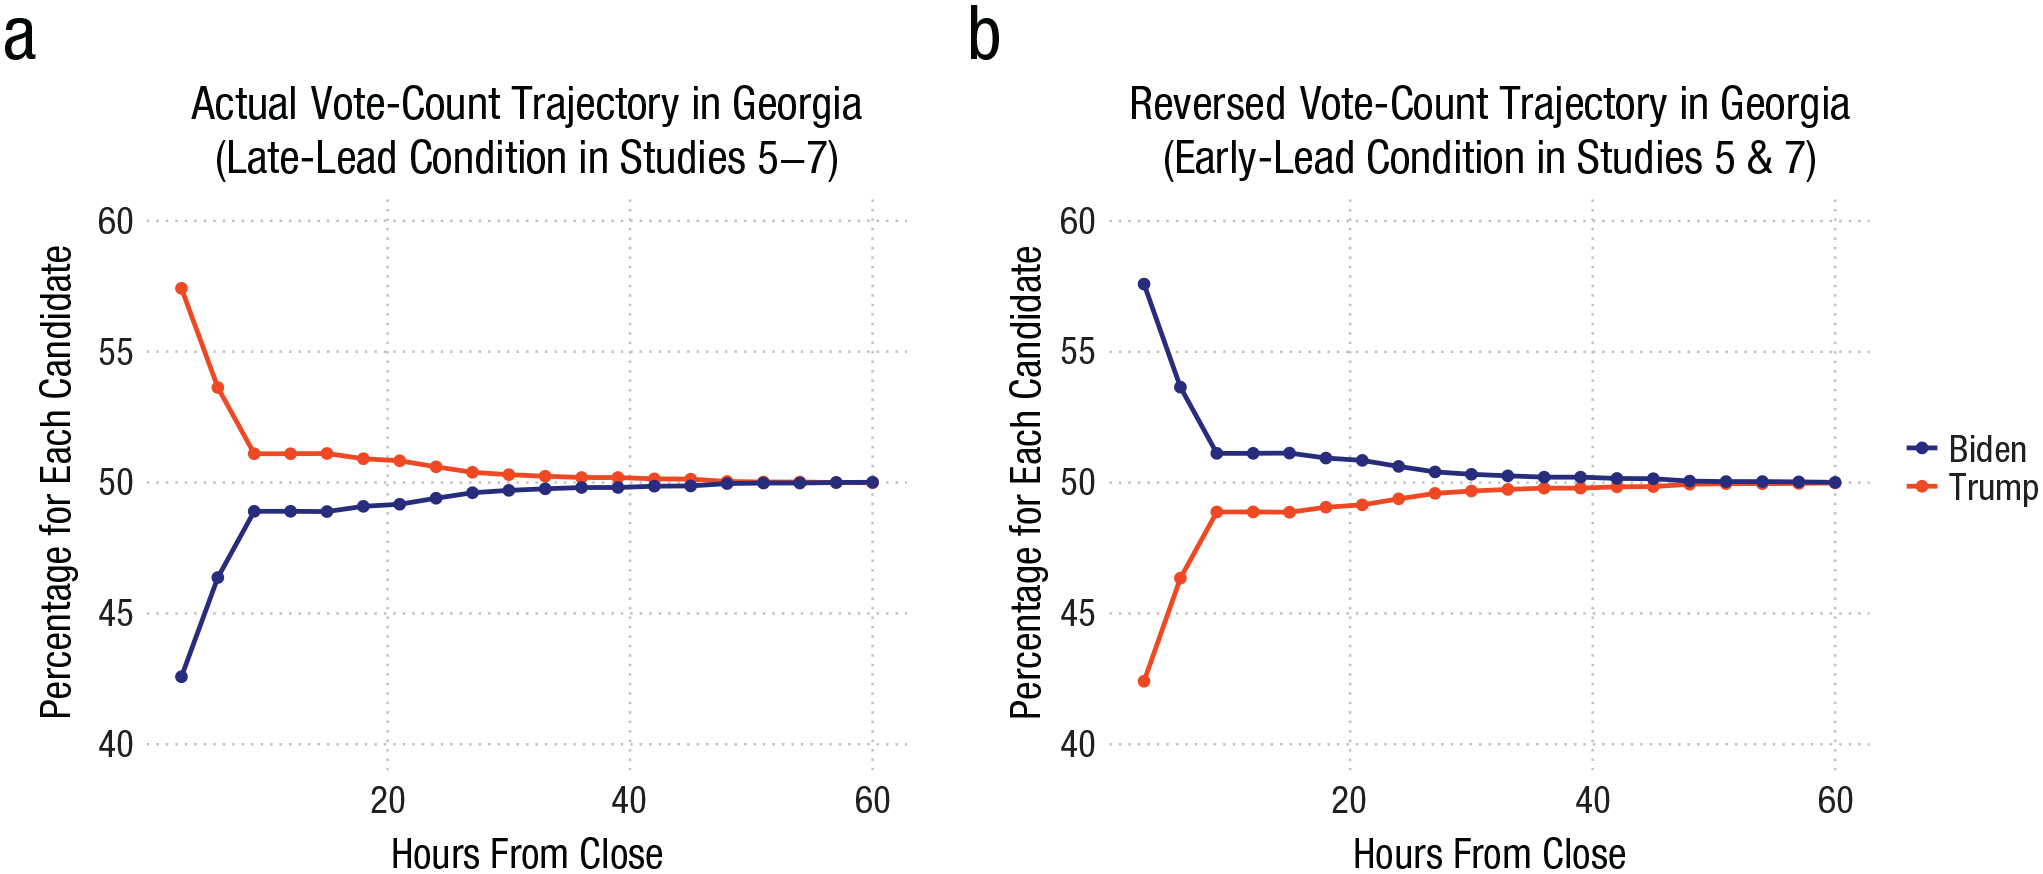
Actual (a) and reversed (b) vote-count trajectory in Georgia in the 2020 U.S. presidential election.
The procedure was identical to Study 4’s except for the following changes: First, participants went through 20 updates that showed them the percentage of total votes in 3-hr increments. Second, the updates stopped before all the votes were counted (i.e., at 99.25% of votes counted). Third, participants judged the likelihood that the vote counting had been manipulated in favor of either candidate: “How likely do you think it is that the counting of the votes was manipulated in favor of Miroslav K. [Lukas P.] on a scale from 1 (very unlikely) to 10 (very likely)?”, assessed in random order.
Results
We entered the likelihood of vote-manipulation judgments (see Fig. 5, left) into a mixed 2 (Lead: Early vs. Late, between-subjects) × 2 (Candidate: Winning vs. Losing, within-subjects) ANOVA. The main effect of lead, F(1, 164) = 0.59, p = .445, η p 2 = .01, and the main effect of candidate, F(1, 164) = 2.04, p = .155, η p 2 < .01, were not significant. As predicted, there was a significant interaction, F(1, 164) = 41.57, p < .001, η p 2 = .20. Pairwise comparisons showed that participants judged it more likely that the vote count was manipulated in favor of the currently winning candidate than the currently losing candidate in the late-lead condition, t(164) = 5.32, p < .001, d = 0.42. The reverse was true in the early-lead condition—here, participants actually judged it more likely that the vote count was manipulated in favor of the currently losing candidate than the currently winning candidate, t(164) = −3.73, p < .001, d = −0.29.
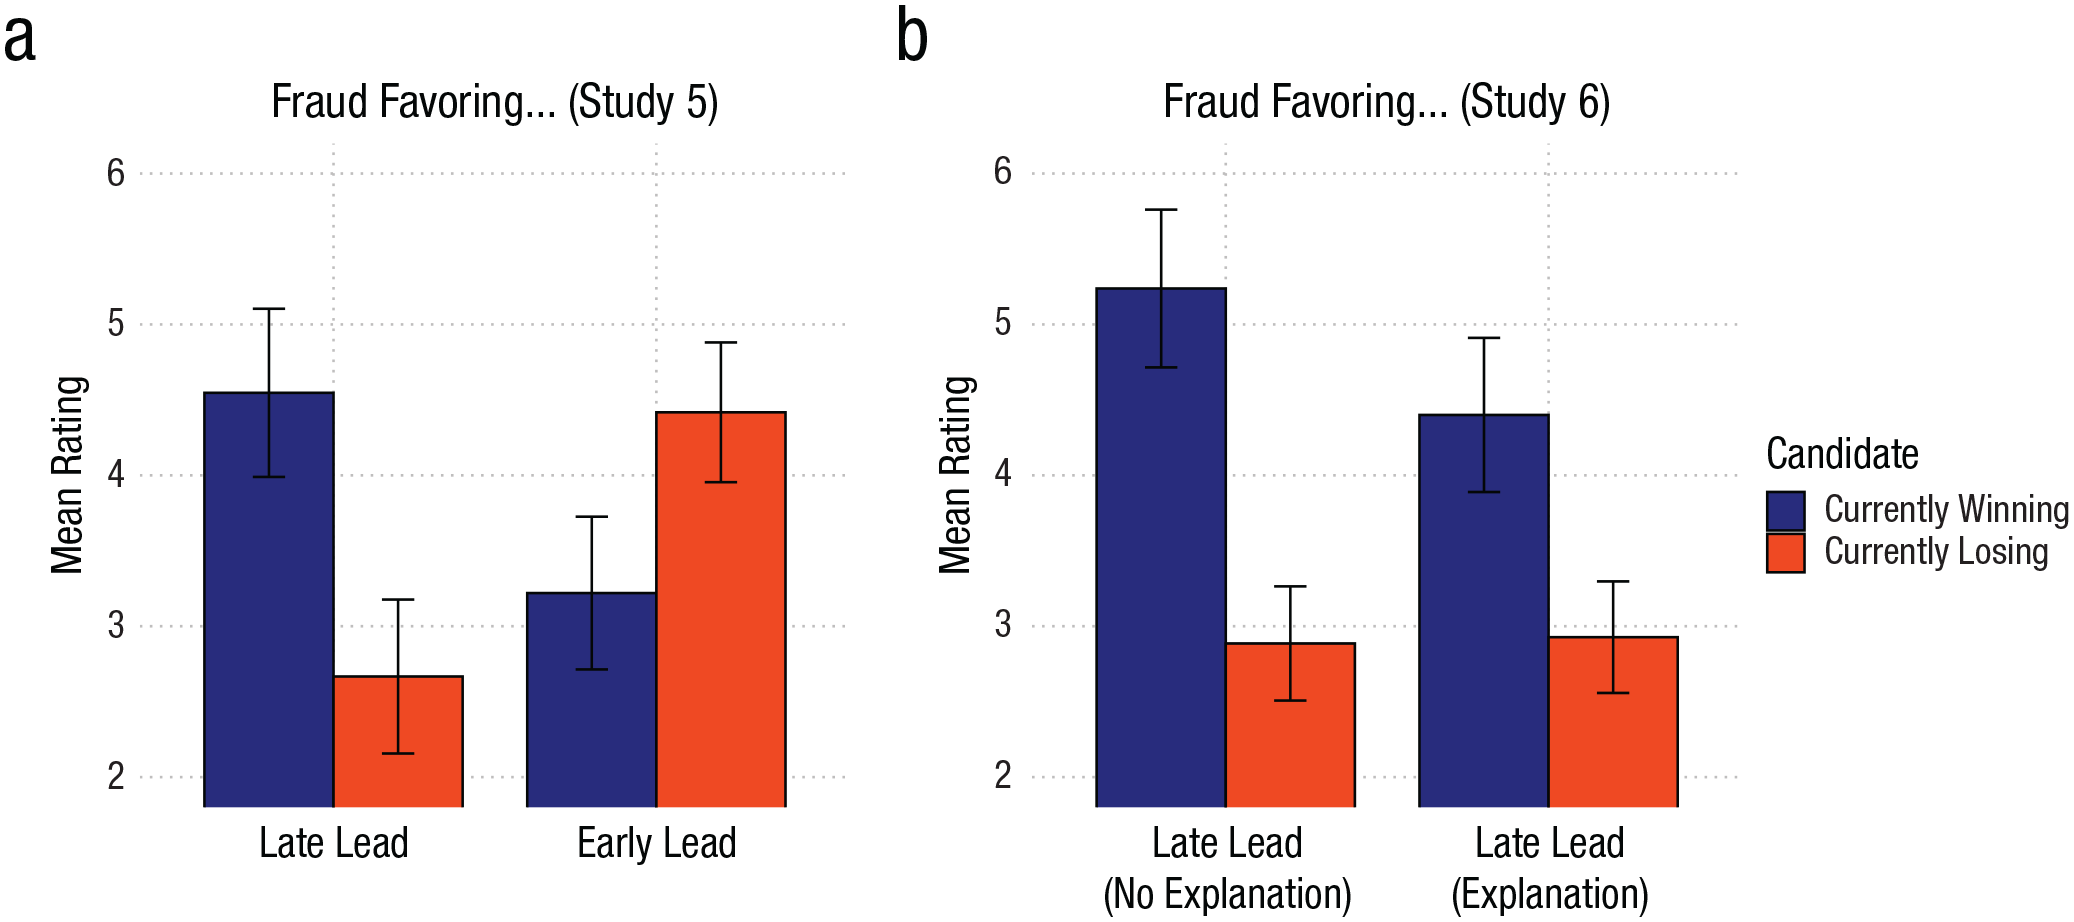
Results from Studies 5 and 6. Error bars represent 95% confidence intervals. In both graphs, the range is from 1, very unlikely, to 10, very likely.
Discussion
Study 5 confirmed the prediction, based on the CRB, that vote-count order influences perceptions of election fraud even before the vote count is finished. When the winning candidate (i.e., Biden) took a late lead, as in Georgia in 2020, participants found fraud in favor of the winning candidate more likely than fraud in favor of the losing candidate. Crucially, in the reversed early-lead scenario, participants found fraud in favor of the losing candidate (i.e., Trump) more likely. These findings suggest that had the ballots in Georgia been counted in reverse order, people might have been more inclined to suspect a Trump-favoring manipulation of the vote count.
Study 6: Explanations
Study 6 tested whether fraud perception is mitigated if explanations for the vote-count trajectories were provided to participants (e.g., regional differences in candidate popularity). Such explanations were publicly discussed during election night and even before the election. Hence, if the CRB contributed to false beliefs in election fraud, it must be somewhat resistant to such explanations. We tested this in Study 6.
Method
Study 6 was identical to the late-lead condition of Study 5, but introduced, for half the participants, an explanation (ostensibly given by the people responsible for the vote count) for why the winning candidate only took the lead late in the vote count: that the losing candidate is more popular in rural areas, where votes were counted first. The hypotheses, method, sample size, exclusion criteria, and analysis plan of Study 6 were preregistered prior to data collection: https://aspredicted.org/jwbq-6435.pdf. We recruited 300 U.S. participants from Prolific (176 female, 117 male, 7 nonbinary; Mage = 40.60 years, SDage = 17.58 years) who took part in the study via Qualtrics. Consistent with our preregistration, we excluded 83 participants who failed the attention check, resulting in a final sample of 215.
The procedure was the same as the late-lead condition in Study 5. However, in addition to being told that there were rumors of vote fraud, half the participants were provided with an explanation for the late lead of the winning candidate, ostensibly given by the people responsible for the vote count: “They argued that votes from rural areas where [the losing candidate] is popular were counted earlier than votes from urban areas where [the winning candidate] is popular.”
Results
We entered the likelihood of vote-manipulation judgments (see Fig. 5; right) into a mixed 2 (Explanation: Control vs. Provided, between-subjects) × 2 (Candidate: Winning vs. Losing, within-subjects) ANOVA. First, there was a significant main effect of candidate, F(1, 213) = 98.17, p < .001, η p 2 = .32, so that overall participants judged it more likely that votes were manipulated to favor the winning candidate than the losing candidate. More important, although the main effect of explanation was not significant, F(1, 213) = 2.35, p = .127, η p 2 = .01, there was a significant interaction effect, F(1, 213) = 5.19, p = .024, η p 2 = .02. Specifically, the effect of candidate was stronger in the control condition, t(213) = 8.52, p < .001, d = 0.58, than in the explanation condition, t(213) = 5.46, p < .001, d = 0.37. Although the explanation reduced the effect, it did not eliminate it.
Discussion
Study 6 showed that the CRB persists even if the early lead of the losing candidate is explained, suggesting that the effect also resisted such explanations in the 2020 election.
Study 7: The CRB in the 2020 Election
In the final Study 7, we tested whether the CRB also induces beliefs about election fraud when participants actually know the candidates (i.e., Biden vs. Trump) and when they have partisan relationships with those candidates.
Method
Study 7 tested whether the results from Study 5 replicate when (American) participants were made aware that the vote counts refer to the American 2020 presidential election’s state-level results in an undisclosed state. Furthermore, Study 7 tested whether the effects even emerge for people who identify as a Democrat or a Republican. The hypotheses, method, sample size, exclusion criteria, and analysis plan of Study 7 were preregistered prior to data collection: https://aspredicted.org/6b22-4vvs.pdf. We recruited 400 U.S. participants from Prolific (gender: 259 female, 135 male, 3 nonbinary, 3 other; political affiliation: 197 Democrat, 189 Republican, 14 undecided; Mage = 41.62 years, SDage = 13.49 years) who took part in the study via Qualtrics. Consistent with our preregistration, we excluded from analyses the 14 participants who answered “undecided” regarding their political affiliation and the additional 59 participants who failed the attention check. This resulted in a final sample of 327.
The procedure was the same as that of Study 5, with three differences: First, participants were explicitly told that the study was about the 2020 presidential election and that they would see the vote-counting race between Joe Biden and Donald Trump in “one federal state.” Second, we did not counterbalance which candidate was winning at the moment of judgment—as happened with the real data, Joe Biden was always presented as the winning candidate. Third, along with age and gender, participants were asked to indicate their political affiliation.
Results
We entered the likelihood of vote-manipulation judgments (see Fig. 6) into a mixed 2 (Political Affiliation: Democrat vs. Republican, between-subjects) × 2 (Lead: Early vs. Late, between-subjects) × 2 (Candidate: Joe Biden vs. Donald Trump, within-subjects) ANOVA. There was a main effect of political affiliation, F(1, 323) = 79.11, p < .001, η p 2 = .20, which was further qualified by a Candidate × Political Affiliation interaction, F(1, 323) = 203.57, p < .001, η p 2 = .39. Whereas Republican participants judged the vote count more likely to be manipulated in favor of Joe Biden than Donald Trump, t(323) = 15.69, p < .001, d = 0.87, Democrat participants showed the opposite pattern, judging it less likely that the vote count was manipulated in favor of Joe Biden than Donald Trump, t(323) = −4.37, p < .001, d = −0.24.
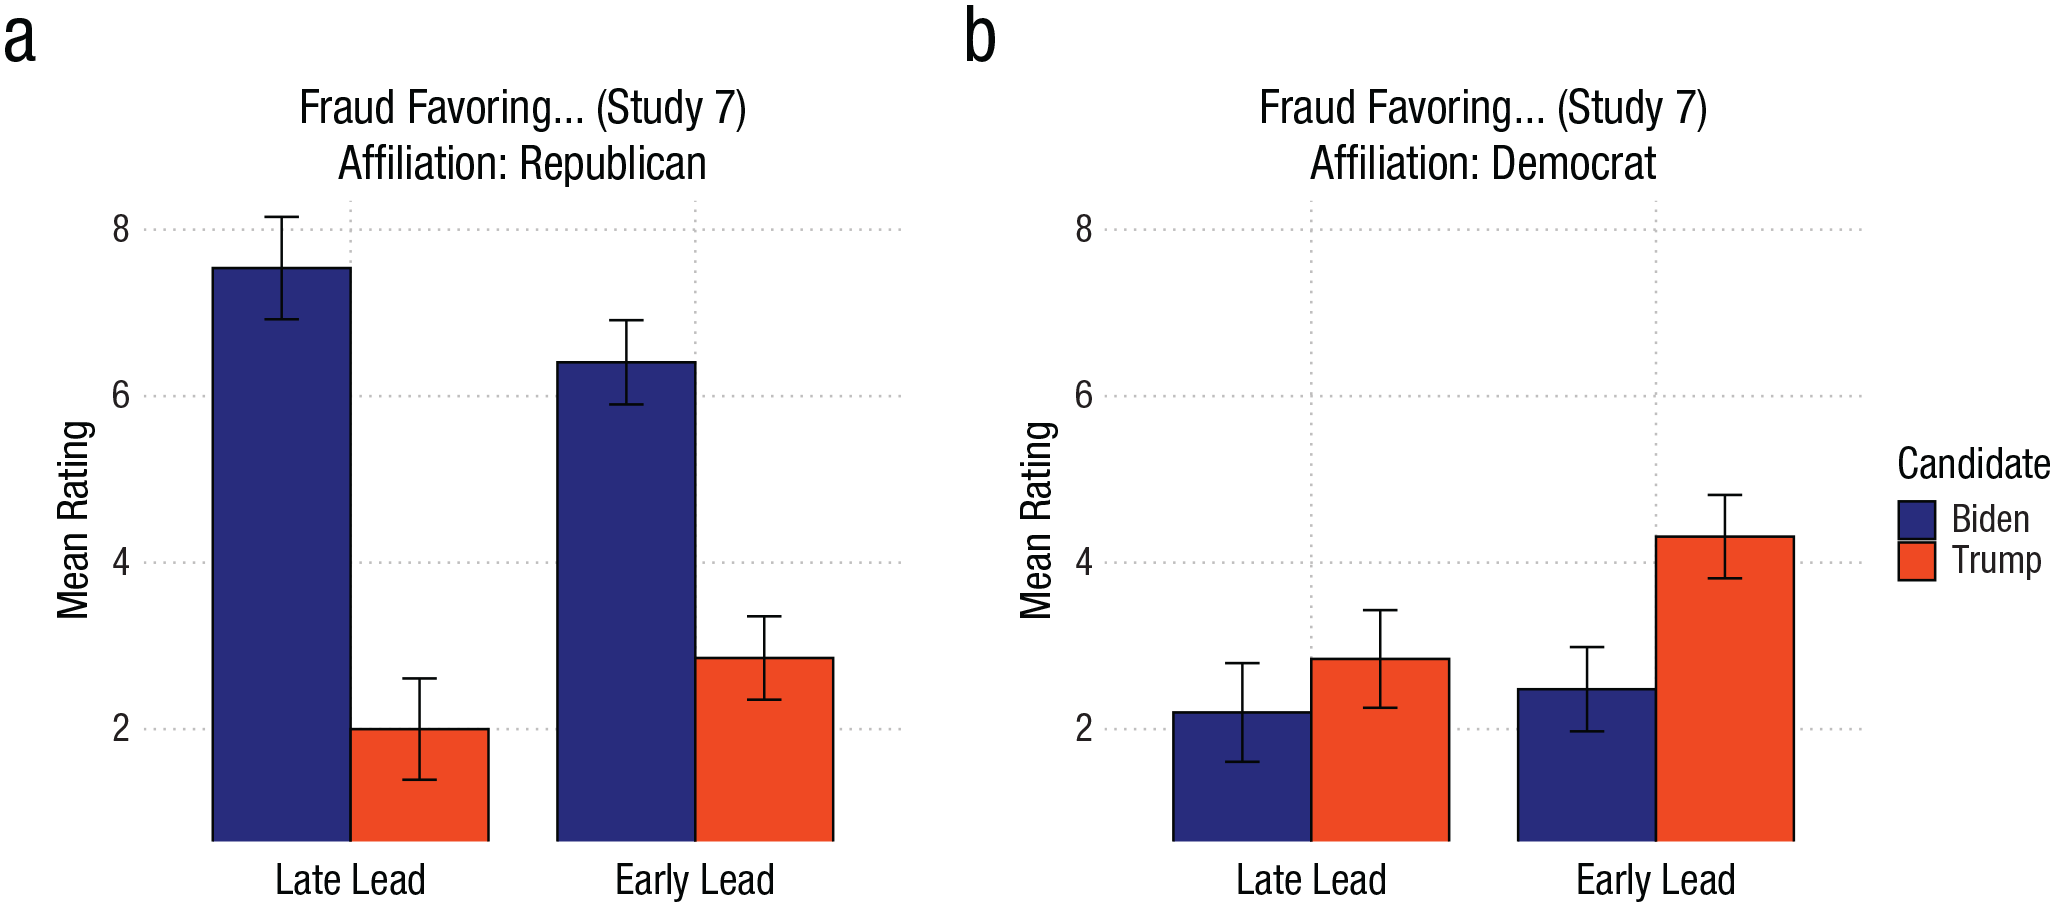
Results from Study 7. Error bars represent 95% confidence intervals. In both graphs, the range is from 1, very unlikely, to 10, very likely.
Crucially, there was also a main effect of candidate, F(1, 323) = 66.57, p < .001, η p 2 = .17, which was qualified by the predicted Lead × Candidate two-way interaction, F(1, 323) = 15.36, p < .001, η p 2 = .05. Participants in the late-lead condition judged it more likely that the vote count was manipulated to favor Joe Biden than Donald Trump, t(323) = 7.88, p < .001, d = 0.44, and this tendency was reduced in the early-lead condition, t(323) = 3.30, p = .001, d = 0.18. We observed no evidence that this Lead × Candidate interaction depended on affiliation, F(1, 323) = 0.96, p = .327, η p 2 < .01.
There was also an unexpected Lead × Political Affiliation interaction, F(1, 323) = 6.70, p = .010, η p 2 = .02, so that Democrats gave overall higher judgments in the early-lead condition than in the late-lead condition, t(323) = 3.19, p = .002, d = 0.36. Republicans showed no differences between the early-lead and the late-lead condition, t(323) = 0.50, p = .620, d = 0.06.
Discussion
Study 7 replicated the CRB in a context that explicitly referred to the 2020 presidential election and featured Democratic and Republican participants. Although Republicans deemed election fraud supporting Biden more likely, and Democrats deemed election fraud supporting Trump more likely, Biden’s late lead in the vote count influenced perceptions of fraud for Republicans and Democrats alike. Had the ballots been counted in reverse order, allegations of Biden-favoring election fraud might have been less pervasive among Republicans. In contrast, Democrats might have been more inclined to believe in Trump-favoring fraud had the votes been counted in reverse order. These findings are remarkable because they show the CRB’s influence on people’s beliefs about fraud in the 2020 U.S. election—an election that had already occurred and received extensive media coverage.
General Discussion
Our research shows that the order in which election votes are counted and reported can influence public perceptions of the election’s legitimacy. Specifically, when the winner of an election takes a late lead, people are more willing to believe the election was fraudulent than when the winner takes an early lead—even when the results are identical. As evidenced in the 2020 U.S. elections, the trajectories of vote counting are heavily influenced by the order in which votes are counted. Consider the example of Democrat-leaning voters, who are more likely to vote by mail or in urban areas, where the counting process takes longer. The resulting vote-count trajectory may appear suspicious to observers, because the most recent observation contradicts their earlier expectations of who will win. In such cases, observers fall victim to the CRB, in which previous cumulative standings influence their impressions of the competition. The CRB reflects the human mind’s general struggle with discounting information once it is processed (Gilbert, 1991; Gilbert et al., 1993). It seems that “once a piece of information has entered that system, we cannot help but to use it” (Unkelbach et al., 2007). Although our results are potentially limited to English-speaking Prolific users, we have no reason to expect the effects to be limited to such a population.
Our research suggests that false beliefs in illegitimate elections might be mitigated if the results were publicized only after all votes had been counted. However, receiving no information or delayed information about election results might raise suspicions as well (Lockhart et al., 2024). To some extent, false beliefs in election fraud may also be reduced by educating the public better about the (sometimes arbitrary) factors that lead to specific vote-counting trajectories. Alternatively, more sophisticated forecasting algorithms that incorporate various information sources beyond live reporting (e.g., Donnini et al., 2024) might prevent the communication of partial results that fail to align with the final result.
Supplemental Material
sj-docx-1-pss-10.1177_09567976251355594 – Supplemental material for “Stop the Count!”—How Reporting Partial Election Results Fuels Beliefs in Election Fraud
Supplemental material, sj-docx-1-pss-10.1177_09567976251355594 for “Stop the Count!”—How Reporting Partial Election Results Fuels Beliefs in Election Fraud by André Vaz, Moritz Ingendahl, André Mata and Hans Alves in Psychological Science
Footnotes
Transparency
Action Editor: Yoel Inbar
Editor: Simine Vazire
Author Contributions
The first and second authors contributed equally to this work.
Notes
References
Supplementary Material
Please find the following supplemental material available below.
For Open Access articles published under a Creative Commons License, all supplemental material carries the same license as the article it is associated with.
For non-Open Access articles published, all supplemental material carries a non-exclusive license, and permission requests for re-use of supplemental material or any part of supplemental material shall be sent directly to the copyright owner as specified in the copyright notice associated with the article.