
Abstract
ADHD, dyslexia, and dyscalculia often co-occur, and the underlying continuous traits are correlated (ADHD symptoms, reading, spelling, and math skills). This may be explained by trait-to-trait causal effects, shared genetic and environmental factors, or both. We studied a sample of ≤ 19,125 twin children and 2,150 siblings from the Netherlands Twin Register, assessed at ages 7 and 10. Children with a condition, compared to those without that condition, were 2.1 to 3.1 times more likely to have a second condition. Still, most children (77.3%) with ADHD, dyslexia, or dyscalculia had just one condition. Cross-lagged modeling suggested that reading causally influences spelling (β = 0.44). For all other trait combinations, cross-lagged modeling suggested that the trait correlations are attributable to genetic influences common to all traits, rather than causal influences. Thus, ADHD, dyslexia, and dyscalculia seem to co-occur because of correlated genetic risks, rather than causality.
Keywords
Introduction
Decades of research have shown that students with attention-deficit/hyperactivity disorder (ADHD) tend to perform poorly in school (average r = .32; Frazier et al., 2007). Moreover, having more ADHD symptoms is associated with lower school achievement (Polderman et al., 2010). Indeed, ADHD co-occurs more often than expected by chance with the learning difficulties dyslexia and dyscalculia. Dyslexia is characterized by poor and slow decoding and is often associated with poor spelling (Snowling & Hulme, 2021); dyscalculia is characterized by poor mathematical skills and is typically associated with deficient number representations (Kaufmann et al., 2013).
Children with a “double whammy” of ADHD and a learning difficulty are at even higher risk of psychopathology and academic and social difficulties compared with children who present with a single condition (Willcutt et al., 2007). Therefore, it is important to determine the degree and the nature of co-occurrence. Here we examined these issues in a large, genetically informative sample of twins, assessed longitudinally at ages 7 and 10. We estimated co-occurrence, and we investigated whether the interrelatedness of underlying traits is attributable to causality or shared aetiology (confounding). 1
Rates of co-occurrence
A review of predominantly clinical studies of ADHD samples revealed that 45% of children with ADHD had a co-occurring learning difficulty (DuPaul et al., 2013). A study of medical records of ~2,000 children in ADHD clinics found that 56% had a co-occurring learning difficulty (Reale et al., 2017). However, estimates of co-occurrence in clinical samples are likely overestimated, because children with more than one condition are more likely to be referred (Neale & Kendler, 1995). Reported rates in population-based samples are often lower. For example, in a population sample of ~4,000 children, 25% of the children with ADHD symptoms also had parent-reported dyslexia, and 7% had parent-reported dyscalculia (Czamara et al., 2013). In a population sample of ~3,000 children, 28% of the children who suffered one or more learning difficulty also had ADHD (Visser et al., 2020). In a study on co-occurrence among learning difficulties in a population sample of ~2,500 children, children with a difficulty in one learning domain (word-reading, spelling, or math) were 4 to 5 times more likely to have difficulties in another learning domain (Landerl & Moll, 2010).
Categorical versus continuous
Although diagnostic labeling of developmental conditions is categorical, we recognize that the (latent) traits underlying ADHD, dyslexia, and dyscalculia are continuous. In the case of ADHD, the ADHD liability represents a continuous latent trait. The ADHD test score (i.e., the sum of symptom scores) represents the proxy for this liability. The binary ADHD diagnosis itself arises from the imposition of a diagnostic threshold on this proxy. This dimensional view also applies to diagnoses of dyslexia and dyscalculia, which are based on math ability and on word-level reading and spelling abilities (Daucourt, Haughbrook, et al., 2020; Polderman et al., 2007).
Causes of co-occurrence
Shared-risk factors
A useful framework to investigate the aetiology of co-occurrence among developmental conditions is the (intergenerational) multiple-deficit model (Pennington, 2006; van Bergen et al., 2014). This framework posits that developmental conditions are attributable to multiple probabilistic risk factors, which can be identified at different levels of analyses: genes, brain, cognition, and environment. Domain-general risk factors increase the susceptibility to multiple conditions, giving rise to co-occurrence, while domain-specific risk factors increase the susceptibility to one condition in particular. At the environmental level, ADHD symptoms and reading are assumed to be influenced by common family and school environments (rC > 0; Daucourt, Erbeli, et al., 2020). At the genetic level, both twin studies and genome-wide association studies have shown shared genetic influences on ADHD and educational outcomes (rA > 0; Daucourt, Erbeli, et al., 2020; Demontis et al., 2023). Shared genetic influences are also well established among academic skills (Plomin & Kovas, 2005) and between ADHD and other psychopathologies (Caspi et al., 2014). Such genetic risk factors manifest as overlapping deficits at the brain and cognitive levels (though note that these deficits could also be a consequence rather than a cause). At the brain level, ADHD and dyslexia are associated with common brain alterations (Langer et al., 2019); at the cognitive level, ADHD and dyslexia are associated with slow processing speed (Willcutt et al., 2005). Co-occurrence research addressing dyscalculia is sparse (Bishop, 2010b).
Statement of Relevance
Children with ADHD, dyslexia, and dyscalculia face significant academic challenges, and the co-occurrence of these conditions can exacerbate negative life outcomes. Understanding the root of this co-occurrence is essential for developing effective interventions. Our large-scale study (~20,000 children) reveals that, contrary to common belief, only about one-quarter of children with one condition also have another, meaning the majority have just one condition. Furthermore, our analyses suggest that the overlap between these conditions is not driven by one condition causing another, but by shared genetic risks. Although schooling is fundamental for children to acquire reading, spelling, and math skills, our findings reveal that individual differences in these academic abilities—and their co-occurrence with ADHD—are largely driven by genetic factors. This insight is crucial for schools and clinicians, because it suggests that treating ADHD alone is unlikely to improve academic outcomes, and conversely, that addressing a learning difficulty will not necessarily alleviate ADHD symptoms.
Causality
Alternatively or additionally, the co-occurrence of two conditions could be due to causality, with one condition causally increasing the risk of another at the phenotypic level (Bishop, 2010a; Neale & Kendler, 1995). First, poor performance in school could cause ADHD symptoms: It may be that children find the class instruction too difficult because of their learning difficulty, so they struggle to pay attention and hence start to show maladaptive behavior, including ADHD symptoms. Second, ADHD symptoms could cause poor performance in school: Children’s ADHD behavior may impair their ability to pay attention to the teacher and to focus on classwork, which hampers their ability to learn and negatively affects school performance. These causal relationships are not mutually exclusive; that is, the direct effects may be reciprocal or bidirectional. To investigate causality empirically, important tools are Popperian logic (i.e., falsification) and model selection. Although causality cannot be proven, models with certain causal pathways can be rejected in favor of competing models that support the data. Using such tools, de Zeeuw et al. (2017) found support for the hypothesis that ADHD hampers school performance but did not test the reverse direction. Greven et al. (2012) reported a reciprocal relationship between ADHD and reading performance but noted that ADHD has a stronger relationship on reading than reading does on ADHD.
The current study
We assessed the co-occurrence between ADHD, dyscalculia, and dyslexia (see the main article) and between ADHD, dyscalculia, reading-fluency difficulty, and spelling difficulty (see the Supplemental Material available online). Dyslexia was assessed using a combined measure of reading fluency and spelling. Subsequently, we studied the association between ADHD symptoms, and math, reading, and spelling performance in longitudinal assessments at age 7 and age 10. We tested competing models regarding the nature of the associations among ADHD symptoms and math, reading, and spelling. We considered (a) the common risk model, in which the codevelopment is due to common genetic and environmental risk factors, and (b) the causal model, in which the co-development is due to uni- or bidirectional causality. We recognize that these models are not mutually exclusive and that the presence of a causal relationship does not rule out common risk factors. We therefore considered (c) hybrid models that include both causality and common risk factors.
Method
Participants
The data for this study come from the Netherlands Twin Register, a nationwide database of multiples and their family members with data available from birth onward (Ligthart et al., 2019). The sample for this study included 19,125 twins (from 10,365 families) born between 1989 and 2009 for whom two waves of data from school-achievement records and from teacher questionnaires were available.
At the time that the teachers completed the questionnaires, the twins were on average 7.38 years old (SD = 0.44) and 9.75 years old (SD = 0.59) at Wave 1 and Wave 2, respectively (henceforth referred to simply as “age 7” and “age 10”). The average age gap between waves was 2.39 years (SD = 0.56). At Wave 1, most twins attended grade 1 (67.3%) or grade 2 (26.3%), and at Wave 2, most attended Grade 3 (45.8%) or Grade 4 (42.2%). See the Supplemental Material for details on exclusion criteria, sex, and zygosity. Additional data for 2,150 siblings of these twins were included for additional analyses to test how representative the twin sample was of nontwin children. The study protocols were approved by the Central Ethics Committee on Research Involving Human Subjects of the VU University Medical Center, Amsterdam.
Measures
After receiving parental consent to approach the teacher, we asked teachers to complete a questionnaire on the children’s behavior and to provide children’s test scores from the national Pupil Monitoring System. For this study, we use teacher-report data of ADHD and school-achievement records of the school year in which the teacher filled out the ADHD questionnaire.
“ADHD symptoms at school” ratings were based on teacher responses on the short Conners’ Teacher Rating Scales–Revised (CTRS-R; Conners, 2001), which includes 12 items that constitute the ADHD index (see Supplemental Table S1). These 12 items do not concern learning difficulties or school performance. The ADHD index was our main outcome, but we also analyzed inattention and hyperactivity scale scores. Further details and the results for inattention and hyperactivity are given in the Supplemental Material.
School achievement ratings for reading, spelling, and math were based on children’s test scores from the national Pupil Monitoring System (Cito, 2014). Reading ability was operationalized as word-reading fluency, assessed by asking children to read aloud as many words as possible from a word list within 1 min; spelling ability was assessed by asking children to spell single words, which were dictated. Math ability was assessed by tests covering three subdomains: (a) numbers and operations; (b) ratios, fractions, and percentages; and (c) measurement and geometry, time, and money. We harmonized school achievement scores across school grades and versions. All measures had reliabilities equal to or greater than .90 (see the Supplemental Material).
Analyses
The analytical plan involved a series of steps. Each step is presented in detail below, but first we will explain the Popperian logic of how the use of a twin sample can be of help in addressing causality. In short, our analyses comprised the following. As a first step, as visualized in Fig. 1, we quantified the prevalence of ADHD, dyslexia, and dyscalculia in the sample, and we quantified the level of their co-occurrence to determine whether they co-occurred at a higher-than-chance level; without that, neither confounding nor causality would be supported. Second, using the full distribution of ADHD symptoms and reading, spelling, and math ability, we addressed causality. To triangulate our conclusion, we computed within-person change scores in ADHD symptoms and correlated these with change scores in reading, spelling, and math ability; computed within-twin-pair differences in these traits and correlated these across the traits; and fitted a series of longitudinal genetic models with cross-lagged paths. Specifically, we considered the following models: (a) the correlated liability model, in which the genetic and environmental influences common to the traits are the source of association. We used this model as our baseline model (see Fig. 2); (b) the causal model (see Fig. 3), in which the associations are due to direct phenotype-to-phenotype influences (consistent with the causal hypothesis); and (c) a combined model, combining common influences and direct phenotypic relations, allowing for causal relations in the presence of confounding genetic influences (see Fig. 4).
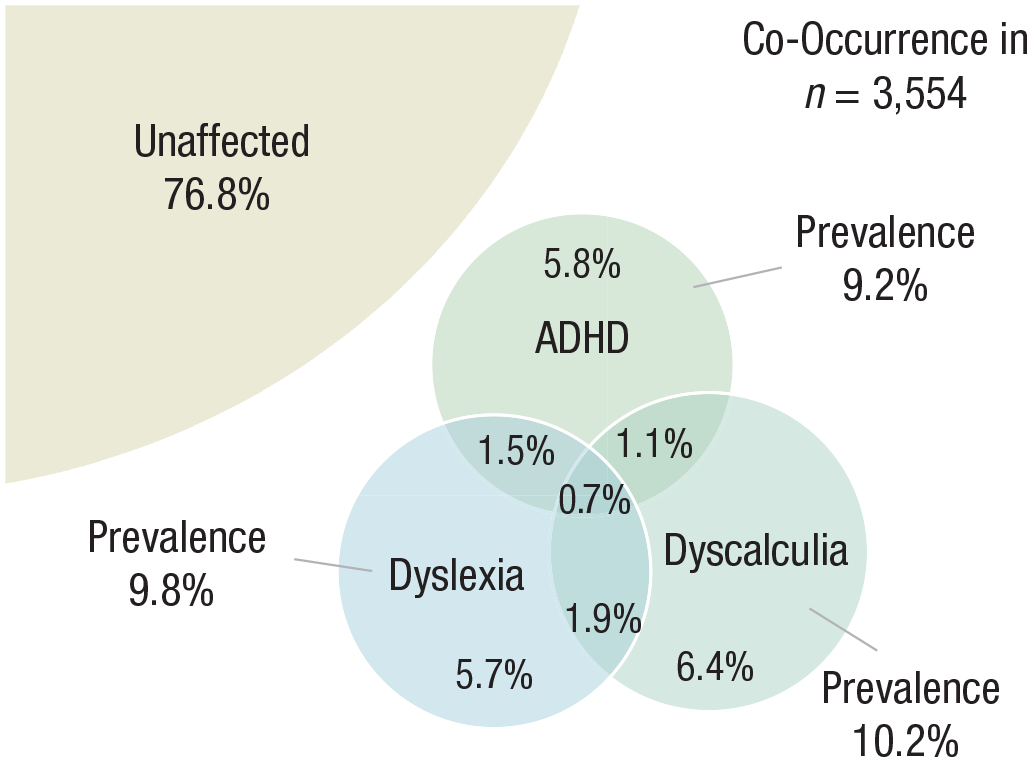
Prevalence and co-occurrence rates in the subsample with data on all three developmental conditions. Of the children with ADHD, dyslexia, and/or dyscalculia, 77.3% had just one of these conditions. ADHD = attention-deficit/hyperactivity disorder.
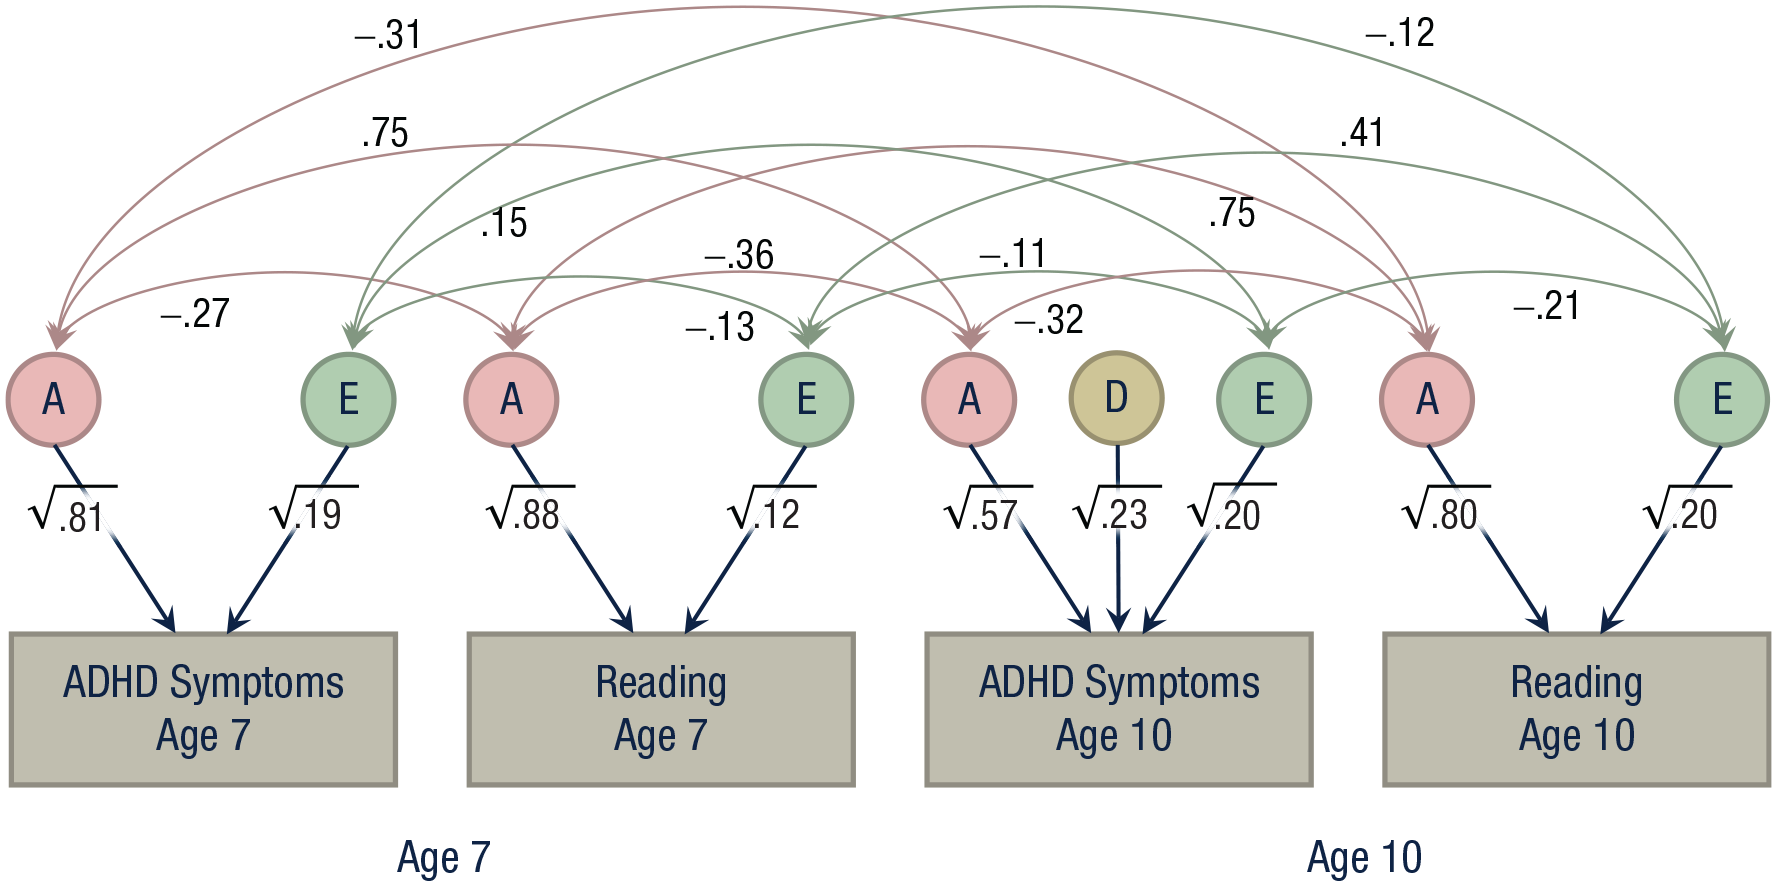
The behavioral-genetic baseline model, here shown for the relation between ADHD symptoms and reading skills. ADHD = attention-deficit/hyperactivity disorder.
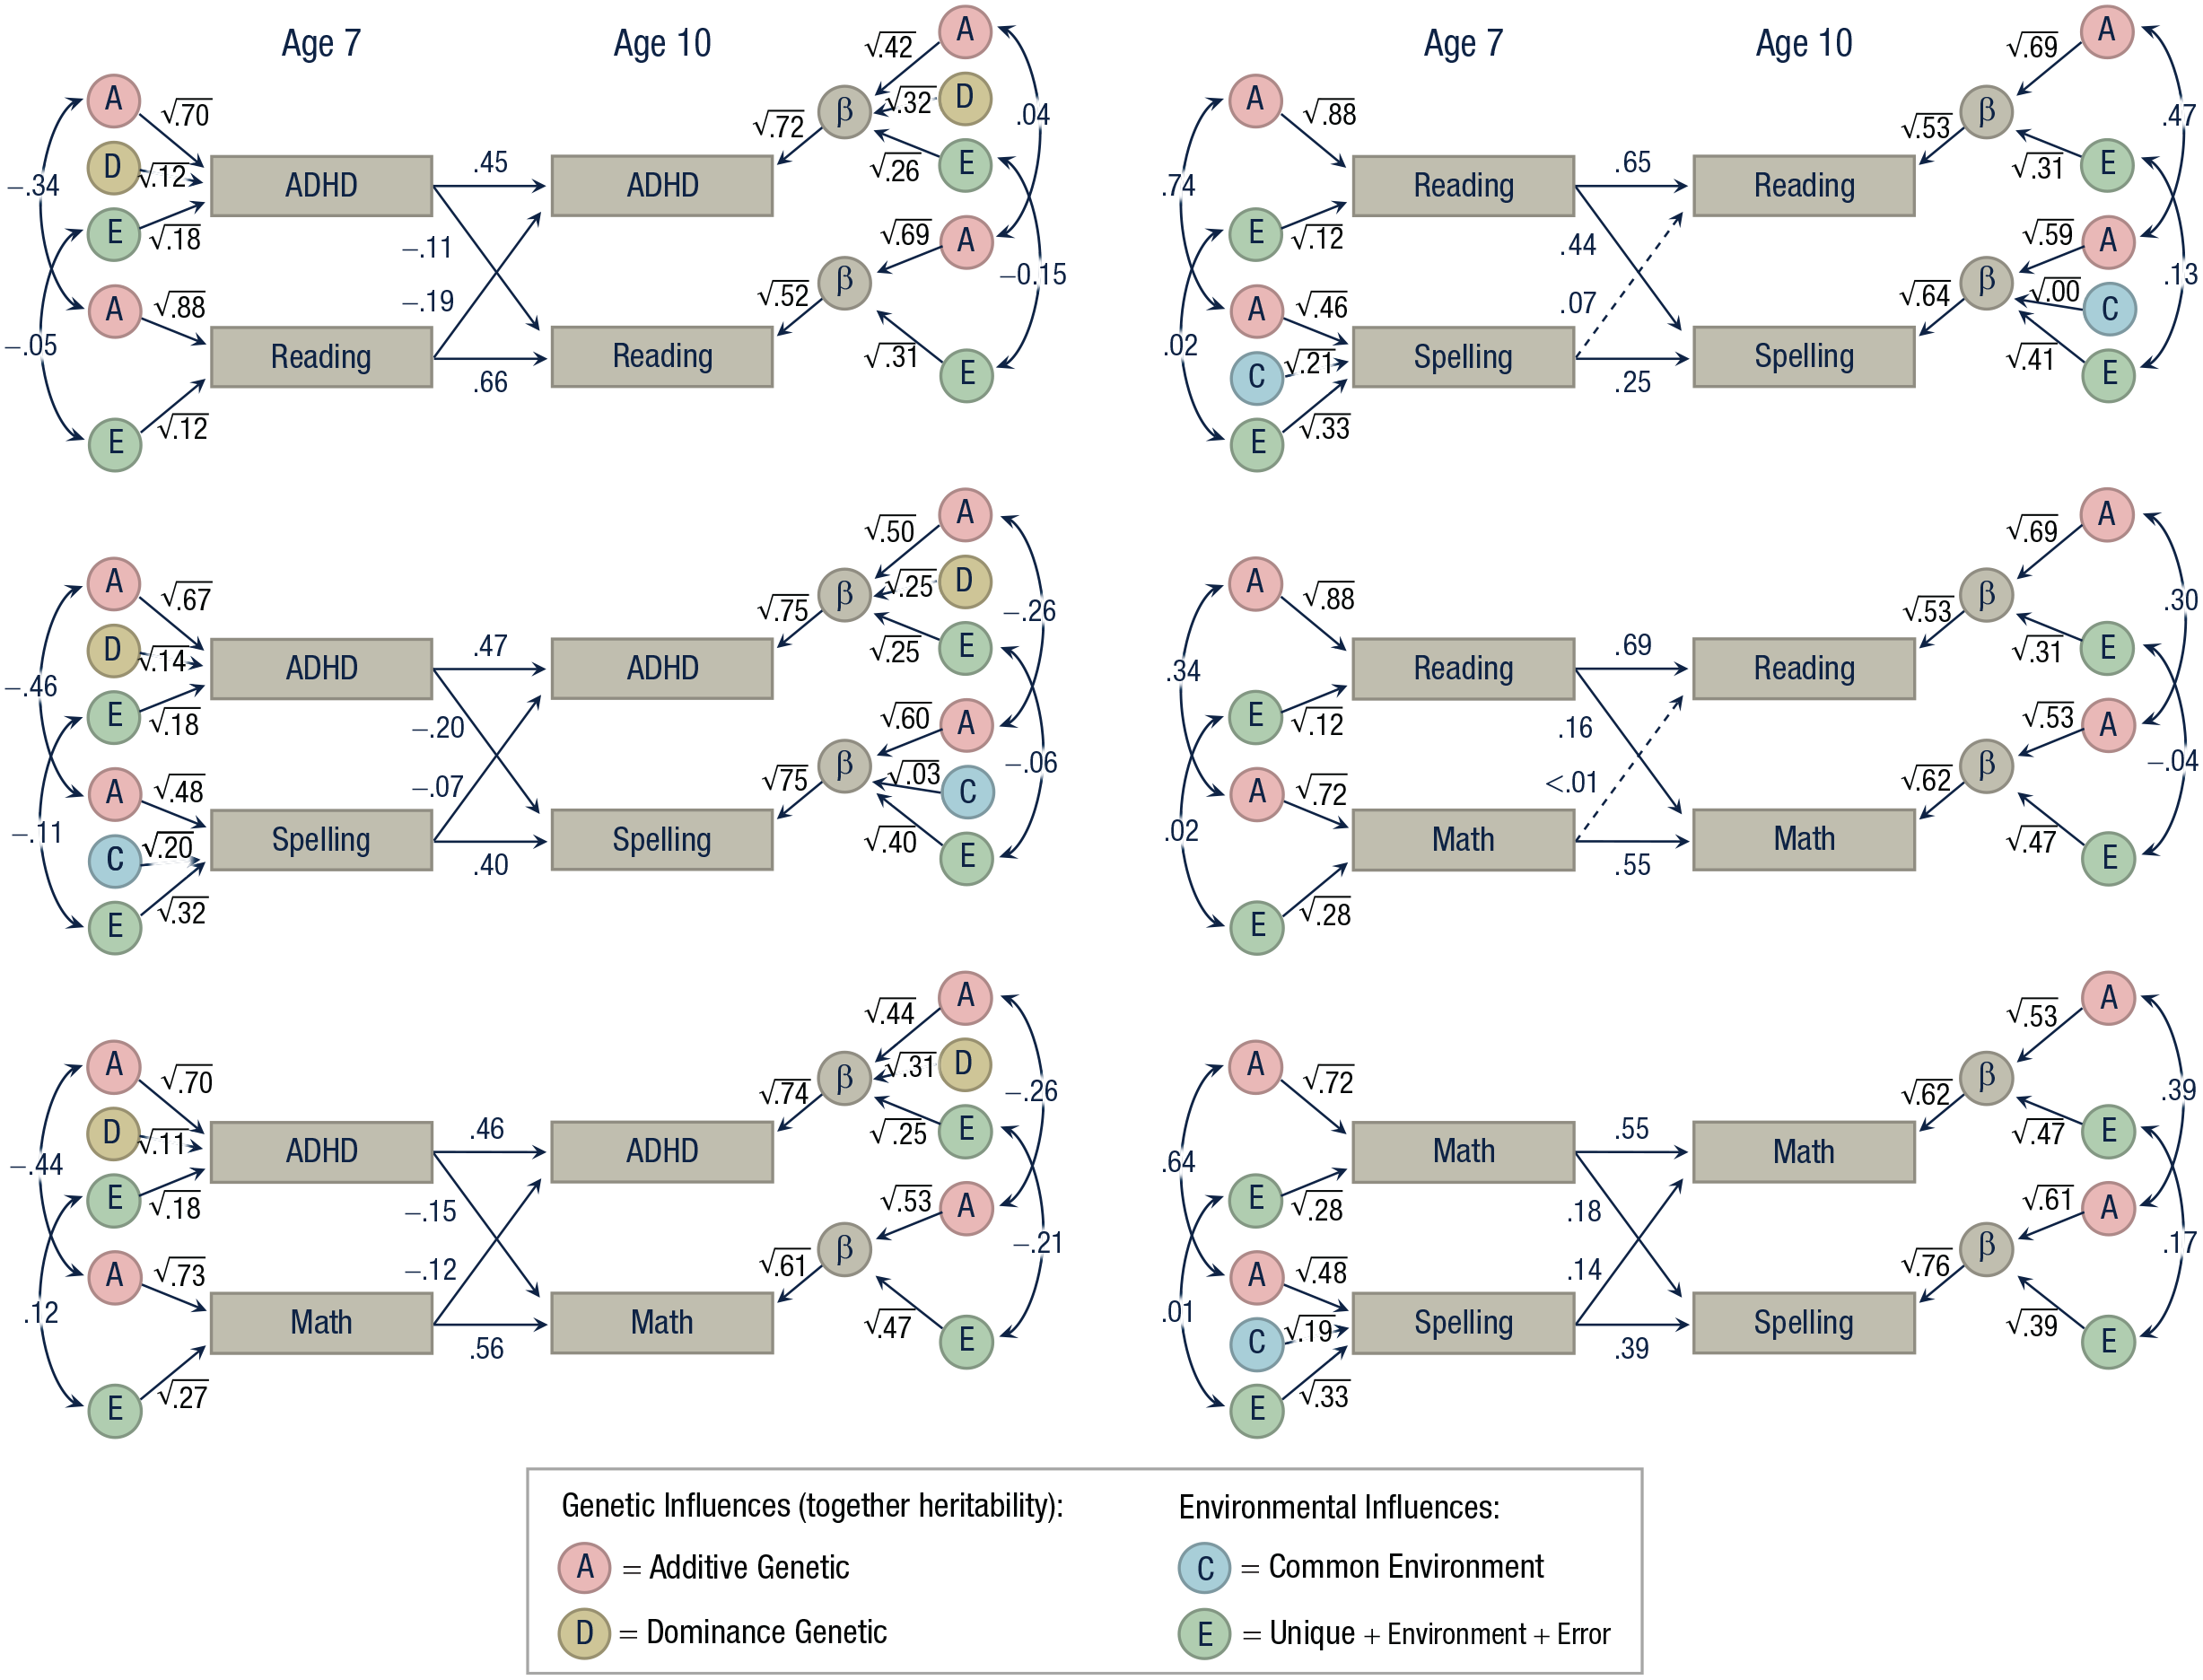
The behavioral-genetic cross-lagged models for ages 7 and 10, without genetic pleiotropy. These models are more parsimonious than the corresponding baseline models (Fig. 2) and hence are falsifiable. Significant βs (autoregressors and cross-lags) are shown as solid arrows and insignificant ones as dashed arrows. The βs are estimated on the full sample of twins, but the ACDE estimates are shown here for the twin pairs who were in the same class. The effective sample sizes for these models are as follows: ADHD–reading: N = 12,834; ADHD–spelling: N = 12,957; ADHD–math: N = 12,856; reading–spelling: N = 4,963: reading–math: N = 4,862; and math-spelling: N = 4,985 (see the Supplemental Material for details). ADHD = attention-deficit/hyperactivity disorder (“ADHD” refers to ADHD symptoms; “reading” refers to word-reading fluency).
Logic
If X causes Y or Y causes X, or both, differences in X are expected to correlate with differences in Y. So, for example, if ADHD causes dyslexia, then within-individual changes in ADHD symptoms are expected to correlate with individual changes in reading ability. A negative correlation between ADHD symptoms and reading ability would mean that, relative to peers, children who decrease in ADHD symptoms over time should, relative to others, increase in spelling ability. Note that such a finding would be in line with causality in either direction or both, but also that the absence of a correlation would provide empirical evidence against causality.
This logic can be extended to within-twin-pair differences. First, we acknowledge that twin pairs come in two kinds: monozygotic (MZ) twins, who share 100% of segregating alleles, and dizygotic (DZ) twins, who share (on average) 50% of segregating alleles. Under the causal hypothesis that X causes Y or Y causes X, or both, within pairs of genetically identical children (i.e., MZ pairs), within-pair differences in X must correlate with within-pair differences in Y (de Vries et al., 2021). So, for example, within-pair differences in ADHD symptoms are expected to correlate with within-pair differences in reading ability. A negative correlation would indicate that twins who show fewer symptoms of ADHD are expected to show better reading ability. Note again that such a correlation would be in line with causality in either direction, whereas the absence of a correlation would provide empirical evidence against causality.
Because our sample includes both kinds of twins (i.e., MZ and DZ), analyses can be even more sophisticated. On the basis of MZ and DZ covariance, it is possible to separate the total variance of a trait and the total covariance between traits into genetic and environmental components of variance and covariance (Knopik et al., 2017), or factors for short. If the MZ-twin-pair correlation is higher than the DZ-twin-pair correlation, this suggests that additive genetic factors (A) contribute to the individual differences of the trait under consideration (Knopik et al., 2017; see Hart et al., 2021, Fig. 2). If the MZ correlation is more than twice as high as the DZ correlation, this suggests the influence of genetic dominance factors (D). In the absence of D, the environmental variance can be decomposed into common or shared environmental factors (C) and residual nonshared environmental factors (E), which includes measurement error. The C factors contribute to twin similarity, while the E factors contribute to twin dissimilarity. If the phenotype is subject to only A and E, the MZ correlation is expected to be twice as high as the DZ correlation; if it is lower, this suggests that part of twin similarity is subject to C.
Returning to the within-pair difference correlation (rMZ-Δ), the behavioral-genetic design allows controlling statistical relations for confounding effects, such as genetic and environmental factors that influence both traits. If rMZ-Δ is nonzero, then X and Y are associated beyond common A (rA) and C (rC) factors. In that case, the residual phenotypic correlation, rphen, must be due to common E influences or causal phenotype-to-phenotype effects, or both; if rMZ-Δ is zero (but rphen is not), then the relation between X and Y (rphen) is due to shared aetiology (rA, rC, rE, or a combination). In case X and Y are both subjected to ADE rather than ACE, then in the above reasoning C can be replaced by D. If one of the traits is subjected to ADE (e.g., ADHD) and the other to ACE (e.g., academic skills), the rMZ-Δ controls for pleiotropy by A (rA), because there is no relation between D and C (rD = 0; rC = 0).
Co-occurrence
To quantify the prevalence and co-occurrence rates of ADHD, dyslexia, and dyscalculia, we chose cutoffs of ADHD symptoms, reading and spelling, and math to discriminate cases from controls (i.e., affected or unaffected). In line with the DSM-V, we selected the 10th percentile for all traits within our large sample to equate the prevalences. For ADHD, the Conners’ ADHD index can differentiate between children with and without ADHD in clinical and nonclinical populations (Conners, 2001). We identified the score that represented the 90th percentile, which was an ADHD index score of 13; consequently, any child with a raw score of 13 or above was categorized as affected. Students who scored in the bottom 10% on a combined measure of word-reading fluency and spelling ability (see the Supplemental Material) were determined to have dyslexia. We present here in the main article co-occurrence with dyslexia. In the Supplemental Material, we also present co-occurrence of ADHD and dyscalculia with reading-fluency difficulties and spelling difficulties, as two separate conditions.
We categorized twins and siblings as affected or unaffected at both waves. To maximize the sample, we took the age-10 status on affectedness, and if data was missing at that time point, filled it in with age-7 status. We preferred the age-10 status, because in clinical settings dyslexia and dyscalculia are usually not diagnosed in the first 2 years of formal schooling. We calculated co-occurrence rates in this subsample with information on all three conditions (N = 3,554). The siblings were included in these co-occurrence analyses, but not in any further analyses.
Within-subject change analyses
For each child, we calculated across trait changes across the two waves and correlated these results (e.g., ADHD symptoms twin 1, age 10 – ADHD symptoms twin 1, age 7 with reading ability twin 1, age 10 – reading ability twin 1, age 7). The analyses were done in both children of the twin pair separately, so that in these analyses cases were independent. Correlations were tested against zero (α = .05).
MZ within-pair difference analyses
We calculated the within-pair difference for each of the traits at each age and correlated these (e.g., ADHD symptoms twin 1, age 7 – ADHD symptoms twin 2, age 7 with reading ability twin 1, age 7 – reading ability twin 2, age 7). The correlations were tested against zero (α = .05).
Genetically sensitive modeling
We recognized that twin correlations of ADHD symptoms tend to be lower when they are rated by different teachers (Kan et al., 2014). In our sample, about half of the twin pairs were in different classes and therefore were each rated by different teachers (age 7: 46.2%; age 10: 47.3%). Consequently, we had four groups of twin pairs when considering whether the twins had the same teacher or not: same teacher at both ages, different teacher at both ages, changing from same to different teacher, and changing from different to same teacher. If a twin pair had data at one wave only and both twins attended the same class, we put them in the same-class group (and similarly for different classes). The two groups with changes were relatively small (n = 322) and hence were excluded from the remaining analyses.
Genetic variance decomposition
For the genetic-variance decomposition, we employed a four-group model: MZ same classes, MZ different classes, DZ same classes, and DZ different classes. The variance in ADHD symptoms was decomposed into A, D, and E components, and the variances in reading, spelling, and math skills into A, C, and E, on the basis of the observed MZ and DZ correlations and previous experience in this cohort. If the C or D component was found to be statistically nonsignificant (α = .05), it was dropped, resulting in an AE model. In all analyses, sex was included as a fixed covariate.
Longitudinal genetic modeling
After establishing the contributions of A, E, and either C or D, we investigated causality by fitting competing models. First, we established for each pair of traits a baseline model, in which the additive genetic components of the traits were merely correlated, and likewise, the nonshared environmental components, shared environmental components (whenever present for both traits), and nonadditive genetic components (whenever present for both). Figure 2 displays an example of this bivariate baseline model with only correlated As (rA) and Es (rE).
Second, we fitted bivariate cross-lagged models (see Fig. 3). Notably, in a twin design, these are not saturated and can be put to the statistical test. Under the assumption that the correlations between X and Y are due to X having a causal effect on Y or Y on X (or both), and nothing else, the genetic and environmental sources of variance are forced to have their effect on X and Y on the second measurement occasion through common pathways—that is, the phenotypic paths from X to Y. The cross-lagged panel is more parsimonious than the baseline model, in which longitudinal genetic and environmental pathways are independent of each other. Differences in fit (and degrees of freedom) can be used to test this cross-lagged model against the baseline model.
Third, if applicable, we resolved misfit in the cross-lagged models established in the prior step by adding longitudinal A pathways (see Fig. 4). By adding these, the genetic and environmental sources of variance are no longer forced to have their effect on X and Y on the second measurement occasion through common pathways. Phenotypic pathways are corrected for the influence of genetic pleiotropy. In case genetic pleiotropy is fully responsible for the codevelopment (and co-occurrence of conditions), the cross-lagged paths are expected to become zero (i.e., statistically nonsignificant).
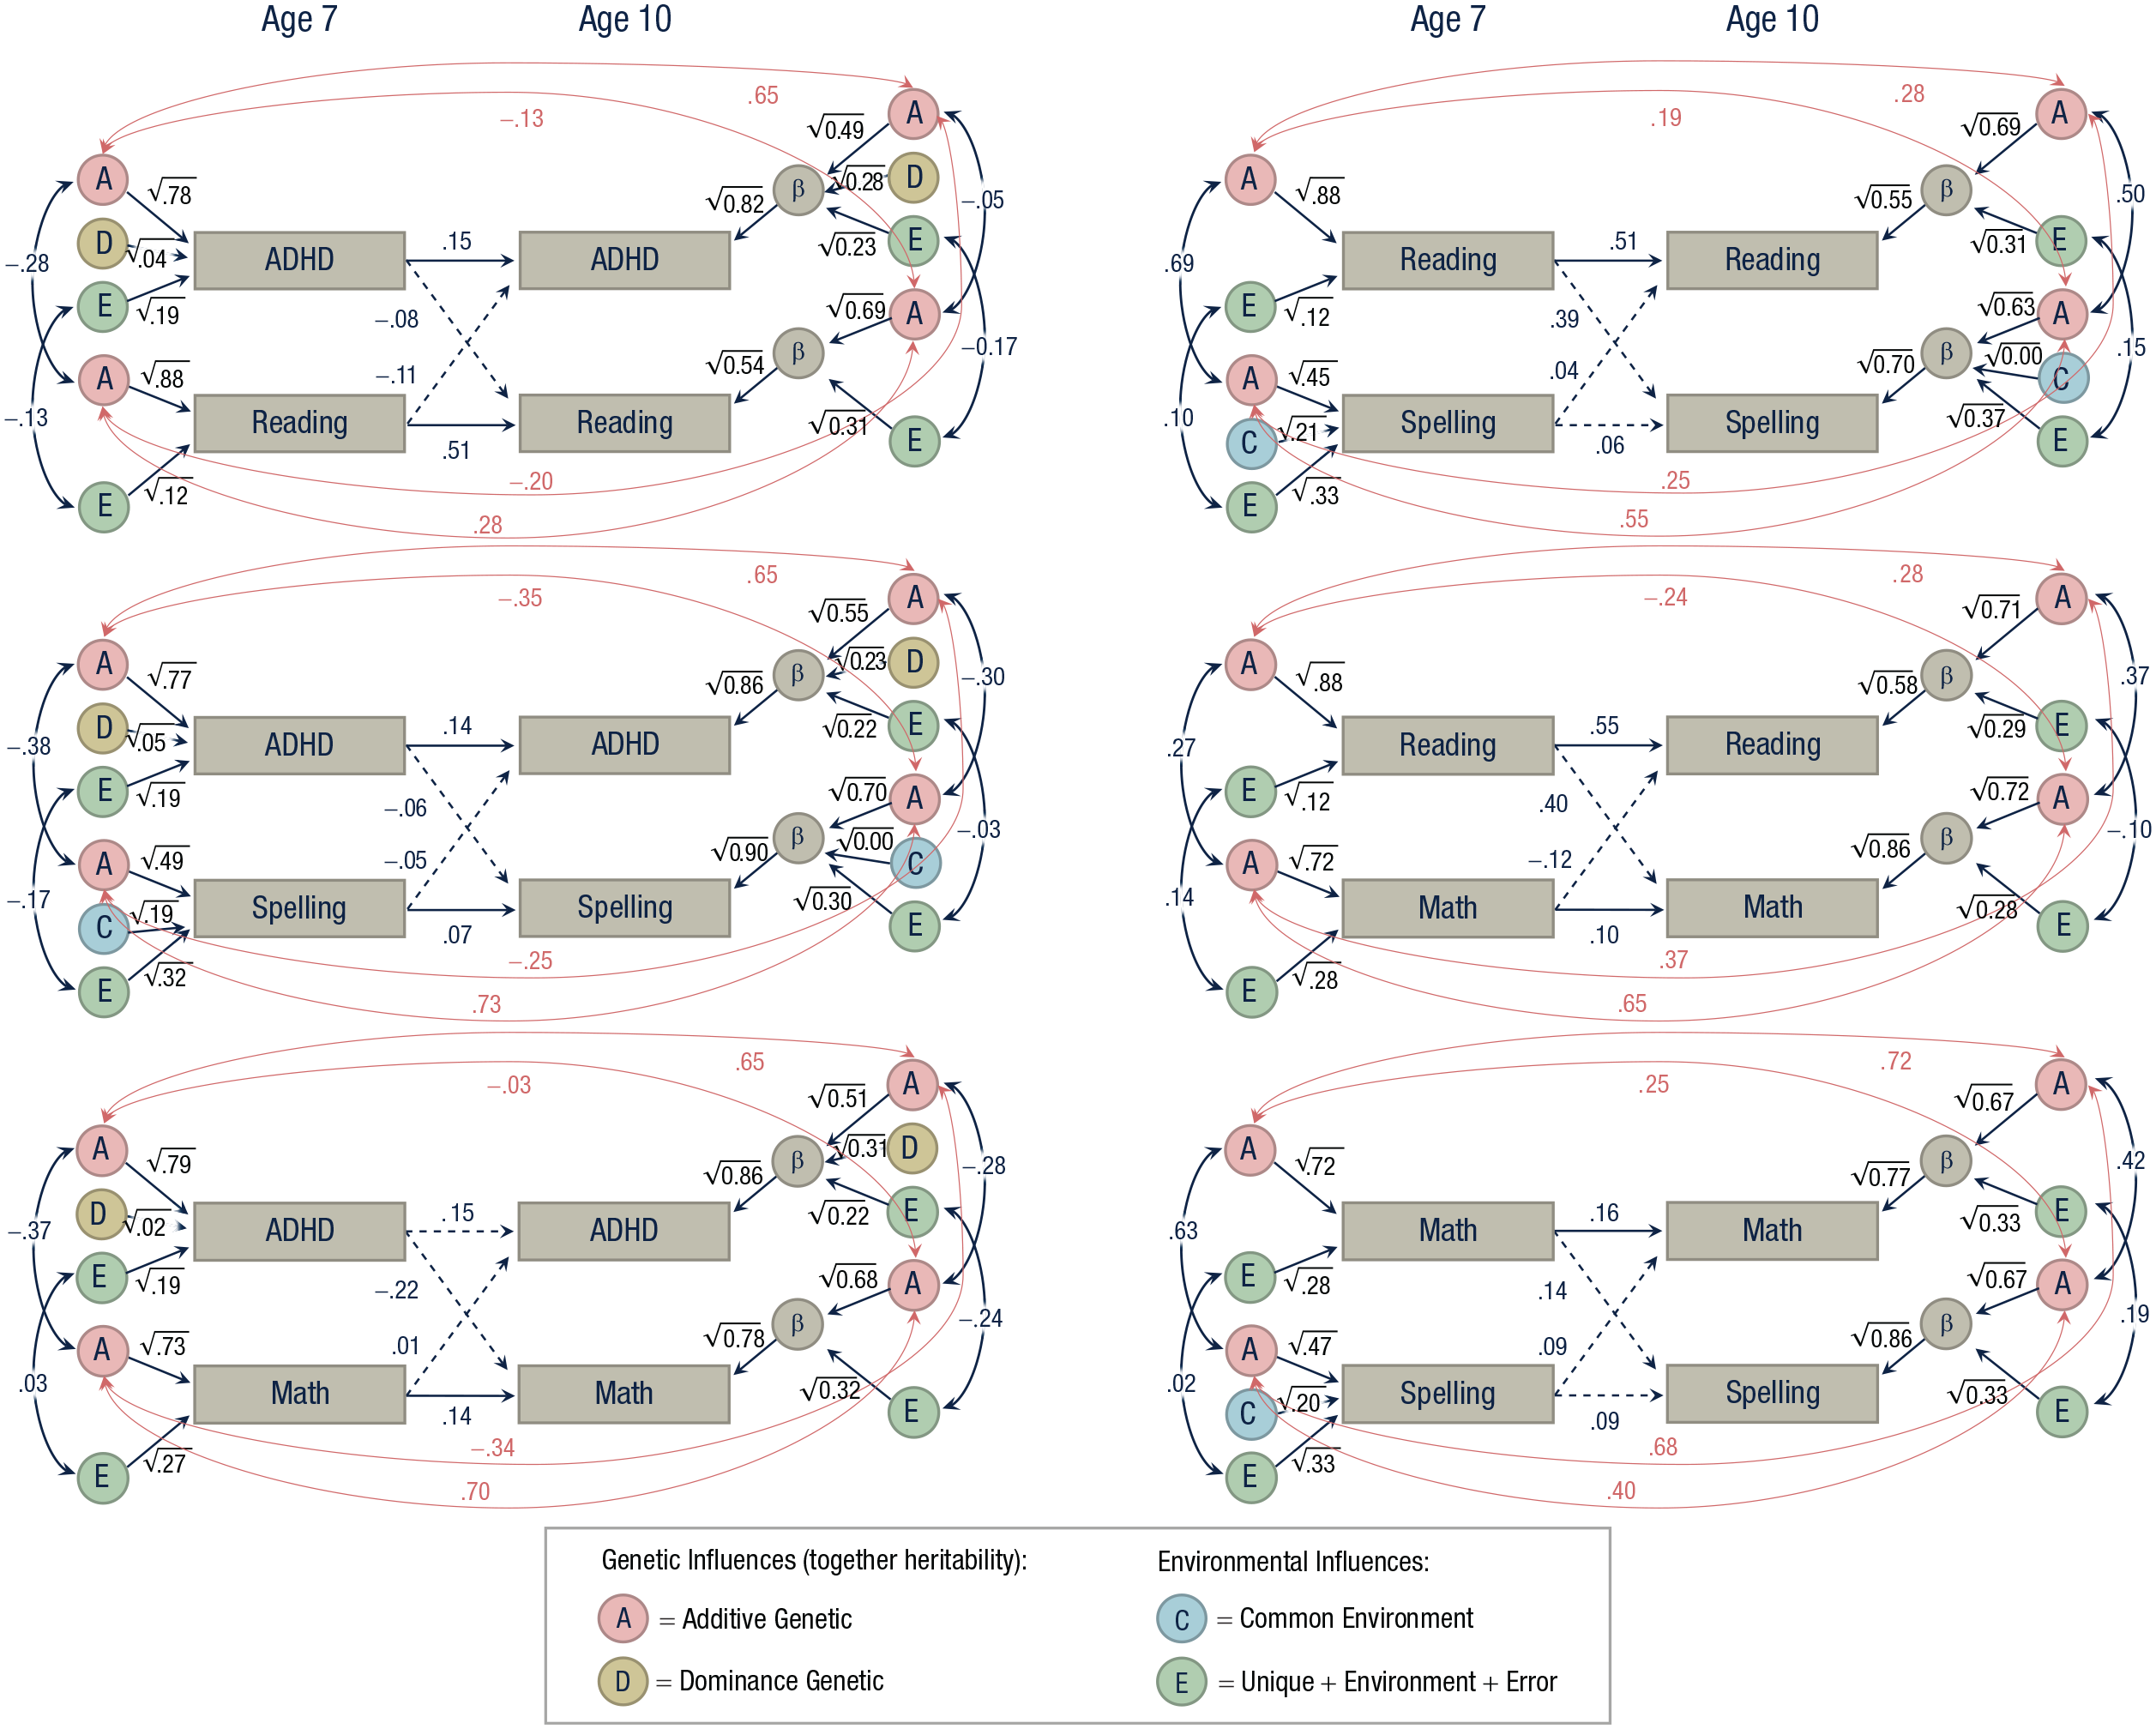
The behavioral-genetic cross-lagged models for ages 7 and 10, with genetic pleiotropy. Allowing for genetic pleiotropy is akin to regressing out shared genetic bases. Here we ask whether, after controlling for shared genetic effects, the age-7 traits still influence the age-10 traits. These models are saturated compared to the baseline models. Significant βs (autoregressors and cross-lags) are shown as solid arrows and insignificant ones as dashed arrows. The βs are estimated on the full sample of twins, but the ACDE estimates are shown here for the twin pairs who are in the same class. ADHD = attention-deficit/hyperactivity disorder (“ADHD” refers to ADHD symptoms; “reading” refers to word-reading fluency).
We fitted all cross-lagged models as four-group models, for the same-teacher and different-teacher and MZ and DZ groups. The means, variances, and causal pathways (autoregressions and cross-lags; βs) were set to be equal across all four groups, while the behavioral genetic part (ACDE) was freely estimated in the same- and different-teacher groups. We show here the results for the same-teacher group (see the Supplemental Material for results for the different-teacher group).
Results
Descriptive statistics
The group of twins and the group of nontwin siblings hardly differed in ADHD symptoms and achievement (average Cohen’s d = 0.06 and −0.08, respectively; see Supplemental Table S2). This supports the idea that findings in twins can be generalized to nontwins. The phenotypic correlations are given in Table 1 and Supplemental Table S3.
Phenotypic Correlation Matrix

Note: The correlations are based on twin data only. The ADHD symptom scores have been square-root transformed. All ps < .001. For Ns, see Supplemental Table S3. ADHD = attention-deficit/hyperactivity disorder.
Co-occurrence
In the subsample (n = 3,554; see the Method section), prevalence rates were 9.2% for ADHD, 9.8% for dyslexia, and 10.2% for dyscalculia; 76.8% were unaffected. Co-occurrence rates are visualized in Fig. 1 and detailed in Table 2. Compared to children without ADHD, those with ADHD were 2.7 times as likely to have dyslexia and 2.1 times as likely to have dyscalculia. Likewise, compared to children without dyslexia (dyscalculia), children with dyslexia (dyscalculia) were 2.7 (2.1) times as likely to have ADHD. Compared to children without dyslexia, children with dyslexia were 3.1 times as likely to have dyscalculia. Likewise, compared to children without dyscalculia, children with dyscalculia were 3.1 times as likely to have dyslexia.
Co-occurrence: Prevalence Rates Overall and Within Three Developmental Condition Groups

Note: Within the group of children with attention-deficit/hyperactivity disorder (ADHD), 22.6% also had dyslexia. Subsample sizes were as follows: subsample with data on all three conditions, n = 3,554; subsample with data on ADHD-dyslexia, n = 5,646; subsample with data on ADHD-dyscalculia, n = 3,651; subsample with data on dyslexia-dyscalculia, n = 4,227. PR = prevalence ratio (i.e., compared with children without ADHD, children with ADHD were 2.7 times as likely to have dyslexia).
Within-subject change models
The within-subject change correlations are given in Table 3. The only correlation that was significant in both twins was spelling–math (r = ~.15; and in Supplemental Table S5, inattention–hyperactivity). That is, children who, relative to peers, became poorer at spelling over time also became poorer at math.
Within-Subject Change Models in Twin 1s (Upper Triangle) and Twin 2s (Lower Triangle)

Note: The sample size varies over cells from 146 to 882 children (see Supplemental Table S5). ADHD = attention-deficit/hyperactivity disorder. *p < .05. **p < .01. ***p < .001.
MZ within-pair difference models
Table 4 shows some significant MZ within-pair difference correlations in the expected direction, but none were significant in both waves. Supplemental Table S6 shows one that was significant at both waves: reading–inattention (r = ~−.17). This indicates that at both age 7 and age 10, the MZ twin with poorer reading had more inattention problems. Note that for the MZ within-pair difference models we analyzed complete MZ pairs with complete data, leaving ~300 pairs per correlation. With an α of .05, two-tailed, this gives 80% power to detect a correlation of ≥ .16. (For reading with spelling and math there were only ~100 pairs, which is too small a sample to reliably detect a correlation ≤ .27.)
Monozygotic Difference Models at Age 7 (Upper Triangle) and Age 10 (Lower Triangle)

The sample size varies over cells from 99 to 423 twin pairs (see Supplemental Table S6). *p < .05. **p < .01. ***p < .001.
Genetic models
Twin correlations are provided in Supplemental Table S7. Univariate genetic modeling results reported here are for those pairs who attended the same class at both waves. Descriptive statistics and univariate genetic results for those attending different classes at both waves are reported in the Supplemental Material. Univariate genetic modeling confirmed that all traits were heritable (see the results in Supplemental Table S8). At age 10, but not at age 7, ADHD symptoms appeared to be affected by nonadditive genetic influences on top of additive genetic effects. Except for spelling at age 7, shared environmental effects were absent. In the different-teacher group, the A components were smaller and the E components larger than in the same-teacher group, especially for ADHD. Regarding multivariate genetic modeling, first, the bivariate baseline models (not shown) confirmed that ADHD symptoms and academic skills are correlated both genetically and environmentally, demonstrating that the phenotypic correlations are attributable to both shared genetic and environmental effects (rA and rE).
Second, the question of whether this was solely attributable to (possibly reciprocal) causal transmission was tested by comparing the fits of the bivariate baseline model against the bivariate cross-lagged model. These fit indices are provided in Supplemental Table S9. The cross-lagged model (Fig. 3) was always rejected in favor of the baseline model (Fig. 2). This implies that even if causal phenotype-to-phenotype transmission is present, it cannot be the sole explanation of the statistical relationships over time; genetic or shared environmental influences must be present too, or possibly both.
Third, we controlled for genetic confounding (i.e., we modeled common genetic effects) by adding cross-loadings between the A components at ages 7 and 10. The autoregressions and cross-lags now reflect causal effects (at the behavioral level) above and beyond shared genetic effects. The autoregressors and cross-lagged causal pathways (βs) attenuated (Fig. 4); none of the cross-lagged paths remained significant. The only exception was the reading–spelling model, for which the statistics seemed to favor the more parsimonious model in Fig. 3.
To summarize the above, we fitted a series of behavioral-genetic models, each including indicators of the traits at two measurement occasions. Step 1 consisted of baseline models in which co-occurrence and co-development were purely modeled as shared risk factors, without assuming any causal mechanism (Fig. 2). It described shared genetic influences (rAs were substantial) and shared environmental effects (rEs were low; rCs were absent) and provided a reference for the fit of subsequent models. Step 2 consisted of cross-lagged models, in which the associations across time were fully modeled as the result of causal phenotype-to-phenotype transmission (βs). These models were nested in and more parsimonious than the matching baseline models. The cross-lagged models fitted significantly worse (except for reading–spelling). Thus, the assumption is too strong that the genetic and environmental influences on the age-7 traits affected the age-10 traits solely through phenotypic transmission. In Step 3 we alleviated this assumption by allowing longitudinal genetic pleiotropy. These cross-lagged models with genetic pleiotropy were saturated, so model fit could not be evaluated. This three-step analysis showed that the cross-lagged path parameters in standard phenotypic models should be interpreted with caution; they represent predictive value rather than causal phenotype-to-phenotype effects because they can also include the effects of, for instance, shared genetic factors that have pathways independent of this transmission.
Discussion
We found substantial co-occurrence rates of ADHD, dyslexia, and dyscalculia, though 77.3% of affected children had just one condition. All associated traits showed high heritability (.72–.82), except for age-7 spelling. We found substantial genetic overlap (|.34| < rA < |.74|), especially among academic skills, but little environmental overlap (rE < |.12| and no rC; see Fig. 3; age 7). The shared genetic effects appeared to be the primary cause of co-occurrence.
Our study has some limitations and strengths to consider. A limitation was the 2.5-year time gap, which may be too long to detect causality. We did not separate within- and between-person relationships (Rohrer & Murayama, 2021). The two sources of co-occurrence that we investigated are not the only possibilities (Bishop, 2010a; Neale & Kendler, 1995). Moreover, our twin analyses come with assumptions and limitations (Willoughby et al., 2023). Our large sample (2,150 siblings and 19,125 twins) is a strength. Other strengths of our study include twin data and nationally standardized academic tests (rather than survey-based data). We excluded ADHD items related to learning problems and did not have developmental conditions rated by the same rater, indicating that our co-occurrence rates were not inflated by artifacts. Regarding sample representativeness, we have data on the word-reading fluency test. The Netherlands Twin Register sample scores 0.18 SD higher than the national average, but within Netherlands Twin Register families, the twins score similarly to their nontwin siblings, indicating that twins are representative of singletons (van Bergen et al., 2018).
Co-occurrence rates
We found high co-occurrence rates of ADHD, dyslexia, and dyscalculia in a large community-based sample (Table 2). For instance, children with ADHD (compared to those without) were twice as likely to have dyscalculia. The co-occurrence between the two learning conditions was higher: Children with dyslexia (compared to those without) were three times as likely to have dyscalculia. For comparison, the co-occurrence between reading fluency and spelling difficulties was even higher: children with reading-fluency difficulties (compared to those without) were 6.4 times as likely to have spelling difficulties (see the Supplemental Material). Co-occurrence percentages were strongly affected by the study’s cutoff criteria, but within the groups with one of three conditions, 17.7% to 26.2% (median: 22%) met the criteria for a second condition. This aligns with other community studies but is lower than clinical samples where rates as high as 50% are reported, likely because of Berkson’s bias. The notion that co-occurrence is the rule rather than the exception is called the “clinician’s illusion” (Neale & Kendler, 1995).
The ACDEs of educationally relevant traits
Our results supported for most traits a parsimonious AE model (Table S8), consistent with prior twin research indicating minimal shared-environmental influences on educationally relevant traits in countries with standardized educational systems, like that of the Netherlands (Kevenaar et al., 2023). For ADHD symptoms we found some nonadditive genetic effects, potentially attributable to true dominance effects or contrast effects (raters overestimated the difference between dizygotic co-twins, hence underestimating rDZ; Polderman et al., 2007; Kan et al., 2014).
Heritability is a population-level variance estimate (van Dijk et al., 2021). High heritability is linked to low shared-environmental variance (due to, e.g., standardized curricula), but this does not mean the shared environment is unimportant. Although it impacts mean levels, it has less impact on individual differences. High heritability does not suggest that interventions will not work (Zijlstra et al., 2021).
Causality
The intergenerational multiple deficit model suggests that symptoms of ADHD, dyslexia, and dyscalculia have common underlying genetic and environmental factors (van Bergen et al., 2014). However, there may be causal effects of ADHD symptoms on reading and math performance, or vice versa. To investigate causality, we formulated several models that can disprove or support (but cannot prove) causality. A first prerequisite is that the conditions co-occur and the traits correlate. In the absence of co-occurrence, the prevalence ratios would be ~1 and correlations ~0, but they are all higher. Second, regarding the within-subject change models, the only correlation that was significant in both groups (i.e., twin 1s and twin 2s) was spelling–math (r = ~.15). So children who, relative to peers, over time became poorer at spelling also became somewhat poorer at math. Regarding the MZ within-pair difference models, none of the main correlations were significant across both waves. Only reading–inattention (r = ~−.17) was significant across waves. This indicates that at both age 7 and age 10, the MZ twin with poorer reading had somewhat more inattention problems. Third, the series of behavioral-genetic models showed that the standard cross-lagged path parameters (Fig. 3) may be overestimated because they are confounded by shared genetic effects. Beyond shared genetic effects, none of the cross-lagged paths remained significant, suggesting that there were no causal effects at the behavioral level (Fig. 4). The exception was reading–spelling, for which the statistics (Supplemental Table S9) seem to favor the parsimonious model (Fig. 3), with a causal effect of reading on spelling (β = 0.44).
Our cross-lagged findings (before regressing out shared genetic effects; Fig. 3) aligned with previous literature. We showed small but significant bidirectional predictive effects between ADHD symptoms and learning outcomes, with no consistent directionality dominance. This is consistent with previous bidirectional causal findings between diagnosed ADHD and educational attainment using Mendelian randomization and within-sibling analyses (Demange et al., 2024). Among our learning skills, reading is not predicted by spelling and math, but reading predicts spelling strongly (β = 0.44). Our unidirectional effect of early reading predicting later spelling has previously been found across multiple languages (Georgiou et al., 2020). Our finding of early word-level reading skills (alongside early math skills) predicting later math skills fits with a recent meta-analysis (Lin & Powell, 2022). Our genetically informative sample allowed us to assess (mis)fit in ways not possible in previous research.
Adjusting for genetic pleiotropy weakened cross-lagged paths until they were nonsignificant, suggesting no causality beyond shared genetic effects in this 2.5-year time window. Note that shorter developmental spans could still reveal causal processes. Additionally, seeing the test of significant effects after removing shared genetic effects as the test of causality might be too conservative. If X causes Y, and X and Y are partly heritable, then the causal path induces a genetic correlation.
Implications and conclusions
Our cross-lagged models indicated that ADHD symptoms and reading, spelling, and math skills all somewhat predicted each other over time. However, these predictions were likely attributable to shared genetic risk factors rather than causality. This suggests that clinical and school interventions should target each condition separately, while still seeing the child holistically, and avoid assuming that treating one condition will improve symptoms of the other condition. Furthermore, our findings highlight the substantial genetic predispositions associated with these conditions and the need to avoiding parent blaming.
Supplemental Material
sj-pdf-1-pss-10.1177_09567976241293999 – Supplemental material for Co-Occurrence and Causality Among ADHD, Dyslexia, and Dyscalculia
Supplemental material, sj-pdf-1-pss-10.1177_09567976241293999 for Co-Occurrence and Causality Among ADHD, Dyslexia, and Dyscalculia by Elsje van Bergen, Eveline L. de Zeeuw, Sara A. Hart, Dorret I. Boomsma, Eco J. C. de Geus and Kees-Jan Kan in Psychological Science
Footnotes
Acknowledgements
The authors wish to acknowledge Conor V. Dolan for his invaluable methodological expertise, as well as his meticulous reviewing and editing of the manuscript. Grammarly and ChatGPT were used to help proofread parts of the manuscript. We warmly thank all participating families and teachers in the Netherlands Twin Register. The Netherlands Twin Register gratefully acknowledges funding from the Dutch Research Council (NWO), Projects 024-001-003, 451-15-017, 480-15-001/674, 056-32-010, and 481-08-011. S. A. Hart is a Canadian Excellence Research Chair in Developmental Science, and her part of the research was undertaken, in part, thanks to funding from the Canada Research Chairs Program. E. van Bergen is a Jacobs Foundation Research Fellow and is also funded by the Research Council of Norway (GenEd Grant No. 335634), the Dutch Research Council (VIDI Talent Grant No. VI.Vidi.221G.007), and the European Union (European Research Council Project InterGen No. 101076726).
Transparency
Action Editor: Daniela Schiller
Editor: Patricia J. Bauer
Author Contributions
Notes
References
Supplementary Material
Please find the following supplemental material available below.
For Open Access articles published under a Creative Commons License, all supplemental material carries the same license as the article it is associated with.
For non-Open Access articles published, all supplemental material carries a non-exclusive license, and permission requests for re-use of supplemental material or any part of supplemental material shall be sent directly to the copyright owner as specified in the copyright notice associated with the article.