
Abstract
Recent studies demonstrate that Republicans live longer than Democrats. We examined whether these longevity benefits are universal or culturally varying. Following a person–culture match perspective, we hypothesized that Republicans’ longevity benefits occur in Republican, but not in Democratic, states. To test this argument, we conducted two studies among U.S. adults. In preregistered Study 1, we used large survey data (extended U.S. General Social Survey; N = 42,855). In confirmatory Study 2, we analyzed obituaries/biographies of deceased U.S. political partisans (novel data web-scraped from an online cemetery; N = 9,177). Both studies supported the person–culture match perspective with substantial effect sizes. In Republican contexts, up to 50.1% of all Republicans but only 36.3% of all Democrats reached an age of 80 years. In Democratic contexts, there was no such longevity gap. Robustness tests showed that this effect generalizes to political ideology and holds across spatial levels but is limited to persons with strong political convictions.
Keywords
Political partisanship is a crucial part of human identity that unfolds far-reaching consequences on the individual (Van Bavel & Pereira, 2018). Importantly, political partisanship predicts not only voting-related outcomes (Bartels, 2000) but also important nonvoting outcomes such as economic behavior (Gerber & Huber, 2009), religious beliefs (Margolis, 2018), or media use (Iyengar & Hahn, 2009). Of all potential outcomes, whether political partisanship is associated with a longer life is arguably the most consequential one.
Evidence from the United States suggests that political partisanship is linked to mortality. Specifically, studies found that Republicans are healthier (Subramanian & Perkins, 2010) and live longer (Kannan et al., 2019; Pabayo et al., 2015) than Democrats. Recent estimates indicate that Republicans (at any given point in their lives) have a 21% lower mortality risk than Democrats (Kannan et al., 2019). Different explanations have been discussed to understand why Republicans are healthier and live longer. For example, some researchers have suggested that Republicans are of higher socioeconomic status and engage more in health-promoting behaviors (such as religious activities and civic participation; Subramanian et al., 2009), better cope with injustices (Pabayo et al., 2015), or feel more personally responsible for their health (Chan, 2019; Kannan et al., 2019). Importantly, all of these explanations share the assumption of a universal link between partisanship and longevity (i.e., that all Republicans enjoy longevity benefits to a similar degree). We here provide an alternative perspective on the partisanship–longevity link—namely, that Republicans’ longevity benefits are not universal but vary across cultural contexts.
But why should the partisanship–longevity link vary culturally? Ample psychological research demonstrates that people derive benefits if they live in places where their personal characteristics match the characteristics of their ambient cultural context. For example, people living among others with similar personality traits report higher self-esteem and life satisfaction (Bleidorn et al., 2016; Jokela et al., 2015). Likewise, religious people enjoy higher self-esteem if they live in religious cultural contexts (Gebauer et al., 2012, 2017). Importantly, these benefits of person–culture match also generalize to political characteristics. Specifically, previous research shows that living among other politically similar individuals boosts feelings of belonging (Motyl et al., 2014) and happiness (Stavrova & Luhmann, 2016).
Whereas most research on person–culture match examined effects on psychological adjustment, recent evidence suggests that person–culture match may also affect longevity. Specifically, Ebert et al. (2020) and Stavrova (2015) found that religious people live longer than nonreligious people in religious, but not in nonreligious, cultural contexts. This effect of person–culture match on longevity is not surprising considering the assumed underlying processes of person–culture match. The two most prominent explanations that person–culture match is beneficial are (a) a reduction of stress through opportunities for self-validation (Fulmer et al., 2010) and (b) an easier formation of supportive social bonds (Stavrova et al., 2013). In fact, reduced stress and supportive social bonds are well-known predictors of longevity (Schutte & Malouff, 2016; Shor et al., 2013).
Taken together, previous research suggests that (a) living among other politically similar individuals is beneficial and that (b) these benefits may also extend to longevity. Accordingly, following a person–culture match perspective, we posit that not all Republicans may live longer. Rather, the partisanship–longevity link may be culturally specific. That is, longevity benefits for Republicans should be strong in Republican cultural contexts but absent (or reversed) in Democratic cultural contexts. Evidence for such cultural variation in the partisanship–longevity link would have far-reaching implications. Among other effects, this would (a) challenge the role of Republican partisanship as a universal provider of longevity benefits, (b) mean that previous research has underestimated partisanship’s relevance for longevity in some places (because strong and weak effects from different cultural contexts were lumped together), and (c) suggest that current political landscapes may shape future political landscapes by selectively keeping matching voters alive.
In sharp contrast to these far-reaching implications, no study has examined the effects of political person–culture match on longevity. The present research addresses this gap by examining cultural variation in the partisanship–longevity link in two studies with complementary strengths and weaknesses: Study 1 used large survey data, whereas Study 2 used a novel database consisting of web-scraped online obituaries/biographies. As we sought to qualify previous work, both studies examined political partisanship and longevity in the United States (i.e., the country that previous research focused on).
Statement of Relevance
Republicans tend to outlive Democrats, according to recent studies. This raises questions about the universality of Republicans’ longevity benefits. Building on a person–culture match perspective, we asked whether Republicans live longer everywhere or only when they match with a state’s political culture. To address this research question, we conducted two studies analyzing the relationship between political partisanship and longevity among more than 50,000 adults from all over the United States. Supporting the person–culture match perspective, we found that Republicans live longer in Republican, but not in Democratic, states. This finding challenges the role of Republican partisanship as a universal provider of health benefits and provides a novel alternative explanation for Republicans’ previously observed longevity benefits. From a societal perspective, political partisans who live longer can cast their vote in more elections. The resulting voting advantage due to person–culture match may in special cases be greater than electoral margins currently observed in some states.
Study 1: Partisanship and Longevity in Survey Data
Previous research on the partisanship–longevity link was exclusively based on survey data. Study 1 provides a qualification of this existing body of research by testing the person–culture-match perspective in U.S. survey data.
Method
The hypothesis and analytical approach for this study were preregistered before access to the sensitive survey data was granted. The preregistration and analytical script can be found at https://osf.io/kj4tr/. Deviations from the preregistered analytical approach are noted in Supplement S.1 in the Supplemental Material available online. Please note that Study 1’s underlying database is proprietary and may not be shared. Ethical approval for this study was granted through the Ethics Review Board of the University of Mannheim (EK Mannheim 34/2020).
Partisanship and mortality
Study 1 used data from the General Social Survey (GSS; Smith et al., 2019). The GSS is a cross-sectional survey that has drawn a probabilistic sample of U.S. residents older than 18 years in 32 waves between 1972 and 2018 (N = 64,814). In particular, the study rests on a restricted-use version of the GSS that is available on special request and under data protection measures (National Opinion Research Center, 2020). This extended version contains two additional sensitive features. First, it provides geographic information on a person’s place of residence at the time the interview was conducted. Second, for the survey years 1978 to 2010, the data are linked to mortality information from the National Death Index and provide information on whether a person was still alive in 2014 and, if not, in what year between 1979 and 2014 the person died (Muennig et al., 2011).
Political partisanship was identified via the item “Generally speaking, do you usually think of yourself as a Republican, Democrat, Independent, or what?” which was included in each wave of the GSS (response options: Strong Democrat, Not-strong Democrat, Independent near Democrat, Independent, Independent Near Republican, Not-strong Republican, Strong Republican 1 ). To identify persons who were clearly affiliated with a party, we coded persons reporting to be a “Strong Republican” as partisans of the Republican party, persons reporting to be a “Strong Democrat” as partisans of the Democratic party, and all persons who were not strongly identified with a party as nonpartisans (but also examined looser definitions of partisanship and measures of political ideology; see the Partisanship Strength and Ideology Explorations section). We accounted for participants’ gender, birth year, race, relationship status, social status, and religiosity (see the Main Results and Robustness Tests sections). After we applied listwise exclusion (i.e., keeping those participants for which geographic, mortality, and control variables were available), the final data for the main analysis comprised 42,855 participants (56.32% female), with 673,598 observed person-years and 12,299 recorded death cases.
Republican versus Democratic states
Participants were matched to the U.S. state in which they lived when taking part in the survey. The person–culture match perspective suggests that Republicans live longer if they are surrounded by many other Republicans. Therefore, we sought to distinguish states according to the degree to which they were home to Republicans. Given that partisanship expresses itself in votes for the referring party (Bartels, 2000), we measured state-level political culture based on federal election outcomes. 2 To balance out peculiarities of specific elections, we combined the outcomes of two types of federal elections: U.S. presidential elections and U.S. Congressional elections. Namely, we used (a) disproportionately high or low votes for Republican candidates in presidential elections (Wasserman & Flinn, 2021), (b) the proportion of Republicans among a state’s U.S. Senate members, and (c) the proportion of Republicans among a state’s U.S. House of Representatives members. To derive a Republican Culture Index for each state, we calculated an average of these three indicators after z-standardizing them (but also used these indicators separately and tested further alternative indicators; see the Robustness Tests section). According to our operationalization, Wyoming was the most Republican state, whereas Massachusetts was the most Democratic state. 3 To ease interpretation, we z-standardized this Republican Culture Index before entering it into the analysis.
Analytic approach
To analyze the link between political partisanship and longevity, we used a survival analytical approach (also called time-to-event analysis; Cleves et al., 2008). The basic premise of survival analysis is to estimate the likelihood that an individual experiences an event (i.e., death in our case) at a given time conditional on having survived to that time. Among survival analytical models, the Cox proportional-hazards model (Cox, 1972) is the most widely used approach and was also applied here. Cox regression is a semiparametric survival analytical technique that allows the hazard function to flexibly emerge from the data. As such, Cox regression is different from so-called parametric survival models that require a priori specifying a distribution, hence constraining the model’s hazard function to certain shapes. To achieve this flexibility, Cox regression rests on the assumption that the ratio of the hazards for any two individuals is constant over time (proportional hazards assumption). We graphically tested the proportional hazards assumption for the main variables in both studies and found no violations (see Supplements S.2 and S.20 in the Supplemental Material). We specified our models on the basis of an age timescale with left truncation at interview age (because a person cannot die prior to the interview). To account for the nested structure of the data (i.e., participants nested in states), we specified a Cox model with shared frailty at the state level. 4 This shared-frailty model accounts for unobserved heterogeneity at the state level (akin to a mixed model with random intercepts). The sample size exceeded established minimum thresholds for Cox regression models (Ogundimu et al., 2016).
Results
Main results
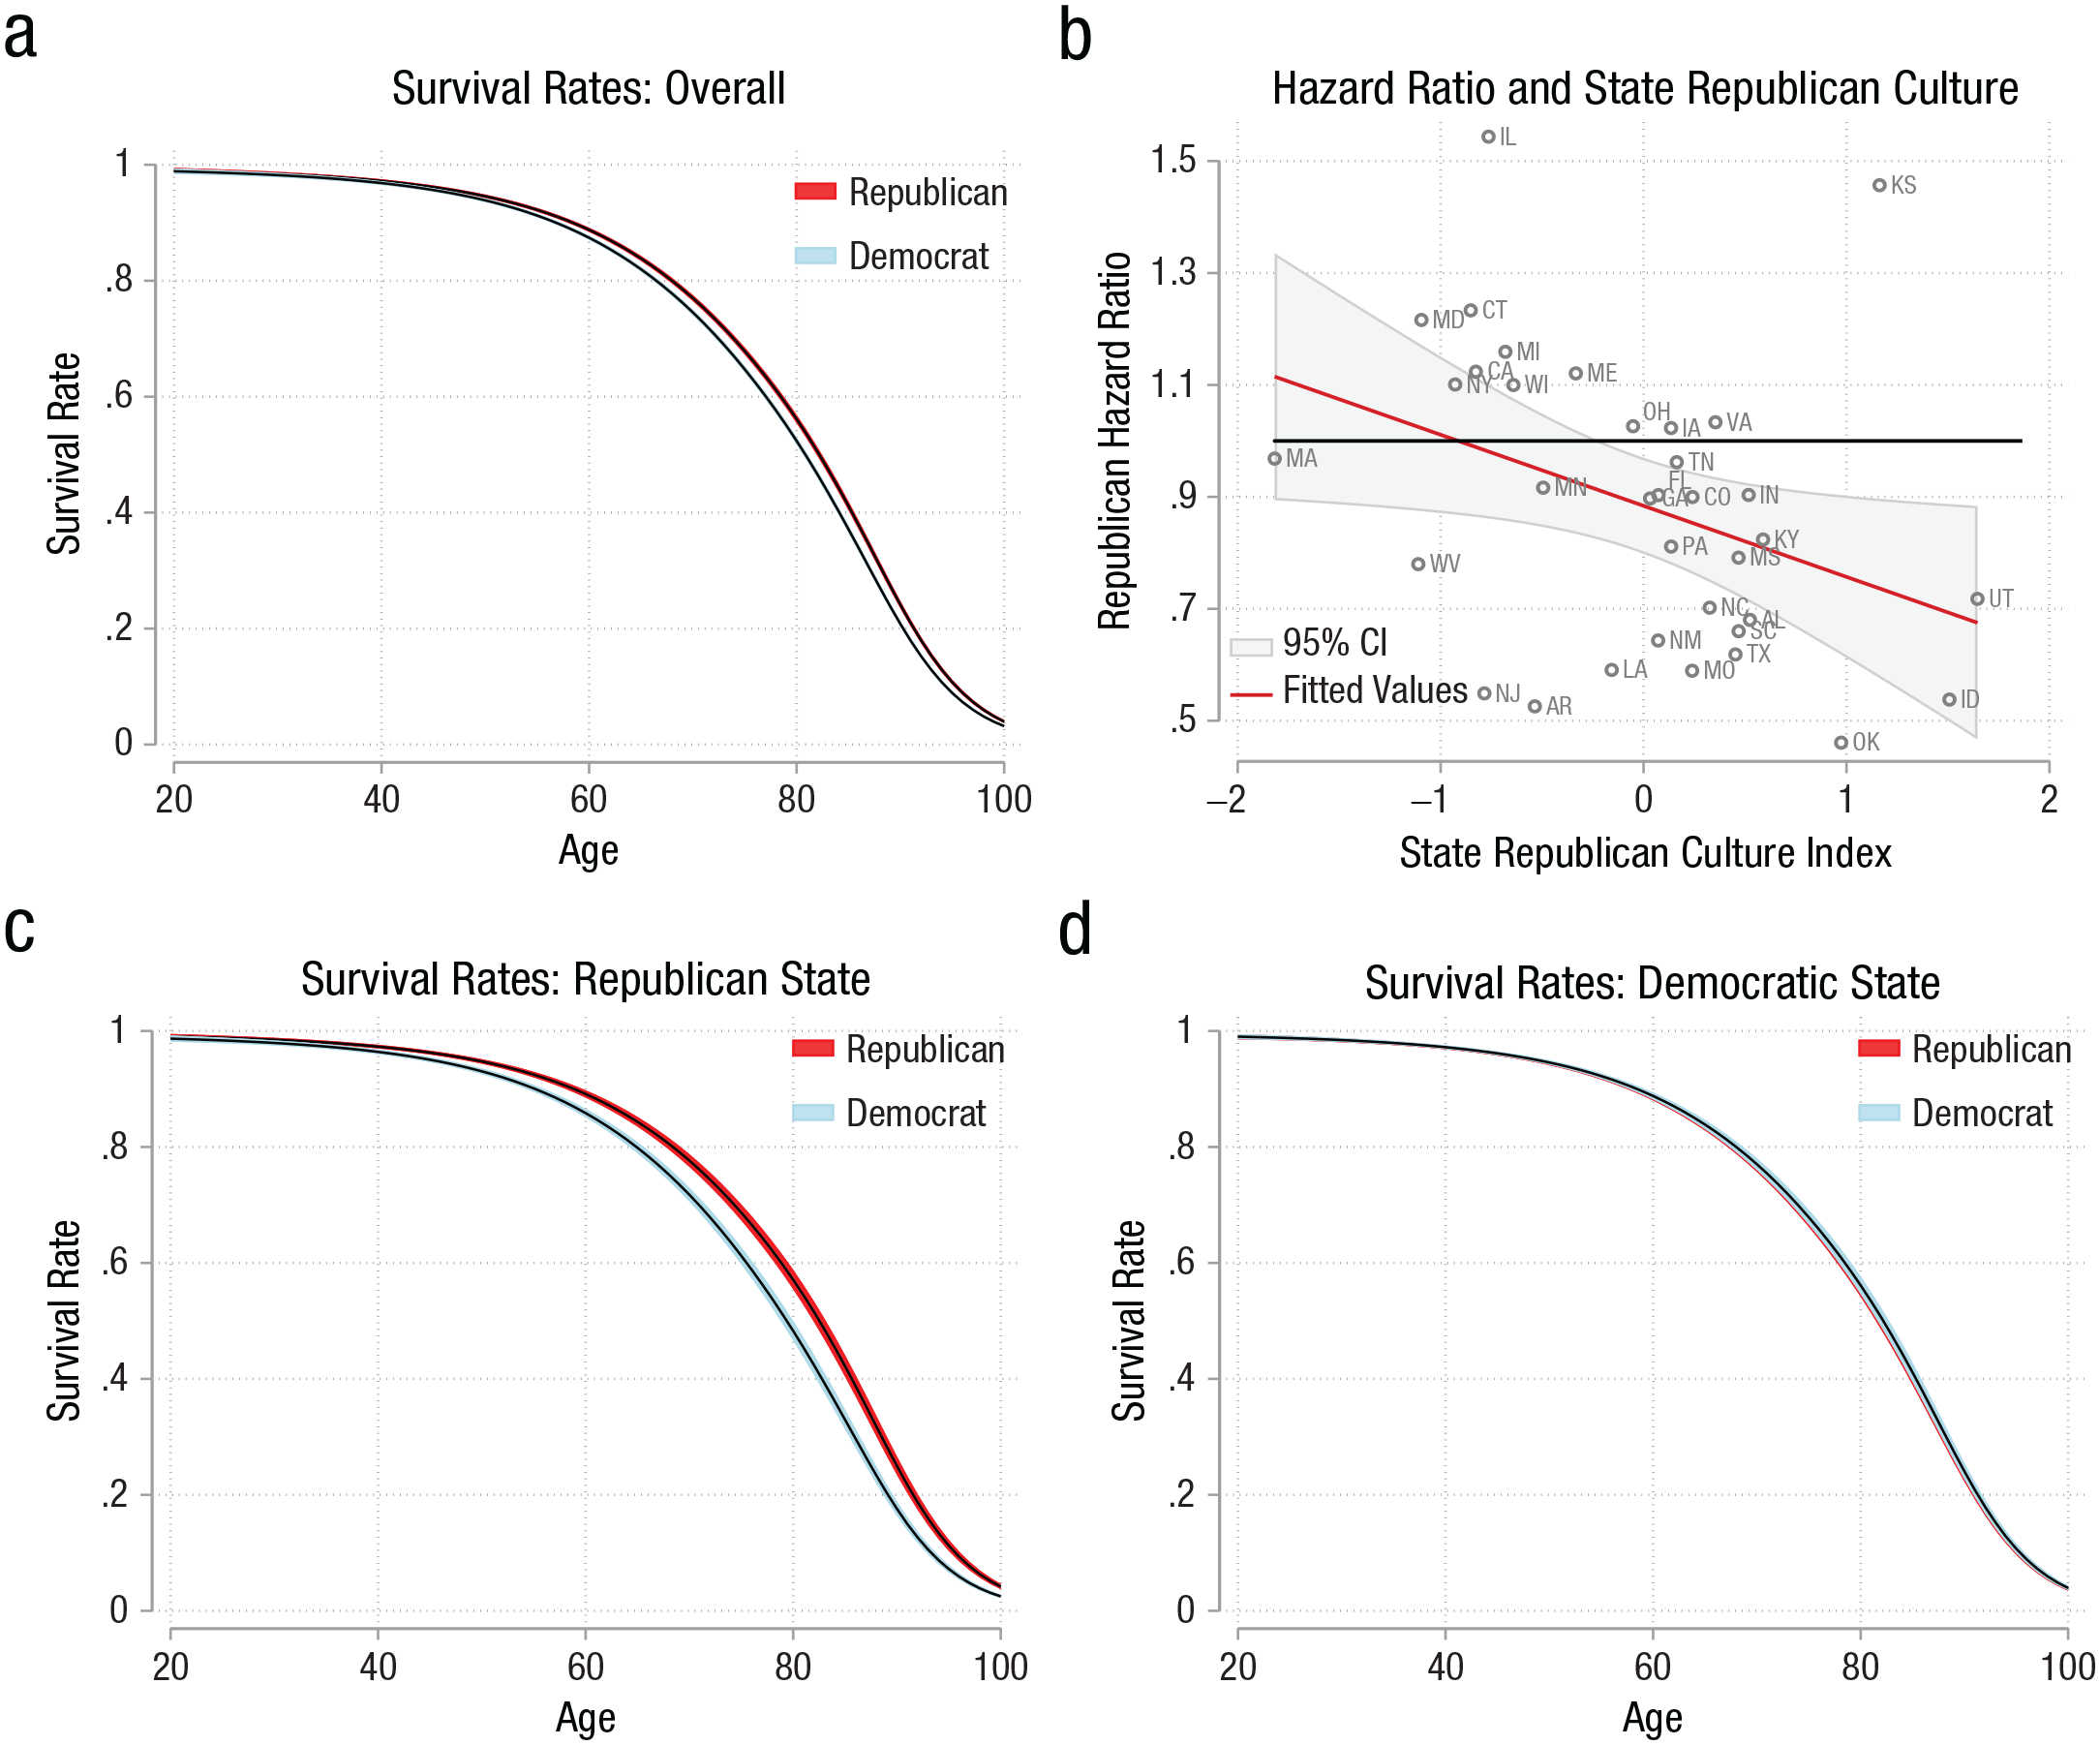
The analysis followed a two-step approach. First, we aimed to establish the validity of the data and analytical approach by replicating the established finding in the literature. To do so, we examined the partisanship–longevity link without accounting for cross-cultural variation (Table 1, Models 1 and 2). The results of this regression model are to be interpreted as follows: A hazard ratio smaller than 1 indicates that a characteristic is associated with a lower risk of mortality (i.e., a longer life), whereas a hazard ratio greater than 1 indicates a higher mortality (i.e., a shorter life). Model 2 reveals that after we accounted for gender and birth year (i.e., capturing the historical period in which a person has lived), Republicans featured a lower hazard ratio (hazard ratio = 0.85, 95% confidence interval, or CI = [0.80, 0.91], p < .001). This indicates that Republicans—at each point in their lives—had a 15% lower chance of dying than Democrats. Figure 1a indicates the real-world meaning of these estimates by comparing the population-averaged survival curves for Republicans versus Democrats. Among the GSS data, 45.8% of all Republicans and only 40.0% of all Democrats reached an age of 80 years. Thus, the findings from Models 1 and 2 replicated previous research indicating that in the United States, Republicans live longer than Democrats, on average.
Survival Model Estimates Indicating the Association Between Political Partisanship and Longevity in the United States Based on GSS Data
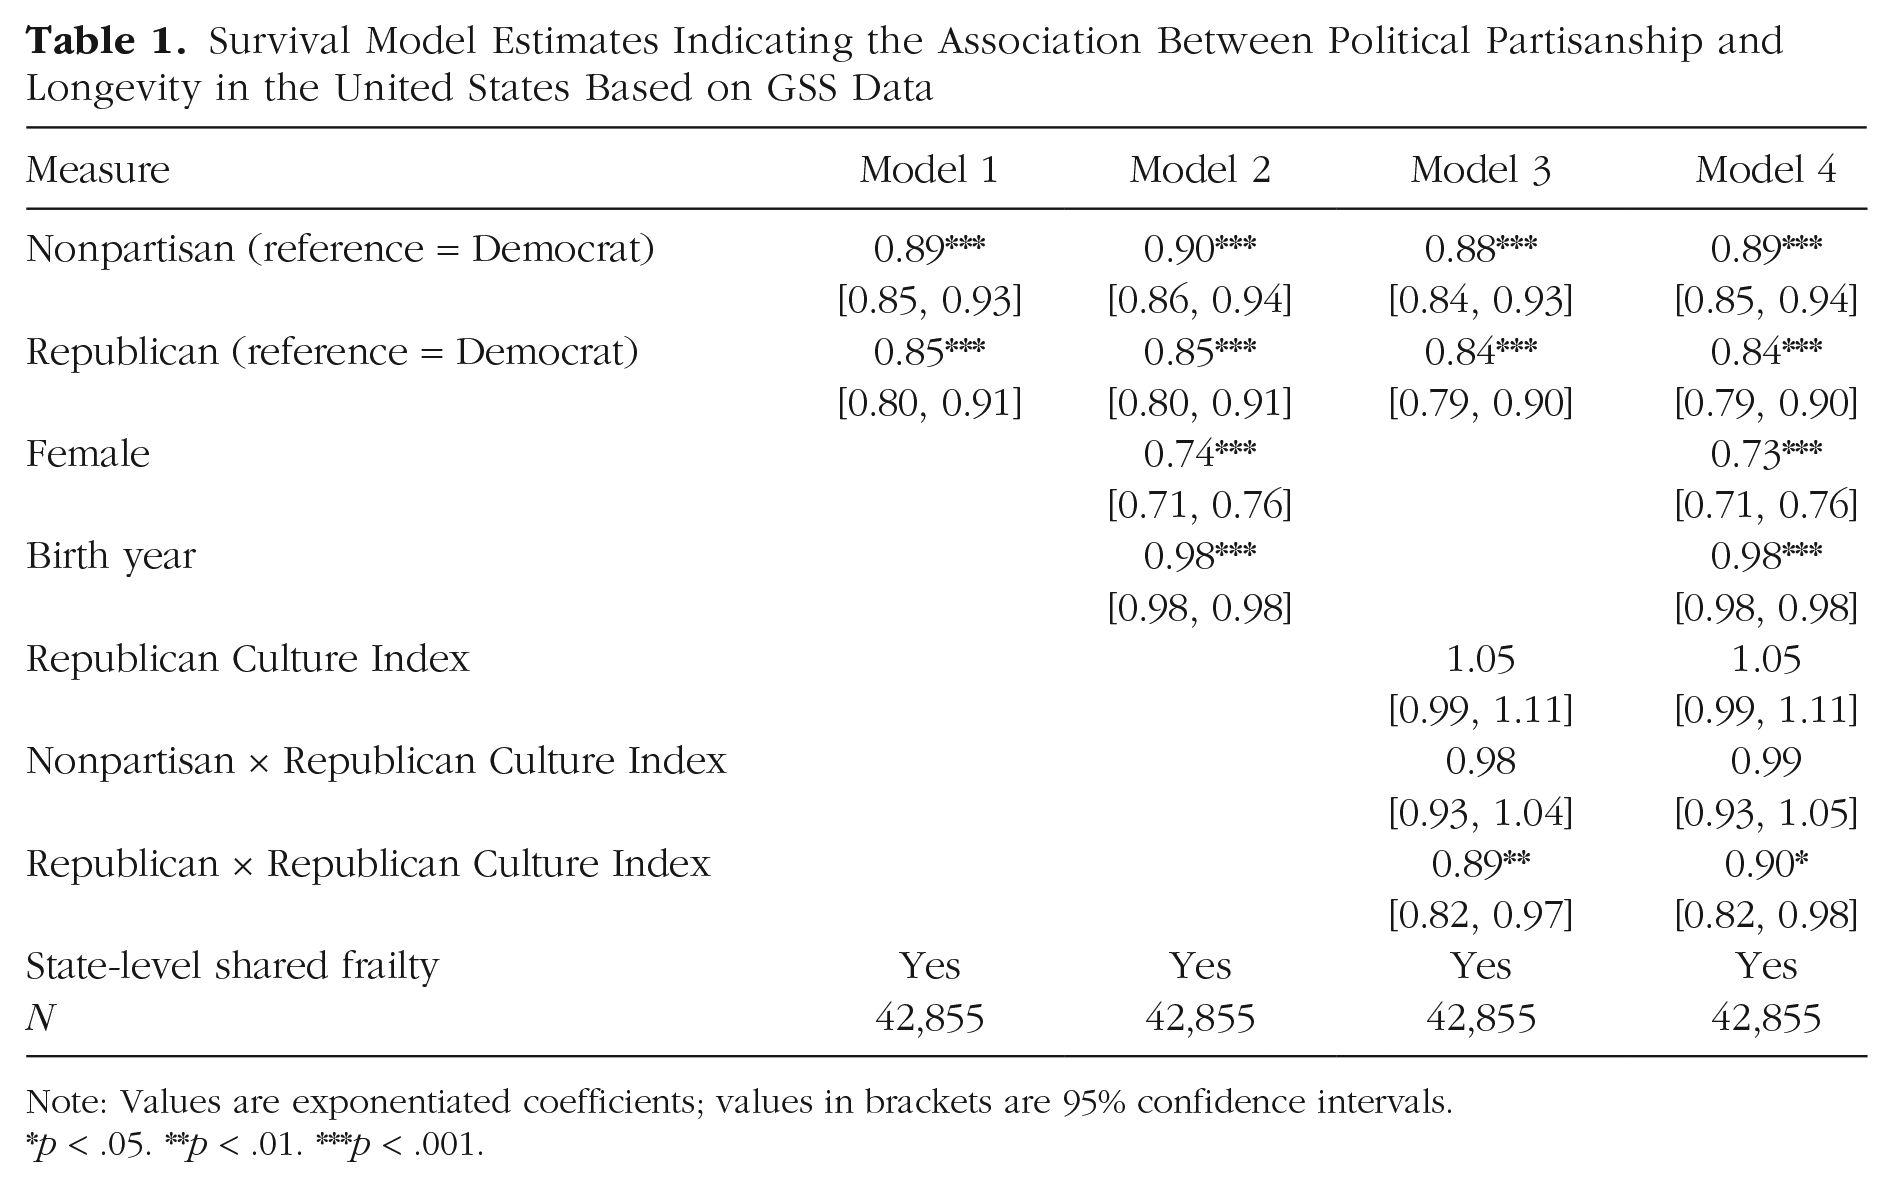
Note: Values are exponentiated coefficients; values in brackets are 95% confidence intervals.
p < .05. **p < .01. ***p < .001.
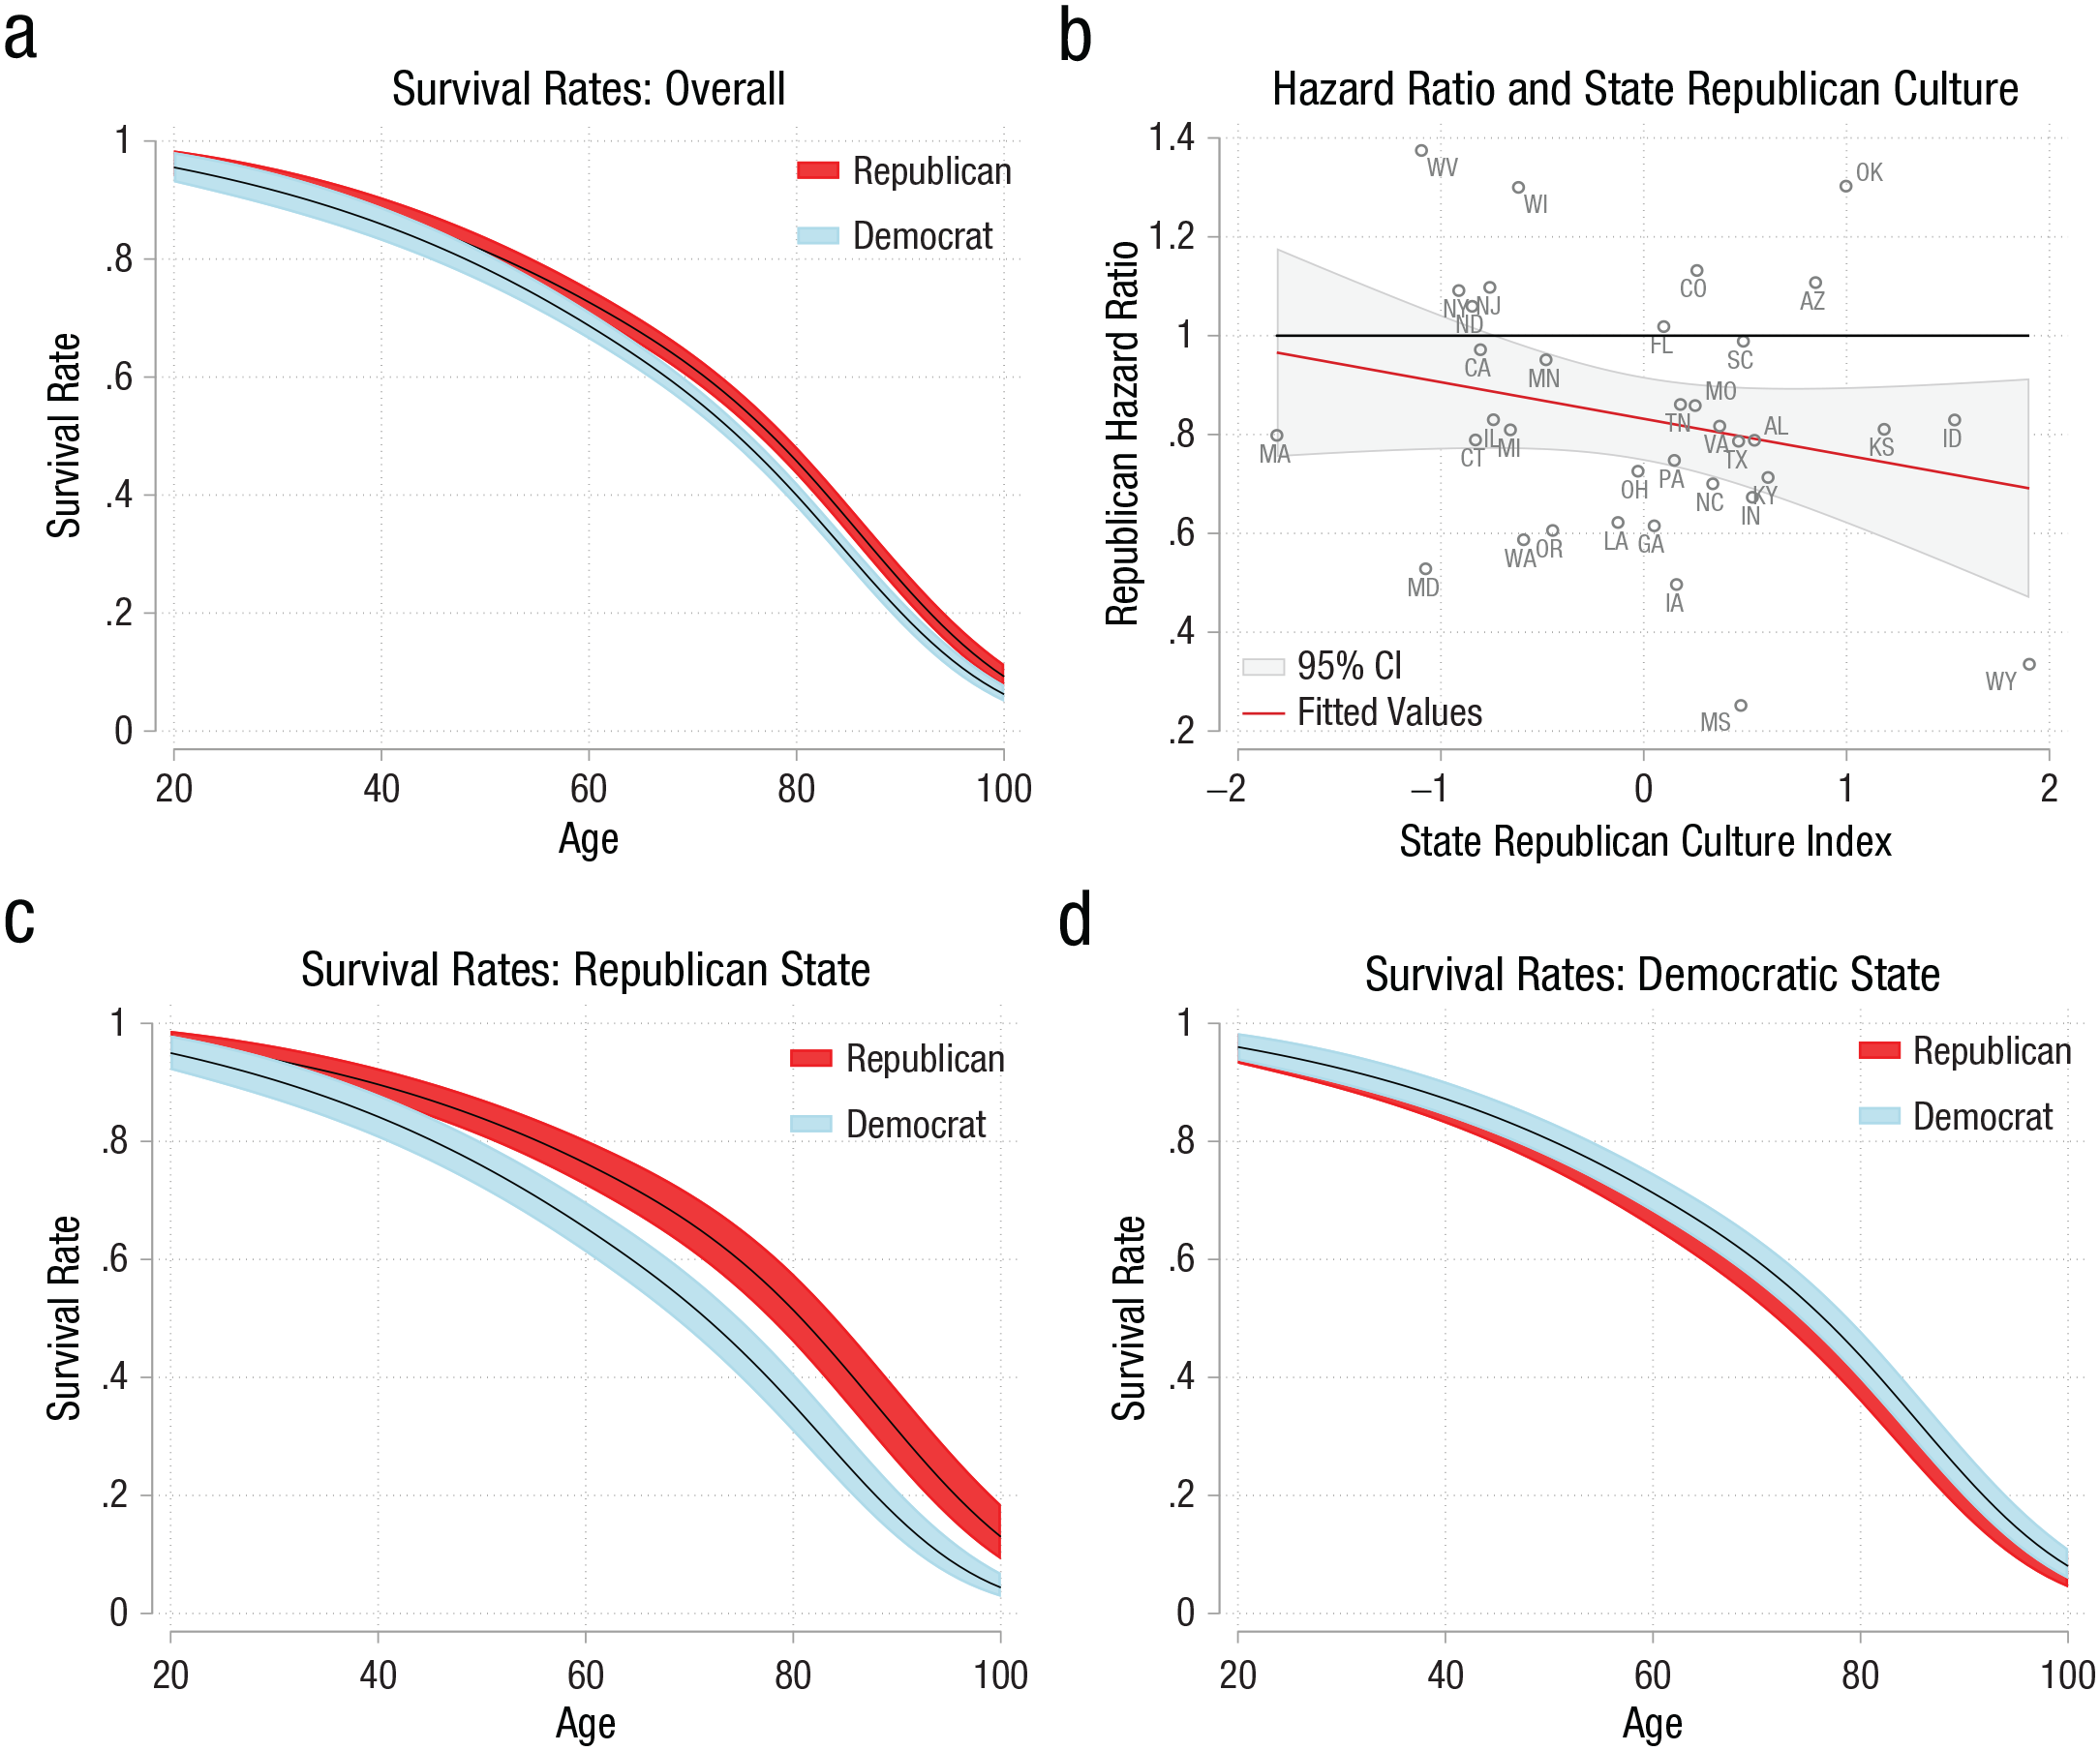
Survival rates for Republicans and Democrats in the GSS data. (a) Population-averaged survival curves for Republicans and Democrats in the entire United States. (b) State-specific hazard ratios for Republicans plotted against states’ Republican Culture Index (only for states with at least 15 observations for both Republicans and Democrats). Population-averaged survival curves estimated for (c) the highest and (d) the lowest observed Republican Culture Index. CI = confidence interval.
Second, we examined cross-cultural variation in the partisanship–longevity link. Thereby, we initially ran separate models for each state and found that Republicans’ hazard ratios varied across states and negatively covaried with a state’s Republican Culture Index (suggesting that Republicans featured lower hazard ratios in more Republican states; see Fig. 1b). To test this covariation more explicitly, we specified an interaction between individual partisanship and the Republican Culture Index in our survival model (Table 1, Models 3 and 4). Model 4 reveals that after accounting for gender and birth year, there was a significant negative interaction between Republican partisanship and the Republican Culture Index (hazard ratio = 0.90, 95% CI = [0.82, 0.98], p < .05). Supporting the person–culture match perspective, this negative interaction suggests that with a higher Republican Culture Index, the hazard ratio for Republicans decreases (i.e., the longevity benefit of Republicans gets bigger). To illustrate the real-world meaning of this effect, we compared population-averaged survival curves for Republicans versus Democrats at the highest versus lowest observed value of the State Republican Culture Index in Figures 1c and 1d. In the most Republican context, an estimated 51.4% of all Republicans, but only 35.4% of all Democrats, reached the age of 80 years (see Fig. 1c). By contrast, the overlapping survival curves in Figure 1d indicate that Republicans did not enjoy any longevity benefit in the most Democratic contexts.
Robustness tests
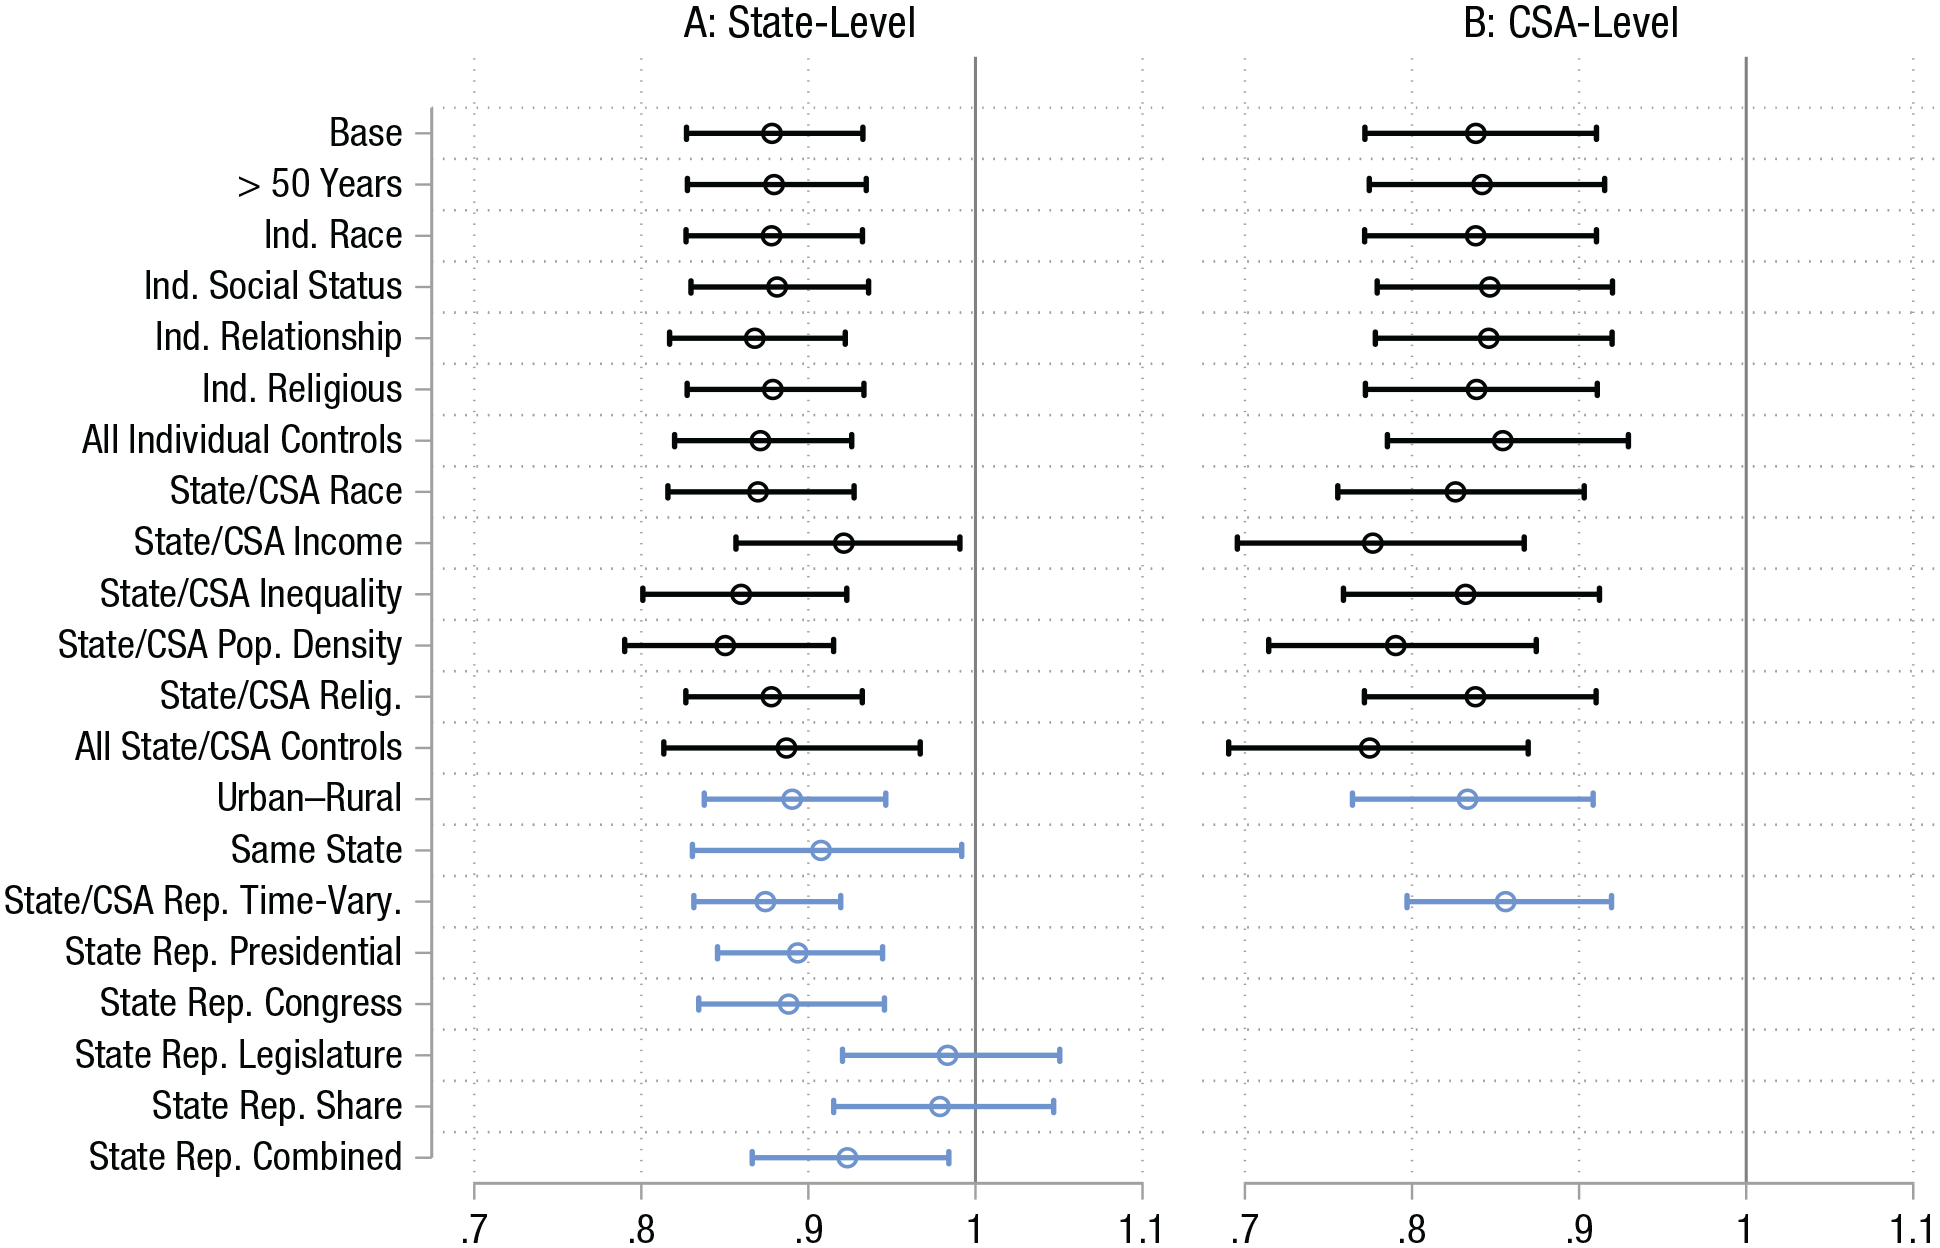
We ran a multitude of preregistered additional analyses to scrutinize the robustness of this main result (see black coefficients in Fig. 2a). Supplement S.3 in the Supplemental Material provides an overview of all employed variables, their operationalizations, and sources. First, to make sure that our findings were not driven by a few influential outliers, we repeated the main analyses, excluding people who died unusually young (reached an age younger than 50 years), which led to unchanged conclusions (see Supplement S.4 in the Supplemental Material). Second and most prominently, the observed pattern could simply reflect that Republicans in Republican states differ from Republicans in Democratic states regarding mortality-relevant characteristics (McCullough et al., 2000; Sorlie et al., 1995). 5 Therefore, we accounted for the main and interaction effects of race (whether a person was of White, Black, or other race), relationship status (whether participants were in a relationship when interviewed), objective socioeconomic status (average of income, education, and job prestige after z-standardizing each indicator; Kraus & Stephens, 2012), religious identification (whether a person had no, Catholic, Protestant, or other denomination), and religious service attendance (whether a person regularly attended church or not; see Supplement S.4). Third, we accounted for a range of potentially overlapping culture-level indicators, namely, the main and interaction effects of state-level wealth (median income), inequality (Gini Index of income), racial composition (share of White people), population density, and religiosity (share of religious adherents; see Supplement S.5 in the Supplemental Material). Taken together, although some coefficients were slightly above or just reaching the 5% significance level, 6 the estimates overall remained largely stable. Thus, in their totality, the preregistered robustness tests support the conclusions of the main analysis.
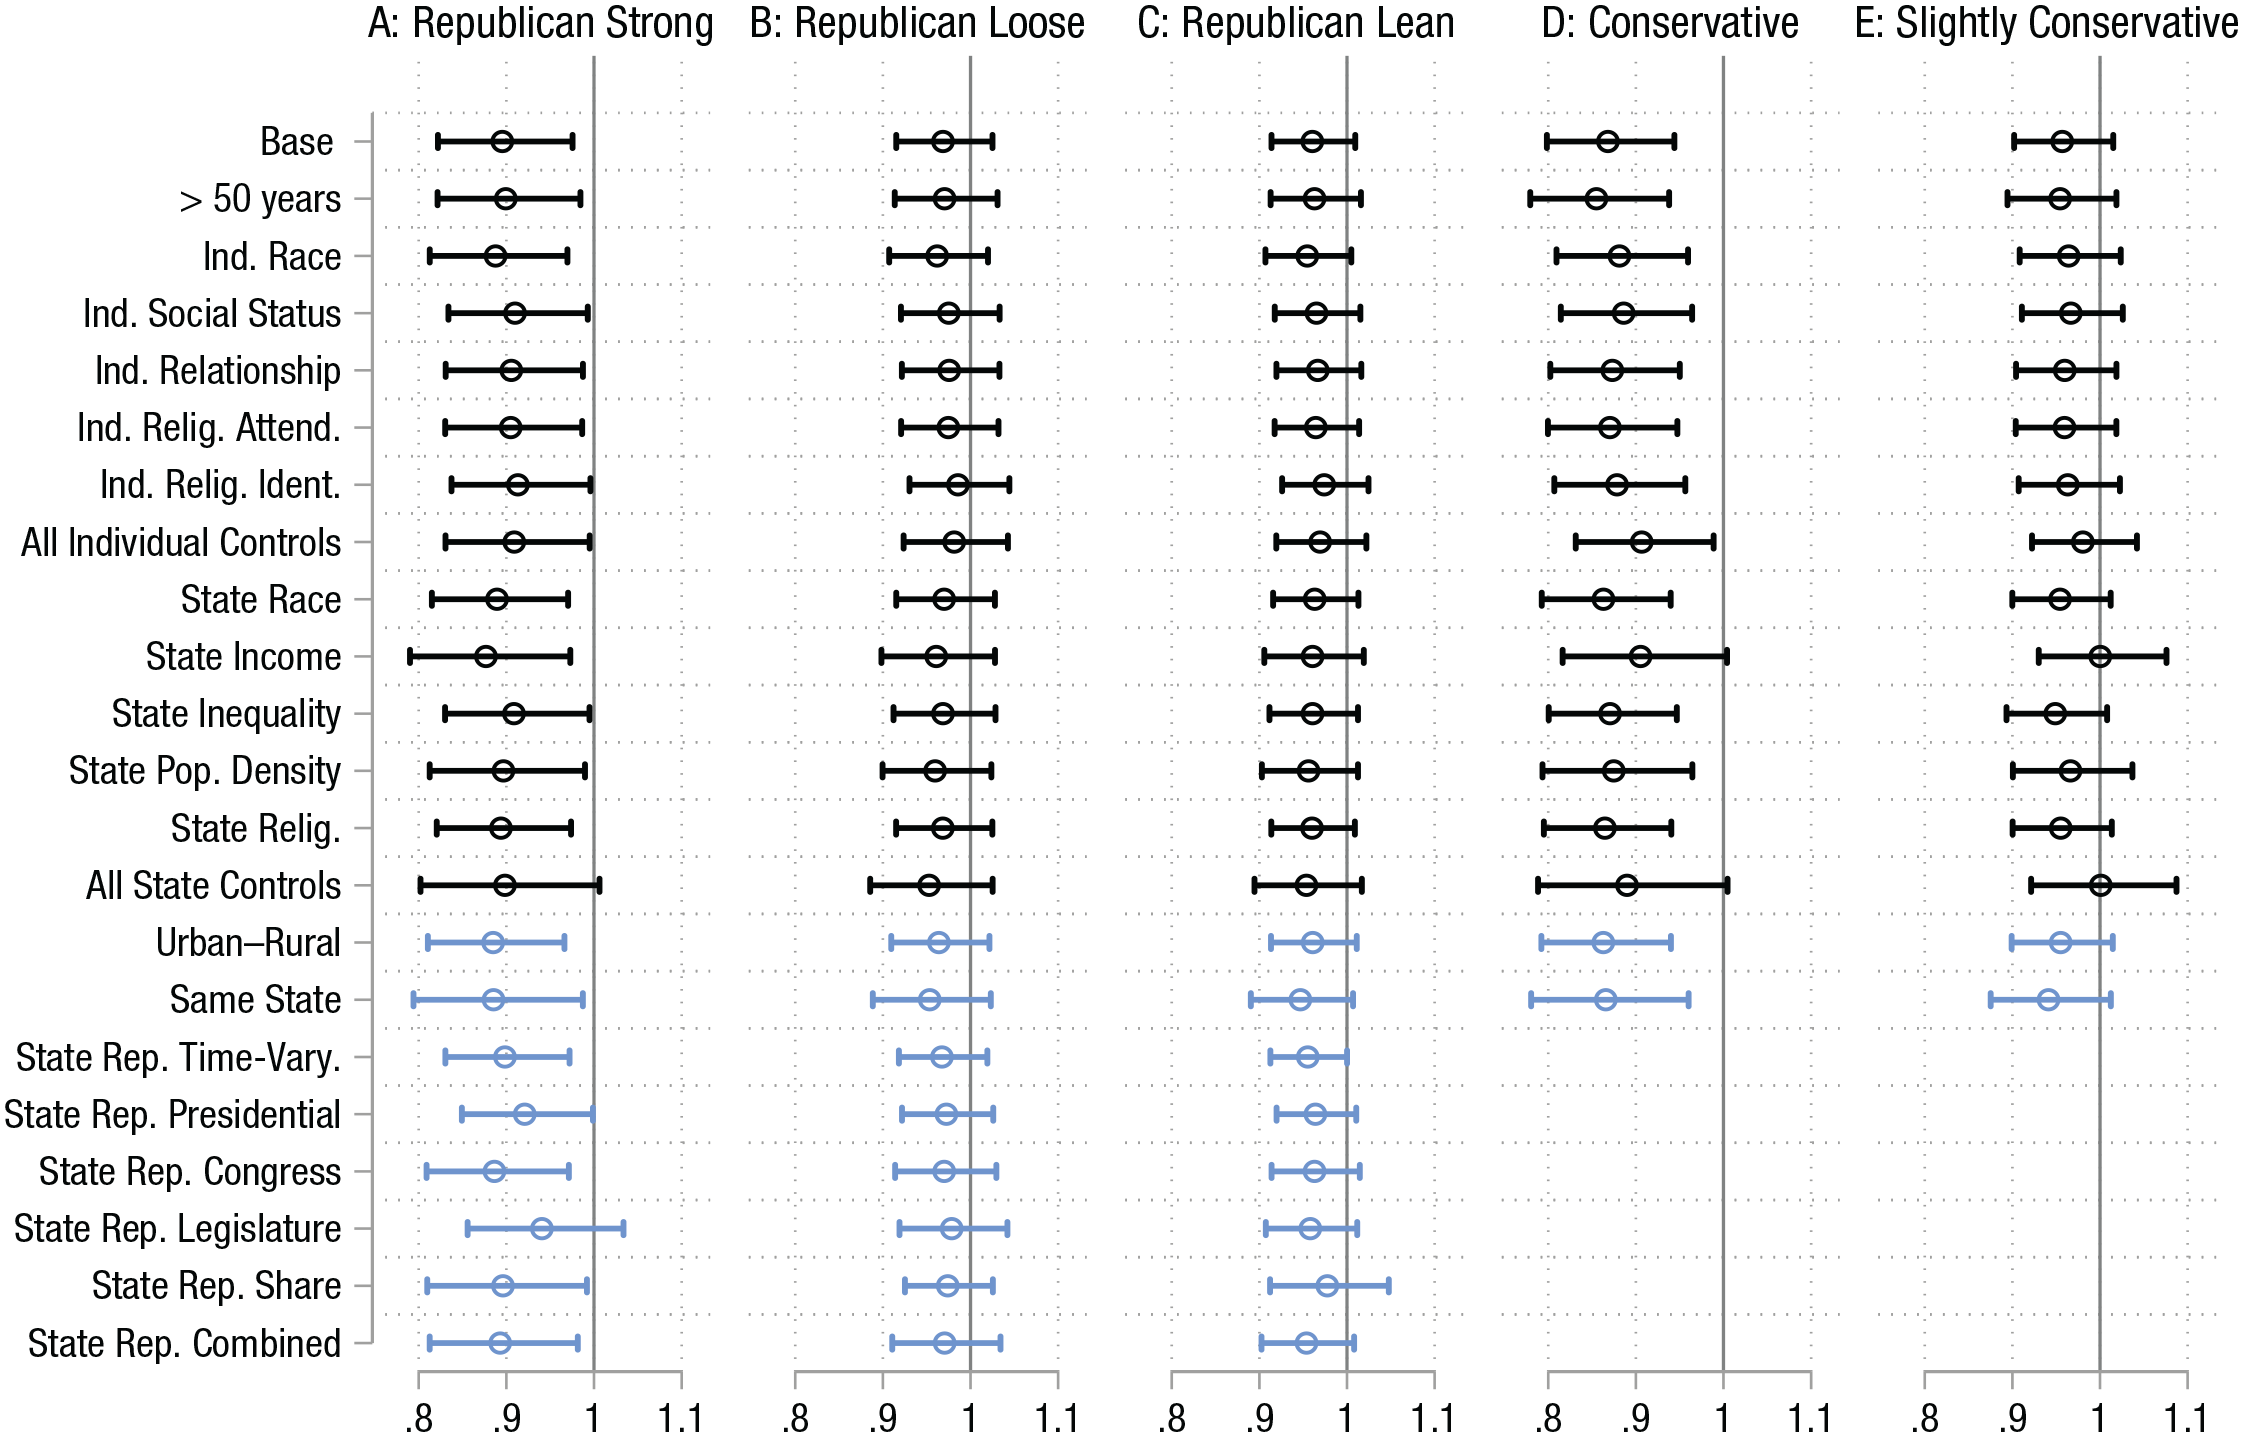
Coefficients across robustness tests in the GSS data. Depicted is the Republican × State Republican Culture Index interaction for (a) strong Republican partisans only, including (b) not-strong Republican partisans and (c) persons leaning toward the Republican party. Coefficients across robustness tests for (d) the Conservative × State-Conservatism interaction for conservatives and including (e) slight conservatives. Black coefficients denote preregistered robustness tests; blue coefficients denote additional robustness tests.
Next, we went beyond the preregistration and conducted further robustness tests that emerged as relevant while working with the data (see blue coefficients in Fig. 2a; see Supplement S.6 in the Supplemental Material). First, we accounted for urban–rural differences (whether a person lived in an urban, suburban, or rural setting). Second, we tried to address reverse causality (i.e., healthy people selecting themselves into politically matching cultural contexts). To do so, we repeated the main model using only participants who did not change states since the age of 16 years (this information was provided in the GSS data). Third, we reran the main models using a Republican Culture Index that is not stable but can vary across time (i.e., representing a moving average of 12 years). Finally, we used the indicators making up the State Republican Culture Index separately (i.e., presidential vote shares and bipartisan composition of a state’s congress) and used further alternative measures to differentiate between Republican and Democratic states (i.e., bipartisan composition of state legislature, statewide shares of Republicans estimated from the GSS data, and a composite indicator comprising all state-level partisanship measures). Apart from a state’s legislature composition, results were replicated for all of these alternative measures of state-level partisanship. In sum, the results of these additional robustness tests overall led to substantially unchanged conclusions (see coefficient plot in Fig. 2a).
In sum, Study 1 supports the person–culture match hypothesis: Within the GSS data, Republicans lived longer only in Republican states, whereas in Democratic states, Republicans did not enjoy any longevity benefits. In additional exploratory analyses, we examined potential boundary conditions of our main finding: Do political person–culture match effects depend on partisanship strength and do they generalize to political ideology?
Partisanship strength and ideology explorations
An advantage of Study 1’s underlying data is a detailed assessment of the strength of participants’ partisanship. Exploiting this information, we tested whether the political person–culture match effect depends on the strength of a person’s party identification. We found that effects were mostly absent when considering persons (a) with a not-strong party affiliation (see Fig. 2b) or (b) who were independent and only leaned toward a party (see Fig. 2c) as political partisans. In sum, the effects of political person–culture match seem to depend on partisanship strength and emerge only for persons with a strong party identification (for detailed results, see Supplements S.7–S.12 in the Supplemental Material).
Besides political partisanship, Study 1’s underlying data also provide information on political ideology (i.e., whether participants think of themselves as conservative or liberal). Exploiting this information, we explored whether the effects of political person–culture match on longevity also generalize to political ideology. To do so, we estimated the share of conservatives per state among the GSS data. We found that results were replicated for political ideology, with similar effect sizes (Individual × State-Level Conservatism interaction: hazard ratio = 0.87, 95% CI = [0.81, 0.94], p < .01). In the most conservative state, 41.3% of all conservatives, but only 18.3% of all liberals, reached an age of 80 years. By contrast, there was no significant longevity gap in liberal states. Supplement S.13 in the Supplemental Material provides estimated survival curves for conservatives and liberals across contexts. Mirroring the findings for political partisanship, this culturally varying ideology-longevity link again (a) held across various robustness tests (see Fig. 2d) and (b) was less pronounced for people with a weaker ideological standing (see Fig. 2e). In sum, this additional exploration suggests that the findings for political partisanship generalize to political ideology (for detailed results, see Supplements S.14–S.19 in the Supplemental Material).
Study 2: Partisanship and Longevity in Obituaries/Biographies
In Study 2, we sought to replicate the preregistered Study 1 in a confirmatory sample originating from a novel, entirely different empirical paradigm. To do so, we extracted information on political partisanship and longevity from the obituaries/biographies of deceased persons who were web-scraped from an online cemetery. Studying obituaries/biographies is worthwhile not only because they are publicly available but because they provide complementing empirical strengths and weaknesses to Study 1’s survey-based approach. Specifically, Study 1 provided the unique opportunity to study mortality for a large sample. However, this large sample came at the cost of relying on self-reported partisanship that might be subject to self-report bias (Paulhus & Vazire, 2007) and conflicted with further validity threats (e.g., partisanship information from one survey year was used to predict mortality many years later, although partisanship might have changed in the meantime). By contrast, Study 2 provided a stricter, informant-report assessment of political partisanship: The space in an obituary/biography is limited, and usually only the most important characteristics are included in the deceased person’s description. Accordingly, a person described as a Republican or Democrat in their obituary/biography most likely was a true political partisan throughout their entire life. However, this stricter partisanship assessment came at the cost of a smaller and more selective sample because not all deceased persons have an online obituary/biography (Wallace et al., 2019).
Method
Study 2’s data were retrieved following general guidelines for ethical web-scraping (Densmore, 2017). The data and analysis scripts underlying Study 2’s regression models can be obtained at https://osf.io/kj4tr.
Partisanship and mortality
Study 2 rests on a randomly web-scraped sample of obituaries/biographies from the world’s largest online cemetery (findagrave.com). These obituaries/biographies are short texts about a deceased person written by a surviving dependent. Alongside the textual information, the data also provide the deceased person’s name, dates of birth and death, and cemetery. The raw sample for this study comprised 988,369 obituaries/biographies of deceased persons who were buried in the United States, died since 1979, and reached an age between 18 and 100 years (i.e., covering the same analysis period and age range as Study 1). To identify deceased political partisans, we screened all of these texts for the occurrence of the terms “Republican” and “Democrat” and found that 9,546 obituaries/biographies featured one of these terms (e.g., “She was a devoted mother and grandmother, an avid gardener, a staunch Republican”; “Proud member of the United Auto Workers and lifelong Democrat”). We matched these data with information from the Social Security name database to derive a deceased person’s gender on the basis of their first name (U.S. Social Security Administration, 2023). After we excluded obituaries/biographies that featured both terms and applied listwise exclusion (i.e., excluding all obituaries with missing information on name, birth date, or death date), the final sample comprised 9,177 obituaries (49.3% female) with 564,362 observed person-years. To assess these novel data’s validity, we compared their properties with official estimates. First, life expectancy among the sample was 78.5 years (i.e., closely mirroring the official estimate of life expectancy in the United States of 78.84 years in 2014), validating the data’s overall representativeness. Second, the share of Republicans per state in the data corresponds with historical Republican state-level vote shares (r = .48, p < .001), validating the partisanship measure. 7
Republican versus Democratic states
Deceased persons were matched to the state in which they were buried. Although in some cases, the state of burial might deviate from the state in which a person spent their life, this is not a major problem. For many observations, memorials also provide information on where the deceased person died. Of the 7,138 entries for which death place information was available, 87.5% of the individuals were buried in the same state as they died in (but we also tested models including only people who were buried in the same state as they were born and died in; see the Robustness Tests section). Study 2 rests on the same Republican Culture Index as Study 1 to distinguish between Republican and Democratic states.
Analytic approach
To examine the effects of political person–culture match on longevity, we used the same statistical model as in Study 1 (i.e., Cox regression with shared state-level frailty; Cleves et al., 2008; Cox, 1972). We specified our model on an age timescale with left truncation at the age of 18 years (because people cannot die prior to our inclusion criteria of 18 years). Again, the sample size exceeded the established minimum thresholds for Cox regression models (Ogundimu et al., 2016).
Results
Main results
We again employed a two-step analytical approach. First, we sought to replicate the established main effect of political partisanship on longevity in these novel data (Table 2, Models 1 and 2). After accounting for gender and birth year, we found that Republicans featured a lower hazard ratio compared with Democrats (hazard ratio = 0.89, 95% CI = [0.85, 0.93], p < .001), indicating that Republicans—at each point in their lives—had an 11% reduced risk of dying compared with Democrats. Figure 3a illustrates the real-world meaning of this effect by depicting the population-averaged survival curve for Republicans and Democrats among the obituary/biography data; 56.1% of all Republicans, but only 52.4% of all Democrats, reached an age of 80 years. Thus, the results replicated the findings from Study 1 and previous literature. This replication is a testament to the validity of the novel data underlying Study 2.
Survival Model Estimates Indicating the Association Between Political Partisanship and Longevity in the United States Based on Obituary/Biography Data
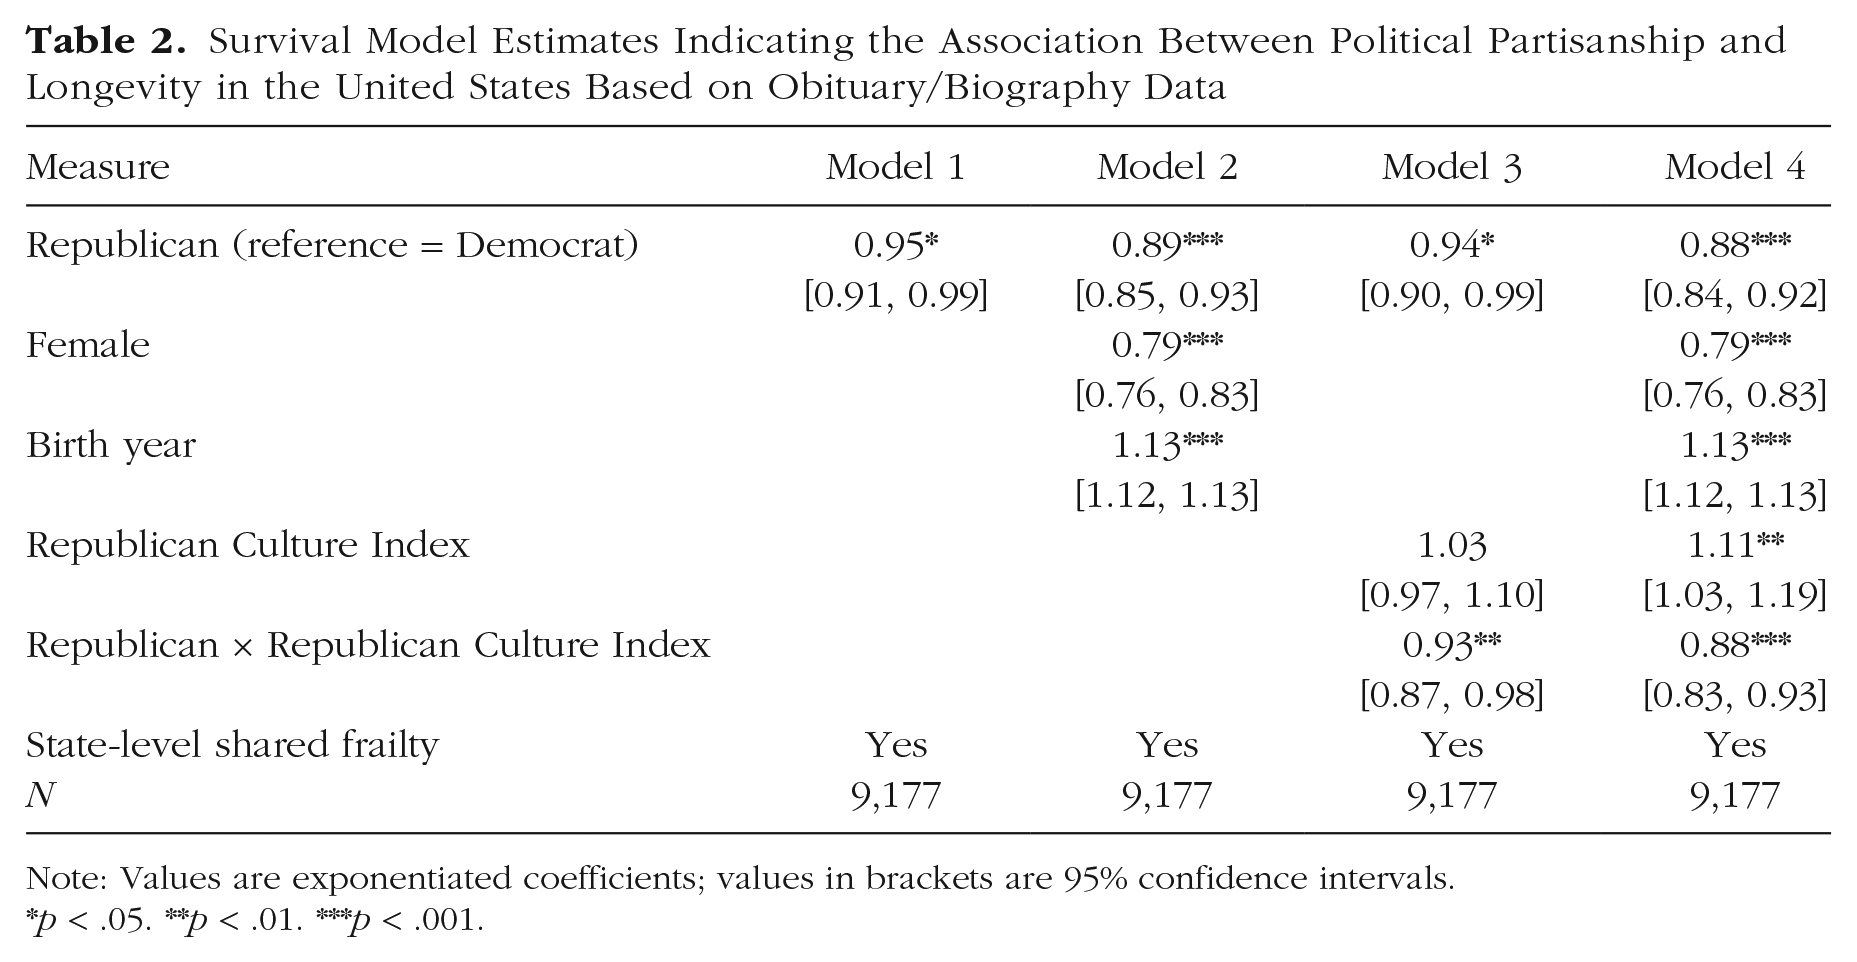
Note: Values are exponentiated coefficients; values in brackets are 95% confidence intervals.
p < .05. **p < .01. ***p < .001.
Survival rates for Republicans and Democrats in the obituary/biography data. (a) Population-averaged survival curves for Republicans and Democrats in the entire United States. (b) State-specific hazard ratios for Republicans plotted against states’ Republican Culture Index (only for states with at least 15 observations for both Republicans and Democrats). Population-averaged survival curves estimated for (c) the highest and (d) the lowest observed Republican Culture Index. CI = confidence interval.
Second, mirroring Study 1, we tested for cultural variation in the partisanship–longevity link. Figure 3b shows that space-specific Republican hazard ratios again varied across states and tended to be lower in more Republican states. To test this covariation more objectively, we specified an interaction between Republican partisanship and the Republican Culture Index in the survival model (Table 2, Models 3 and 4). We again found a significant negative interaction after accounting for gender and birth year (hazard ratio = 0.88, 95% CI = [0.84, 0.92], p < .001). This means that in more Republican states, the longevity benefit for Republicans gets bigger. Figures 3c and 3d illustrate the real-world meaning of this interaction effect by comparing population-averaged survival curves for Republicans versus Democrats at the highest versus lowest observed value of the State Republican Culture Index. Figure 3c depicts that in the most Republican context, an estimated 57.1% of all Republicans, but only 48.3% of all Democrats, reached an age of 80 years. Importantly though, the overlapping curves in Figure 3d depict that in the most Democratic context, Republicans did not enjoy any longevity benefit.
Robustness tests
We again ran a multitude of additional analyses to scrutinize the robustness of Study 2’s results (Supplement S.21 in the Supplemental Material provides an overview of all variables used, their operationalizations, and sources). These robustness tests were designed to be as parallel as possible to Study 1. First, we reran the main models, excluding participants who did not reach the age of 50 years (see Supplement S.22 in the Supplemental Material). Second, we accounted for individual differences in race (by estimating a deceased person’s probability of being of Black race on the basis of their surname; U.S. Census Bureau, 2016), relationship status (by screening biographies for the terms “married,” “husband,” and “wife”), social status (i.e., share of terms from the LIWC power and money dictionaries; Pennebaker et al., 2001), and religiosity (i.e., share of terms from the LIWC religiosity dictionary; Pennebaker et al., 2001; see Supplement S.22). Third, we accounted for the same culture-level indicators as in Study 1, namely, statewide differences in wealth, inequality, racial composition, population density, and religiosity (see Supplement S.23 in the Supplemental Material). Fourth, we controlled for urban–rural differences (see Supplement S.24 in the Supplemental Material). Fifth, we tried to rule out reverse causality (i.e., people selecting themselves into specific states) by including only persons with identical birth, death, and burial states (see Supplement S.24). Finally, we treated the Republican Culture Index as a time variant rather than a time-fixed variable and tested alternative operationalizations of state-level partisanship (see Supplement S.24). Figure 4a shows that these robustness tests largely replicated the main finding and overall led to substantially unchanged conclusions. 8
Coefficients across robustness tests in the obituary/biography data. Depicted are coefficients for (a) the Republican × State Republican Culture interaction and (b) the Republican × CSA Republican Culture interaction. Black coefficients denote robustness tests according to Study 1’s preregistration; blue coefficients denote additional robustness tests. CSA = combined statistical area.
Taken together, this second study also suggests that Republicans live longer in Republican, but not in Democratic, areas. In sum, Study 2 replicated the preregistered findings from Study 1 in a confirmatory sample originating from an entirely different empirical paradigm. In additional exploratory analyses, we examined another potential boundary condition of this main finding: Do political person–culture match effects generalize from the state level to a more fine-grained region level?
Region-level explorations
An advantage of Study 2’s underlying data is detailed information on where a person was buried. In additional exploratory analyses, we used this information to test person–culture match effects on a more fine-grained spatial level—namely, across 122 combined statistical areas (CSAs; see Supplement S.21). 9 CSAs capture urban areas plus an adjacent hinterland that shows strong economic and social ties with this urban core (U.S. Office of Management and Budget, 2010). We chose the CSA level for two reasons. First, CSAs are demarcated on the basis of actual spatial behavior and capture the population to which people are exposed on a regular basis. Second, CSAs provide a feasible ratio of observations per unit with our data (i.e., 30 deceased persons per CSA on average). We found that results were replicated at the CSA level with somewhat larger effect sizes (Individual × CSA-Level Partisanship interaction: hazard ratio = 0.84, 95% CI = [0.77, 0.91], p < .001). Supplement S.25 in the Supplemental Material provides estimated survival curves for Republicans and Democrats across CSAs. To illustrate, we found that in the most Republican CSA, 61.9% of all Republicans, but only 48.6% of all Democrats, reached an age of 80 years. By contrast, there was no significant longevity gap in Democratic CSAs. This interaction effect again held across robustness tests (see Fig. 4b). In sum, the longevity benefit of political person–culture match is not an artifact of the state level but seems to generalize to more fine-grained spatial levels (for details, see Supplements S.26–S.28 in the Supplemental Material).
Discussion
Previous research found that Republicans are healthier and live longer than Democrats and suggested that these health benefits are universal (Kannan et al., 2019; Pabayo et al., 2015). In two studies with complementary strengths and weaknesses, we qualified this previous research: A longevity benefit for Republicans was present only in Republican states. In Democratic states, by contrast, there was no longevity benefit for Republicans. A multitude of robustness tests demonstrated that this pattern is robust against different empirical operationalizations and transcends potentially overlapping demographic, economic, or sociocultural differences. Further explorations revealed that the person–culture match effect (a) generalizes to political ideology (i.e., conservative vs. liberal) and (b) holds across spatial levels (i.e., transcends from states to the CSA level) but (c) depends on the strength of a person’s political convictions (i.e., emerges for only strong partisanship and ideology).
Importantly, the longevity benefits of person–culture match emerged only for Republicans/conservatives (i.e., there was no longevity benefit for Democrats/liberals in Democratic/liberal states). Although the exact reason for this asymmetry remains unknown, previous literature suggests at least two potential explanations. First, the found asymmetry closely aligns with previous findings from political person–culture match on happiness (i.e., no matching benefits for liberals in liberal contexts; Stavrova & Luhmann, 2016). Stavrova and Luhmann noted that a conservative political ideology (which is often found among Republicans) is associated with a greater value for conformity and a greater need for social affiliation and validation. Accordingly, one explanation for the asymmetry could be that matching with the sociocultural context may be less relevant for Democrats than for Republicans. Second, the found asymmetry also closely aligns with findings from religious person–culture match on self-esteem and longevity (i.e., no matching benefit for nonreligious persons in nonreligious contexts; Ebert et al., 2020; Gebauer et al., 2017). To explain this asymmetry, Gebauer et al. (2017) noted that the norm to be nonreligious in nonreligious contexts might not be as strong as the norm to be religious in religious contexts. Importantly, Republicans are more unified by an ideology than Democrats (i.e., “Republican partisans tend to view political conflict as fundamentally ideological in nature, while Democrats perceive it as a clash of competing group interests”; Grossmann & Hopkins, 2015, p. 123). Accordingly, another explanation for the asymmetry could be that Democratic sociocultural contexts elicit weaker normative pressures than Republican sociocultural contexts. In sum, less personal relevance and weaker cultural norms may prevent a longevity benefit for Democrats in Democratic contexts. Regardless of the exact reason, the observed asymmetry provides a novel alternative explanation that may (at least partly) explain the previously observed partisanship–longevity gap in the United States: Strongly identified Republicans get a benefit from living in Republican contexts, which strongly identified Democrats do not get from living in Democratic contexts.
Limitations
Although resting on a unique combination of data, the present research is naturally not free of limitations. Specifically, at least four issues warrant particular attention in future research. First, both studies relied on cross-sectional data. To move closer to causal claims, future research should seek to replicate the present findings using longitudinal data in which political partisanship and place of residence are assessed at multiple points in time and, thus, can change throughout a person’s life. Second, the current findings are limited to the U.S. context. The United States, with its strong political divide (van Baar & FeldmanHall, 2022) and polarized political landscape (consisting of Republican and Democratic stronghold states; Johnston et al., 2020), provides a sensitive point to start investigating cultural variation in the partisanship–longevity link. However, future research should examine whether and to what degree these U.S.-based findings also generalize to other, particularly non-WEIRD (Western, educated, industrialized, rich, and democratic), countries (Henrich et al., 2010). Third, both studies used the state level as their main level of analysis. Study 2 replicated the effect at the CSA level and provided evidence that the effects generalize to (and may be stronger at) more fine-grained spatial levels. However, we could not look at spatial scales smaller than CSAs (such as counties or congressional districts). Accordingly, it will be an important task for future research to examine at which scale the effects of political person–culture match operate exactly. Finally, we here provided the first study demonstrating cultural variation in the partisanship–longevity link. As such, the present work naturally raises new questions. Most prominently, it remains unknown what exactly it is about person–culture match that conveys longevity benefits (i.e., which processes drive the effect?). To illustrate, we here assumed that psychological processes (i.e., self-validation and social bonds) are at play. However, other, more institutional, processes are possible. For example, Republicans and Democrats hold different views on many politicized health issues (Hersh & Goldenberg, 2016). Thus, it may be that Republicans live longer in Republican states because Republican governments create health care systems that favor Republicans. Future research may, thus, combine longitudinal observational data with experimental methods to disentangle the intraindividual, interindividual, and institutional processes driving the effects of political person–culture match.
Implications
Despite these limitations, the results provide robust evidence that the partisanship–longevity link varies across cultural contexts. This cultural variation has scientific and societal implications. From a scientific perspective, the present work provides at least three contributions. First, it challenges the role of Republican partisanship as a universal provider of longevity benefits. Specifically, the study shows that Republicans’ previously found longevity benefits are not tied to partisanship per se but may derive from the broader phenomenon of person–culture match. Second, the findings suggest that partisanship in the United States—in some places—may be even more consequential for longevity than previously thought. That is because previous research diluted the strong longevity benefits of Republican partisanship in Republican areas by lumping them together with the absent effects from Democratic areas. Third, the project adds the political domain to the study of the longevity consequences of person–culture match. Thus, it extends recent research from the domain of religiosity (Ebert et al., 2020; Stavrova, 2015) and fortifies the role of residential person–culture match as a relevant psychological phenomenon (Fulmer et al., 2010; Oishi, 2015).
From a societal perspective, the present research provides at least two implications. First, previous research suggests that people tend to move away from places with a poor political person–culture match toward places with a better match (Motyl et al., 2014). If the association between political person–culture match and longevity is a causal one (which still needs to be demonstrated), such selective residential mobility may form a way to prolong life—a finding particularly relevant in the residentially mobile societies of modern times (Oishi, 2010). Second, political person–culture match suggests that in Republican states, Republicans live longer. Importantly, if Republicans live longer, they can cast their vote in more elections. Consequently, by selectively keeping voters alive who match the political landscape, the structure of the current political context may perpetuate itself into the future. We crudely adjusted statewide Republican vote shares for the person–culture match effect (see estimation in Supplement S.30 in the Supplemental Material). To illustrate, for a state with the political profile of Georgia, we estimated that adjusting for person-culture match may affect election outcomes in a magnitude that is greater than currently observed electoral margins (e.g., 0.23 percentage points in the 2020 presidential election). Accordingly, in certain (albeit special) scenarios, the political person–culture match effect could tip an electoral scale.
Supplemental Material
sj-pdf-1-pss-10.1177_09567976231196145 – Supplemental material for Political Person–Culture Match and Longevity: The Partisanship–Mortality Link Depends on the Cultural Context
Supplemental material, sj-pdf-1-pss-10.1177_09567976231196145 for Political Person–Culture Match and Longevity: The Partisanship–Mortality Link Depends on the Cultural Context by Tobias Ebert, Jana B. Berkessel and Thorsteinn Jonsson in Psychological Science
Footnotes
Transparency
Action Editor: Mark Brandt
Editor: Patricia J. Bauer
Author Contributions
Notes
References
Supplementary Material
Please find the following supplemental material available below.
For Open Access articles published under a Creative Commons License, all supplemental material carries the same license as the article it is associated with.
For non-Open Access articles published, all supplemental material carries a non-exclusive license, and permission requests for re-use of supplemental material or any part of supplemental material shall be sent directly to the copyright owner as specified in the copyright notice associated with the article.