
Abstract
Obesity has adverse consequences for those affected. We tested whether the association between obesity and its adverse consequences is reduced in regions in which obesity is prevalent and whether lower weight bias in high-obese regions can account for this reduction. Studies 1 and 2 used data from the United States (N = 2,846,132 adults across 2,546 counties) and United Kingdom (N = 180,615 adults across 380 districts) that assessed obesity’s adverse consequences in diverse domains: close relationships, economic outcomes, and health. Both studies revealed that the association between obesity and its adverse consequences is reduced (or absent) in high-obese regions. Study 3 used another large-scale data set (N = 409,837 across 2,928 U.S. counties) and revealed that lower weight bias in high-obese regions seems to account for (i.e., mediate) the reduction in obesity’s adverse consequences. Overall, our findings suggest that obesity’s adverse consequences are partly social and, thus, not inevitable.
Obesity currently affects over one in four adults in Europe (World Health Organization [WHO], 2022) and one in three adults in the United States (Centers for Disease Control and Prevention [CDC], 2021). Between 1990 and 2024, global obesity prevalence almost doubled (WHO, 2024). This “obesity epidemic” (WHO, 2024) has far-reaching societal consequences. Indeed, in the United States, health-care costs associated with obesity total roughly $147 billion per year (CDC, 2021).
Obesity is not only a societal challenge but also has far-reaching consequences for those affected. Individuals with obesity face severe adversity in the domains of close relationships, economics, and health (Chen & Brown, 2005; Schafer & Ferraro, 2011; Wolfe, 2022). For example, individuals with obesity are less likely to be in stable relationships (Chen & Brown, 2005), to have satisfying family relationships (Ball et al., 2004), and to have close friends (Puhl & Brownell, 2006). Individuals with obesity are also more likely to be unemployed (Agerström & Rooth, 2011), to be in debt (Wolfe, 2022), and to have lower levels of education (Cohen et al., 2013). Finally, individuals with obesity are more prone to report poor health (Schafer & Ferraro, 2011) and to suffer from cardiovascular diseases (WHO, 2022) or mental-health issues (Jokela et al., 2016).
This article examines the degree to which these adverse consequences of obesity affect persons differently depending on where they live. This is important because there is good theoretical reason to assume that obesity’s consequences depend on the region in which a person lives. However, previous scholarship has paid only very little attention to such regional variation (for an important exception, see Wadsworth & Pendergast, 2014).
We studied regional differences in obesity’s association with its adverse consequences from a person-culture match perspective (Fulmer et al., 2010). Specifically, we tested whether the association between obesity and its adverse consequences is particularly strong in regions in which obesity prevalence is low but particularly weak in regions in which obesity prevalence is high. But why should obesity’s adverse consequences be contingent on regional obesity prevalence?
Obesity’s adverse consequences are (at least partly) due to weight bias (Puhl & Heuer, 2009). Weight bias is a negative stereotype that individuals with obesity are lazy, unmotivated, and undisciplined. This bias translates into prejudice and overt discrimination (Puhl & Heuer, 2009), which eventually disadvantages individuals with obesity in the relationship domain (e.g., social exclusion; Puhl & Brownell, 2006), economic domain (e.g., negative hiring decisions; Agerström & Rooth, 2011), and health domain (e.g., poor psychological health; Emmer et al., 2020). Importantly, weight bias is a social-comparative phenomenon (Wadsworth & Pendergast, 2014): Bias and stigmatization exclusively penalize nonnormative attributes (i.e., divergence from sociocultural norms; Elliott et al., 1982). Following this logic, the severity of weight bias and its adverse consequences should depend on the prevailing normativity of obesity: In regions in which obesity is relatively nonnormative (i.e., low obesity prevalence), weight bias should be more severe (and, thus, more consequential). By contrast, in regions in which obesity is relatively normative (i.e., high obesity prevalence), weight bias should be less severe (and, thus, less consequential).
To summarize, individuals with obesity face adverse relationship, economic, and health outcomes (Chen & Brown, 2005; Schafer & Ferraro, 2011; Wolfe, 2022). We expected these adverse consequences to be reduced in high-obese regions (Studies 1 and 2), and we expected lower weight bias to at least partly account for (i.e., mediate) the reduction (Study 3).
With ever-increasing obesity rates (WHO, 2022) and ineffective obesity interventions (Nordmo et al., 2020), our person–culture match perspective on obesity carries far-reaching scientific and societal implications: From a scientific perspective, revealing regional variation in obesity’s adverse consequences would qualify a large body of obesity-related literature (literally hundreds of studies). From a societal perspective, if obesity’s adverse consequences are at least partially socially constructed, they might not be as inevitable as is often thought, hence giving way to social interventions (in addition to medical interventions).
Statement of Relevance
Obesity comes with adverse consequences for those affected, including relationship, economic, and health disadvantages. Our research suggests that these adverse consequences are not the same everywhere but vary across regions. Specifically, we found that the association between obesity and its adverse consequences is curtailed in regions in which obesity is very common and in which weight bias is lower. These findings suggest that previous research has underestimated the severity of obesity’s consequences in some places (because stronger and weaker consequences in different regions were lumped together). Our findings also suggest that obesity’s adverse consequences are not as inevitable as often thought. The findings give way to social interventions, stress the importance of reducing weight bias, and may inform policymakers about the different challenges that obesity-related policies face in different regions.
We investigated regional variance in the association between obesity and its consequences across two nations using three large-scale data sets. In Study 1, we used data from the Behavioral Risk Factor Surveillance System (BFRSS; CDC, 1984) to examine the variation in obesity’s adverse consequences for 2,846,132 participants across 2,546 regions in the United States. In Study 2, we used BBC Lab data (Rentfrow et al., 2015) to examine the variation in obesity’s adverse consequences for 180,615 participants across 380 regions in the United Kingdom. Finally, in Study 3, we expanded Study 1’s database with large-scale data from Project Implicit (Xu et al., 2022) to examine whether lower regional weight bias can account for the variation in obesity’s adverse consequences.
Open Practices Statement
The current study used three large-scale archival data sets. Data collection was in accordance with the World Medical Association Declaration of Helsinki and did not put participants at any known psychological risk (e.g., no induction of emotions, no assessment of traumatic experiences, no questioning of participants’ self-image, and no deception). Study 1’s BRFSS data can be accessed at https://www.cdc.gov/brfss/index.html. Study 2’s BBC Lab data can be accessed at https://beta.ukdataservice.ac.uk/datacatalogue/studies/study?id=7656#!/access-data. Study 3’s Project Implicit data can be accessed at https://osf.io/y9hiq. The design and analysis plan for the study were not preregistered. All analysis code can be accessed at https://osf.io/9vwc5/?view_only=b068d199021946288427d2637ad3386c.
Study 1: Contingency on Regional Obesity Prevalence in the United States
This study focused on the United States, a nation hit particularly hard by the obesity epidemic and where most of the previous obesity research has been carried out. Using large-scale survey data, we tested whether obesity’s adverse consequences are reduced in regions with high obesity prevalence.
Method
Participants
The data came from the BRFSS (CDC, 1984). The BRFSS has collected annual telephone interview data from more than 400,000 U.S. residents since 1984, covering all U.S. states and territories. We analyzed the survey waves from 2005 to 2013 for the following reason: For those waves only, the BRFSS consistently included the information necessary to examine regional variation in obesity’s consequences (i.e., information on participants’ weight, height, and county of residence and on relationship, economic, and health outcomes). We retained the data of all participants for whom this necessary information was available, resulting in a sample of 2,846,132 participants across 2,546 counties. Participants were between 18 and 90 years old (M = 54.55 years, SD = 16.86), and 60.34% were women.
Individual and regional obesity prevalence
Obesity is defined medically as “abnormal or excessive accumulation of fat that presents a risk to health” (WHO, 2022, p. 3). Following the WHO’s (2022) definition as well as previous clinical and psychological research and practice (Emmer et al., 2020), we operationalized obesity as a body mass index (BMI) of 30 or higher. Although BMI does not provide a direct measure of obesity, it is recognized as a practical approach in clinical, surveillance, and research settings (Emmer et al., 2020). This is because height and weight measurements are noninvasive and do not require specialized skills or expensive equipment. On the basis of this definition, 26.79% of all participants in this study were categorized as living with obesity.
To measure regional obesity prevalence, we aggregated individual obesity information to the level of 2,546 counties within the United States (i.e., percentage of participants with obesity per region). To ensure reliable regional estimates, we followed previous research and kept only regions with at least 50 participants, leading to a sample of 2,842,767 across 2,419 counties in our main analysis (but tried other cutoff values as well; see robustness checks later; differential Ns for each model are reported in Appendices A1 through A6 in the Supplemental Material available online; Stelter et al., 2022). We found that regions greatly differed in their obesity prevalence, ranging from obesity rates of just 5.78% in Pitkin County, Colorado, to rates as high as 50.98% in Jim Wells County, Texas. Additional reliability checks showed that regional obesity rates are relatively stable over time (2005–2008 vs. 2009–2013 obesity rates: r = .68 under a minimum regional sample size of 50 and r = .78 under a minimum regional sample size of 100). Figure 1 depicts the spatial distribution of obesity across the United States using a visualization approach based on distance weights (methodological details on distance-based weighting are reported in Appendix A7; Ebert, Mewes, et al., 2022). In short, this map highlights a belt of above average obesity rates spanning from the American Midwest into the American South and along parts of the Eastern coastline. By contrast, areas with below average obesity rates are primarily found in New England, Florida, and the Western United States.
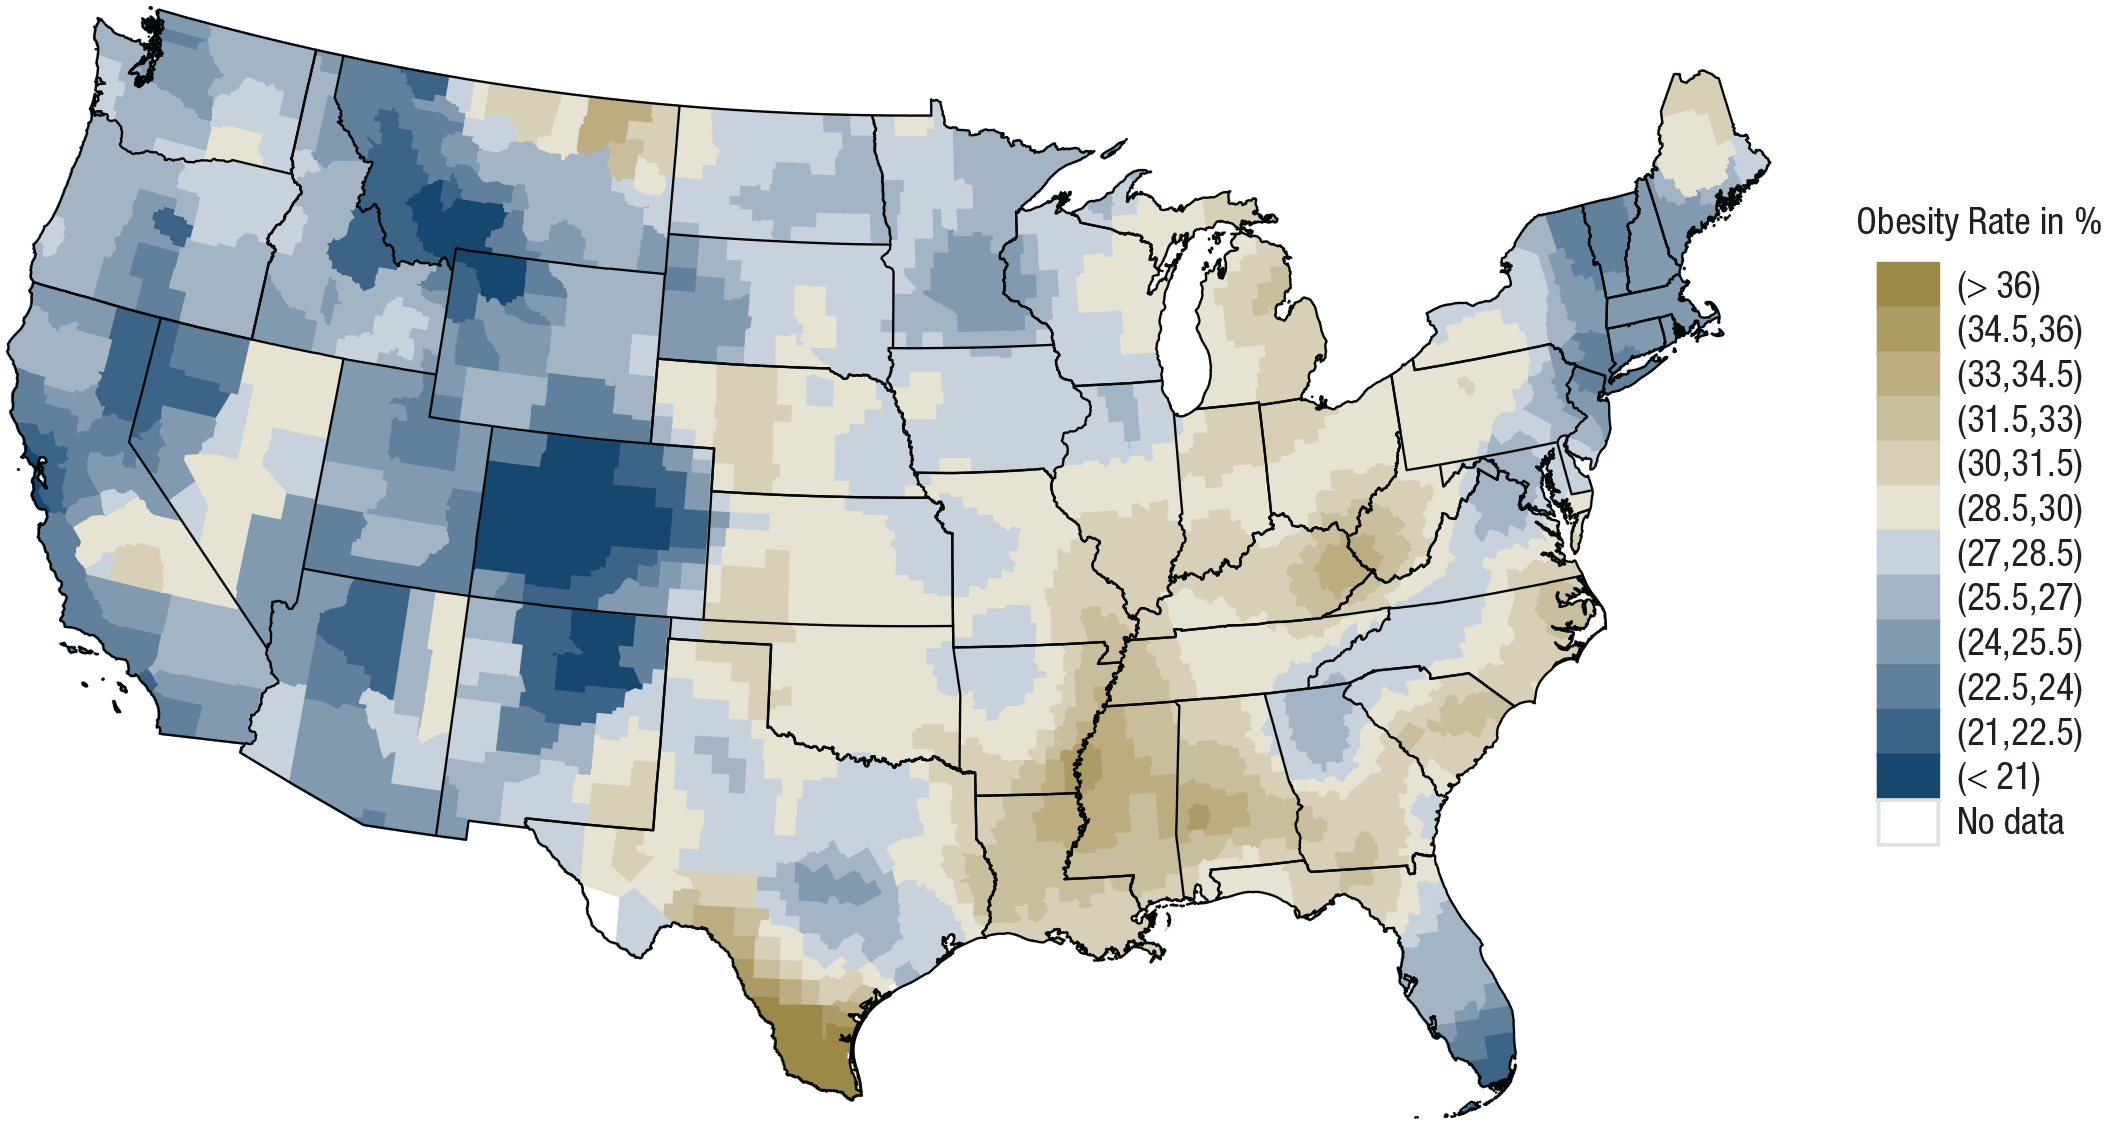
Spatial distribution of obesity in the BFRSS data. Brownish colors indicate above average obesity rates, and bluish colors indicate below average obesity rates. Black lines denote state borders. BFRSS = Behavioral Risk Factor Surveillance System.
Relationship, economic, and health indicators
Obesity has many well-established consequences. We sought to examine a diverse set of them from the domains of close relationships, economics, and health. In the close-relationship domain, we used an item indicating whether participants were currently in a romantic relationship (0) or single (1). To be sure, some people prefer singlehood over a romantic relationship (Brown, 2020), and for those people, our measure is not a measure of adversity. However, the number of such people is small enough that they bias our results very little (at best; Brown, 2020).
In the economic domain, a basic prerequisite for economic success is being integrated into the economic system through employment (Stavrova et al., 2014). To capture obesity`s economic consequences, we therefore used an item indicating whether people were currently employed, retired, a homemaker, and so on (0) or unemployed (1); we also used educational attainment as an alternative measure of economic status (see robustness checks later).
In the health domain, self-reported information on general health has been shown to reflect a person’s overall physical and psychological condition (Schafer & Ferraro, 2011). To capture obesity’s health consequences, we therefore used an item indicating whether people described their current general health as very good or excellent (0) or not (1); however, we also used alternative measures focusing on mental health (see robustness checks later; for exact operationalizations for all variables, see Appendices A8 and A9).
Analytic approach
For each binary criterion (i.e., singlehood, unemployment, suboptimal health), we ran generalized linear mixed-effects models, including random intercepts and random slopes. We standardized all variables except for obesity to obtain interpretable coefficients (Snijders & Bosker, 2012). We additionally group-mean centered individual-level criteria to ease the interpretation of the interaction graph (but the robustness checks, described later, include additional models without group-mean centering, and those models yielded conceptually identical results). Using this empirical setup, we performed two analytical steps. First, we sought to replicate previous research suggesting that obesity is generally associated with adverse relationship, economic, and health consequences. To do so, we fitted a model including the main effect of individual obesity only.
Second, we sought to test our hypothesis that the effect of obesity varies as a function of regional obesity prevalence (i.e., less severe consequences in regions with high obesity prevalence). To do so, we fitted a model specifying a cross-level interaction between individual and regional obesity (but the robustness checks, described later, also tested models with manifold individual and regional control variables). The overall sample size (i.e., 2,846,132 participants in 2,546 counties) greatly exceeded the recommended minimum thresholds for mixed-effects models and was large enough to reliably detect cross-level interactions (Arend & Schäfer, 2019).
Results
Main results
The first analytical step (i.e., a model with the main effect of obesity only) revealed that in the BFRSS data participants with obesity generally reported relationship, economic, and health disadvantages compared with participants without obesity. Specifically, participants with obesity were more likely to be single, b = 0.024, t(2516.78) = 13.974, p < .001, 95% confidence interval (CI) = [0.020, 0.027], unemployed, b = 0.051, t(2382.48) = 35.393, p < .001, 95% CI = [0.048, 0.053], and in suboptimal health, b = 0.384, t(2135.89) = 192.641, p < .001, 95% CI = [0.380, 0.388]. These findings closely replicate previous research suggesting that obesity is associated with adverse consequences in diverse life domains (Puhl & Heuer, 2009).
The second analytical step (i.e., cross-level interaction between individual and regional obesity) revealed that the just described adverse consequences varied across regions. Specifically, we found a significant positive cross-level interaction for all three outcomes (see Table 1). This suggests that obesity’s relationship, economic, and health disadvantages are smaller in regions with higher obesity rates.
Results of the Mixed-Effects Models of Study 1

Note: CI = confidence interval.
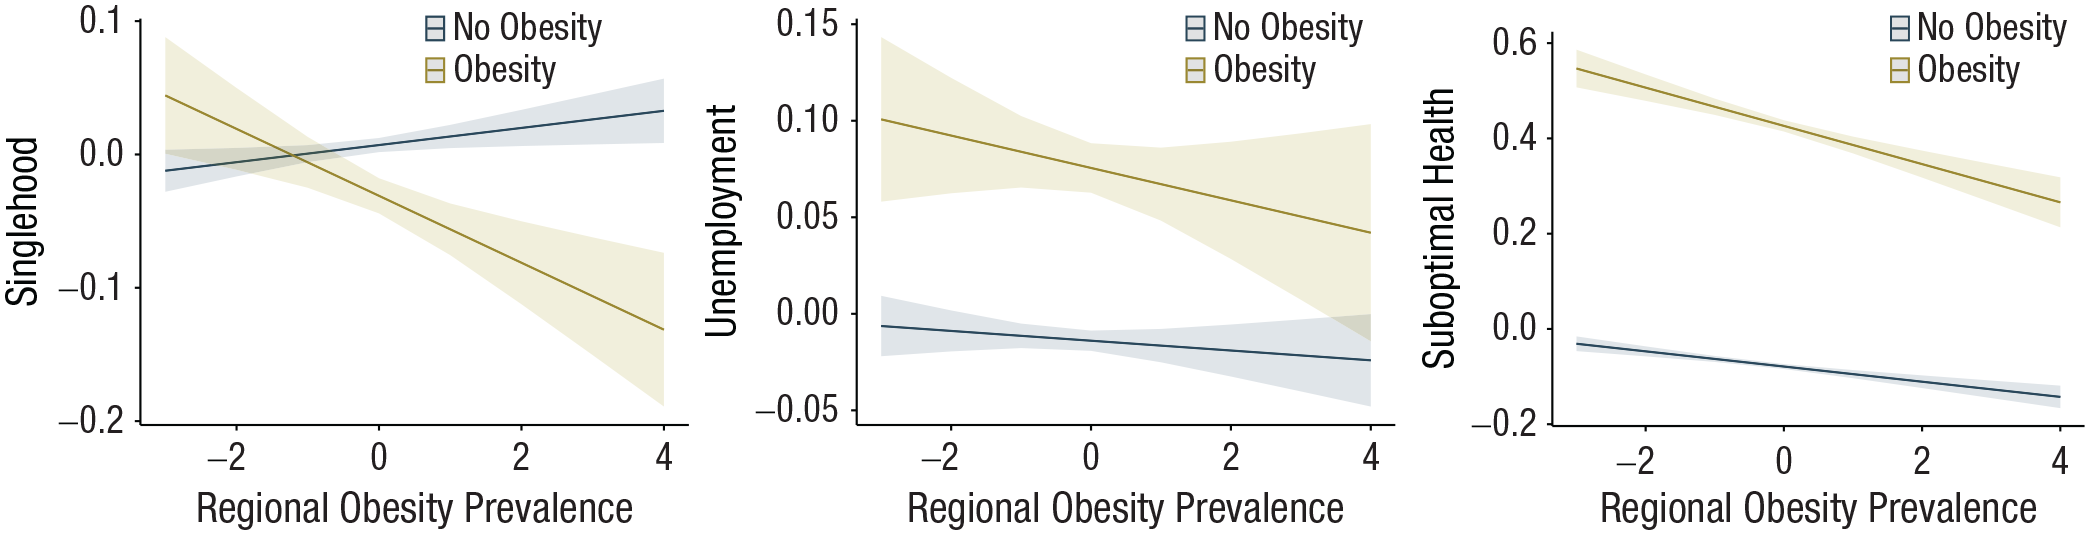
Figure 2 illustrates the size of these regionally varying effects. To further illustrate these effects’ real-world relevance, we estimated the likelihood for participants with and without obesity to report an adverse consequence in high-obese versus low-obese regions. For the relationship domain, in low-obese regions (i.e., minimum of obesity prevalence), participants with obesity were estimated to be 1.21 times more likely to be single than their nonobese counterparts (40.75% with obesity vs. 36.18% without obesity). This gap was absent in high-obese regions (i.e., the highest regional obesity prevalence). Here, participants with obesity were even slightly less prone to singlehood (47.13% with obesity vs. 49.32% without obesity). For the economic domain, participants with obesity were 1.51 times more likely to be unemployed in low-obese regions (6.52% with obesity vs. 4.42% without obesity) but were just as likely to be employed as participants without obesity in high-obese regions (4.73% with obesity vs. 4.72% without obesity). Finally, for the health domain, in low-obese regions, participants with obesity were 4.13 times more likely to report suboptimal health (46.64% with obesity vs. 17.45% without obesity). By contrast, in high-obese regions, participants with obesity were only 1.50 times more likely to report suboptimal health (74.01% with obesity vs. 65.53% without obesity). Evidently, even the health gap between participants with and without obesity was largely reduced in high-obese regions. It is important to note, however, that the health gap never was entirely absent, meaning that participants with obesity were always more prone to suboptimal health regardless of where they lived in the United States.
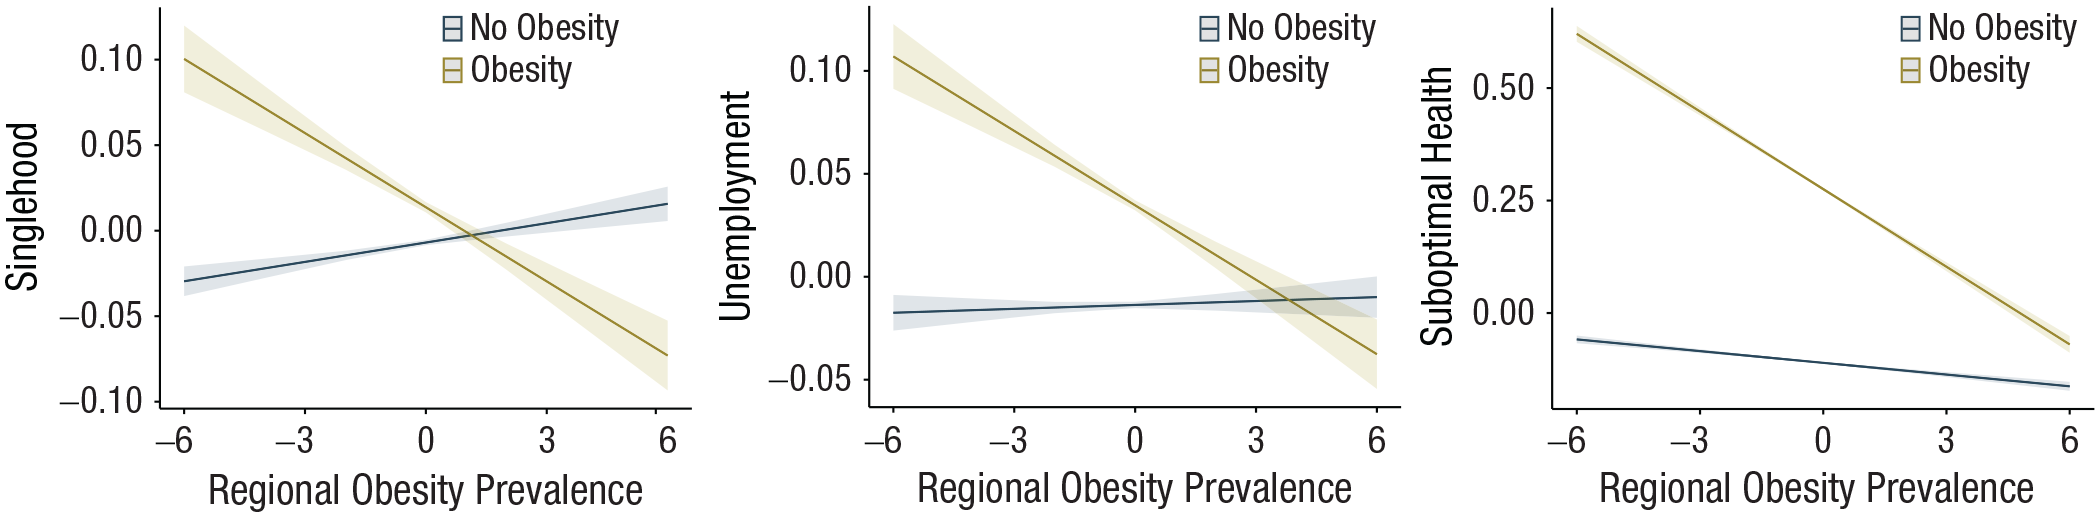
Results of the mixed effects models of Study 1. Marginal mean plots are depicted for the interaction effect between individual obesity and regional obesity prevalence. The x-axis indicates standardized obesity prevalence per county (i.e., mean obesity prevalence is 0), and the y-axis indicates the group-mean standardized probability of being single (left panel), being unemployed (middle panel), and reporting suboptimal general health (right panel). The lines indicate values for participants without obesity (dark blue line) and participants with obesity (yellow line).
Robustness checks
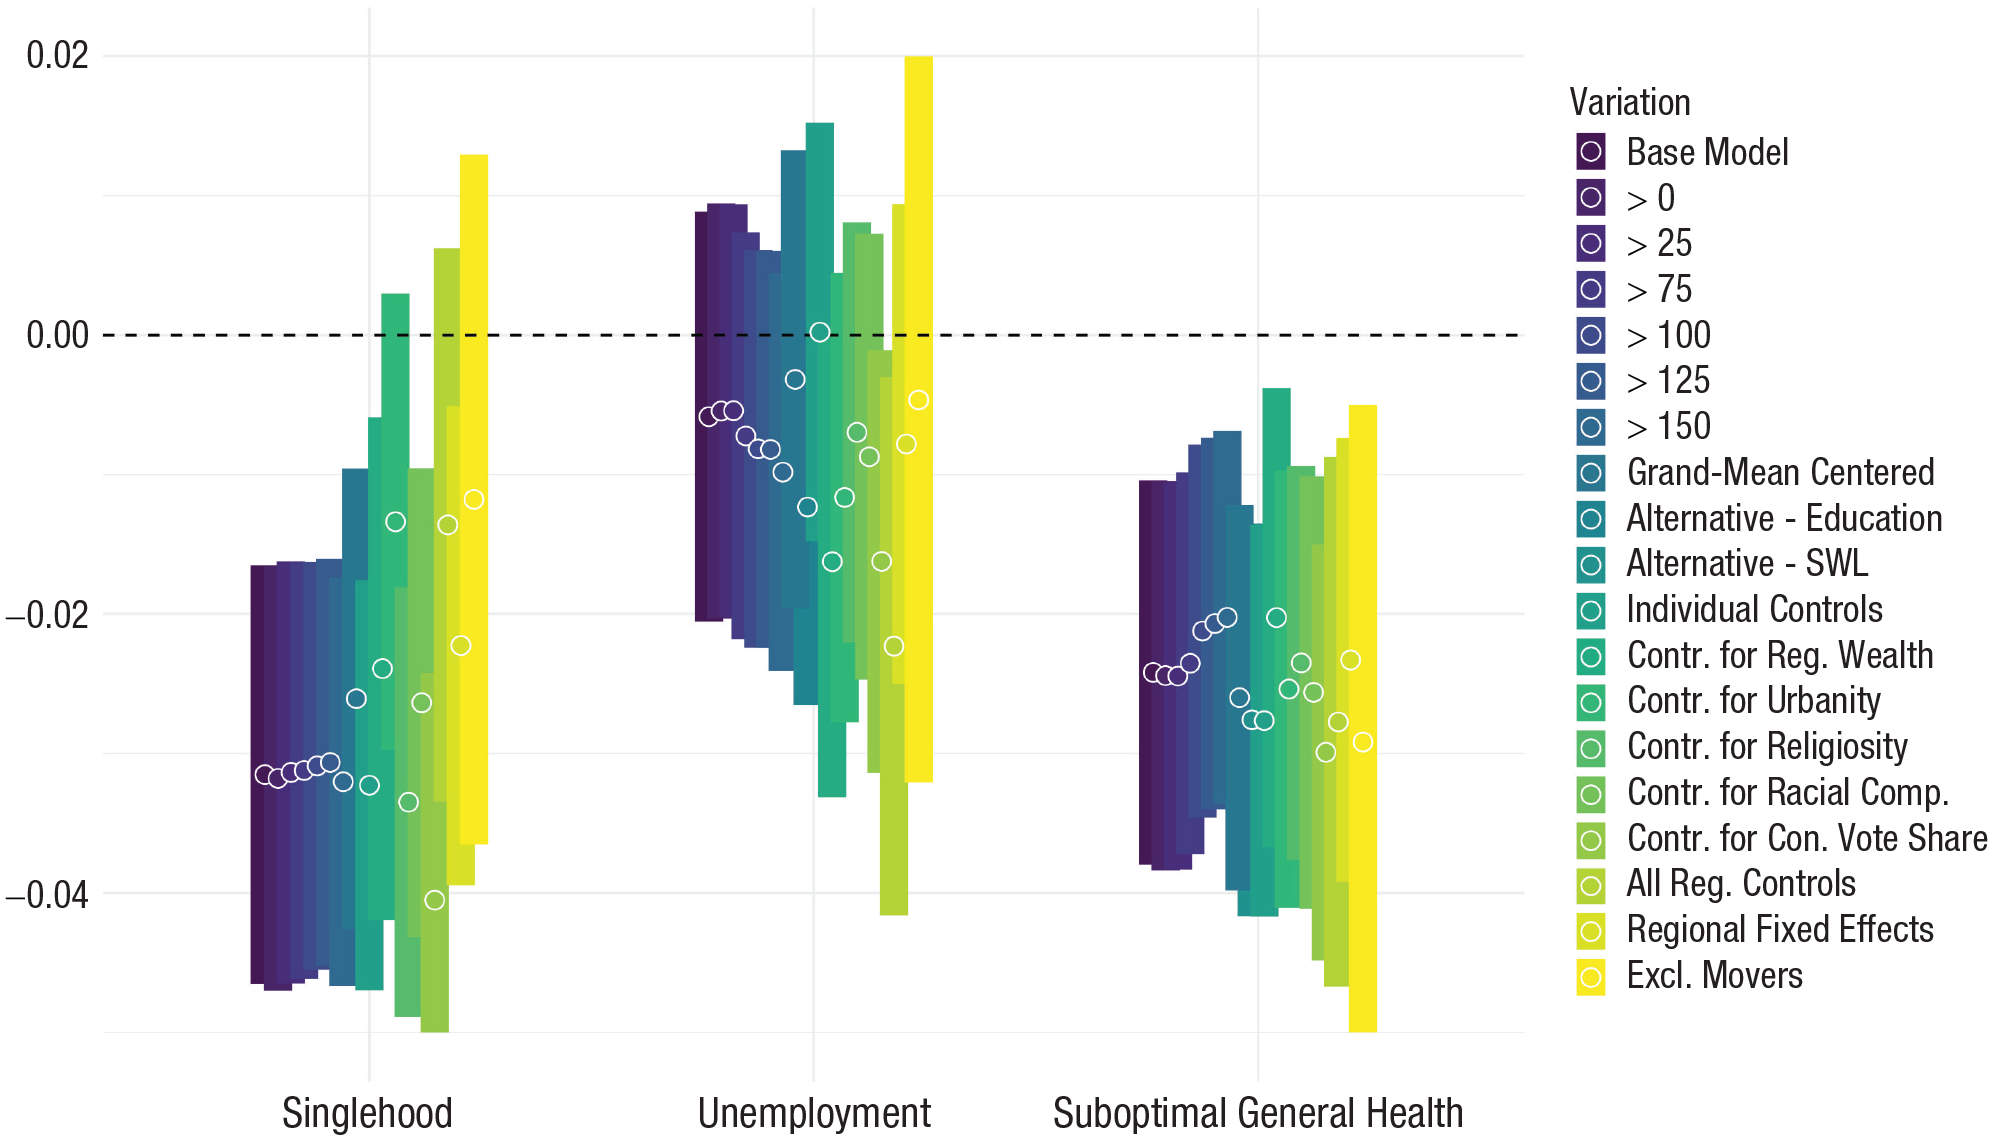
To scrutinize the robustness of our results, we ran 16 additional models for each outcome. For an overview of all used variables (including their operationalizations and sources), exact sample sizes for each model (they varied because of missing values on the included variables), as well as detailed results, see Appendices A1 through A19. First, we lowered the region-inclusion threshold to 1 and 25 participants (i.e., increasing geographical coverage at the cost of reduced measurement precision) and increased it to 75, 100, 125, and 150 participants (i.e., increasing measurement precision at the cost of reduced geographical coverage). Second, we tested whether the effects remained conceptually unchanged when using alternative indicators to capture economic and health outcomes (i.e., educational attainment and life satisfaction). Third, we repeated our analyses with grand-mean instead of group-mean standardized outcome variables. Fourth, we controlled for individual differences in age, gender, and race (all of which are known predictors of relationship status, economic outcomes, and health; Deeks et al., 2009). Similarly, in the analyses of one given criterion, we also controlled for “the other two” criteria (e.g., controlling for employment and health status when predicting relationship status). Fifth, we sought to examine whether our findings would indeed be tied to regional obesity and not some regional covariate. To do so, we followed previous cross-regional research (Ebert, Gebauer, et al., 2022) and accounted for differences in urbanity (i.e., population density), wealth (i.e., median income), religiosity (i.e., share of religious adherents), and racial composition (i.e., share of White residents). In addition, we also tested for ideological differences (i.e., vote share for the Republican party; for exact operationalizations for all variables, see Appendix A9). Sixth, we ensured that our findings were not driven by overlapping broader geographical differences. To do so, we ran a particularly conservative model that included state-fixed effects accounting for all variation at the state level. Figure 3 reveals that each of these robustness checks led to the same conceptual conclusions as did our main-text analyses. Thus, we found consistent evidence that the adverse consequences of obesity in the United States were strongest in low-obese regions and greatly reduced, absent even in many cases, in regions with high obesity prevalence. We also explored these effects across different classes of obesity severity. To do so, we distinguished between persons without obesity (BMI < 30), those with Class I obesity (BMI ≥ 30 and < 35), and those with Class II obesity or higher (BMI ≥ 35). For all three outcome domains (i.e., singlehood, unemployment, health), we found that the more severe a person’s obesity, the more benefits this person seemed to derive from living in high-obese regions. Appendix A20 provides graphical illustrations of the moderating effects across different obesity classes.
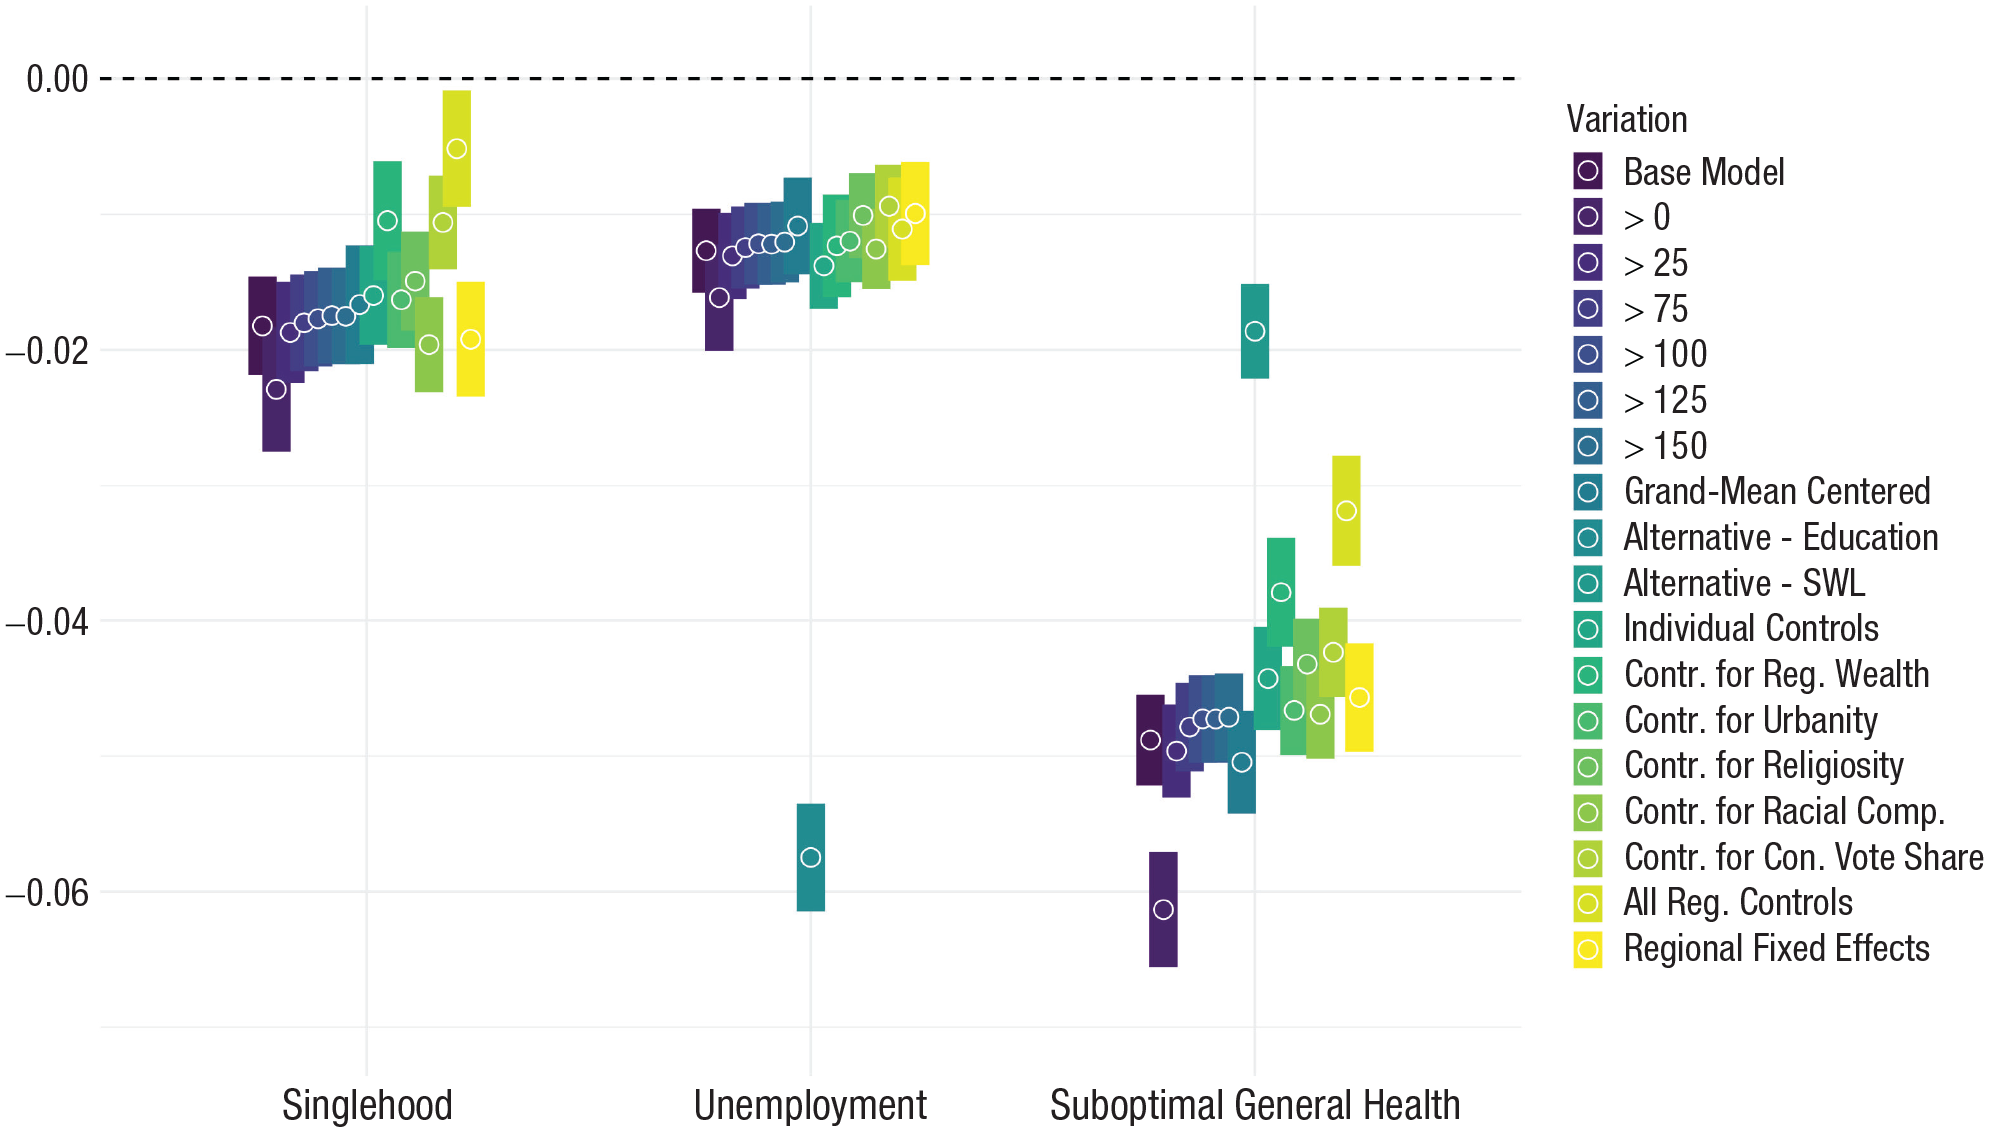
Cross-level interactions between individual obesity and regional obesity prevalence as a function of different model variations in the United States. Estimates and 95% confidence intervals are depicted for the Individual × Regional Obesity interaction on probability for singlehood (left), unemployment (middle), and suboptimal health (right) in the United States. Colors indicate model specifications. Sample sizes and full results are reported in Appendices A1 through A6 and A10 through A19 in the Supplemental Material.
Study 2: Contingency on Regional Obesity Prevalence in the United Kingdom
The United States is a large and diverse nation with generally high obesity rates. The nation’s size and diversity increase the likelihood that meaningful regional variation in obesity’s consequences can be detected. In the current study, we sought to examine whether regional variation in the consequences of obesity generalizes to different regions within other nations. Specifically, we sought to replicate our findings in the United Kingdom, which is also hit hard by the obesity epidemic. However, the United Kingdom is much smaller and culturally more homogeneous than the United States. Consequently, the variation in obesity rates within the United Kingdom is also smaller. In effect, then, this study afforded a conservative test of the generalizability of the results from Study 1.
Method
Participants
This study relied on data from the BBC Lab, a large-scale Internet-based survey comprising a total sample of 588,014 participants who completed the survey between 2009 and 2011 (out of which 502,495 were from the United Kingdom). The survey was conducted by the University of Cambridge (from where it also received ethical approval). It was advertised via the BBC on various websites, radio programs, and television shows (for more detailed survey information, see Rentfrow et al., 2015). We retained the data of all participants for whom all necessary information was available, resulting in a sample of 180,615 participants across 380 districts. Participants were between 16 and 90 years old (M = 32.89 years, SD = 12.42), and 67.97% were women.
Individual and regional obesity prevalence
As in Study 1, we operationalized obesity as a BMI of 30 or higher. Overall, 14.82% of all participants reported a BMI in the obesity range. According to the National Health Services (2010), about 25% of all British adults reported a BMI in the obesity range in 2008. Accordingly, the typical overrepresentation of young, female, and well-educated participants in our online survey (Gosling et al., 2004) came with an underrepresentation of participants with obesity. To measure regional obesity prevalence, we aggregated individual obesity information to the level of 380 local authority districts, which are akin to counties in the United States regarding size and administrative function. Again, we kept only regions with at least 50 participants, leading to a sample of 180,551 across 378 regions in our main analysis (but the robustness checks, described later, included analyses with other cutoff values, which reached conceptually identical conclusions; differential Ns for each model are reported in Appendices B1–B6 in the Supplemental Material; Stelter et al., 2022). Obesity rates ranged from just 5.94% in the City of London, England, to 31.11% in Blaenau Gwent, Wales. Thus, the prevalence of obesity differed substantially across the United Kingdom. However, the overall variation was smaller than in the United States (where regional obesity rates ranged from 5.78% to 50.98%). Figure 4 depicts the spatial distribution of obesity across the United Kingdom using distance-based weighting (Ebert, Mewes, et al., 2022). In short, this map highlights that areas with above average obesity rates are primarily found in the central and northern parts of the United Kingdom, with particularly high rates in Southern Wales. By contrast, areas with below average obesity rates are primarily found in the southern parts of the United Kingdom, with particularly low rates in and around London.
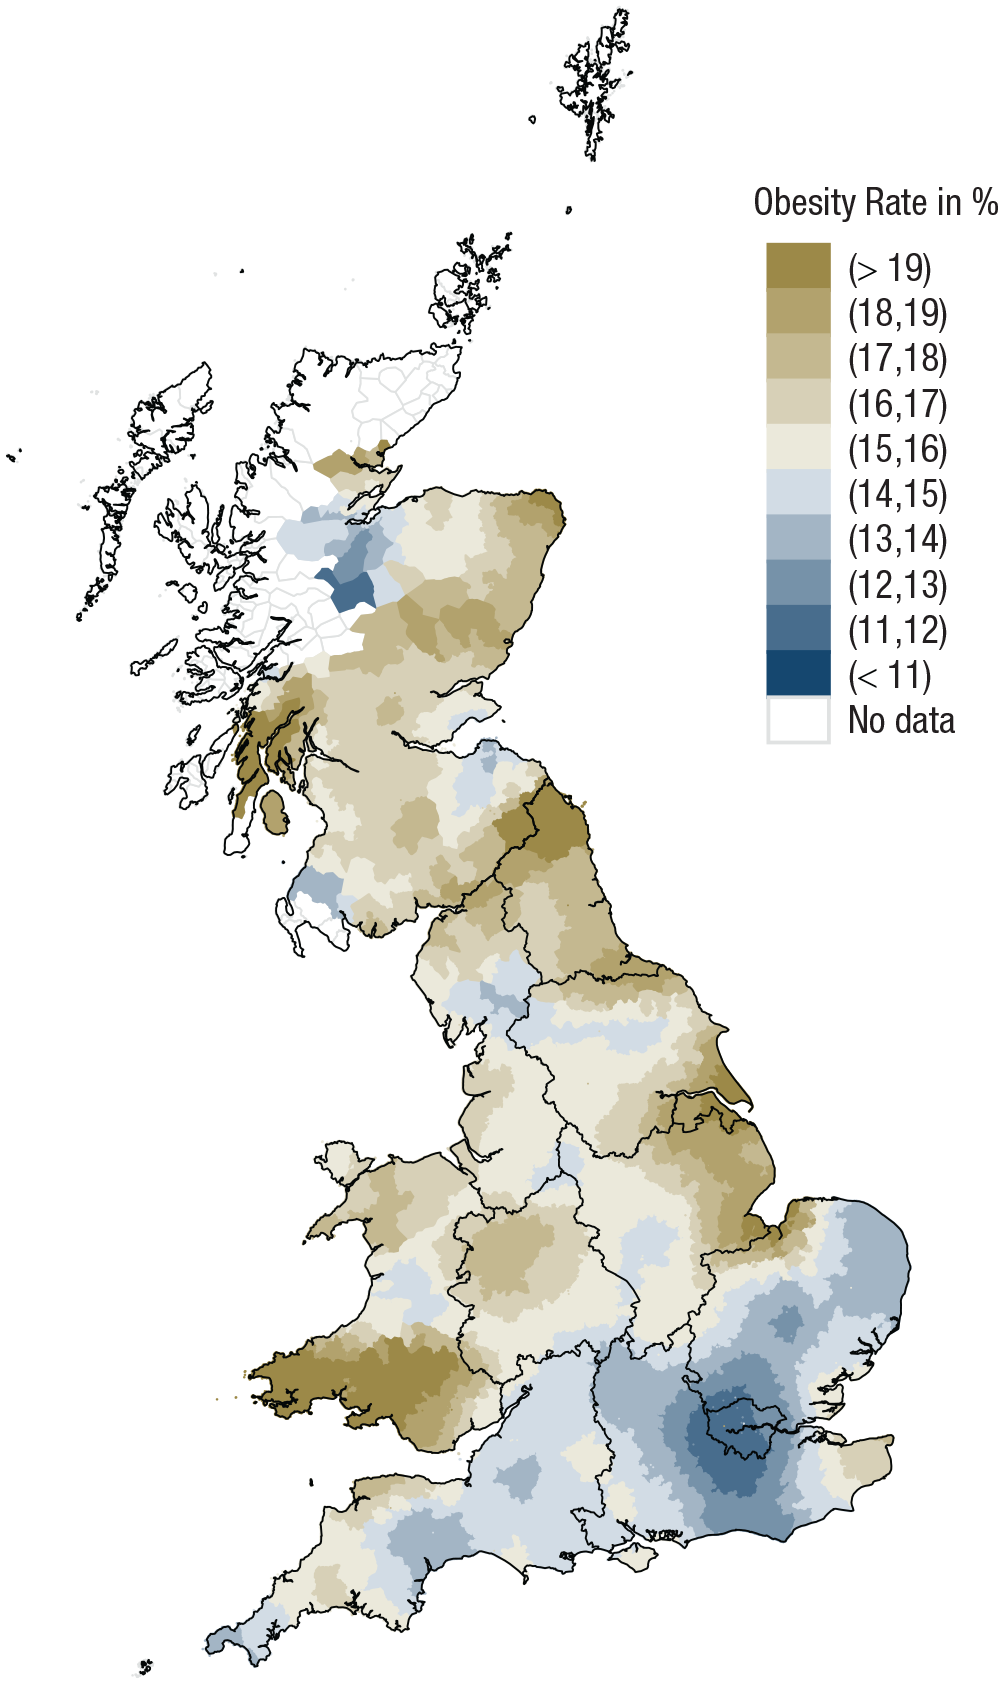
Spatial distribution of obesity in the BBC lab data. Brownish colors indicate above average obesity rates, and bluish colors indicate below average obesity rates. Black lines denote region borders.
Relationship, economic, and health indicators
We wanted our indicators of relationship, economic, and health status to be as parallel as possible to those used in Study 1. Hence, for the relationship domain, we distinguished individuals who were currently in an intimate relationship (0) versus single (1). For the economic domain, we distinguished between individuals who were currently employed, retired, a homemaker, and so on (1) versus unemployed (1); however, we also tested alternative economic indicators (see robustness checks later; for exact operationalizations for all variables, see Appendix A8). Finally, for the health domain, we differentiated between individuals who reported their general health to be very good to excellent (0) versus not (1); however, the robustness checks, described later, also used a measure of mental health as an alternative indicator and yielded conceptually identical results.
Analytic approach
We applied the same statistical modeling approach (i.e., three parallel generalized linear mixed-effects models with participants nested in regions) and analytical steps as in Study 1 (i.e., the main effect of obesity in Step 1 and the cross-level interaction with regional obesity prevalence in Step 2). Again, the sample (180,615 participants in 380 regions) exceeded the recommended minimum threshold for mixed-effects models and was large enough to reliably detect cross-level interactions (Arend & Schäfer, 2019).
Results
Main results
Step 1 of our analysis (i.e., the main effect of obesity only) revealed that participants with obesity did not have a higher likelihood for singlehood; to the contrary, they were overall more likely to be in a relationship, b = −0.036, t(386.25) = −4.89, p < .001, 95% CI = [−0.051, −0.022]. Accordingly, the BBC Lab data deviated from the common finding that participants with obesity face relationship disadvantages (but Step 2 of the analysis provided an explanation for why this is). Participants with obesity were more likely to be unemployed, b = 0.089, t(359.78) = 12.655, p < .001, 95% CI = [0.075, 0.103], and more likely to report suboptimal health, b = 0.50, t(180,549) = 76.970, p < .001, 95% CI = [0.489, 0.515], consistent with previous findings.
Step 2 of our analysis (i.e., cross-level interaction between individual and regional obesity prevalence) revealed that the associations between obesity and relationship status and general health varied across regions in the United Kingdom. Specifically, significant negative cross-level interactions indicated that the probability for participants with obesity to be single and of suboptimal health decreases with rising regional obesity prevalence (see Table 2, left and right columns). By contrast, although the cross-level interaction for unemployment went in the same direction, this effect was not statistically significant (see Table 2, middle panel).
Results of the Mixed-Effects Models of Study 2

Note: CI = confidence interval.
Figure 5 again illustrates the size of these interaction effects, and we again estimated their real-world relevance. For the relationship domain, in low-obese regions (i.e., minimum obesity prevalence), participants with obesity were estimated to be 1.11 times more likely to be single than their nonobese counterparts (36.19% with obesity vs. 33.86% without obesity). By contrast, in high-obese regions (i.e., maximum obesity prevalence), this effect reversed, and participants with obesity were even less prone to singlehood (29.34% with obesity vs. 33.85% without obesity). Of note, this strong moderation may explain the reversed main effect in Step 1 of our analyses: Obesity’s main effect lumps together deviating effects from high- and low-obese regions, leading to an overall reverse effect of obesity (i.e., participants with obesity were overall less likely to be single). Because the cross-level interaction for unemployment was nonsignificant, the discrepancy between participants with and without obesity was comparable between low- and high-obese regions (low-obese region: 6.00% with obesity vs. 3.67% without obesity; high-obese region: 7.53% with obesity vs. 5.48% without obesity). For the health domain, participants with obesity were 3.21 times more likely to report suboptimal health in low-obese regions (64.66% with obesity vs. 36.31% without obesity). In high-obese regions, participants with obesity were only 2.29 times more likely to report suboptimal health (67.65% with obesity vs. 47.72% without obesity). Thus, the pattern of health consequences replicated the findings from the United States: Although the region in which people live may attenuate health disparities between individuals with and without obesity, participants with obesity were still more prone to suboptimal health regardless of where they lived in the United Kingdom.
Results of the mixed effects models of Study 2. Marginal means plots are depicted for the interaction effect between individual obesity and regional obesity prevalence. The x-axis indicates standardized obesity prevalence per district (i.e., mean obesity prevalence is 0), and the y-axis indicates the group-mean standardized probability of being single (left panel), being unemployed (middle panel), and reporting suboptimal general health (right panel). The lines indicate values for participants without obesity (dark blue line) and participants with obesity (yellow line).
Robustness checks
We applied the same robustness checks as in Study 1 and one additional robustness check that led to 17 additional models for each outcome (for detailed results, see Appendices B1–B17; for operationalizations and sources, see Appendices A8 and A9). Specifically, we tested varying inclusion thresholds, used alternative indicators and centering, and accounted for individual and regional controls as well as region-fixed effects (across 12 regions that are akin to U.S. states in size). Importantly, the BBC Lab data also provide information on where people grew up. We used this information to rule out that geographical self-selection (i.e., specific individuals selecting themselves into high- vs. low-obese regions) was driving our effects. To do so, we repeated our analysis using only people who had not moved (i.e., reported living in the same postcode district as they grew up in). Figure 6 depicts the cross-level interaction effect between individual and regional obesity prevalence for each robustness check. The additional results underline the robustness of the finding that the association between obesity and health varied as a function of regional obesity prevalence, with the effect remaining significant in all model specifications. They also largely support the robustness of the finding that the association between obesity and singlehood varied as a function of regional obesity prevalence, with the effect remaining significant across most model specifications. However, the results also show that overlapping cultural indicators may have partly driven the effect of regional obesity prevalence. Specifically, when accounting for the interaction between regional racial composition or urbanity with individual obesity, the interaction with regional obesity prevalence diminished in size and no longer reached statistical significance. Similarly, reducing the sample to participants who did not move (i.e., from 180,551 to 58,406) diminished the size of the interaction effect such that it did not reach significance. The additional models confirmed our result that—in the United Kingdom—obesity’s economic consequences did not vary as a function of regional obesity prevalence. We again explored the effects across different classes of obesity (i.e., nonobese, Class I, or Class II or higher). For singlehood and unemployment, we again found that the moderating effect increased with obesity severity. For general health, by contrast, the moderating effect decreased with higher obesity severity. Appendix B18 provides graphical illustrations of the moderating effects across different obesity categories.
Cross-level interactions between individual obesity and regional obesity prevalence as a function of different model variations in the United Kingdom. Estimates and 95% confidence intervals are depicted for the Individual × Regional Obesity interaction on probability for singlehood (left), unemployment (middle), and suboptimal health (right) in the United Kingdom. Colors indicate model specifications. Sample sizes and full results are reported in Appendices B1 through B17 in the Supplemental Material.
Taken together, in the United Kingdom, regional differences in obesity were much less pronounced (25 percentage points) than in the United States (45 percentage points), which renders Study 2 a conservative replication of Study 1. The results support the person-culture match perspective: Relationship and health disparities between participants with and without obesity varied within the United Kingdom. Rather, they varied across regions, with the largest disparities emerging in regions in which obesity prevalence was low. However, we did not find a moderating effect in the economic domain. A possible post hoc explanation is the unrepresentative sampling in our BBC Lab data. By undersampling both unemployment and obesity, the number of participants with obesity who were unemployed was very low (i.e., only 1% of participants were unemployed and reported a BMI in the obesity range).
Study 3: Weight Bias as a Mediator
Studies 1 and 2 offered converging evidence that obesity’s adverse consequences were reduced in regions with high obesity prevalence. We expected those effects because we assumed that there would be lower weight bias in high-obese regions, with the lower bias accounting for the less severe consequences of obesity. We expected lower bias in high-obese regions for the following reasons. In regions with high obesity prevalence, obesity does not violate social norms and should therefore be less stigmatized. If that were true, lower weight bias should, at least partially, account for (i.e., mediate) the less severe consequences of obesity in high-obese regions. In the current study, we tested this logic empirically.
Method
Participants
To test regional weight bias as a mediator, we combined (a) the data from Study 1 (representative BFRSS data) with (b) large-scale data on regional weight bias retrieved from Project Implicit (Xu et al., 2022). The Project Implicit data sets provide weight-bias data for the years 2004 to 2021. To align these data with the years included in the BRFSS data, we included data from all participants between 2005 and 2013 for whom geographic information and weight bias were reported. This alignment led to an interim sample of 612,196 participants from 3,008 counties. Previous research on regional bias usually excluded participants who self-categorized as members of the stigmatized group to better estimate the regional bias (Jimenez et al., 2022; Stelter et al., 2022). We therefore excluded participants who reported being “very overweight,” which led to a sample of 409,763 participants from 2,928 counties (but also tested models without excluding overweight participants and reached conceptually identical conclusions; see robustness checks later; differential Ns for each model are reported in Appendices C2–C5 in the Supplemental Material).
Regional weight bias
To measure regional weight bias, we used self-reported information on whether people prefer individuals without obesity to individuals with obesity (scale ranging from “I strongly prefer fat people to thin people” to “I strongly prefer thin people to fat people”). The scale points varied between different versions of the item with a 5-point scale for the years 2005 and 2006 and a 7-point scale for the years 2006 to 2013. We recoded the data such that it consistently ranged from −3 to +3 across all survey years, with lower values indicating lower weight bias. In additional robustness checks, we also used information based on a feelings thermometer (i.e., how warmly participants felt toward individuals with/without obesity; Hehman et al., 2018). We aggregated weight bias to the regional level (Hehman et al., 2019), again retaining only regions with at least 50 participants, leading to a sample of 382,403 participants across 889 counties in our main analysis (but the robustness checks, described later, also tested alternative cutoffs). We found that weight bias varied substantially across regions, consistent with previous studies (Calanchini et al., 2022; Hehman et al., 2021). Specifically, regional estimates ranged from 0.624 in Sumter County, South Carolina, to 1.731 in Lexington, Virginia (0 = no weight bias; 3 = maximal weight bias). Figure 7 depicts the spatial distribution of weight bias across the United States using distance-based weighting (Ebert, Mewes, et al., 2022). The map reveals that areas with above average weight bias are primarily found in the western parts of the United States and a belt spanning from the Midwest and the Appalachian region into New England. By contrast, areas with below average weight bias are primarily found in the southern, central, and northern parts of the United States. Thus, the spatial distribution of weight bias is partly the inverse of the distribution of obesity rates (i.e., high weight-bias regions tend to be those with low obesity prevalence; see Figure 1). Testing this reverse association more objectively, we found a negative correlation between regional weight bias and regional obesity prevalence, r = −.27, p < .001, 95% CI = [−.30, −.23].
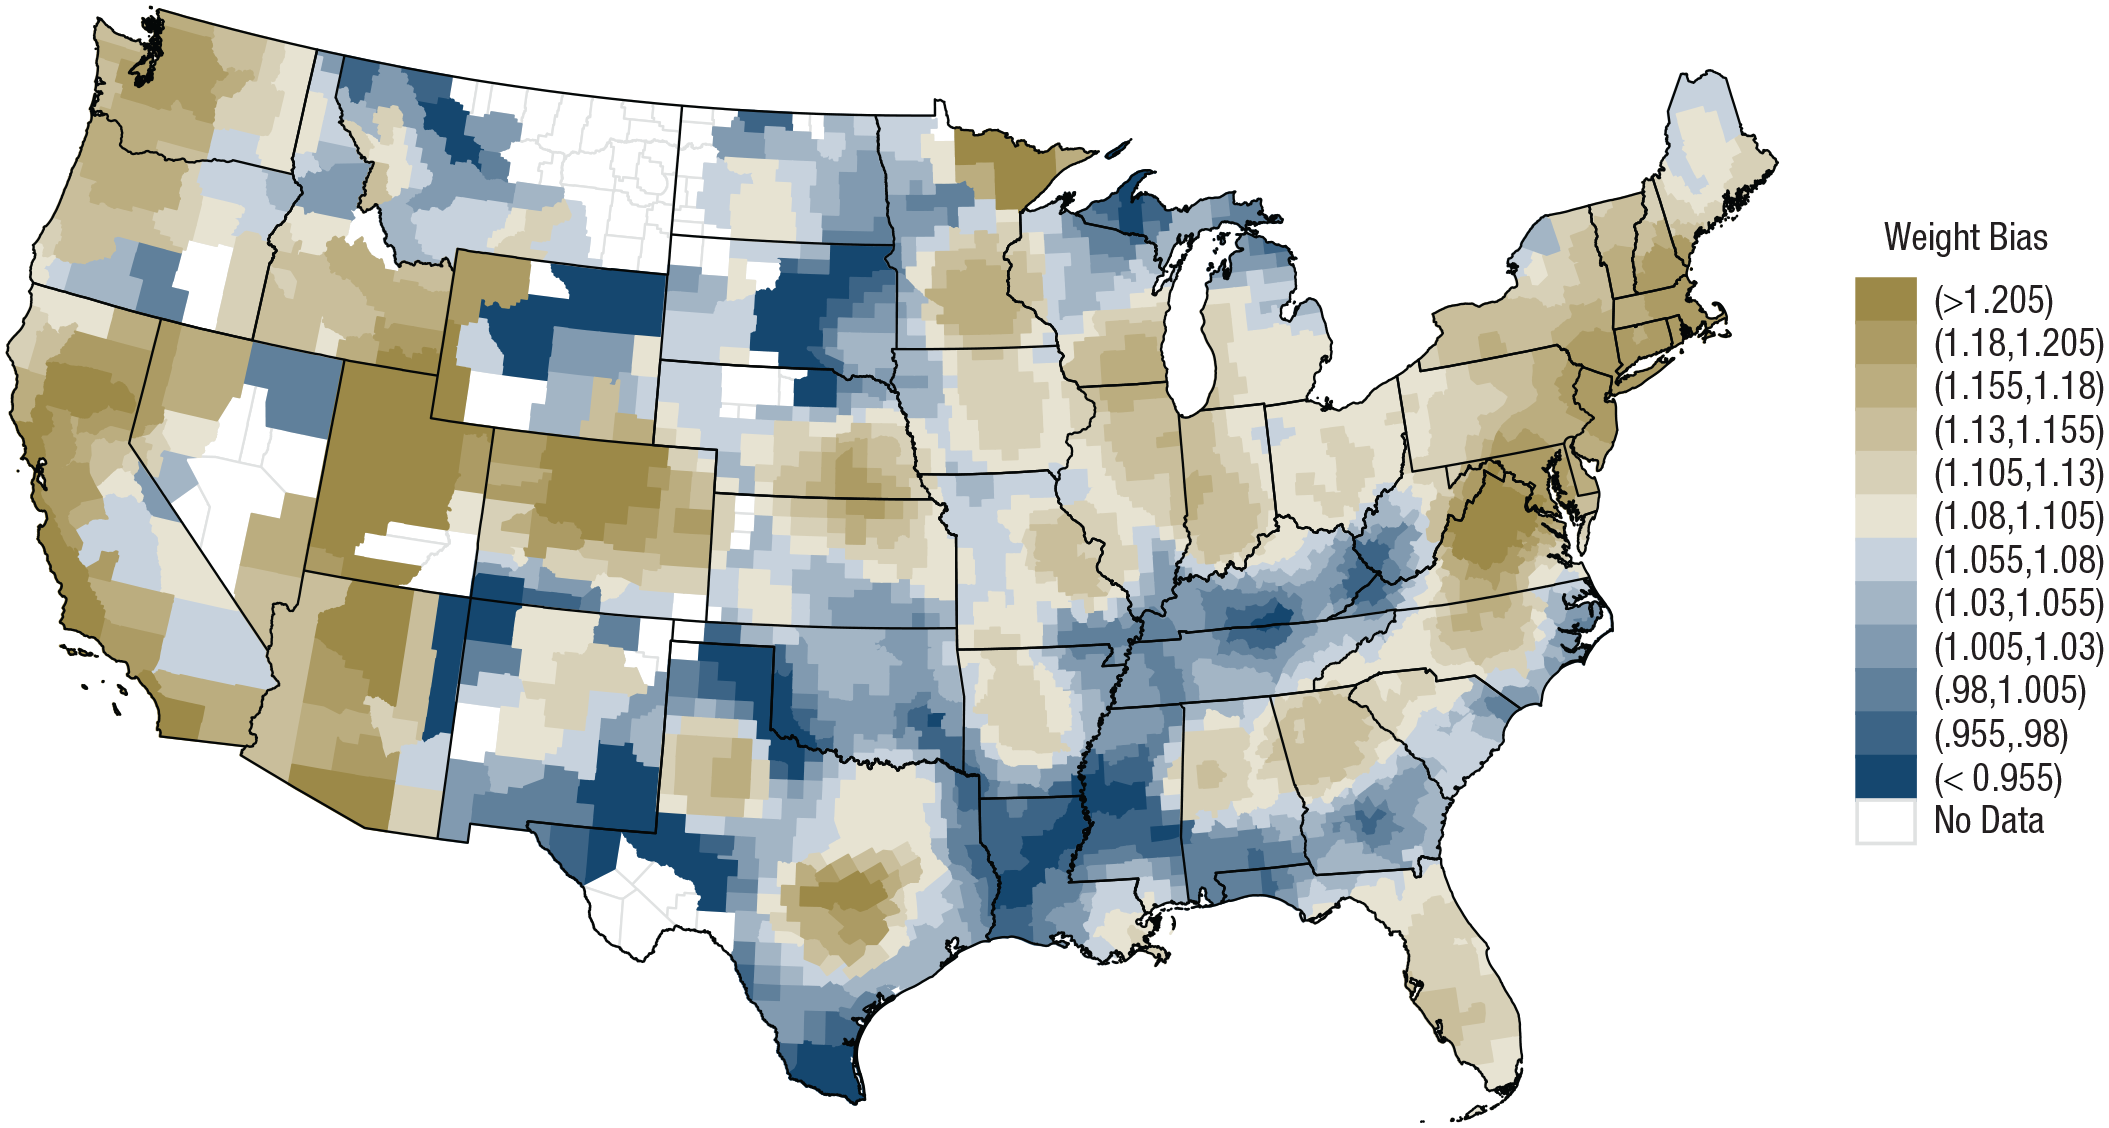
Spatial distribution of weight bias in the project implicit data. Brownish colors indicate above average weight bias, and bluish colors indicate below average weight bias.
Project Implicit also provides information on implicit weight bias based on the implicit association test (IAT). In the IAT, weight bias is measured as faster responses and fewer errors when pairing thin (fat) silhouettes with good (bad) features. However, regional obesity prevalence was very weakly associated with regional implicit weight bias, r = −.06, 95% CI = [−.10, −.02] (see Appendix C1), which is why we did not further explore implicit weight bias as a potential mediator.
Analytic approach
We used the same analytical framework as in Study 1 (i.e., mixed-effects models with individuals nested in regions). To test our hypothesis (i.e., regional weight bias accounting for the buffering effects of regional obesity prevalence), we ran a mediated moderation model. This model examined whether the individual Obesity × Regional Obesity interaction is mediated by the individual Obesity × Regional Weight Bias interaction (Berkessel et al., 2021).
Results
Main results
We ran one model for each outcome and found that weight bias significantly mediated the buffering effects of regional obesity prevalence in the relationship domain—indirect moderation: b = −0.008, 95% CI = [−0.010, −0.006]—and health domain—indirect moderation: b = −0.007, 95% CI = [−0.009, −0.005]. Specifically, regional weight bias mediated 70.8% of the previously found cross-level interaction for singlehood and 16.0% for suboptimal health. In other words, the fact that individuals with obesity were less prone to singlehood and suboptimal health in high-obese regions was (partially) mediated through lower weight bias in these regions. By contrast, we did not find a mediation through regional weight bias for unemployment—indirect moderation: b = −0.001, 95% CI = [−0.003, 0.001].
Robustness checks
Parallel to Studies 1 and 2, the robustness of the results (17 models per outcome) was scrutinized against varying inclusion thresholds, alternative economic and health indicators, individual and regional controls, and state-fixed effects (for detailed results, see Appendices C2–C5). We additionally report results without excluding participants who reported being very overweight and when using a feelings thermometer as an alternative weight-bias measure. Figure 8 depicts the results of these additional models, showing that they fully confirm the main-analysis results (i.e., significant mediation on relationship and health outcomes but no consistent mediation on unemployment outcomes).
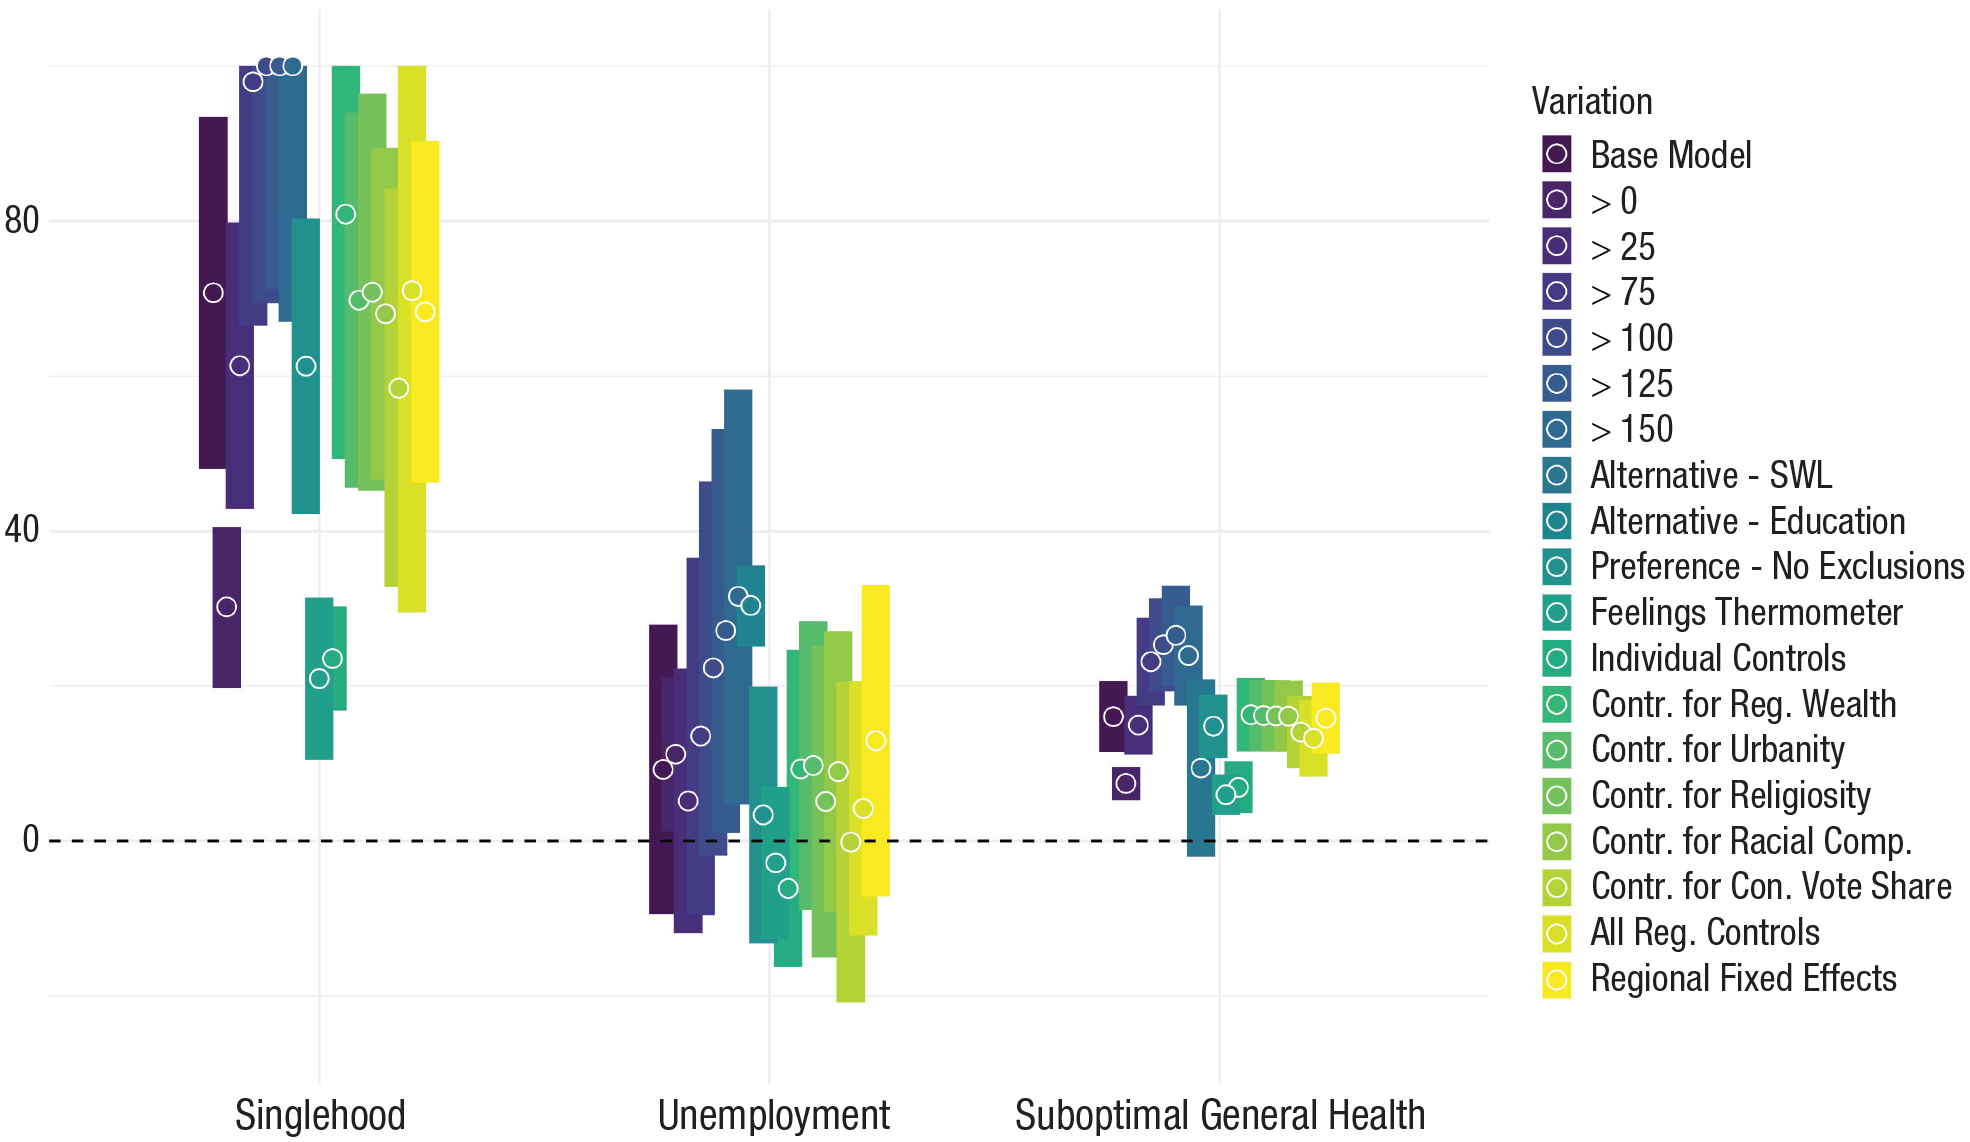
Percentage of the moderation mediated as a function of different model variations in the United States. Estimates and 95% confidence intervals are depicted for the Individual × Regional Obesity interaction that is mediated by regional weight bias on probability for singlehood (left), unemployment (middle), and suboptimal health (right) in the United States. Colors indicate model specifications. Sample sizes and full results are reported in Appendices C2 through C5 in the Supplemental Material.
Study 3 provides evidence that high-obese regions are characterized by lower weight bias. This lower weight bias, in turn, (partially) mediates the finding that individuals with obesity were less prone to singlehood and suboptimal health in high-obese regions. Consequently, weight bias (as hypothesized) indeed forms an important mediator in understanding why obesity’s adverse consequences vary across regions. Notably, although weight bias emerged as a full mediator in the relationship domain, weight bias emerged as a partial mediator in the health domain, and it emerged as no consistent mediator in the economic domain. What this suggests is that weight bias is not the only mediator that can explain why the adverse effects of obesity are reduced in obese regions. We elaborate on two other candidate mediators in the General Discussion section below.
General Discussion
We used psychological theory and large-scale data to shed light on one of the most pressing health risks of modern times: obesity. By combining three large-scale data sources, we created a unique empirical setting with an overall level of diversity that is exceptional in psychological research. On the basis of these data, we first replicated previous research: We found that individuals with obesity were—on average—more prone to singlehood (United States), unemployment (United States and the United Kingdom), and suboptimal health (United States and the United Kingdom). More importantly, we went beyond previous research, showing that these effects varied across regions (Wadsworth & Pendergast, 2014). Supporting a person-culture match perspective, in both the United States and the United Kingdom, individuals with obesity faced fewer adverse consequences if they lived in a region in which many other individuals were also living with obesity.
Turning toward our mediation analyses, our results suggest that the buffering effect of regional obesity prevalence was partially due to lower weight bias in high-obese regions. We argue that weight bias, a negative stereotype about individuals with obesity, can translate into prejudice and overt discrimination (Puhl & Heuer, 2009). Such prejudice and discrimination, in turn, may ultimately lead to adverse consequences in the relationship domain (e.g., social exclusion; Puhl & Brownell, 2006), in the economic domain (e.g., negative hiring decisions; Agerström & Rooth, 2011), and in the health domain (e.g., poor psychological health, Emmer et al., 2020).
Importantly, our findings also highlight that the relevance of regional weight bias varies between outcomes. Regional weight bias was able to explain almost in full why individuals with obesity face fewer relationship disadvantages in high-obese regions. However, weight bias was only able to partially account for effects in the health domain and did not account at all for the effects in the economic domain. One possible post hoc explanation for the discovered differences across outcome domains is the following: Employment decisions (unlike relationship decisions that are highly subjective; Eastwick et al., 2014) are more driven by objective qualifications (such as cognitive skills and achievements; Kuncel & Hezlett, 2010) and may therefore be less strongly affected by weight bias.
This divergence between different life domains may also suggest that there are additional mediating variables through which regional obesity prevalence elicits its effects. At least two potential mediators may warrant future investigation. First, an alternative mediating variable (particularly in the health domain) may be social comparisons (Suls & Wheeler, 2000). Specifically, most Western cultures perpetuate the idea that a slimmer body is more desirable. Individuals with obesity may therefore engage in more unfavorable social comparisons with individuals without obesity, increasing negative affect and lowering self-esteem (Emmer et al., 2020; Suls & Wheeler, 2000). Importantly, in high-obese regions, there are fewer opportunities for unfavorable social comparisons (Wadsworth & Pendergast, 2014), which may curtail obesity’s negative mental health consequences. In a similar vein, social comparisons may also affect people when reporting on their health. Specifically, when obesity is common (such as in high-obese regions), people may view obesity as less indicative of lower health. Such a differential inclusion of obesity in one’s health judgment could weaken the link between obesity and self-rated health in high-obese regions. Second, an alternative mediating variable (particularly in the economic domain) may be structural misfit (Brewis et al., 2017). Specifically, individuals with obesity regularly face structural burdens, such as chairs that are too small, seatbelts that do not fit their bodies, and buildings that are inaccessible because of stairs. For individuals with obesity, these frequent reminders of their misfit can come with social exclusion (Thomas et al., 2008). In high-obese contexts, relevant structures may already be geared toward individuals with obesity, which may make life easier for individuals with obesity.
Finally, we also observed divergent results for implicit and explicit regional weight bias (with explicit regional weight bias being negatively related and implicit weight bias being unrelated to regional weight bias). This divergence underscores that explicit and implicit regional bias are different constructs: Explicit regional bias reflects the openly communicated cultural bias in a region, whereas implicit regional bias reflects the mental accessibility and nonverbalized aspects of cultural bias (Calanchini et al., 2022; Payne et al., 2017). Following this logic, our results suggest that living among many individuals with obesity comes with lower openly communicated weight bias but not with a lower mental availability of weight bias.
Limitations
Naturally, our work is not free of limitations. The following four issues should be addressed in future research. First, we studied two nations for which adequate cross-regional data were available, but both are Western, educated, industrialized, rich, and democratic (WEIRD) nations (Henrich et al., 2010). This is a limitation because the perception and stigma around obesity may be different in other nations (Marini et al., 2013)—whether the basic assumptions of our research (e.g., that weight bias is higher in low-obese contexts) hold equally in non-WEIRD nations is an open question. As such, it remains to be seen whether our findings will generalize to non-WEIRD nations (Essien et al., 2021).
Second, it should be noted that the Project Implicit data are based on self-selected participants and are not representative of the U.S. population. The data are skewed toward liberal participants (Essien et al., 2021), and many conservative, high-obese areas featured insufficient data to estimate regional bias (which may have led to an underestimation of the power of weight bias in our analyses because of the reduced regional variance).
Third, weight bias comes with high levels of self-stigmatization (Essien et al., 2021). Thus, people with obesity may not only be confronted with higher bias by others in low-obese regions but may also show higher self-stigmatization (i.e., internalize weight stigma more). Our data did not allow us to disentangle these effects, leaving it an important task for future research to clarify the role of stigmatization by others versus self.
Finally, because of the cross-sectional nature of our data, we cannot make any strong causal claims. By repeating our analyses on a sample of people who had not moved (see Study 2 robustness checks), we limited concerns that geographical self-selection had driven our results. However, we cannot rule out reverse causality. Specifically, we assume here that obesity is the driver of the studied adverse consequence (a perspective also backed up by previous causal research designs; Ball et al., 2004). However, some previous research suggested that the link between obesity and relationship, economic, and health outcomes may be bidirectional (e.g., persons are not economically disadvantaged because they live with obesity but are living with obesity as a result of their economically disadvantaged situation; Cohen et al., 2013; Wolfe, 2022). Likewise, we have assumed that a reduction in regional weight bias leads to less severe consequences of obesity. However, it may also be the other way around: In areas in which obesity has been less consequential, people may observe less contingencies between obesity and adverse outcomes and thus form less weight bias (Payne et al., 2017).
Implications
Despite these limitations, our results consistently suggest that obesity’s adverse consequences vary across regions. This finding has far-reaching scientific and societal implications. From a scientific perspective, our work provides at least three contributions. First, there is a dearth of research on the regionally varying effects of obesity (for an important, early exception, see Wadsworth & Pendergast, 2014). The current research provides a step forward by (a) showcasing that obesity’s adverse consequences vary as a function of regional obesity prevalence and (b) identifying weight bias as an important mediator driving this regional variation (while, at the same time, pointing toward other potential mediators). It is important to note that although obesity’s adverse relationship and economic consequences are completely diminished (or even reversed) in high-obese contexts, this is not the case for obesity’s adverse health consequences. Specifically, the health disparity between individuals with and without obesity is reduced but still substantial in high-obese contexts. In other words, individuals with obesity are always more prone to suboptimal health, which stresses that obesity prevention should be the top goal. Second, our findings suggest that previous research may have even underestimated how severe the effects of obesity can be in certain contexts. That is because previous research has not differentiated between regions and has thus lumped together the severe effects in low-obese contexts with the weaker (or even absent) effects in high-obese contexts. Third, our findings add to research on the person-culture match effect (Fulmer et al., 2010). Previous research on this effect has focused on intrapsychic attributes such as religiosity or political ideology (Ebert et al., 2020, 2023; Gebauer et al., 2012). Here, we demonstrate that person-culture match effects also exist for more physical attributes (such as obesity), which underscores the role of person-culture match as a pervasive phenomenon.
From a societal perspective, our work also provides at least three contributions. First and foremost, obesity is one of the most widespread diseases in modern times. Our findings highlight that the well-known adverse consequences of obesity are partly socially constructed and thus not inevitable. Second, our research may inform health policymakers about the different challenges individuals with obesity might face in different regions. To illustrate, in low-obese regions, individuals with obesity suffer disadvantages in various life domains. Accordingly, a major focus in low-obese regions might be to reduce weight bias and help individuals with obesity cope with the weight bias they are confronted with. By contrast, although weight bias is lower in high-obese regions, obesity still comes with severe negative health consequences. Accordingly, a major focus in high-obese regions may be to clarify obesity’s health risks. Third, our findings strongly suggest the media’s responsibility in presenting true-to-life variations in body shapes. Our research shows that high obesity prevalence came with lower weight bias, which in turn was associated with reduced adverse consequences of obesity. Previous research has shown that including larger bodied individuals in social media can reduce weight bias (Cha et al., 2022). Consequently, portraying individuals with obesity in the media may reduce weight bias and eventually curtail obesity’s adverse consequences.
Supplemental Material
sj-docx-1-pss-10.1177_09567976241265037 – Supplemental material for On the Unequal Burden of Obesity: Obesity’s Adverse Consequences Are Contingent on Regional Obesity Prevalence
Supplemental material, sj-docx-1-pss-10.1177_09567976241265037 for On the Unequal Burden of Obesity: Obesity’s Adverse Consequences Are Contingent on Regional Obesity Prevalence by Jana B. Berkessel, Tobias Ebert, Jochen E. Gebauer and Peter J. Rentfrow in Psychological Science
Footnotes
Transparency
Action Editor: Patricia J. Bauer
Editor: Patricia J. Bauer
Author Contributions
References
Supplementary Material
Please find the following supplemental material available below.
For Open Access articles published under a Creative Commons License, all supplemental material carries the same license as the article it is associated with.
For non-Open Access articles published, all supplemental material carries a non-exclusive license, and permission requests for re-use of supplemental material or any part of supplemental material shall be sent directly to the copyright owner as specified in the copyright notice associated with the article.