
Abstract
Excessively criticizing a perceived unfair decision is considered to be common behavior among people seeking to restore fairness. However, the effectiveness of this strategy remains unclear. Using an ecological environment where excessive criticism is rampant—Major League Baseball—we assess the impact of verbal aggression on subsequent home-plate umpire decision making during the 2010 to 2019 seasons (N = 153,255 pitches). Results suggest a two-sided benefit of resorting to verbal abuse. After being excessively criticized, home-plate umpires (N = 110 adults, employed in the United States) were less likely to call strikes to batters from the complaining team and more prone to call strikes to batters on the opposing team. A series of additional analyses lead us to reject an alternative hypothesis, namely that umpires, after ejecting the aggressor, seek to compensate for the negative consequences brought on by the loss of a teammate. Rather, our findings support the hypothesis that, under certain conditions, verbal aggression may offer an advantage to complainants.
Keywords
Witnessing a decision that we perceive as unfair often generates strong negative emotions, which can impair one’s own decision-making and generate suboptimal responses (Blanchette & Richards, 2010; Fehr & Gächter, 2002; Hopfensitz & Reuben, 2009; Kenning & Plassmann, 2005; Lerner et al., 2015; Loewenstein & Lerner, 2003; Naqvi et al., 2006; Pillutla & Murnighan, 1996). Punishing the unjust person is a common way of responding, even if this behavior is likely to result in costly consequences (Henrich et al., 2006; Larrick et al., 2011; Nelissen, 2008; Seip et al., 2014; Seymour et al., 2007; Turillo et al., 2002; Xiao & Houser, 2005). In human relationships, punishment may take the form of verbal aggression (Baron & Richardson, 2004). This behavior is a way of expressing the magnitude of the perceived injustice, aiming to convince people to modulate their subsequent decisions to restore fairness (Canary et al., 1996; Crockett et al., 2014; Folger & Cropanzano, 2001; Greenberg & Cohen, 2014).
At first glance, aggressively criticizing people to change their future decisions to one’s advantage may seem ineffective. Indeed, there is strong evidence that verbal aggression causes psychological pain, embarrassment, and suffering that damage the victim’s self-esteem (Hamilton, 2012; Infante & Rancer, 1996; Perloff, 2020; Rancer & Avtgis, 2006). These negative emotions alter the relationship with the aggressor and reduce the likelihood that the victim will comply with the aggressor’s viewpoint (Gass & Seiter, 2018; Guerin, 2003; Perloff, 2020; Rancer & Avtgis, 2006). On the other hand, research on social-information processing suggests that people may seek to avoid social punishment and may, after being aggressively criticized, seek to conform to their abuser’s opinion to avoid further sanctions (Germar et al., 2016; Pryor et al., 2019; Rilling et al., 2008; Rilling & Sanfey, 2011; Sanfey, 2007; Schiebener & Brand, 2015; Starcke & Brand, 2012; Theriault et al., 2021; Wasylyshyn et al., 2018). This theoretical incongruity is problematic for predicting the impact that excessive criticism of individuals may have on subsequent decisions. In an attempt to shed light on this contradiction, we propose to use an ecological environment where verbal aggression following perceived injustice is omnipresent—that is, baseball games.
Verbally abusing in-game officials, more commonly referred to as umpires, is almost a tradition in baseball (DeLong, 2017; Smith, 1983). Although pervasive, these aggressive behaviors are normally subject to an automatic punishment: The offender is ejected from the game. Although it is challenging to measure all verbal interactions that occur in a baseball game, those involving excessive verbal abuse are objectively measurable in Major League Baseball (MLB). They are associated with an ejection, which is recorded in the game statistics. (See Supplemental Material S1 in the Supplemental Material available online for an explanation of the use of ejection as an indicator of verbal aggression.) Because many unacceptable behaviors can lead to an ejection, the game statistics provide the reason for the sanction, confirming whether or not the offense was verbal abuse of an umpire.
Much of the excessive criticism MLB umpires receive is related to strike-zone decisions (DeLong, 2017). In baseball, the strike zone is defined as an intangible area delimited by the width of the home plate and the height of the batter. Specifically, the zone height ranges from the midpoint between the batter’s shoulders and the top of his pants to a point below his kneecap (see Fig. S1 in the Supplemental Material). One of the tasks of the home-plate umpire is to determine whether pitches directed at a batter travel through the strike zone when the batter does not swing. This decision should be objective; any pitch that touches the strike zone should be called a strike, whereas any other pitch should be called a ball. However, the task is extremely challenging because the speed of the pitch, which can exceed 100 mph, requires a high level of information processing (MacMahon & Starkes, 2008). The difficulty of the task is confirmed by the camera system installed in all MLB stadiums. This system accurately measures the location of each pitch, allowing the umpires’ performance to be evaluated (Mills, 2017). According to the pitch-tracking system, MLB umpires make the wrong call over 10% of the time. When umpires make mistakes, they give one team an advantage over the other. Each pitch classified as a ball gives a distinct advantage to a batter, because accumulating four balls results in the batter being walked (i.e., he may go to first base automatically). Conversely, each strike represents a disadvantage to batters, because accumulating three strikes results in the batter being called out. It is not surprising, then, that baseball players and coaches regularly criticize home-plate umpires’ decisions that negatively affect their teams.
Statement of Relevance
The use of aggressive behavior to resolve conflicts is often considered socially unacceptable. Nevertheless, when people feel that they are victims of injustice, they tend to react aggressively in an attempt to restore justice. In this research, we used a context in which perceived injustices are numerous and real—professional baseball games in the United States—to test the effectiveness of verbal aggression toward officials. We found that players and coaches who yell at officials influence decisions of those officials to their team’s advantage in a bidirectional way. After being verbally abused, the officials call fewer strikes to that team’s batters and more to those of the opposing team. These findings must be considered when formulating strategies to mitigate human-to-human aggression. Recognizing the potential impact of aggression on decision makers raises questions about the ethical considerations surrounding its use, particularly in situations where individuals perceive themselves as victims of injustice.
Thanks to baseball and its use of frequent criticism, its numerous statistics, and the technology that accompanies it, it is possible to measure in objective ways verbal aggression against umpires and its impact on subsequent strike-zone decisions. The purpose of our study is therefore to explore the impact of excessive criticism on MLB umpires’ decisions related to the strike zone. We argue that umpires change their decision-making after being excessively criticized. Given the theoretical background, it is unclear whether this behavior change will provide an advantage or disadvantage to the aggressor’s team, also referred to as the in-group. To strengthen the primary hypothesis that verbal abuse alters behavior, we also conducted a series of supplementary analyses to determine whether a change in behavior would be better explained by the alternative hypothesis that umpires are trying to compensate for the negative consequences to a team of losing a teammate to ejection. Table 1 provides a summary of the seven models and expected outcomes that would support the effect of excessive criticism, as well as those that would support an attempt to counterbalance the consequences of an ejection.
Summary of Analysis From All Seven Models and Their Anticipated Results According to the Primary (Excessive Criticism) and Alternative (Compensate for Ejection) Hypotheses
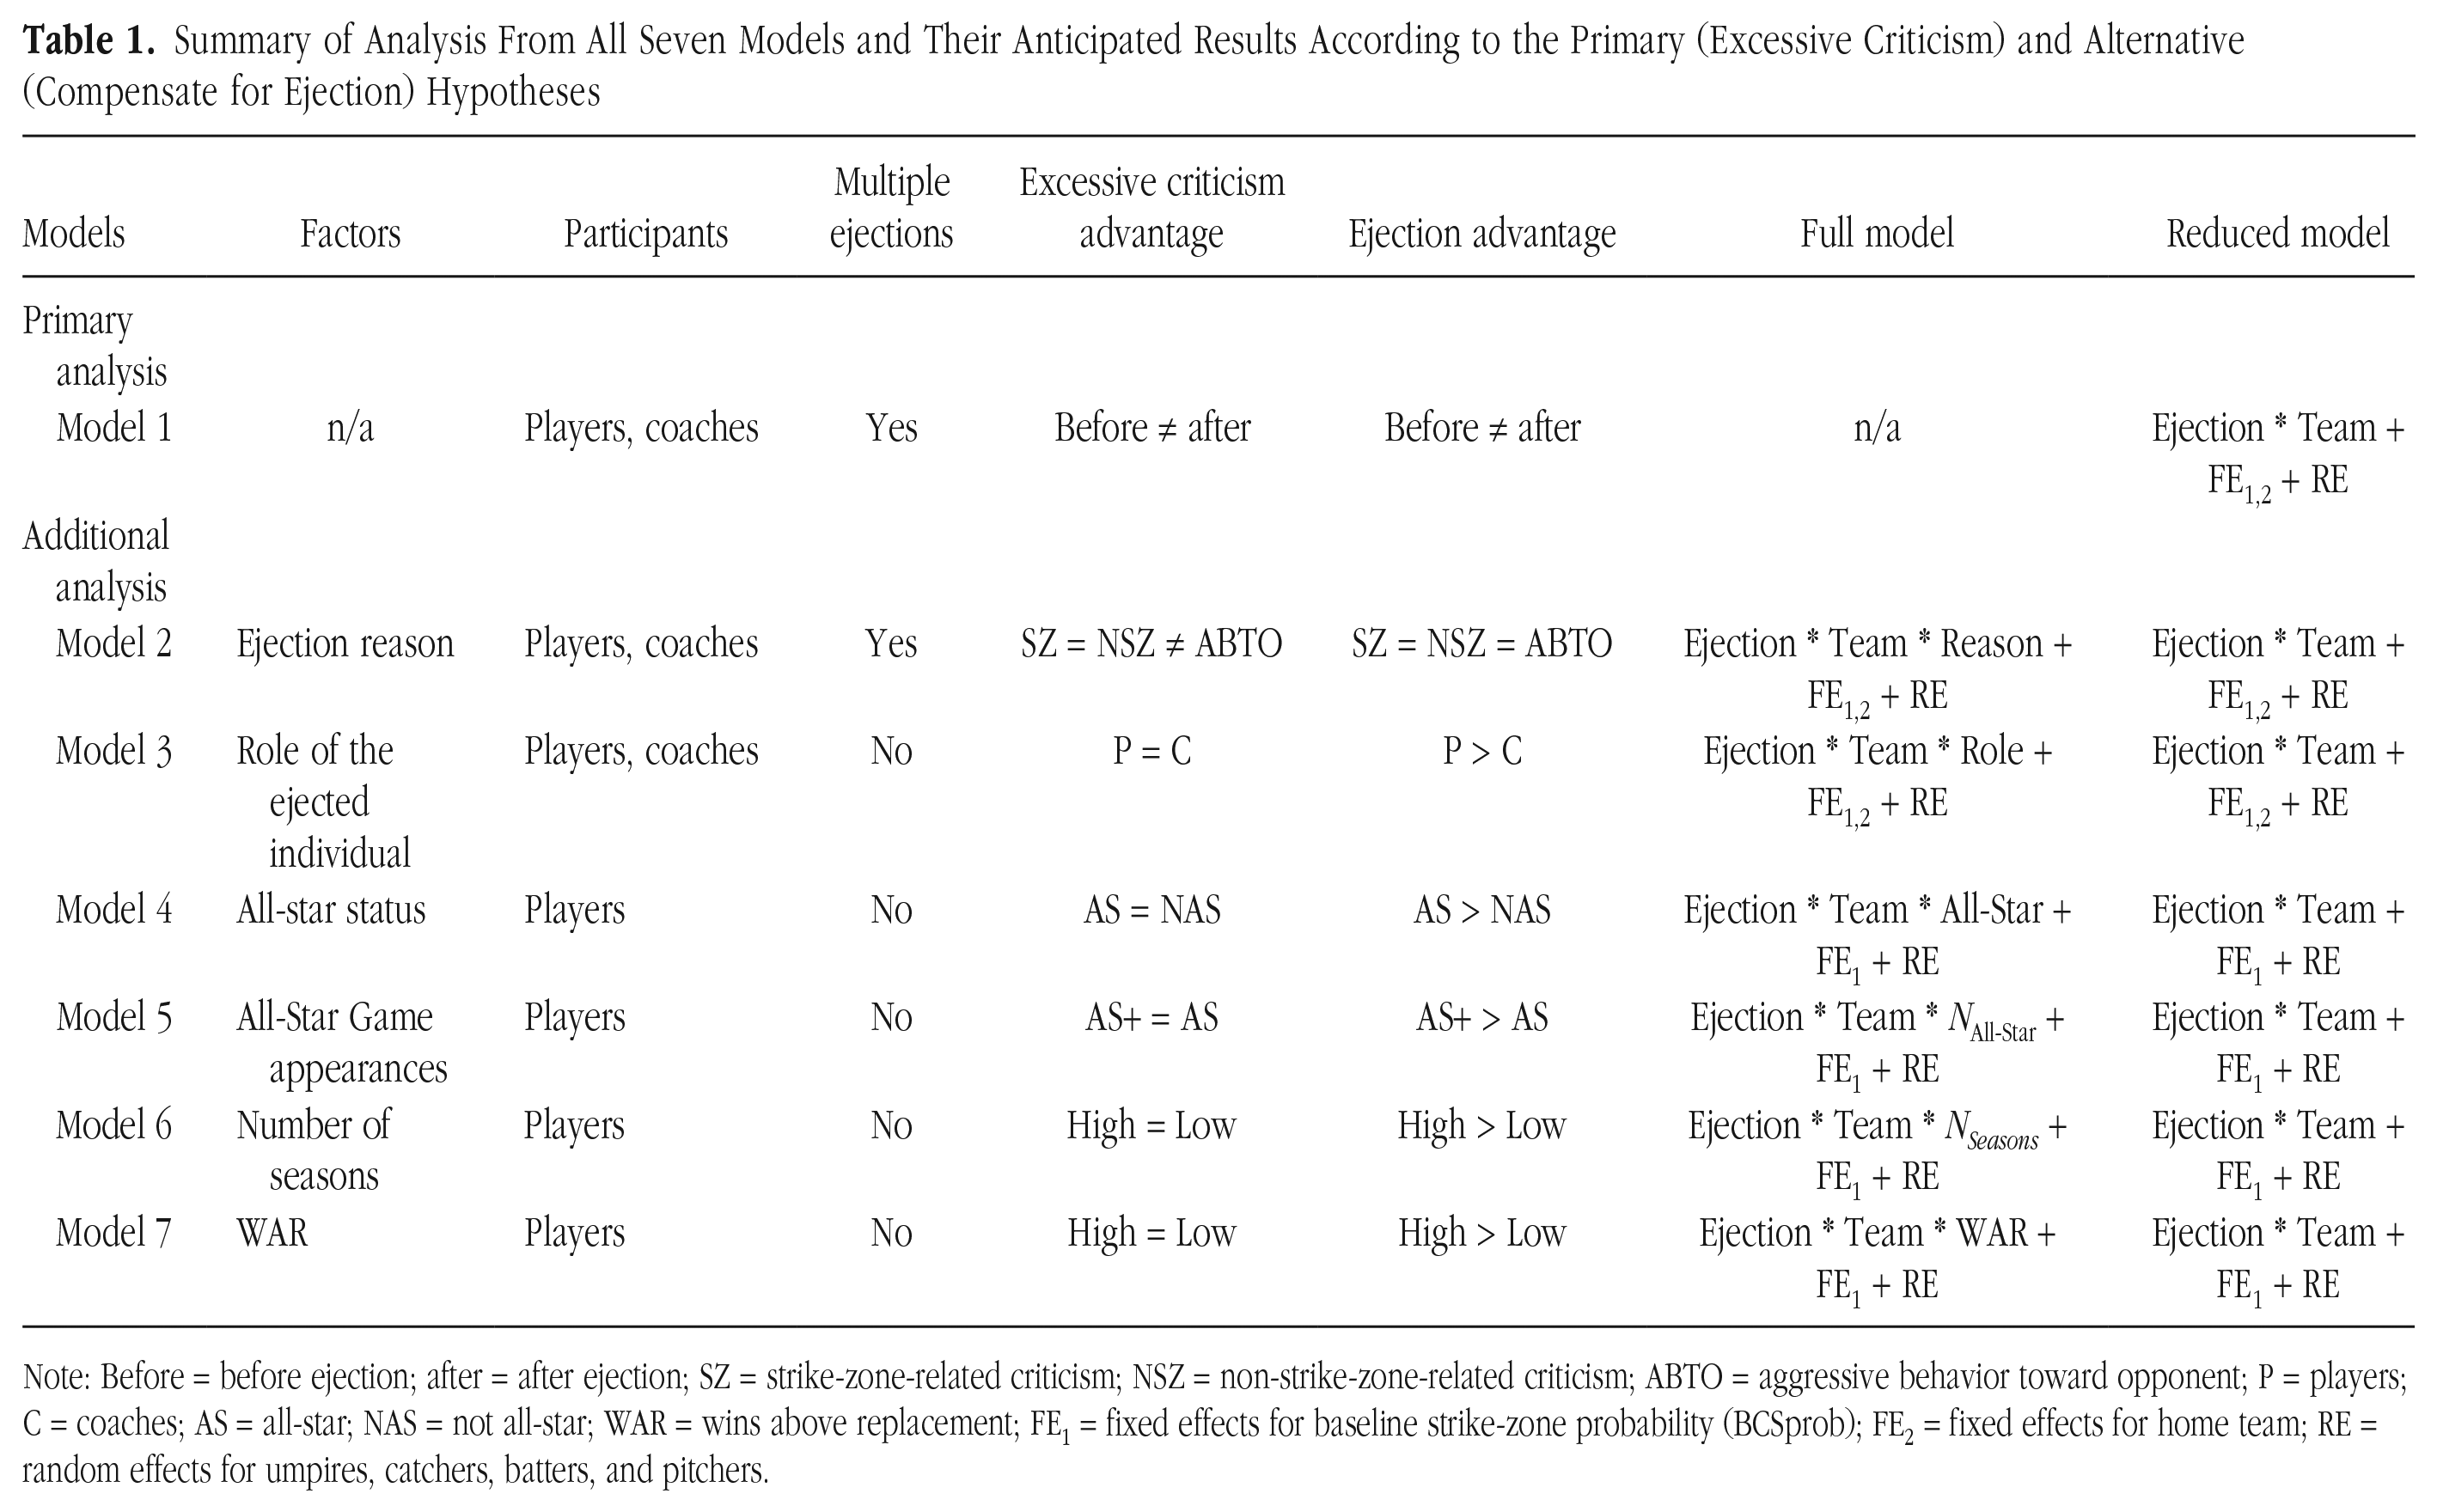
Note: Before = before ejection; after = after ejection; SZ = strike-zone-related criticism; NSZ = non-strike-zone-related criticism; ABTO = aggressive behavior toward opponent; P = players; C = coaches; AS = all-star; NAS = not all-star; WAR = wins above replacement; FE1 = fixed effects for baseline strike-zone probability (BCSprob); FE2 = fixed effects for home team; RE = random effects for umpires, catchers, batters, and pitchers.
Method
Data acquisition
The data and code utilized in the project are available at https://osf.io/eu6v9/. The study was not preregistered. The project relies exclusively on publicly available information and does not require ethical approval to meet ethical guidelines and legal requirements. The host institution’s ethics committee has confirmed that this is the case, following receipt of an ethics declaration.
We collected data on ejections that occurred in MLB from the 2010 season through the 2019 season, listed on the Retrosheet website (https://retrosheet.org). The studied time frame begins in the year following implementation of the umpire-assessment system called Zone Evaluation (Mills, 2017) and ends before the commencement of spectator-free matches caused by the COVID-19 pandemic. Each ejection is accompanied by various information, including match identification, the name of the person ejected, his role on the team (player or coach), the name of the umpire who issued the ejection, and the reason for the ejection. Only the ejections performed by home-plate umpires were considered, given that it is the excessive criticism of their work and their subsequent decision-making that interested us. Then the ejections were separated into three categories—those related to criticism of the strike zone, those related to criticism of other home-plate-umpire decisions, and those related to aggressive behavior directed at the other team (i.e., behavior that did not involve criticism of umpire decisions). Reasons for ejection that may fall into more than one category (e.g., bench jockeying) and that did not indicate that the decision being criticized was solely that of the home-plate umpire (e.g., video replays) were removed from the sample. Games in which members of each of the two competing teams were ejected have also been removed from the data set. However, games in which multiple members of the same team were ejected for the same reason were retained. The list of reasons reported for the ejections that we retained in the final sample is presented in Table S1 in the Supplemental Material.
To complete the data on ejections, we also collected information to define characteristics of the ejected players. Wins above replacement (WAR), an all-encompassing measure that summarizes a player’s contributions to his team’s success during a season, was obtained via the Fangraphs website (https://fangraphs.com), whereas the number of years played in the MLB and the number of All-Star Game appearances were acquired via the Baseball Reference website (https://baseball-reference.com). This supplementary information helps to identify the status of players relative to other players within MLB, either in terms of performance, reputation, or experience.
From games containing ejections retained, we exported the pitch-by-pitch data using the baseballr package in R (Petti, 2021). The data is collected by a pitch-tracking system installed in all MLB stadiums (PITCHf/X from 2010 to 2016; StatCast from 2017 to 2019) and provides accurate information about the ball’s trajectory. In particular, the system identifies the horizontal and vertical position of the ball when it reaches the two-dimensional area that defines the strike zone, which makes it possible to evaluate the accuracy of the decision-making of home-plate umpires.
We then verified that the ejections appearing in the list obtained on Fangraphs are also listed in the pitch-by-pitch data. Five games with missing ejections were removed from the sample. We also removed ejections that occurred late in the game—situations in which the home-plate umpire did not have to rule on balls and strikes after the ejection (n = 9). The final sample is composed of 1,204 ejections listed from 1,001 games.
Then the pitch-by-pitch data was filtered to include only those pitches for which the batter does not swing, to ensure that the umpire was forced to make a decision (i.e., calling a ball or a strike). This represented 157,415 pitches. Pitches with missing data for variables to be included in the models were removed from the sample. Specifically, 1,163 pitches were eliminated because their spatial position was missing, one pitch was eliminated because the count given prior to the pitch was impossible (4 balls and 3 strikes), and two additional pitches were eliminated because the identity of the pitcher and batter did not appear. We also removed all pitches that required virtually no subjective decision-making on the part of the umpire to be called balls—that is, those that were extremely far from the strike zone and thus evident calls to make (n = 2,994). As previously proposed by Mills (2014), these pitches are those that hit the ground before reaching home plate, crossed home plate at a height of more than 5 feet, or were more than 2 feet away on either side of home plate. The final sample consisted of 153,255 pitches.
Finally, we collected additional data to estimate the baseline probability that each pitch in our sample would be called a strike. To do so, we once again used the baseballr package to export pitches thrown during all games outside of our sample during the 2010 to 2019 seasons. These data were used to calculate the probability of a pitch being called a strike as a function of spatial position, pitcher’s and batter’s handedness, batter’s count, season, and pitch type. Nineteen matches could not be exported because of the recording format of the source (see Supplemental Table S2). Again, pitches were removed if the umpire did not have to make a decision (because the batter swung at the ball), if data were missing, or if the pitches were obvious balls (because they were very far from the strike zone). The final data set consisted of 3,444,443 pitches.
Analyses
Baseline called-strike probabilities
According to the MLB rulebook, the only reason an umpire should call a pitch a strike is its spatial location, which is available from the pitch’s horizontal and vertical coordinates recorded by the pitch-tracking system. However, previous studies have demonstrated a nonlinear relationship between the position of the pitch and the probability of its being called a strike (Albert et al., 2017; Deshpande & Wyner, 2017; Mills, 2014). To address this issue, we propose to use a variable, baseline called-strike probability (BCSprob), that is an estimate of the probability of a pitch being called a strike in our logistic mixed-effects models rather than the coordinates of the pitches (Deshpande & Wyner, 2017; Marchi et al., 2018; Mills & Salaga, 2018). Relying on previous studies (Albert et al., 2017; Deshpande & Wyner, 2017; Marchi et al., 2018; Mills, 2014; Mills & Salaga, 2018), we estimated a generalized additive model (GAM) with logistic link from the pitches that occurred in games without ejections to create this variable, using the following equation:

The dependent variable is defined as
The model allowed us to create the variable baseline called strike probability (BCSprob) by estimating the probability of each pitch in our ejection-games sample to be called a strike. By identifying a 50% or greater probability that a pitch is a strike as a successful prediction when the umpire’s actual decision is a strike, our GAMs correctly predicted 90.58% of the umpires’ strike-zone decisions in the pitch-by-pitch sample. We also assessed the performance of the model via a receiver operating characteristic (ROC) curve, built with the ROCR package (Sing et al., 2005). The area under the curve is 96.98%, which is considered outstanding (Hosmer et al., 2013). The ROC curve is available in Supplemental Figure S2. Supplemental Figures S3 to S6 show the baseline probability of an umpire calling a strike, based on certain batter counts: the starting count (0 balls/0 strikes) and the two most extreme counts (0 balls/2 strikes, 3 balls/0 strikes). Supplemental Figures S7 to S10 present the baseline probability during different seasons (i.e., the most distant in time, 2010 and 2019). Finally, Supplemental Figures S11 to S14 illustrate the baseline probability for different pitch types (i.e., pitches with a different ball trajectory—the four-seam fastball and the curveball).
Logistic mixed-effects models
To estimate the influence of an MLB team member’s ejection on strike calls, we created mixed-effects logistic models. First, to assess the impact of an ejection for excessive criticism of the strike-zone-related decisions, we created a model with an interaction between the ejection event and the team that lost a player or coach to ejection (described as the ejected team, for conciseness). Then, for all our additional analyses, we used a reduced model containing this interaction to compare with six improved models, each including a different additional variable. The additional variable was included in a three-way interaction with ejection event and ejected team. Including a variable in a triple interaction also adds the fixed effect of that variable, as well as any possible double interactions between the three variables in the triple interaction.
Our reduced models are represented by these expressions:
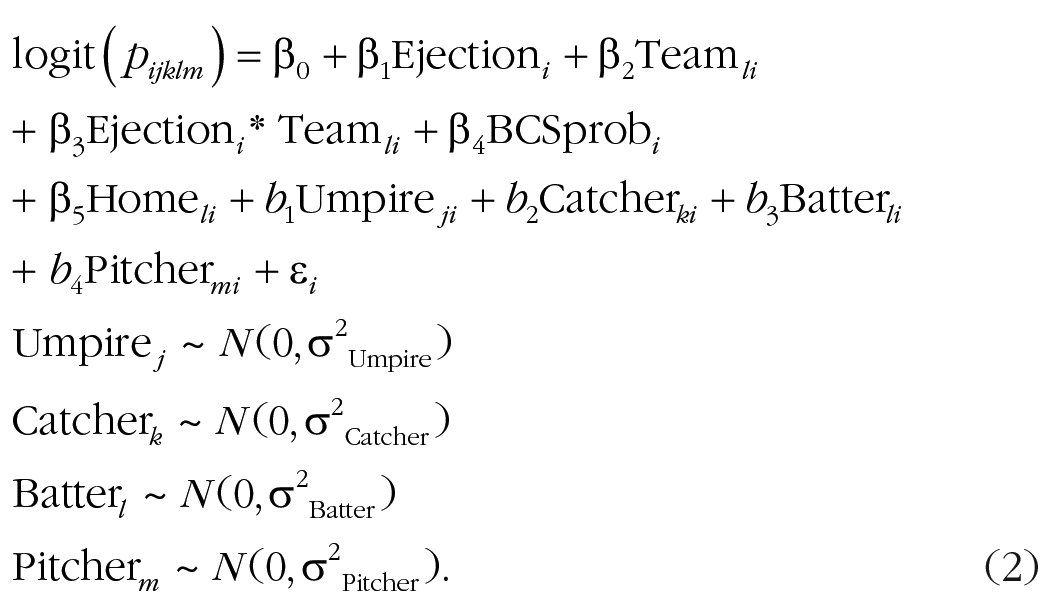
Our full models are represented by these expressions:
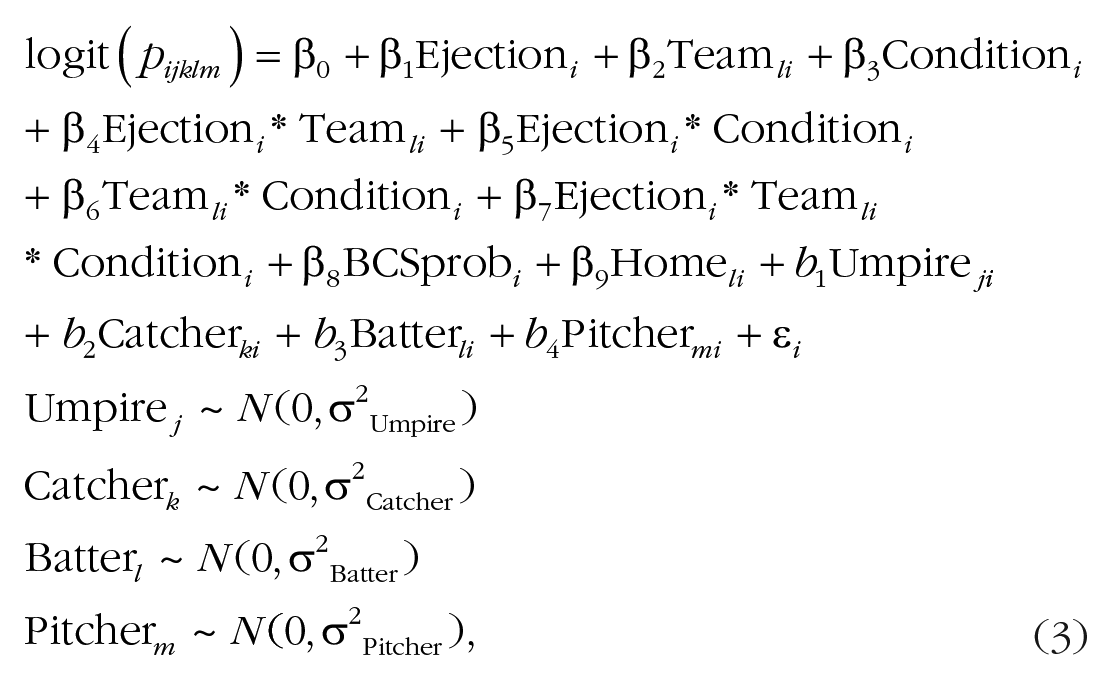
where logit(pijklm) designates the log odds of a pitch i, thrown by a pitcher m to a batter l, which is caught by a catcher k and judged by an umpire j, being called a strike (ball = 0; strike = 1). The model includes a dummy variable for the moment when the pitch was thrown, named Ejection i (before ejection = 0; after ejection = 1). For games with more than one ejection, the cut-off was established at the moment of the first ejection. We created another dummy for the team to which the batter who receives the pitch belongs, named Team li (nonejected team = 0; ejected team = 1). Condition i symbolizes the characteristics for which we want to evaluate the impact. We generated six different conditions to test six different models. For the first three conditions, we created dummy variables, 1, 2, and 3, respectively, for the reason for the ejection (strike-zone criticism = 0; nonstrike-zone criticism = 1; aggressive behavior toward opposite team = 2); ejected individuals’ role in their team (players = 0; coaches or managers = 1); and all-star status of players (never been invited to the All-Star Game = 0; at least one invitation to the All-Star Game = 1). For other conditions, we used continuous variables (4, 5, 6) for player-specific characteristics, respectively the number of All-Star Game participations, the number of years played in the MLB, and players’ performance level measured by WAR. The continuous variables were all centered before being included in the models. BCSprob i is the baseline probability that a pitch thrown at a specific location, during a specific count, in a specific year, and with a specific trajectory, will be called a strike. This variable was preliminarily predicted from Equation 1. Dummy variable Home li (away team = 0; home team = 1) was included to control for the home-field advantage of the team at bat. Random effects for umpires, catchers, batters, and pitchers were added to the model to control for the inconsistency of their behavior (Archsmith et al., 2018; Barr et al., 2013; Deshpande & Wyner, 2017; Huang & Hsu, 2020).
Models were fitted with the lme4 package (Bates et al., 2014) in R, using maximum likelihood from adaptive Gauss-Hermite quadrature and bobyqa optimizer to avoid convergence issues (Pinheiro & Chao, 2006; Powell, 2009). For all models, we first tested whether the mixed-effects minimal baseline model explained significantly more variance than a model without random variables by applying a likelihood ratio test (p < .05 for all models; Bolker et al., 2009). Standardized parameters are presented in the Results section and were obtained by fitting the model on a standardized version of the data set. We used Wald approximation to compute 95% confidence intervals (CIs) and p values. For post hoc analysis, we used the emmeans package (Lenth, 2021).
Results
Table 2 presents descriptive statistics for pitches judged by umpires in games with excessive strike-zone-criticism ejections, by ejection event (before, after), and batter’s team (ejected, nonejected).
Descriptive Statistics and Accuracy of Major League Baseball Umpires by Team, Before and After Ejection for Excessive Strike-Zone Criticism
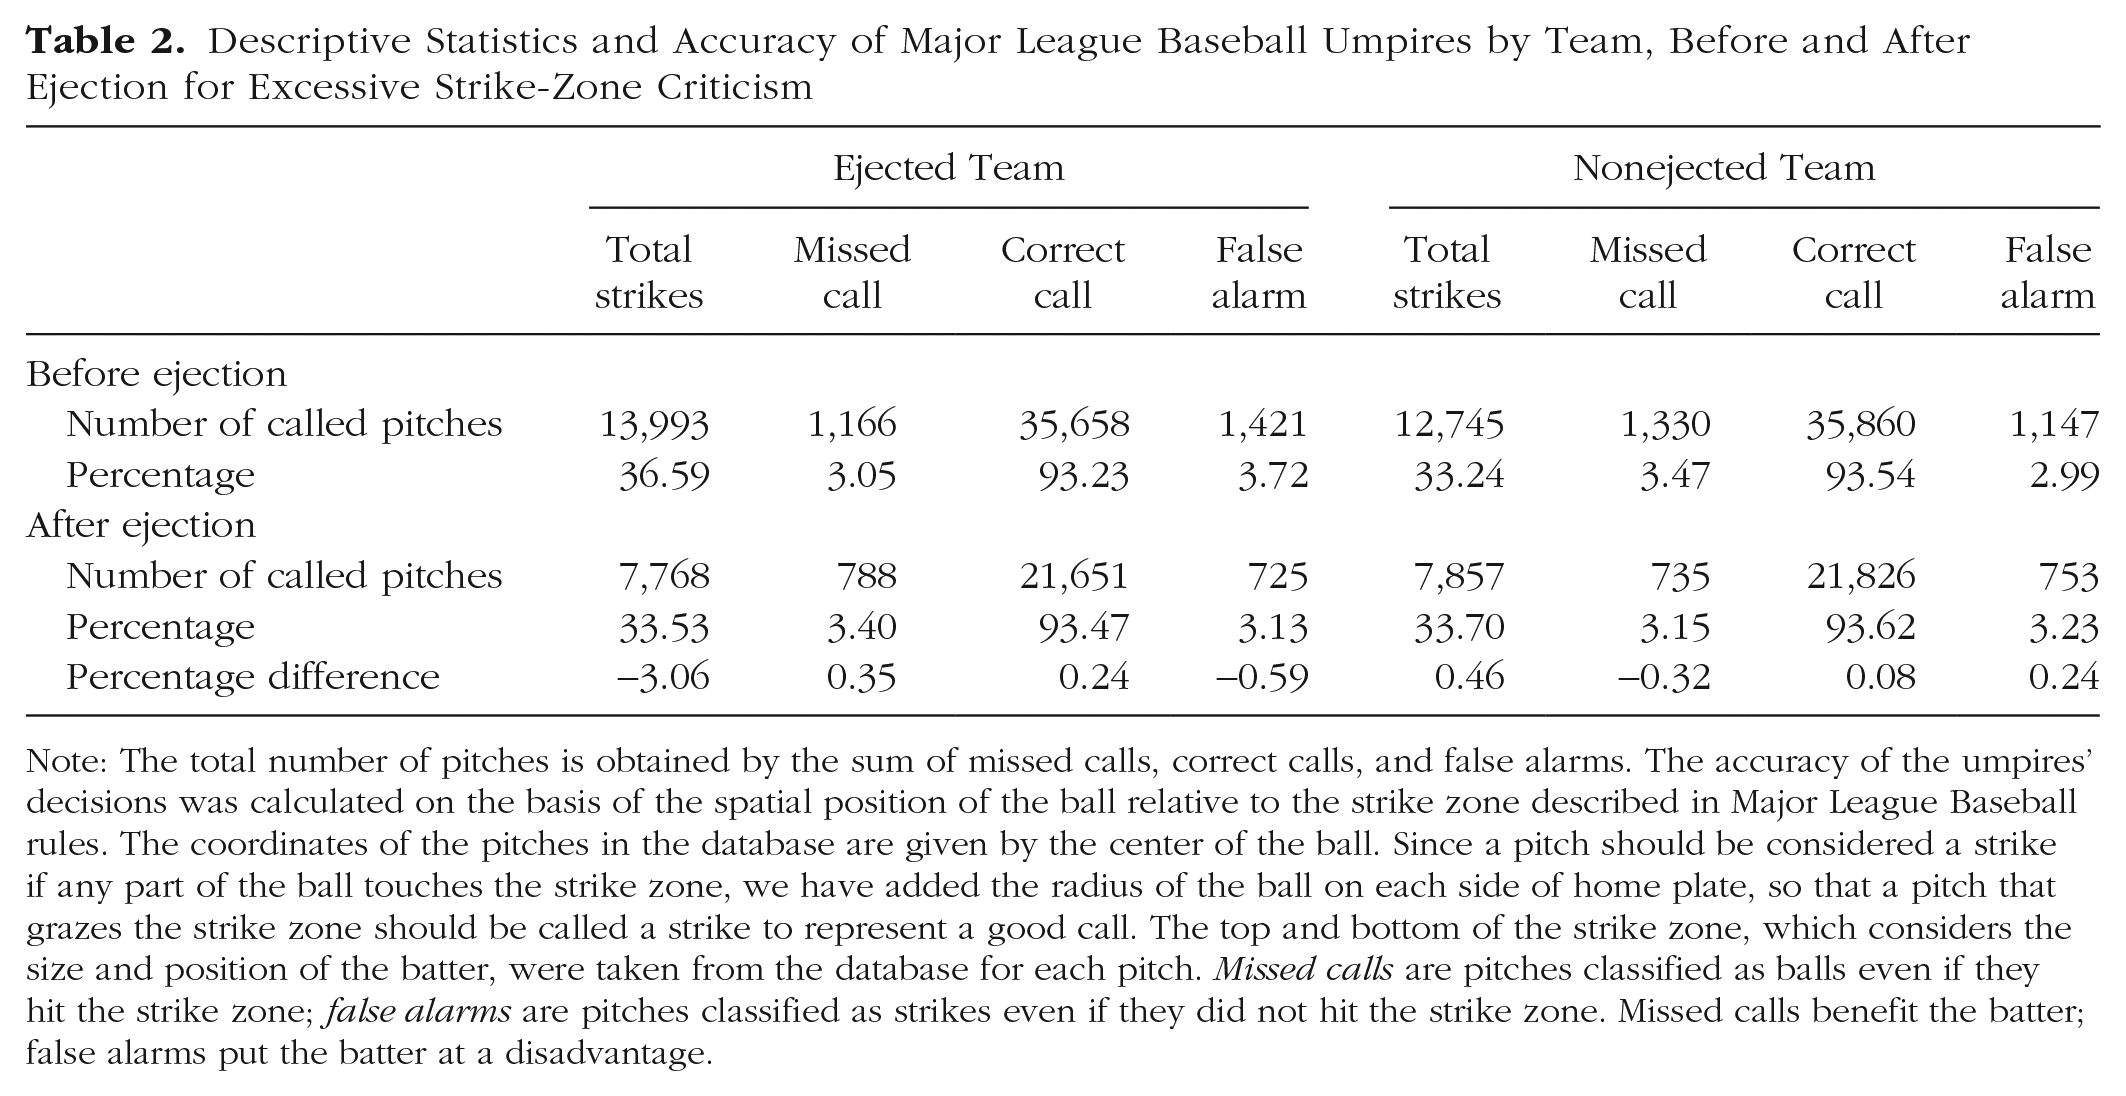
Note: The total number of pitches is obtained by the sum of missed calls, correct calls, and false alarms. The accuracy of the umpires’ decisions was calculated on the basis of the spatial position of the ball relative to the strike zone described in Major League Baseball rules. The coordinates of the pitches in the database are given by the center of the ball. Since a pitch should be considered a strike if any part of the ball touches the strike zone, we have added the radius of the ball on each side of home plate, so that a pitch that grazes the strike zone should be called a strike to represent a good call. The top and bottom of the strike zone, which considers the size and position of the batter, were taken from the database for each pitch. Missed calls are pitches classified as balls even if they hit the strike zone; false alarms are pitches classified as strikes even if they did not hit the strike zone. Missed calls benefit the batter; false alarms put the batter at a disadvantage.
Primary analysis
Model 1: excessive criticism impact
To determine the impact of verbal abuse on baseball umpires’ decision-making, we fitted a linear mixed-effects model, including an interaction between the ejection event and the team to which the ejected person belonged (Equation 2). The aim of the interaction was to test whether a potential change in umpire behavior after the umpire ejected someone is similar for both teams or whether it provides an advantage to one team over the other following excessive criticism related to strike-zone decisions (n = 123,060). Table 3 displays the estimates of Model 1. Inclusion of the interaction (β = −0.57, 95% CI = [−0.67, −0.47], p < .001) significantly improved the model compared to a reduced model with ejection event and ejected team as simple effects only, likelihood ratio test χ2(1) = 137.69, p < .001. Tukey’s honestly significant difference (HSD) post hoc analysis (Supplemental Table S4) revealed a significant decrease in the likelihood that pitches directed at the offending team’s players are called strikes after an ejection (odds ratio, or OR = 0.697, 95% CI = [0.636, 0.762], p < .001), giving them an advantage. In contrast, there is an increase in the probability that pitches directed at players on the team that did not experience the ejection are called strikes after ejection (OR = 1.232, 95% CI = [1.124, 1.350], p < 0.001), once again offering an advantage to the aggressor’s team. Interestingly, the team that excessively criticizes the umpire’s decisions is indeed at a disadvantage compared to the opposing team before the ejection (OR = 1.479, 95% CI = [1.366, 1.602], p < .001). The opposite effect is observed after the ejection, when players from the complaining team receive significantly fewer strikes than their opponents (OR = 0.837, 95% CI = [0.756, 0.926], p < .001). The results of Model 1 indicate that the use of verbal abuse toward umpires could provide a two-sided advantage for a team by not only decreasing the likelihood of their batters’ receiving strikes but also increasing the likelihood of opposing batters receiving strikes. Figure 1 and Supplemental Figure S15illustrate this dual advantage.
Impact of Ejections for Strike-Zone-Related Criticisms on Strike Decisions (Model 1)
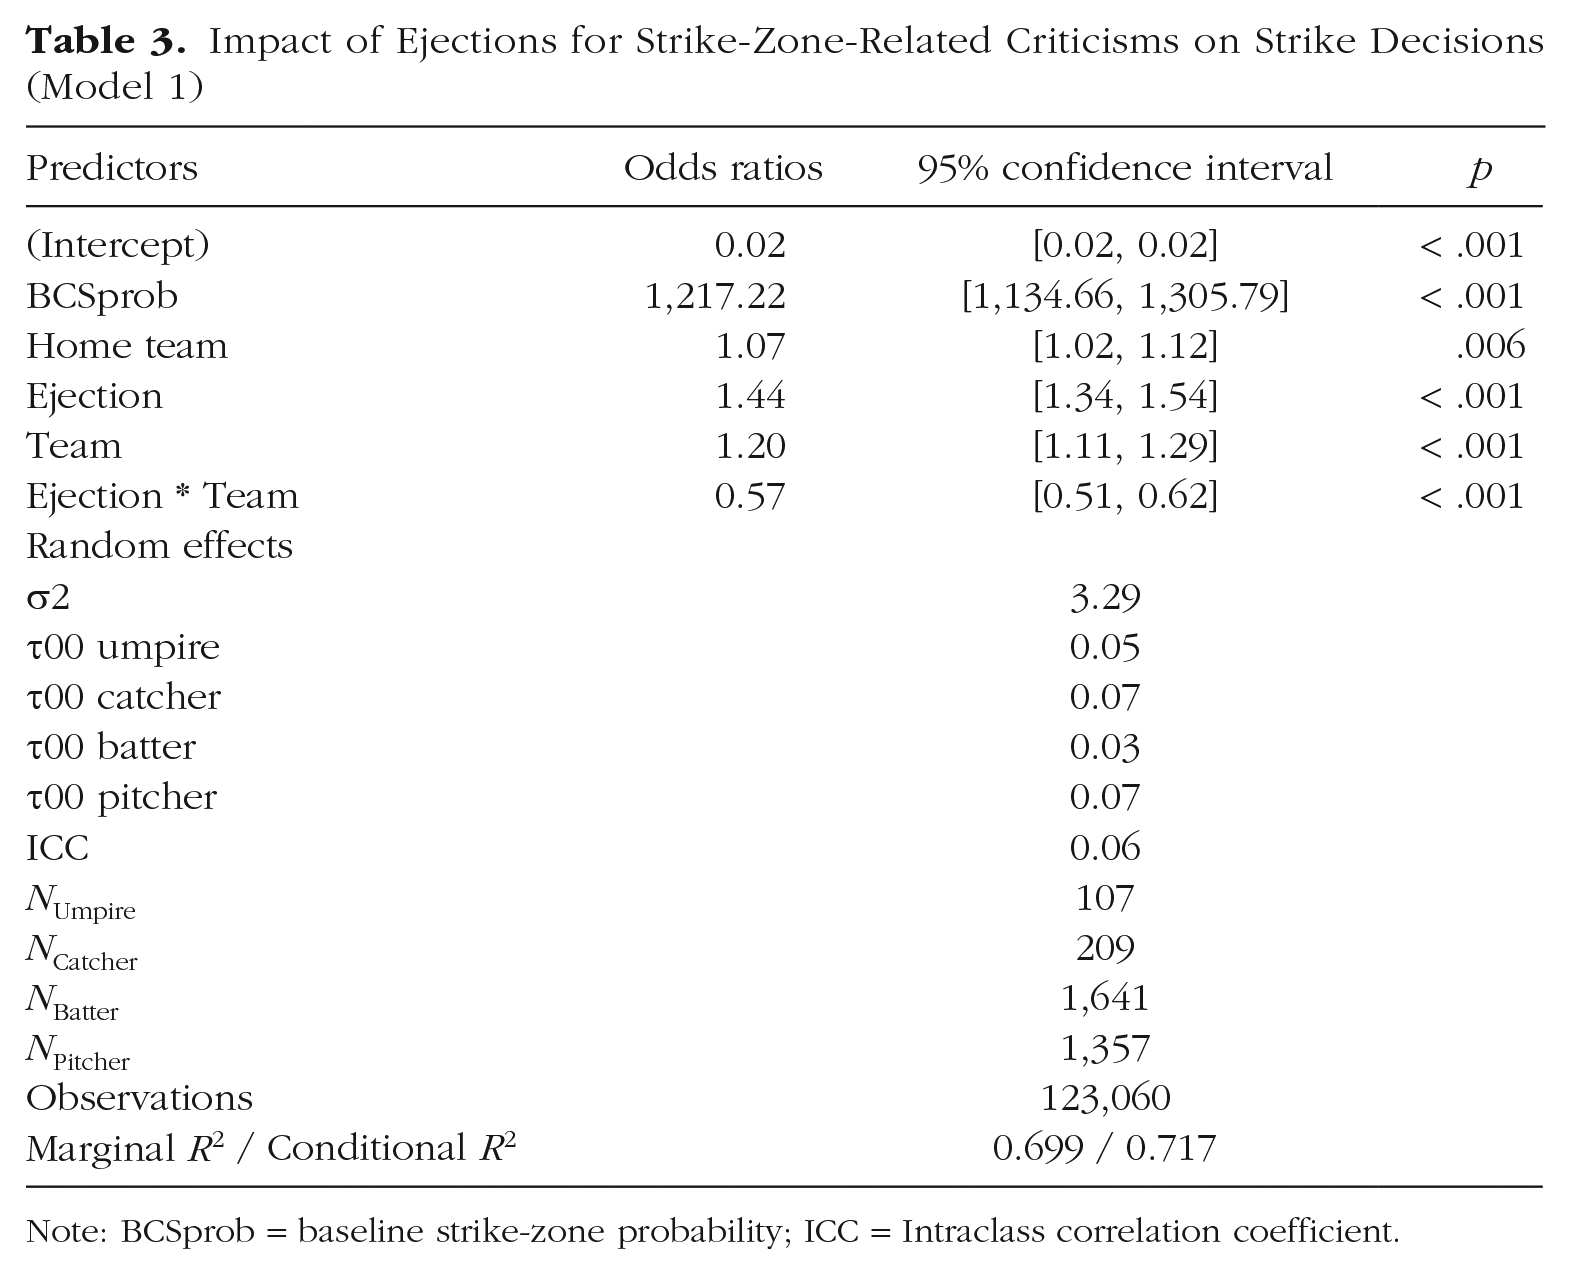
Note: BCSprob = baseline strike-zone probability; ICC = Intraclass correlation coefficient.
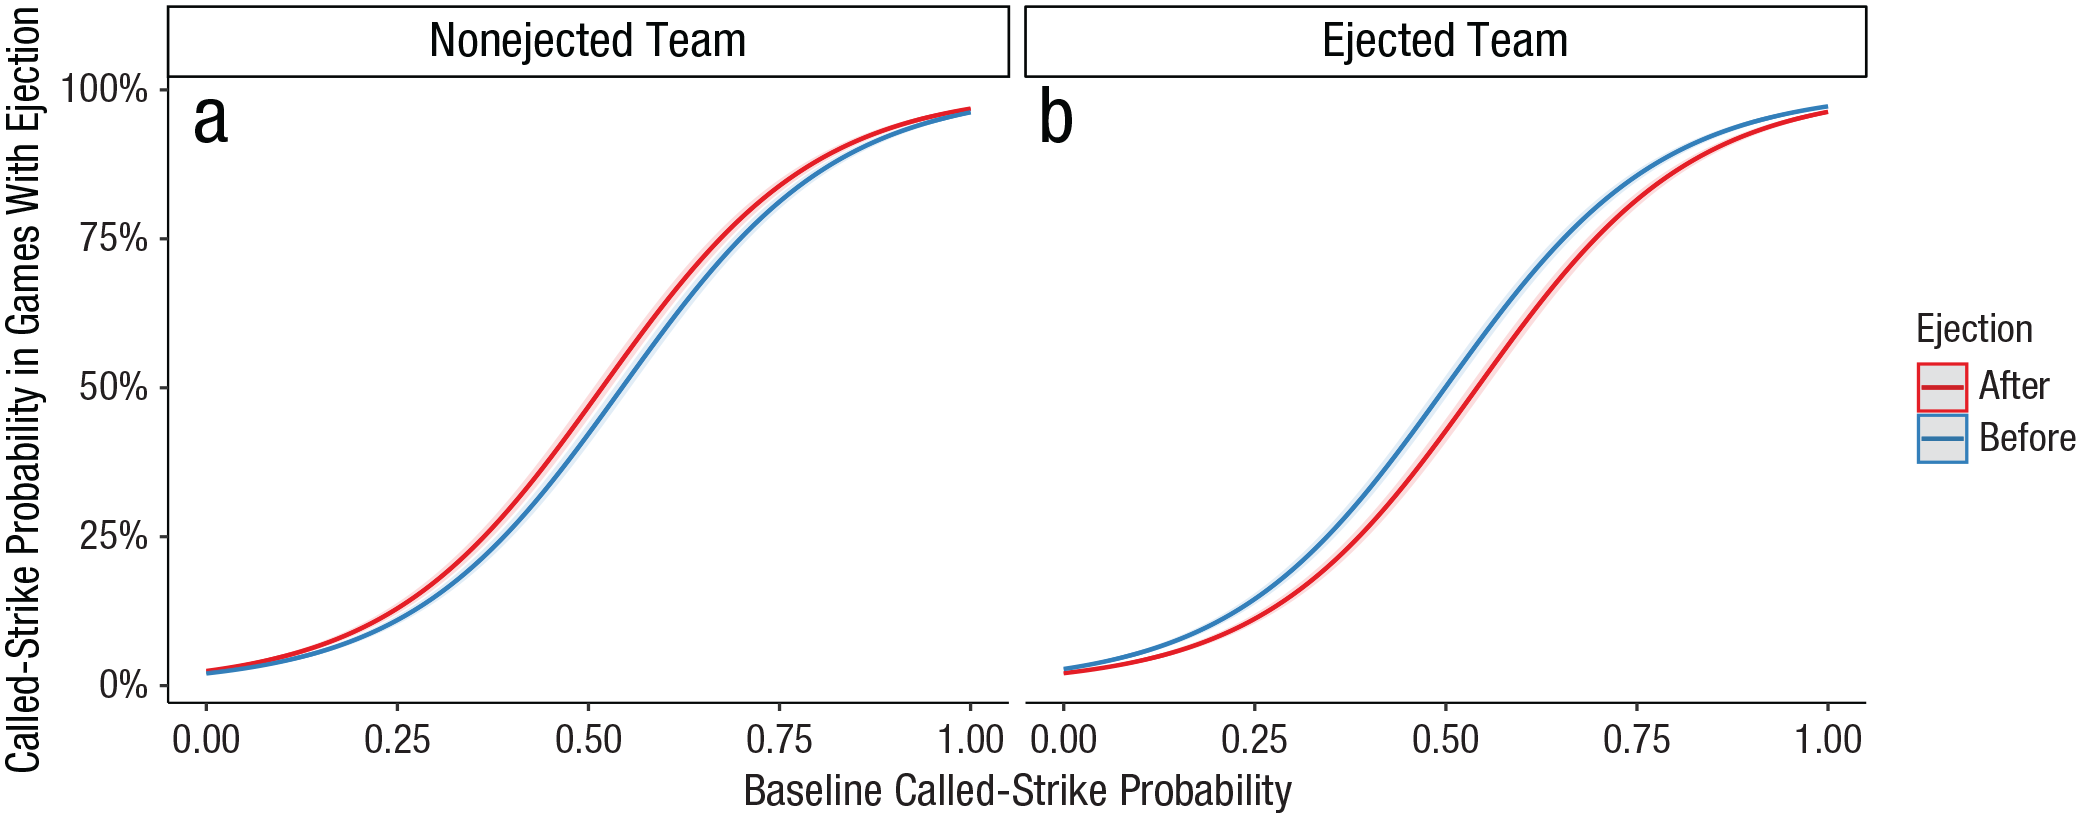
Called-strike probability in games with ejections related to excessive strike-zone criticism as a function of the baseline probability observed in games without ejections and the ejected team (n = 123,060).
Our first model suggested that verbal aggression may cause umpires to alter their decision-making to benefit the aggressive individual’s team. However, it is imperative to consider that the verbal aggression is coupled with a decision by the umpires—the ejection of the offender—that is detrimental to his team. To validate that the umpires’ behavioral change is due to the verbal aggression and that it does not represent an attempt to compensate for the negative consequence of their decision to eject a team member, we performed a series of additional analyses.
Additional analysis
We conducted additional investigations to determine whether the change in the umpires’ behavior was better explained as an attempt to compensate for the decision to eject someone or as a reaction to being verbally abused. Six models were created to test different variables that might support this hypothesis. We first analyzed the impact on the strike zone of ejections for different types of misconduct (Model 2); then we tested whether the status and role of the ejected individuals could also influence the decision-making of umpires. If player status is indeed a factor, the umpires should consider the magnitude of the team’s loss and adjust their decisions differently depending on the value of the individual ejected. Indeed, players have a greater impact on the outcome of a match than the coaches do (Berri et al., 2009; Demiralp et al., 2012). Also, the more talented, recognized, and experienced players are more valuable to their team than the less talented, recognized, or experienced players (Adler, 1985; Kim & King, 2014; Mills, 2014; Swaab et al., 2014). To eliminate these assumptions and reinforce the hypothesis that verbal aggression influences umpire behavior, we assessed the impact of the ejected individual on the basis of characteristics such as role (Model 3), all-star status (Model 4), number of All-Star Game appearances (Model 5), years of experience (Model 6), and performance level (Model 7).
Model 2: impact of ejection reason
As a first step in testing the likelihood that umpires are trying to balance the negative consequences of an ejection, we analyzed the impact on the strike zone of ejections for different types of misconduct (i.e., for excessively criticizing the strike zone, for excessively criticizing another decision, or for physically attacking a member of the opposing team; n = 153,255). If all types of ejections result in an advantage for the ejected team, the impact of the loss of a team member would seem to have a greater influence on umpire behavior than the verbal abuse itself.
The reason for the ejection was added to the interaction between the ejection event and the ejected team, thus generating a triple interaction. Supplemental Table S5 presents the estimates of Model 2. Including the triple interaction significantly improved the model compared to a reduced model with only an interaction between ejection event and the team with an ejected player or coach, likelihood ratio test χ2(8) = 70.76, p < .001. When compared to ejections for excessive criticism of strike-zone-related decisions, the interaction effect of non-strike-zone verbal abuse (β = 0.47, 95% CI = [0.20, 0.74], p < .001) and that of aggressive behavior against the other team (β = 0.45, 95% CI = [0.12, 0.78], p = .008) on ejection event by the team with an ejected player or coach were statistically significant. Post hoc analysis (Supplemental Table S6) using Tukey’s HSD pairwise comparisons suggests that, for the group of individuals ejected because of strike-zone criticism, there is a significant decrease in the likelihood that pitches directed at the offending team are called strikes after the ejection (OR = 0.698, 95% CI = [0.638, 0.763], p < .001), which provides benefits. Conversely, we observe an increase in the probability that pitches directed at opposing players were called strikes after the ejection (OR = 1.238, 95% CI = [1.130, 1.356], p < .001), again resulting in an advantage for the offending team. Furthermore, significant differences are observed between both teams before and after the ejection, suggesting that the umpires were disfavoring the offending team over the opposing team before the ejection (OR = 1.473, 95% CI = [1.362, 1.594], p < .001), and favoring the offending team over the opposing team after the ejection (OR = 0.831, 95% CI = [0.751, 0.919], p < .001). Unsurprisingly, these results are consistent with those of the first model, because they are based on the same data. For groups added to the analysis, no significant difference was observed in the probability of strike calls after an ejection, both for individuals ejected for verbal aggression unrelated to the strike zone (OR = 0.897, 95% CI = [0.713, 1.129], p = .6170 for the offending team; OR = 0.995, 95% CI = [0.785, 1.262], p = 1.000 for the opposing team) and for aggressive behavior against the other team (OR = 1.092, 95% CI = [0.814, 1.465], p = .8673 for the offending team; OR = 1.234, 95% CI = [0.916, 1.662], p = .2659 for the opposing team). Likewise, there is no significant differences between teams before and after the ejection, suggesting that umpires, when not excessively criticized regarding the strike zone, are not favoring any team with respect to the strike zone before the ejection (OR = 1.163, 95% CI = [0.947, 1.427], p = .2339 for non-strike-zone verbal abuse; OR = 0.872, 95% CI = [0.677, 1.122], p = .5017 for aggression directed at opponent) and after the ejection (OR = 1.047, 95% CI = [0.805, 1.362], p = .9690 for non-strike-zone verbal abuse; OR = 0.771, 95% CI = [0.550, 1.081], p = .1976 for aggression directed at opponent). These results, presented visually in Figure 2 and Supplemental Figure S16, suggest that verbal abuse influences umpires’ strike-zone decisions to the advantage of the offending team, but only when the verbal abuse is specific to the strike zone. Ejections for verbal abuse not specific to the strike zone and for aggressive behavior toward opponents do not provide this advantage to the aggressive individual’s team. For this reason, future models will only include data from ejections that occurred because of excessive criticism of strike-zone-related decisions, as with the first model.
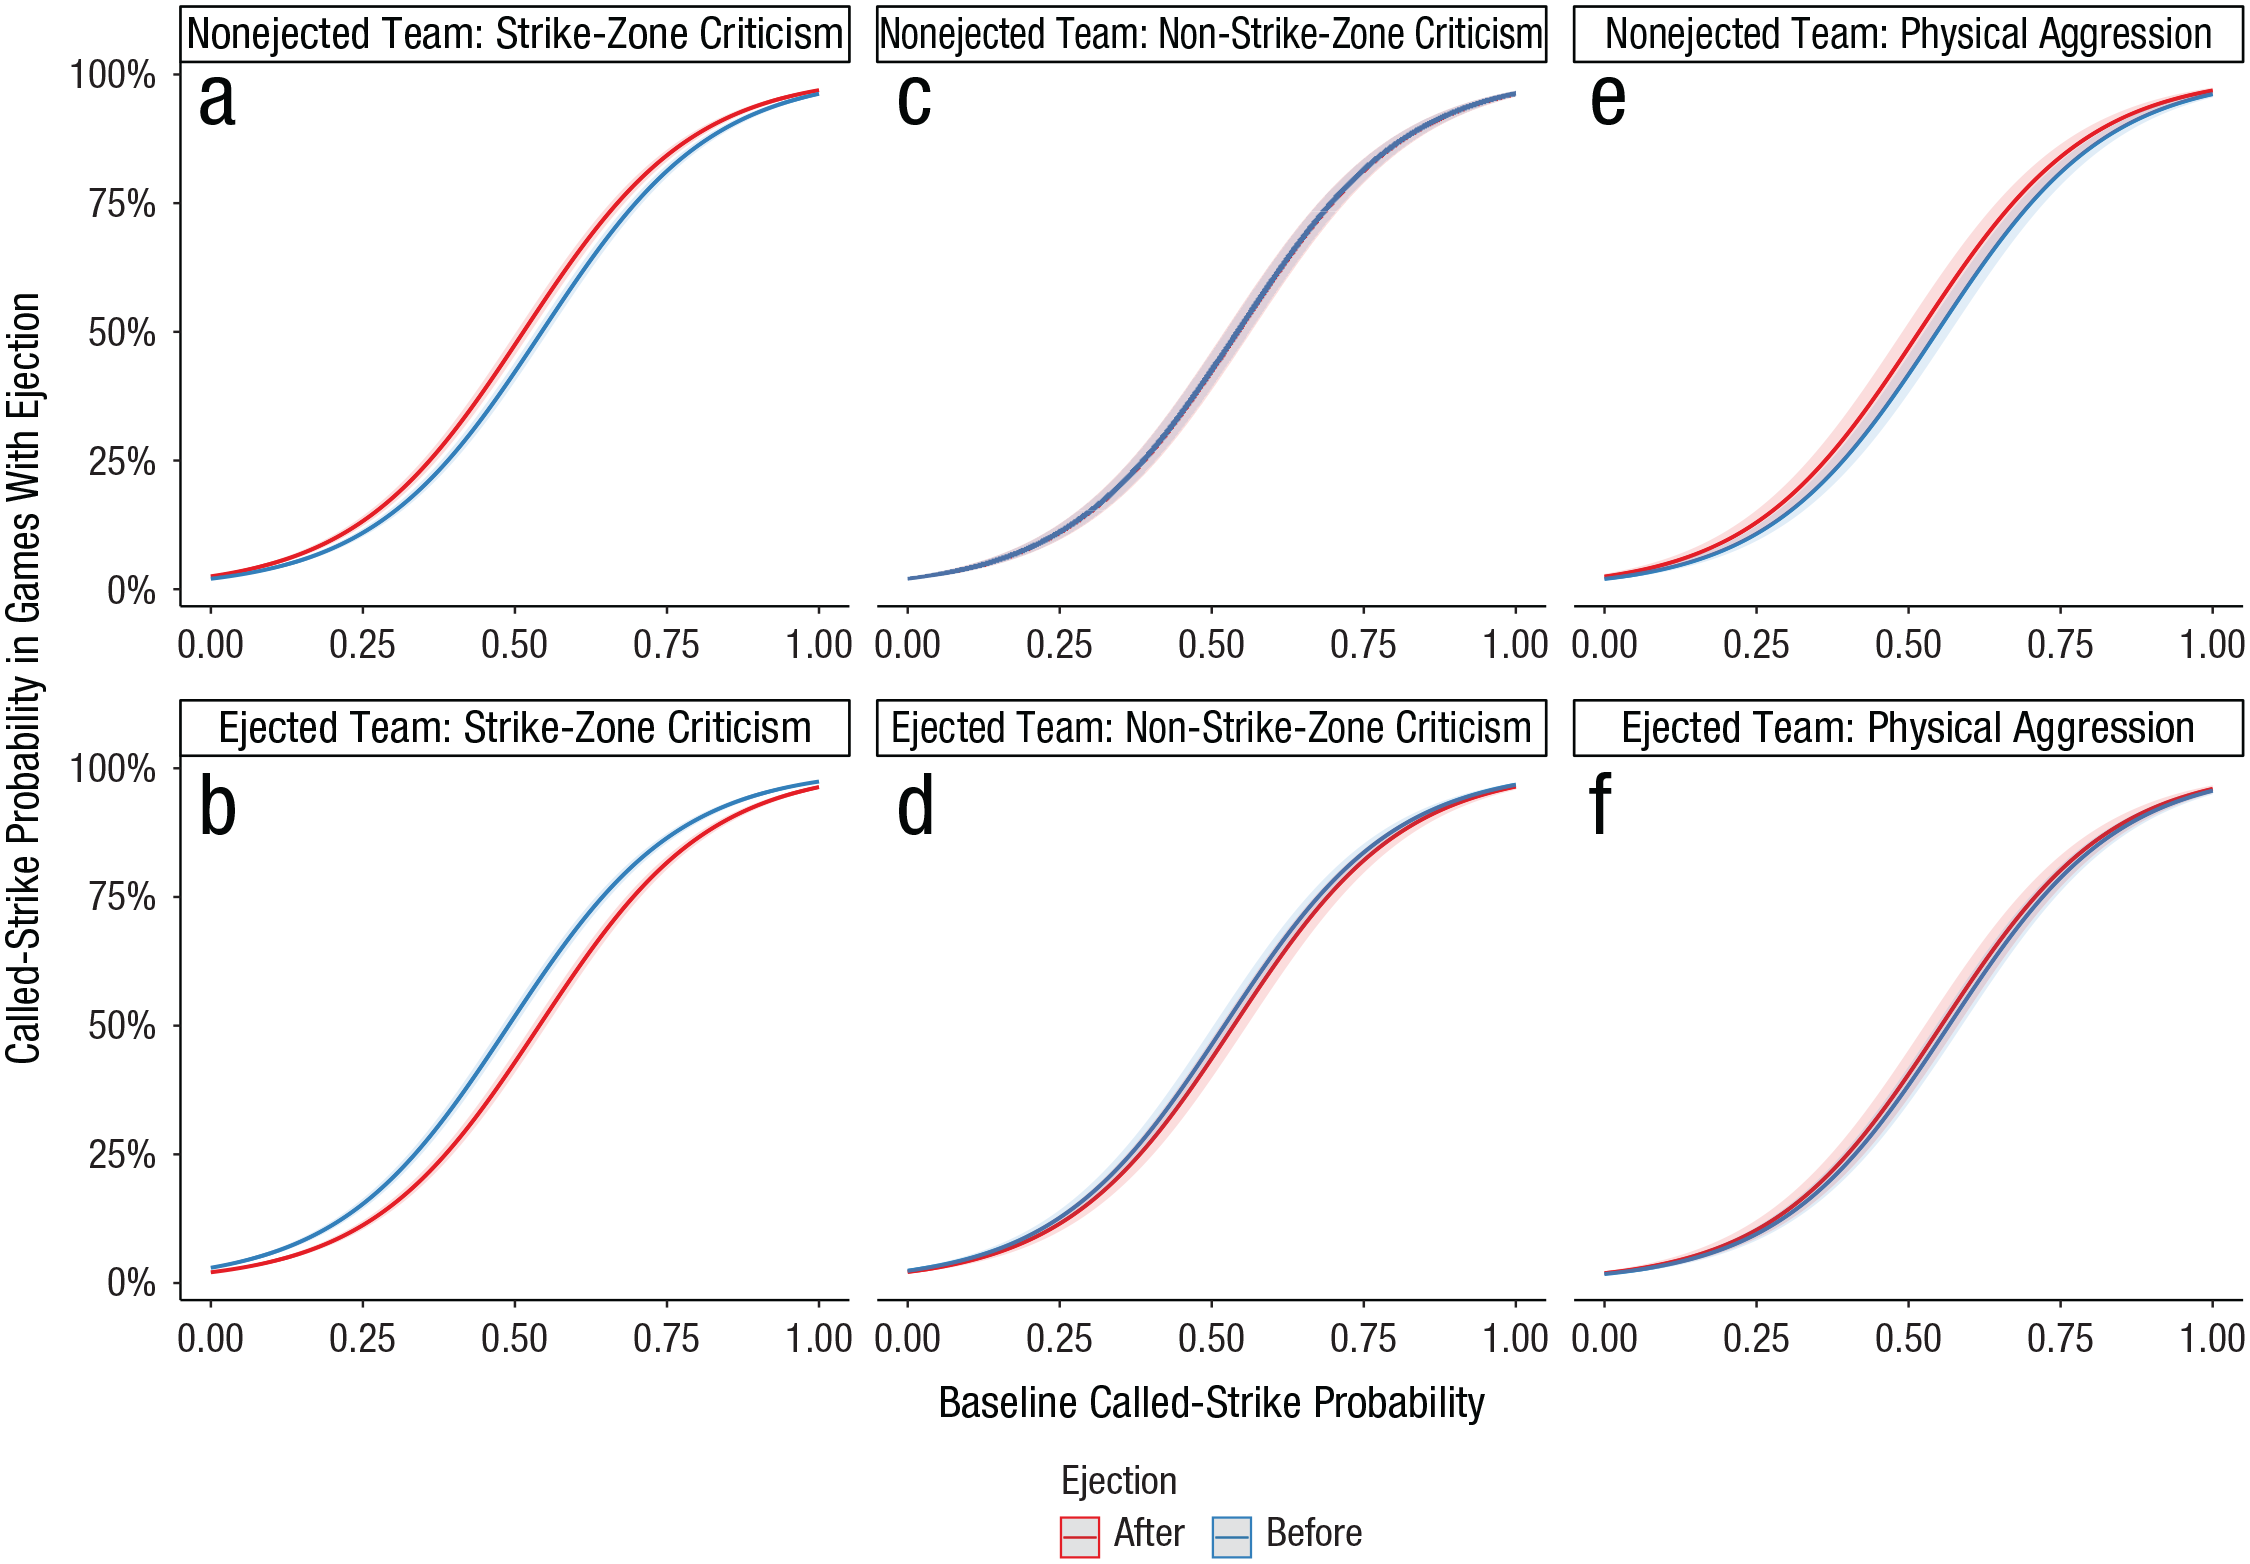
Called-strike probability in games with ejections as a function of the baseline probability observed in games without ejections and the reason for the ejection (n = 153,255).
Model 3: impact of the ejected individual’s role
We used the strike-zone excessive-criticism ejection data to generate a third model to evaluate the impact of the ejected person’s role (player, coach) on umpire decisions. Players are directly involved in the action and represent the most important members of a team. Coaches also play a crucial role, but they are not as important as players. To isolate the impact of the unique role of the ejected person, we included only pitches from games in which a single ejection for verbal abuse related to the strike zone was recorded (n = 103,913). Supplemental Table S7 presents the estimates of Model 3, again fitted with and without a triple interaction, this time between the ejection event, the team that lost someone to ejection (ejected team), and the role of the ejected individual. The triple interaction significantly improved the model compared to the model with only an interaction between ejection event and the team that suffered the ejection, likelihood ratio test χ2(4) = 13.56, p = .009. Compared to ejected players, the interaction effect of coach ejection on the ejection event per ejected team was statistically significant (β = 0.78, 95% CI = [0.63, 0.96], p = .021). Post hoc analysis (Supplemental Table S8) illustrates, for all roles of ejected individuals, a significant decrease in the likelihood of pitches being considered strikes after an ejection for the offending team (players: OR = 0.666, 95% CI = [0.577, 0.768], p < .001; coaches: OR = 0.576, 95% CI = [0.430, 0.771], p < .001). For the opponent, significant increases in the likelihood of pitches being called strikes after the ejection are present for coaches’ ejections (OR = 1.398, 95% CI = [1.211, 1.613], p < .001) but not for players’ ejections (OR = 1.128, 95% CI = [0.982, 1.295], p < .1138). Comparisons between teams indicate that umpires tend to disadvantage the offending team over the opposing team prior to the ejection for both roles (players: OR = 1.367, 95% CI = [1.221, 1.531], p < .001; coaches: OR = 1.665, 95% CI = [1.455, 1.905], p < .001). After the ejection of a player or coach, umpire decisions significantly disadvantage the opposing team compared to the offending team (players: OR = 0.835, 95% CI = [0.713, 0.979], p = .0185; coaches: OR = 0.835, 95% CI = [0.713, 0.979], p < .001). Results, presented in Figure 3 and Supplemental Figure S17, differ only in the significant increase in the number of strikes called on the team that did not experience an ejection (nonejected team) after a coach’s ejection, which is not the case for a player’s ejection. These findings do not support the assumption that the umpire tries to compensate for the importance of the ejected person, and they are even counterintuitive to what one would expect under this hypothesis.
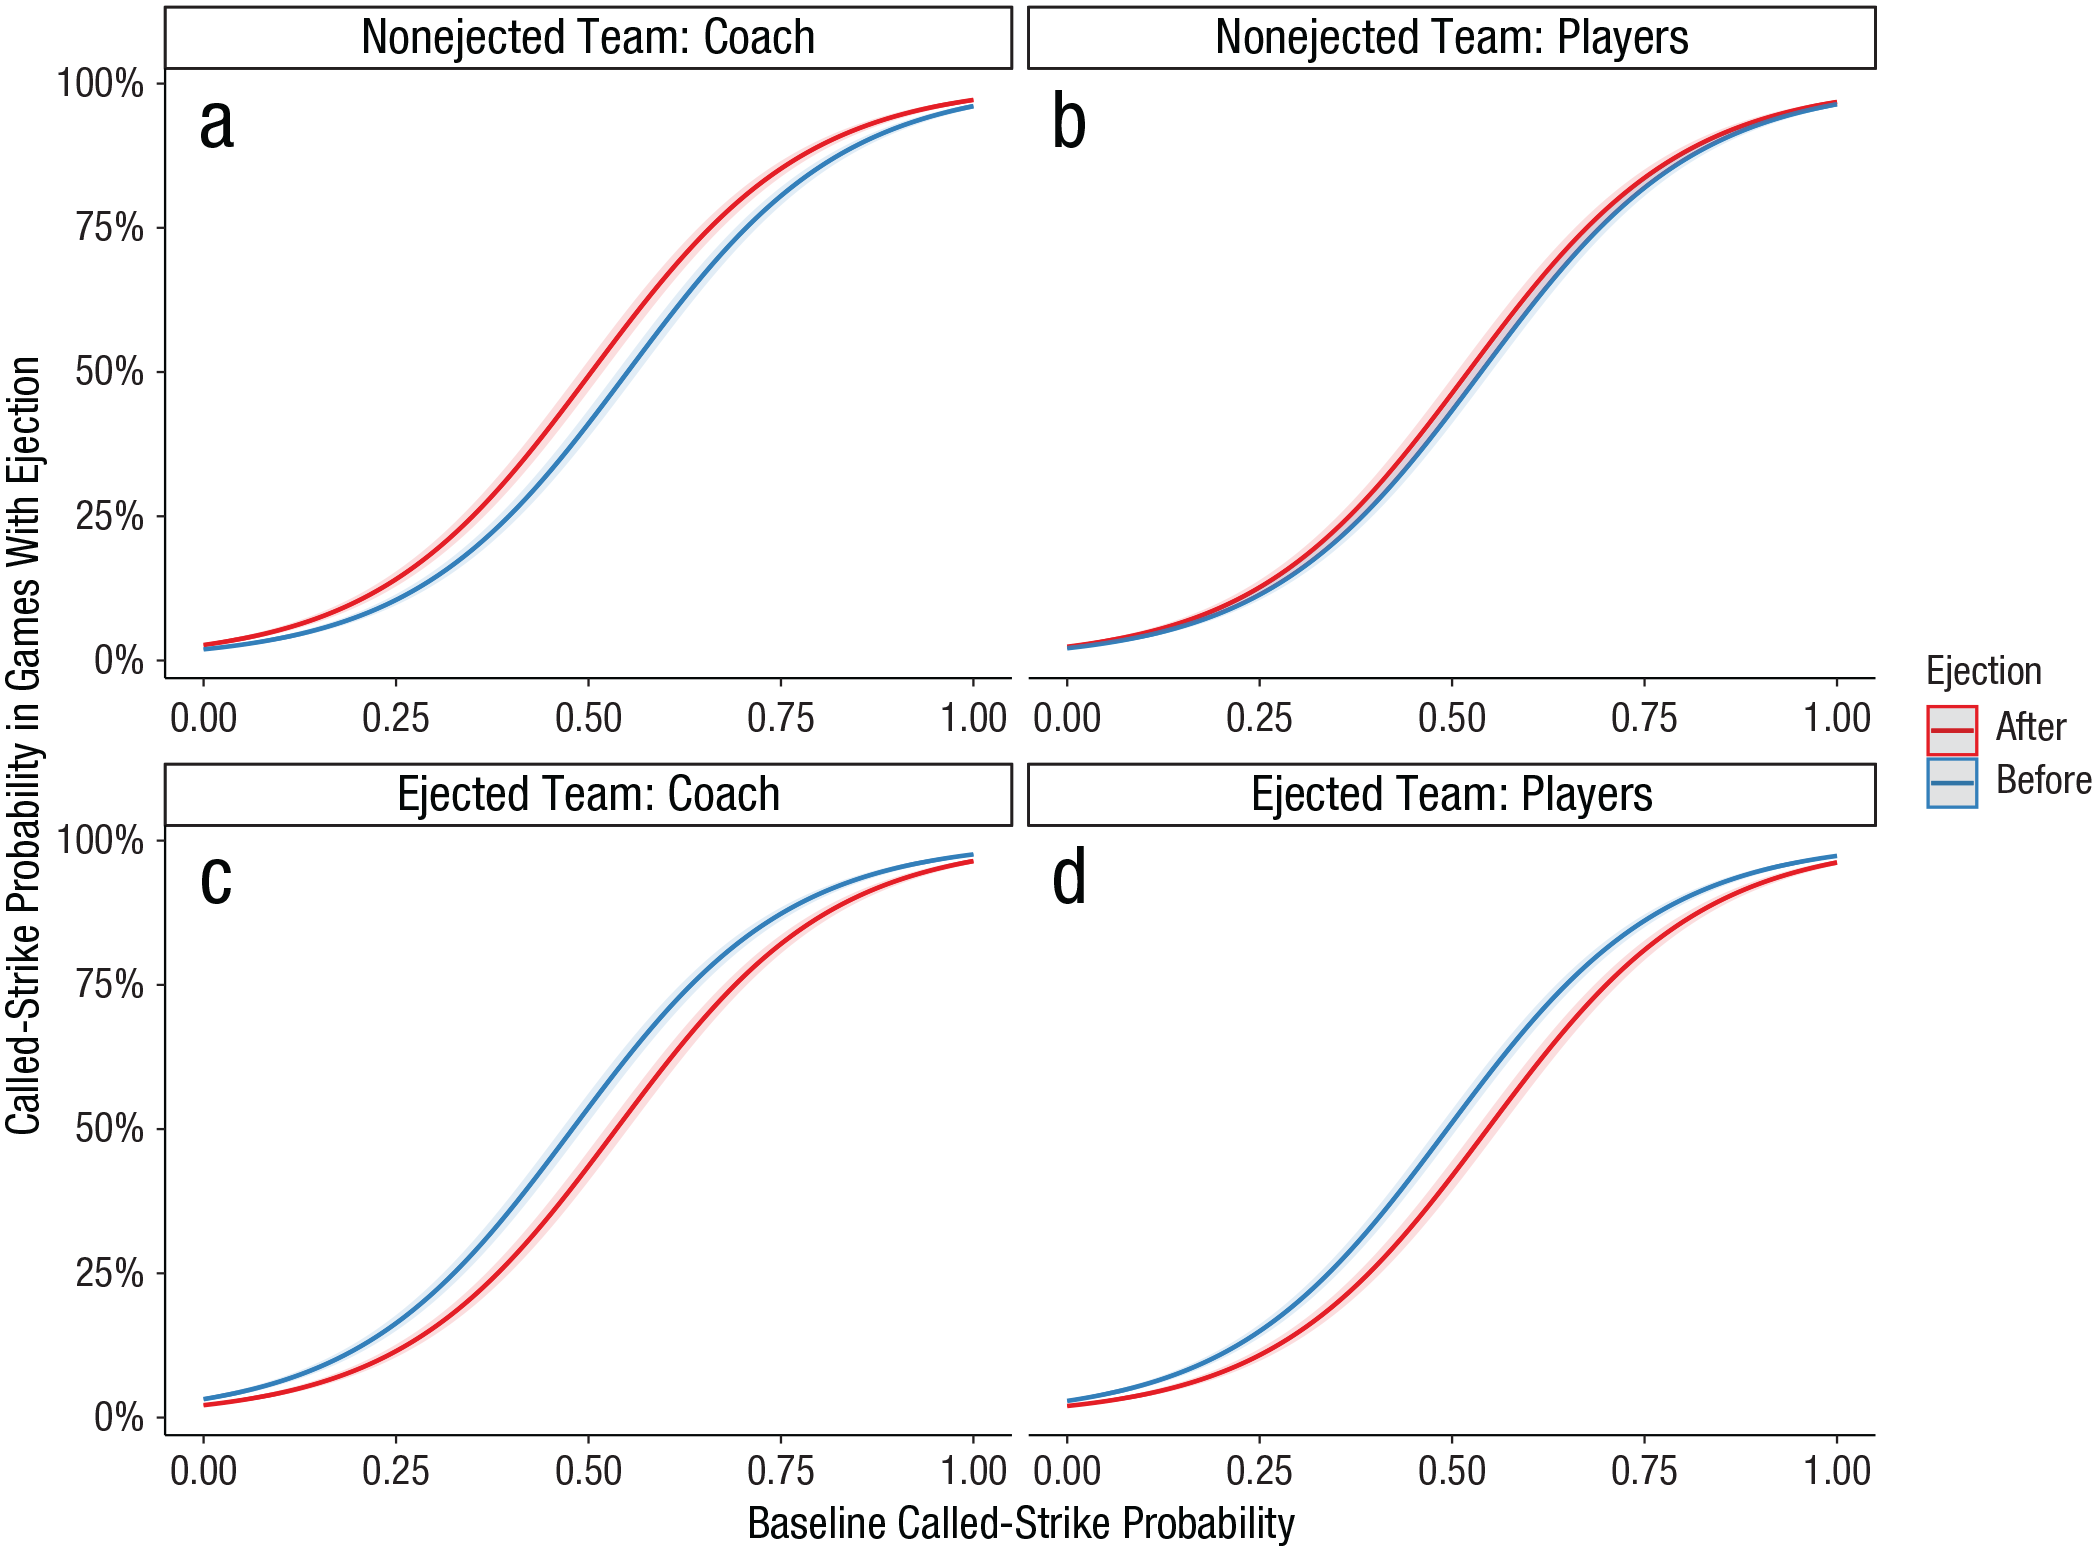
Called-strike probability in games with ejections as a function of the baseline probability observed in games without ejections and the team member ejected (n = 103,913).
Model 4: impact of the ejected player’s all-star status
To measure the impact of ejected-player characteristics (Models 4 to 7), only pitches from games in which a single player was ejected for excessively criticizing strike-zone-related decisions were included in the analyses (n = 57,223). Unlike Models 1, 2 and 3, home-team advantage was not included in these models because this control variable was no longer statistically significant and decreased the fit of the models (Supplemental Table S9). Supplemental Table S10 presents the estimates of Models 4 to 7, fitted with a triple interaction between the ejection event, the team that lost someone to ejection, and the measured player feature. All those models were compared to the same reduced model including a significant interaction between the ejection event and the team that lost someone to ejection (β = −0.49, 95% CI = [−0.63, −0.34], p < .001).
All-star status is the first feature to be included (Model 4). Each year, the best players in the league compete in the All-Star Game. The rules for selection change from year to year, but the selection of participating players is usually made by a combination of votes from fans, players, managers, the commissioner’s office, or media representatives. The players selected are among the elite in their sport. Any player who has participated in the All-Star Game at least once is considered an all-star in our sample. This factor (not an all-star = 0; all-star = 1) was included in an interaction with the ejection event and the ejected team (Supplemental Fig. S18). The triple interaction (β = −0.02, 95% CI = [−0.17, 0.13], p = .779) did not significantly improve the model compared to the model with only an interaction between ejection event and the team that lost someone to ejection, likelihood ratio test χ2(4) = 1.63, p = .803. The single effect of all-star status is also not significant (β = 0.03, 95% CI = [−0.04, 0.09], p = .400).
Model 5: impact of the ejected player’s All-Star Game appearances
After the all-star status, we tested the number of appearances at All-Star Games (Model 5). The best players will usually participate in several All-Star Games, in contrast to players who may have had a particularly good season but are not among the elite on a regular basis. Players with more appearances at this event are widely recognized as being more successful. We included the number of All-Star Game appearances as a continuous variable in an interaction with the ejection event and the ejected team (Supplemental Fig. S19). Again, the triple interaction (β = 0.03, 95% CI = [−0.11, 0.17], p = .674) did not significantly improve the model compared to the model with only an interaction between ejection event and the ejected team, likelihood ratio test χ2(4) = 1.35, p = .852. In addition, the effect of the single variable (i.e., all-star appearances) was not significant (β = 0.03, 95% CI = [−0.04, 0.10], p = .374).
Model 6: ejected individual experience impact
Next, we included an interaction with the number of years of experience of the ejected players (Model 6). Usually, to stay in the best baseball league in the world, an individual’s performance must be quite valuable to his team. Compared to players who cannot secure a regular spot on a team’s roster or who are relatively new to MLB and have not yet proven themselves, players who have more years in the league have the status of established players. We included the number of years played in MLB as a continuous variable, again in an interaction with the ejection event and the ejected team (Supplemental Fig. S20). The triple interaction (β = −0.06, 95% CI = [−0.20, 0.08], p = .428) did not significantly improve the model compared to the model with only an interaction between ejection event and ejected team, likelihood ratio test χ2(4) = 3.53, p = .473. The years-of-experience single effect was not significant (β = 0.001, 95% CI = [−0.07, 0.07], p = .976).
Model 7: impact of the ejected individual’s performance
Finally, we fitted Model 7 by including a triple interaction between the ejection event, the ejected team, and the performance level of ejected players as measured by WAR. As we indicated earlier, WAR is a measure that summarizes a player’s contributions to his team in one all-encompassing statistic; it acts as a good performance index. The higher a player’s WAR is, the more he contributes to his team’s success. We included the player’s WAR as a continuous variable (Supplemental Fig. S21). As with the previous player characteristics, the triple interaction (β = −0.02, 95% CI = [−0.16, 0.12], p = .783) did not significantly improve the model compared to the baseline model, likelihood ratio test χ2(4) = 2.23, p = .694. Thus, the single effect of WAR is not significant either (β = 0.03, 95% CI = [−0.03, 0.10], p = .329).
In summary, none of the four player characteristics added to the reduced model suggest an influence on umpire behavior, leading us to infer that umpires do not actively seek to compensate for the importance of an ejected player. This further solidifies our main hypothesis.
Discussion
Strong negative emotions generated by the perception of an unfair decision may lead people to become verbally aggressive. Our study indicates that although verbal aggression can have its costs—such as ejection from a baseball game—it can also have positive consequences for the in-group (here, the aggressor’s team) by influencing the umpires’ decision-making in a favorable manner. Our findings suggest that verbal aggression, under certain circumstances, can help restore what could be perceived as justice.
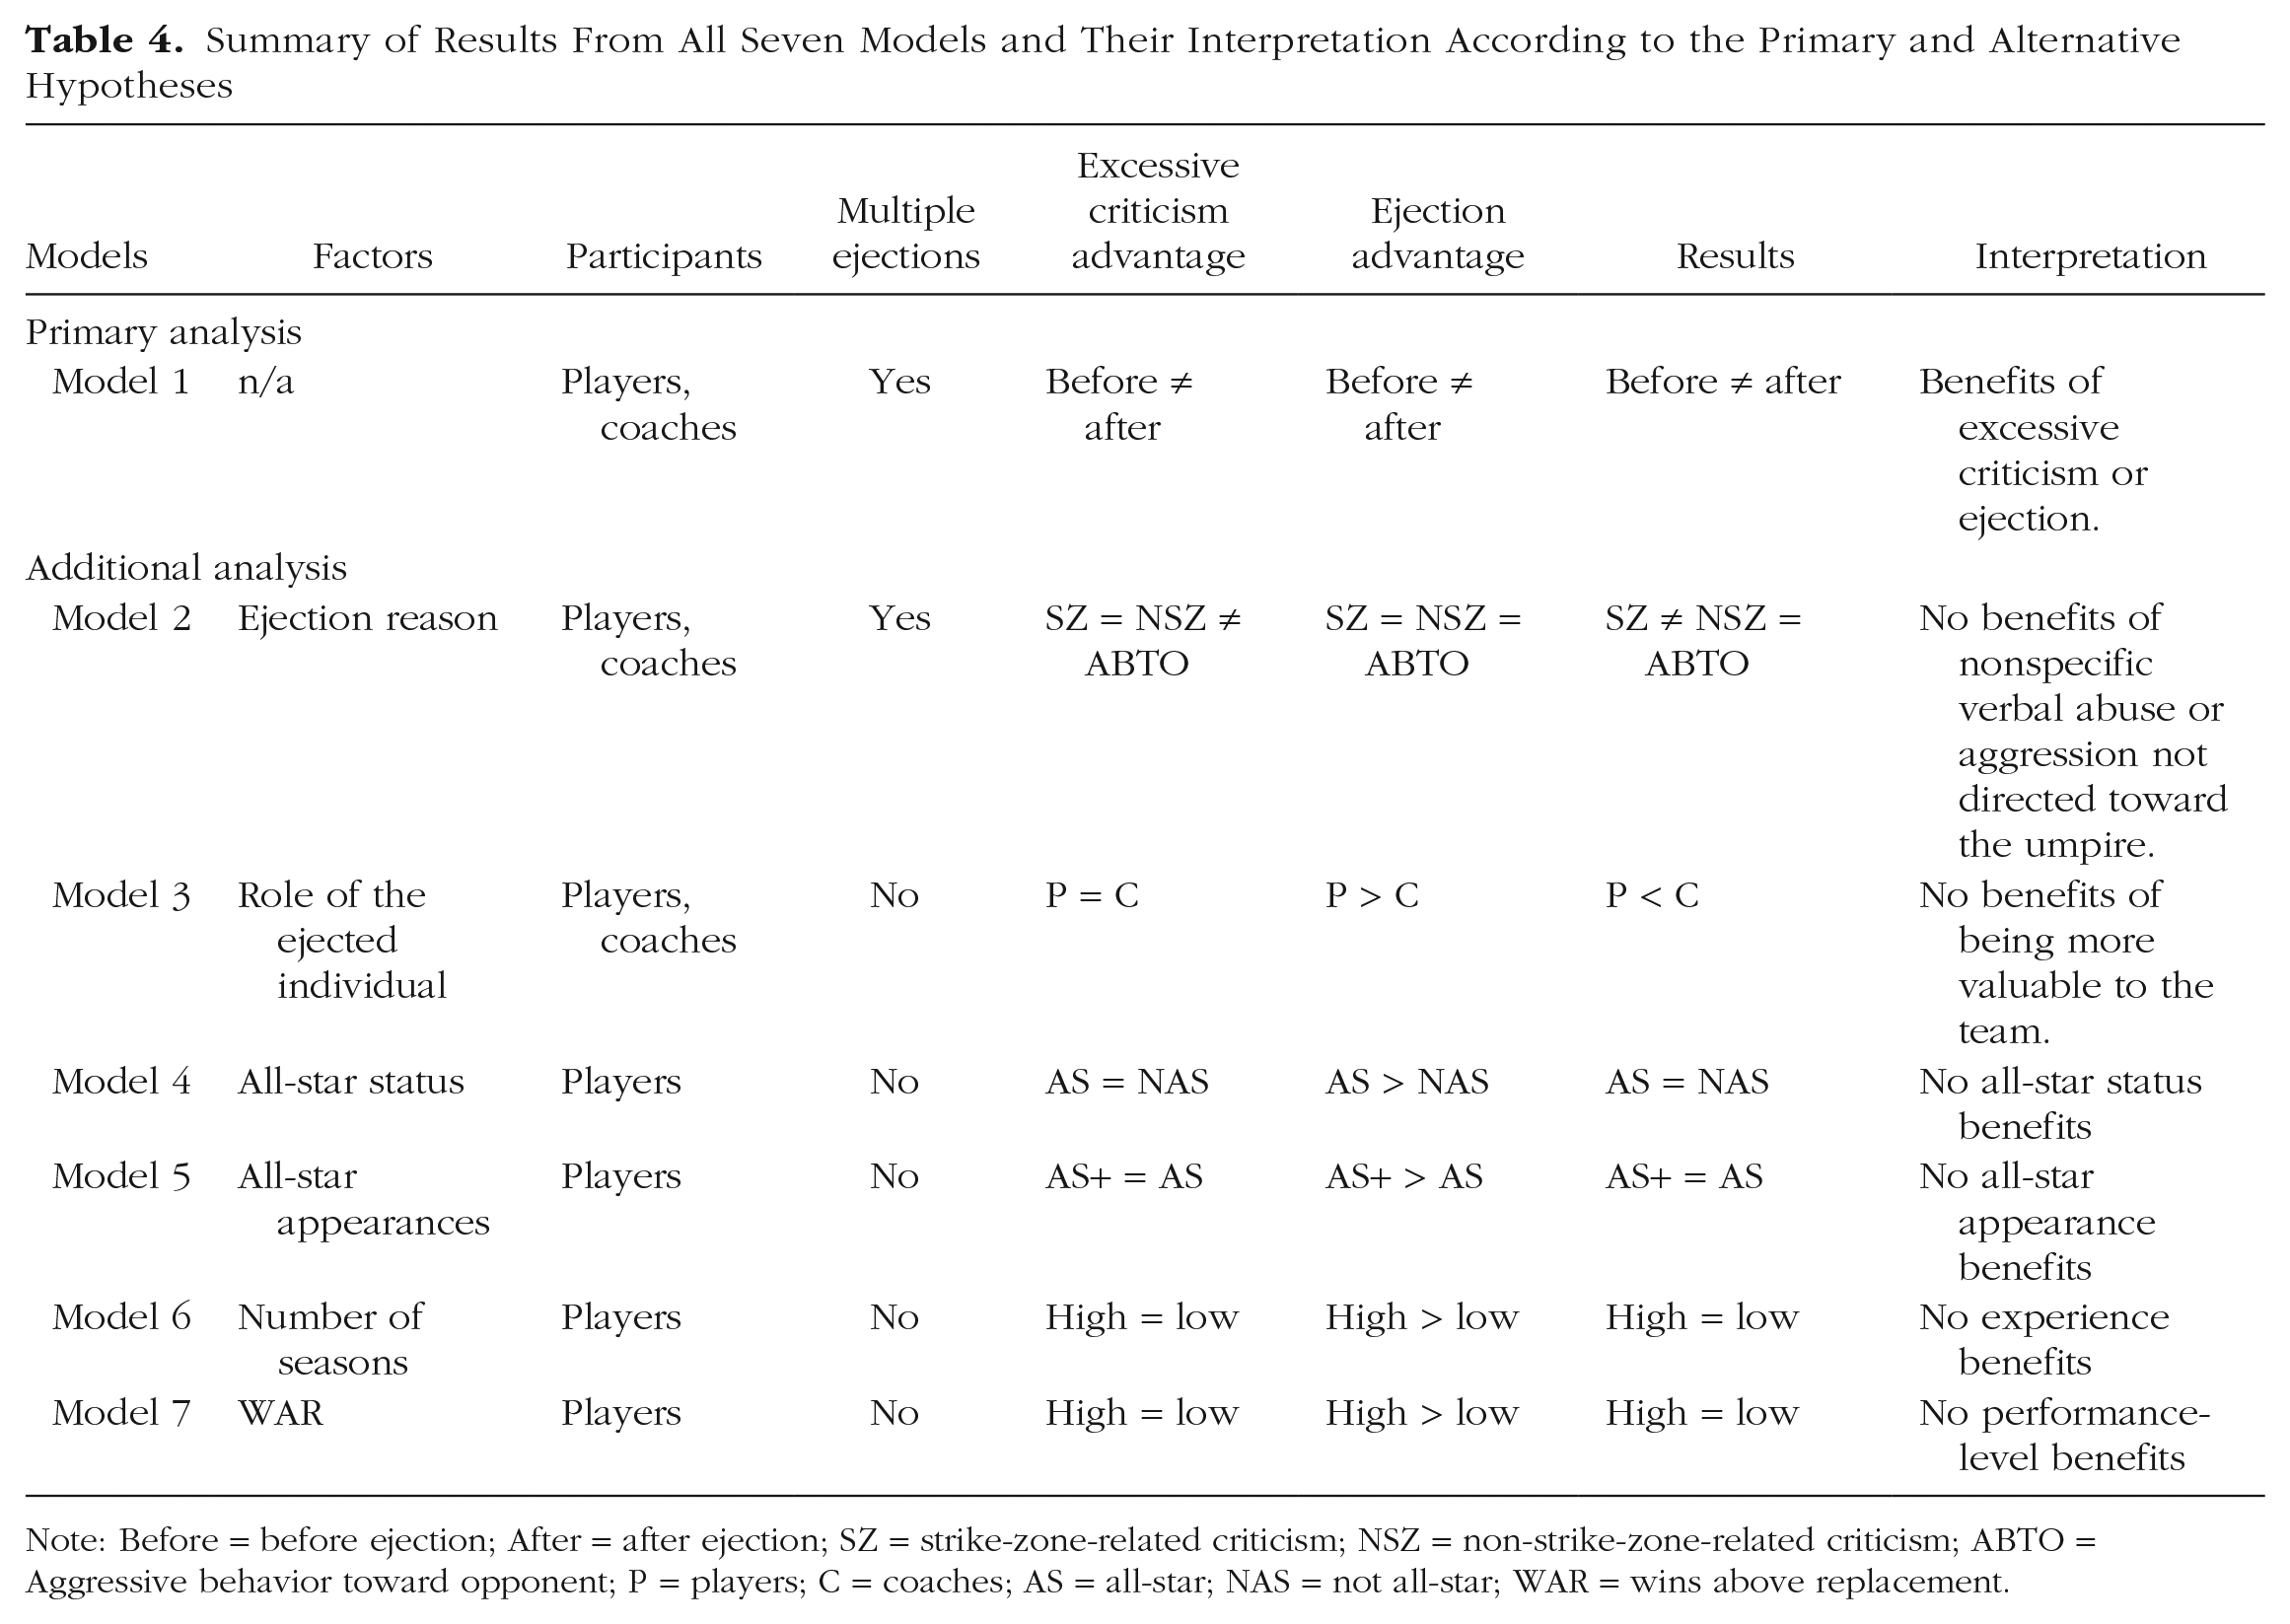
Umpires who experience verbal abuse tend to alter their decision-making to restore a perceived fairness. They do so by making decisions that benefit the team that expressed a sense of unfairness in a verbally abusive manner. This change in decision-making is observable only when the object of criticism is specific, because ejections that are not due to strike-zone criticism do not generate an advantage for the offending team in terms of strike-zone calls. The umpires’ change in behavior does not appear to be an attempt to compensate the team for the loss of the ejected individual. Indeed, the relative importance of the ejected person does not influence the decisions of the umpires who were overly criticized. Coaches’ ejections can generate a slight additional benefit compared to players’ ejections, even if they are less valuable to their team. Players of all skill, recognition, and experience levels generate similar benefits for their team when they are ejected. Thus, as shown in Table 4, our results both support the hypothesis that verbal aggression influences MLB umpires’ decision-making and also undermine the alternative hypothesis that umpires seek to balance the negative consequences brought on by the loss of a team member.
Summary of Results From All Seven Models and Their Interpretation According to the Primary and Alternative Hypotheses
Note: Before = before ejection; After = after ejection; SZ = strike-zone-related criticism; NSZ = non-strike-zone-related criticism; ABTO = Aggressive behavior toward opponent; P = players; C = coaches; AS = all-star; NAS = not all-star; WAR = wins above replacement.
Umpires are first and foremost human beings, which leads them to perceive verbal aggression as a significant social punishment. An attempt to prevent this form of sanction could explain the adjustment in their decision-making. Indeed, our findings support social-information processing theory, which suggests that aggressively criticized individuals seek to conform to their aggressor’s viewpoint in order to avoid further punishment (Germar et al., 2016; Pryor et al., 2019; Rilling et al., 2008; Rilling & Sanfey, 2011; Sanfey, 2007; Schiebener & Brand, 2015; Starcke & Brand, 2012; Theriault et al., 2021; Wasylyshyn et al., 2018). No statistical model supports the theory that verbal aggression alters the relationship with the aggressor and reduces the likelihood that the victim will conform to the aggressor’s viewpoint (Gass & Seiter, 2018; Guerin, 2003; Perloff, 2020; Rancer & Avtgis, 2006). Therefore, our study adds to existing knowledge about the possible effects of using verbal aggression in response to perceived injustice.
Our results are derived from a specific ecological environment, which generates certain limitations that must be acknowledged. Among other things, we find that the perceived injustice of the verbal abuser is often justified, as the umpires’ decisions prior to the ejection are truly disadvantageous to the complainant’s team. Laboratory studies controlling for this factor will be required to determine whether verbal aggression loses its effectiveness when the alleged injustice is unfounded. Also, MLB umpires are considered to be the best in their discipline and are the most qualified to realize their mistakes (Mills, 2017). Lower-level umpires may be less able to realize the injustices caused by their decisions and may react differently. Unfortunately, we had to limit ourselves to MLB umpires, given the lack of available data at lower levels (e.g., the reasons for ejections at the MLB level are listed). This is not the case in other professional and minor leagues. Access to this data, combined with the pitch-by-pitch data already available for several lower-level leagues, would allow other researchers to generalize our results. At present, it is prudent to exercise caution when extrapolating the results observed within our specific context. The findings may vary in other sporting disciplines, at different levels of competition, or when involving younger or less experienced officials.
Although an ecological environment generates certain limitations, it also offers undeniable strengths for our study. First, the verbal aggression toward umpires is genuine and stems from a real alleged injustice. Second, it is perceived by the umpires as truly unacceptable behavior, because they judge that the offending individual has crossed a line and deserves to be ejected from the game. Laboratory-controlled criticism may not have the same impact on the umpires, who may interpret and process the aggression differently. Third, our study relies on a significant number of observations, collected from a sophisticated and accurate pitch-tracking system. This data provides an objective measure with which we can assess umpires’ decision-making. Also, with such statistical power, it can be assumed that the additional analyses that were undertaken would have provided evidence for the alternative hypothesis, if it had been well founded. Fourth, the statistical models controlled for the many factors known to influence MLB umpires’ decision-making, allowing us to isolate the impact of excessive criticism. Our set of additional analyses allows for the inclusion of several variables that have the potential to support an alternative hypothesis—that is, that the umpire is influenced by his decision to eject someone. Results of these numerous analyses have added weight to the initial hypothesis that verbal aggression is responsible for changing umpire behavior (Supplemental Table S11).
Although our findings support the effectiveness of a behavior that is subject to reprimand, in this case verbal aggression, they provide valuable insight into the impact of such behavior on an authority figure’s decision-making. In the context presented here, each baseball sequence must be judged individually and must not influence the umpires’ future decisions. Once a person whose verbal behavior exceeds the acceptable limits is ejected, it is the umpire’s duty to keep issuing impartial decisions, which should in no way be biased by past events. Our results suggest that the decision-making of umpires is altered following verbal aggression, and they also suggest that there is an impact on the fairness of the game by giving an advantage to the team that previously failed to respect the rules. This bias in human decision-making contributes to the debate over the use of advanced technology to assist MLB home-plate umpires during games. A new policy introducing the use of the pitch-tracking system to support strike-zone decisions could not only help improve the fairness of the game but also reduce verbal aggressions against umpires.
Outside the sporting environment, other decision makers could benefit from our results to improve the fairness of their decisions (see Supplemental Material S2 for a generalization of the results to other authority figures). Decision makers need to be aware that after being aggressively criticized, their future decisions may become unfair if the decision maker becomes more lenient toward the aggressor’s in-group. This could be the case regardless of whether the decision makers overturn the decision that has been excessively criticized. For example, police officers who should cite drivers for an infraction may opt not to; judges may grant reduced sentences to criminals; or business managers may accept employees’ requests for time off or additional benefits. Education geared toward understanding the potential impact of excessive criticism on one’s decision-making may be beneficial for people in positions of authority, especially to help them make informed, rational, and fair decisions. By limiting the advantage provided to the verbally aggressive individuals’ in-group, decision makers could help decrease the frequency of aggressive behavior and unfair decisions. Our findings should therefore be used to better understand the impact of verbal aggression in order to decrease its use, not to encourage its spread.
Supplemental Material
sj-pdf-1-pss-10.1177_09567976241227411 – Supplemental material for Verbal Aggressions Against Major League Baseball Umpires Affect Their Decision Making
Supplemental material, sj-pdf-1-pss-10.1177_09567976241227411 for Verbal Aggressions Against Major League Baseball Umpires Affect Their Decision Making by Joël Guérette, Caroline Blais and Daniel Fiset in Psychological Science
Footnotes
Transparency
Action Editor: Lasana Harris
Editor: Patricia J. Bauer
Author Contributions
References
Supplementary Material
Please find the following supplemental material available below.
For Open Access articles published under a Creative Commons License, all supplemental material carries the same license as the article it is associated with.
For non-Open Access articles published, all supplemental material carries a non-exclusive license, and permission requests for re-use of supplemental material or any part of supplemental material shall be sent directly to the copyright owner as specified in the copyright notice associated with the article.