
Abstract
Benefiting from a cooperative interaction requires people to estimate how cooperatively other members of a group will act so that they can calibrate their own behavior accordingly. We investigated whether the synchrony of a group’s actions influences observers’ estimates of cooperation. Participants (recruited through Prolific) watched animations of actors deciding how much to donate in a public-goods game and using a mouse to drag donations to a public pot. Participants then estimated how much was in the pot in total (as an index of how cooperative they thought the group members were). Experiment 1 (N = 136 adults) manipulated the synchrony between players’ decision-making time, and Experiment 2 (N = 136 adults) manipulated the synchrony between players’ decision-implementing movements. For both experiments, estimates of how much was in the pot were higher for synchronous than asynchronous groups, demonstrating that the temporal dynamics of an interaction contain signals of a group’s level of cooperativity.
Many interactions require people to contribute resources to some public good for a mutual benefit to be shared among those involved (Fehr & Gächter, 2000; Kurzban & Houser, 2001). This ranges from relatively low-stakes interactions, such as cooking a meal with a partner, to high-stakes interactions, such as investing in a new business venture with peers. Such cooperative activities are inherently risky, as receiving a fair return on effort in a cooperative interaction requires that one’s contributions are met with similar contributions from other group members (Emerson, 1987; Fischbacher et al., 2001; Fischbacher & Gächter, 2010). Thus, contributing to a public good requires judging how cooperatively members of the group are likely to act.
How do we make such judgments about the cooperativeness of a group? Knowledge about the group members, such as their social identity or their values and norms, may provide a basis for estimating group cooperativeness, as may knowledge about past interactions (Everett et al., 2016; Fehr & Fischbacher, 2004; Tajfel, 1974). Physical cues about members of a group, such as the width or expressiveness of their faces or the pitch of their voices, influence judgments of cooperativeness (Stirrat & Perrett, 2010; Tognetti et al., 2020), and the size of the group itself may also contribute (Wu et al., 2020). Behavioral cues indicating whether group members cooperate unconditionally or after weighing up their options may also influence judgments of cooperativeness (Hoffman et al., 2015; Jordan et al., 2016).
One source of information that is less well understood with respect to its influence on the perception of group cooperation concerns the temporal dynamics between group members: Specifically, the synchrony between individuals’ actions reflects how much rapport they share and predicts how prosocial they are toward each other (Hove & Risen, 2009; Michael et al., 2020; Wiltermuth & Heath, 2009). This may be because synchrony reflects similarity between interaction partners (Miles et al., 2009; Reddish et al., 2013), information exchange between individuals (Badino et al., 2014; McEllin & Michael, 2022), or willingness to make the effort to adapt to one’s partner for the good of the interaction (McEllin et al., 2023). Synchrony also influences third-person judgments of the interpersonal relations between interacting individuals: Those whose actions are synchronized are perceived as sharing rapport and as cohesive and unified (Fessler & Holbrook, 2016; McEllin et al., 2020; Miles et al., 2009).
Although it has been demonstrated that individuals who have acted in synchrony with others are more willing to invest into a common pool (Good et al., 2017; Wiltermuth & Heath, 2009), it is unknown whether observing synchronous group behavior raises expectations about group members acting in line with the collective interest. A prominent model for interactions in which individual and collective interests need to be balanced is the public-goods game, in which individual members of a group can choose to either pool their own resources for a mutual benefit or keep their resources to themselves. This game measures the extent to which individuals within a group behave cooperatively or selfishly and may act as a model for both small-scale and large-scale cooperative interactions (Betsch et al., 2013; Olson, 1965; Milinski et al., 2006). The first aim of our study was to investigate whether the synchrony by which group members made their contributions shapes judgments of how cooperatively a group behaved when investing in a public-goods game. Such a finding would have both theoretical and practical implications, showing that the temporal dynamics of group actions can shape expectations of behavior concerning the collective interest.
Synchrony can refer both to the time individuals take to reach a decision and to the timing of the actions they perform. So far, previous studies have focused on synchrony of actions (e.g., walking, dancing, singing, or performing hand movements in synchrony; Lakens & Stel, 2011; Miles et al., 2009). The effects of arriving at a decision in synchrony have not been addressed. We decided to investigate synchrony both during decision-making and decision-implementing movements because synchrony during these two phases separately may carry different signals with respect to the cooperativity of the group. In particular, synchrony in the decision-making phase of a cooperative action (i.e., planning a particular course of action, such as deciding how much money to contribute to a common pot) may signal aligned social preferences or similarity with respect to the level of deliberation behind contributions (Bear & Rand, 2016; Miles et al., 2009). Synchrony in the movement phase of a cooperative action (i.e., following through with a particular course of action, such as actually putting money into a common pot) may signal confidence (Slepian et al., 2013) or cohesion and unity with respect to contributions (Fessler & Holbrook, 2016). Our second aim was to investigate whether effects of synchrony upon judgments of cooperation in a public-goods game generalize across the decision-making and movement phases of a cooperative action.
Statement of Relevance
Many of the collective challenges people face (both in their ancestral pasts and today) require them to pool resources for the public good—that is, cooperate. To behave efficiently in a cooperative interaction (or to decide whether to join an interaction in the first place), they need to judge the effectiveness of the group’s cooperative efforts, which is particularly challenging considering that they may not have direct access to the material outcomes of such interactions (i.e., they may not see individual group members’ contributions to the public good). The current study demonstrates that the synchrony by which a group plans and executes contributions to a public good influence judgments of how cooperatively the group acted. This highlights the importance of action dynamics for understanding cooperation and provides new avenues for interventions that increase individual contributions (e.g., sustainable behavior) toward small- and large-scale real-life public goods (e.g., the environment).
Participants watched animations representing groups of four individuals playing a version of the public-goods game in which they decided how much (from 0–10 points) to put into a virtual envelope (i.e., the decision-making phase of the cooperative action) before using their computer mouse to drag this envelope to a common pot in the middle of the screen (i.e., the movement phase of the cooperative action; see Fig. 1). In Experiment 1, we manipulated the synchrony of the decision phase of the cooperative actions (i.e., synchrony and asynchrony between the group decision times), and in Experiment 2, we manipulated the synchrony of the movement phase of the cooperative actions (i.e., synchrony and asynchrony between the group movements). After watching each animation, participants estimated the pot total—that is, how many points they thought were in the public pot (from 0–40 points) as a measure of how cooperative participants believed the group to be. To explicitly draw participants’ attention to the synchrony of the group, we instructed participants in Experiments 1a and 2a to rate how coordinated they thought the groups were, using a 7-point scale. Experiments 1b and 2b investigated whether any effects of synchrony on perceived cooperation generalize to situations in which coordination is not explicitly highlighted. Our key prediction (for both Experiments 1 and 2) was that if synchrony is used to make judgments about the cooperativeness of a group, estimates of the pot total would be higher for groups whose members contributed synchronously rather than asynchronously.
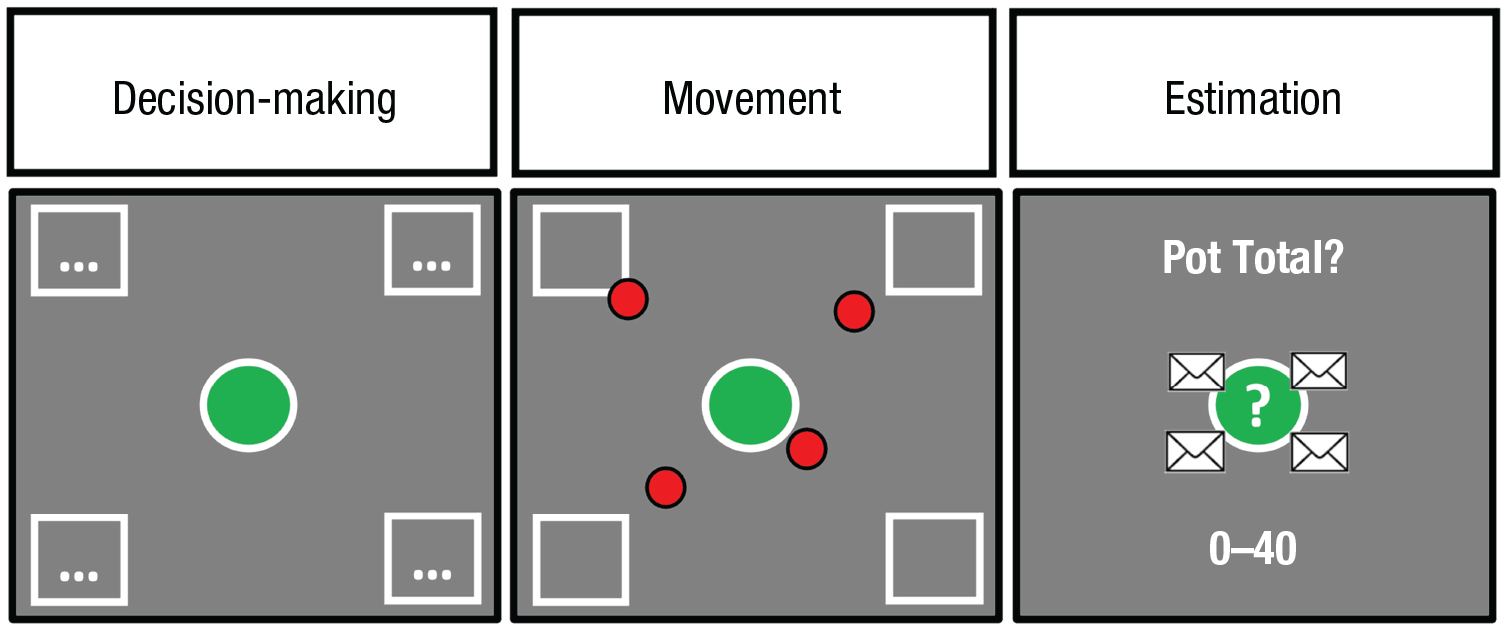
Schematic overview of experimental task. At left is shown the decision-making phase (presented to participants in Experiment 1a and 1b); in the center is shown the movement phase (presented to participants in Experiment 2a and 2b); and at right is shown the end of the trial and the estimation phase (as in all experiments).
Open Practices Statement
The data and materials used in this study are available on the Open Science Framework at https://osf.io/64jye/. All experiments were preregistered: Experiment 1a, https://aspredicted.org/vh8kg.pdf; Experiment 1b, https://aspredicted.org/ay3yk.pdf; Experiment 2a, https://aspredicted.org/jz2nc.pdf; and Experiment 2b, https://aspredicted.org/a2wc9.pdf.
Experiment 1
Experiment 1a: method
Participants
A G*Power (Version 3.1; Faul et al., 2009) analysis using pilot data from 20 participants for a Bonferroni-corrected (for two comparisons) one-sample t test (d = 0.45, α = .05, p = .95) determined that we should recruit 67 participants. Thus, we decided to recruit 68 participants (after replacement of excluded participants) to ensure equal counterbalancing. Using the Prolific recruitment platform (www.prolific.co), we recruited 71 participants with a mean age of 37.11 years (SD = 12.77 years; 24 male, 47 female). Three recruits were removed from the analysis because they did not meet our exclusion criteria.
Apparatus and stimuli
Our study was hosted on the Pavlovia online hosting platform and was programmed using JavaScript, a combination of PsychoJS (www.psychopy.org) and custom written functions. Stimuli size was defined using standard height units relative to the screen size.
Public-goods game
Participants were shown players in a four-player public-goods game. Players’ initial endowment was 10 points, which they could choose to keep for themselves or invest into the public pot. The points in the pot were doubled and shared equally between the four players. Participants were informed that each player’s income for one round was dependent on the number of points held at the end of that round (i.e., the number of points kept plus one quarter of the doubled pot total), which we assumed led players to believe that the points translated to a real payoff for the players. We believed this instruction was sufficient to make participants believe that the welfare of each player was at stake in the game, so we did not provide any specific information about how such points would be converted to real money (i.e., a conversion rate).
Visual display of the public-goods game
Players were represented by boxes (0.1 × 0.1 normalized units) in each corner of the screen, and the pot was represented by a circle in the center of the screen (diameter = 0.1 units). As players were deciding how much to donate, three loading dots (text height = 0.05 units) were animated in their respective boxes, cycling between 1 and 3 dots every 1 s. Once the players had made their decision, their box turned green, and a white envelope (0.03 × 0.03 units) appeared in the quadrant of the pot corresponding to their corner. After watching the interaction and making estimates about the pot total (on the keyboard), participants would be presented with a 7-point Likert scale (1 × 0.05 units) to rate how coordinated they thought the group was.
Player behavior
For each trial, the mean decision time of all four players ranged was about 6,000 to 7,000 ms. For high-synchrony trials the players’ decision time had a standard deviation of 150 to 250 ms, and for low-synchrony trials the players’ decision time had a standard deviation of 950 to 1,050 ms. We generated a pool of 32 unique arrays of four values for synchrony trials and 32 unique arrays of four values for asynchrony trials, with each of the four values representing the decision time of one player. To generate each array, we first defined one base value ranging from 6,000 to 7,000 ms. For synchrony trials, we generated three additional values that fell within 500 ms of the base value (e.g., from −500 ms to +500 ms), including this array in our pool only if the four values (i.e., the base value plus three additional values) had a standard deviation between 150 ms and 250 ms. For asynchrony trials, we generated three additional values that fell within 2,500 ms of the base value (e.g., from −2,500 ms to + 2,500 ms), including this array in our pool only if the four values (i.e., the base value plus three additional values) had a standard deviation between 950 ms and 1,050 ms. We did not constrain the decision times of all four players to be equally spaced (increasing by the same value from the fastest to slowest player) because this may have created the impression that the players were taking turns (see Supplemental Material 1 in the Supplemental Material available online for an additional analysis). We did not match the overall decision time of the group (i.e., the decision time of the slowest player) across synchrony and asynchrony trials because such a constraint would have made the responses of the three other players (i.e., those who were not the slowest) faster overall in the asynchrony group compared to the synchrony group, which would have resulted in a strong appearance of subgroups within the interaction (see Supplemental Material 1 for additional analysis).
Procedure
Participants signed up on Prolific for a study in which they would be asked questions about various groups interacting with each other. They were informed that it would take around 15 min and that they would be paid GBP£2.50 for participation. For the first phase of instructions, we explained the public-goods game and then tested their understanding of what they had learned; they would not be able to participate in the experiment if they failed the understanding test more than once. If they passed the test, we explained to them that they would watch animations of groups of players from a previous study play a mouse-tracked version of the public-goods game and that the participants’ task would be to estimate how many points they think were in the public pot; this was our measure of how cooperative participants believed the group to be.
Participants were told that in our lab, we tested many groups playing the mouse-tracked public-goods game; players were in separate rooms and played the game on interconnected computers. Players would first complete the decision phase—deciding how much to contribute in private (no one could see how much each player decided to donate). They typed on their screen how much to put in a virtual envelope before pressing “enter” to close the envelope. This phase reflected players deliberating about a potential decision. Players would then complete the movement phase—dragging their envelope from a starting point (one corner of the screen) to the pot in the center of the screen, in order to make their donation in public (i.e., everyone would see participants dragging their envelopes). This reflected the players’ confidence in, and commitment to, their decision. We did not explicitly instruct participants that players could move their cursors back and change their minds, because we assumed they would take this as an obvious consequence of adding an extra phase to the public-goods game in which players move to implement their decisions.
For this experiment, participants were shown animations of the decision phase only, watching animations of the players (represented by boxes in the corners of the screen) making their decisions. They would not see the donations, but rather they would see loading dots in the players’ boxes representing their deliberations about their decision. When they had made their decision, the box turned green, and an envelope appeared. We determined the timing of the players’ decisions by randomly selecting one of the arrays from our pool of decision times. They were informed that although the donations were not public information, the amount of time it took players to make the decision was (i.e., players would see when the other players had made their decisions).
After participants had watched the animation of the players making their decisions, they would then estimate on their keyboards how much they thought was in the pot before it was doubled (from 0–40 points). After estimating the pot total, participants would rate, on a 7-point Likert scale, how coordinated they thought the group was (1 = not at all, 7 = very much). Participants were informed that they would complete 32 trials, each time watching a different group playing one round of the game. These groups were randomly sampled from the many groups that we had recorded previously.
In order to check that participants were paying attention, we included some catch trials. Across the experiment, the pot would turn blue or green randomly. At the end of a trial, we would ask them the color of the pot. We included four catch trials in the experiment.
This procedure employed deception: Participants did not watch real players interacting with each other, but rather virtual actors. This was done so that we could exert precise experimental control over the synchrony of the actors’ behavior. All experiments presented in this manuscript were conducted in accordance with the Declaration of Helsinki and were approved by the Psychological Research Ethics Board (PREBO) at Central European University.
Design
Our main dependent variable was the estimate of the pot total—how many points participants thought were in the pot—and our main independent variable was trial type (high synchrony, low synchrony). See Supplemental Material 1 for additional exploratory analyses.
Exclusions
We applied several exclusion criteria to our data in order to ensure data integrity. First, participants were screened for their understanding of the public-goods game after our instructions, and they were excluded if they failed our understanding check more than once (i.e., if they answered one of our three test questions incorrectly). Second, we excluded any participants who answered more than one catch question incorrectly. Third, we removed trials in which reaction times were longer than 30 s because of participant inattentiveness.
In total, we recruited 87 people in order to get a sample of 68 participants. From the original 87, 16 participants withdrew from the study, either because they revoked their consent, left the study early, or failed the understanding check during the instructions; these people did not proceed with or complete the experiment. Two were excluded because they did not provide any responses, and one was excluded because he or she answered more than one catch question incorrectly. We also excluded 19 trials (0.9%) in which participants recorded reaction times greater than 30 s and 20 trials (0.9%) in which we never received a response (i.e., participants either entered nothing, or did not enter a valid number).
Experiment 1b: method
Participants
As in the previous experiment, we aimed for a final sample of 68 participants after exclusions. In total we recruited 68 participants (20 male, 48 female). The sample had a mean age of 36.74 years (SD = 12.59).
Apparatus, stimuli, procedure, and design
Everything was the same as in Experiment 1a except that there were no coordination ratings.
Exclusions
In total, we recruited 94 people in order to get a sample of 68 participants. Of the original 94, 25 participants withdrew from the study either because they revoked their consent, left the study early, or failed the understanding check during the instructions. These people did not proceed with or complete the experiment. One was excluded for not providing any responses; no one was excluded because of failure on more than one catch question. We also excluded 10 trials (0.5%) in which participants recorded reaction times greater than 30 s and 39 trials (1.8%) in which we never received a response (i.e., participants either entered nothing or did not enter a valid number).
Results of Experiment 1
Experiment 1a: decision-making synchrony with explicit attention to coordination
A paired t test (two-tailed) comparing estimates of the pot total in high-synchrony trials with estimates of the pot total in low-synchrony trials revealed that participants estimated that the pot total was larger when the decision-making times were synchronized (M = 26, SD = 7.99) compared to when they were not synchronized (M = 22.54, SD = 7.32), t(67) = 7.25, p < .001, d = 0.88, 95% confidence interval (CI) = [0.6, 1.15]. See Figure 2.
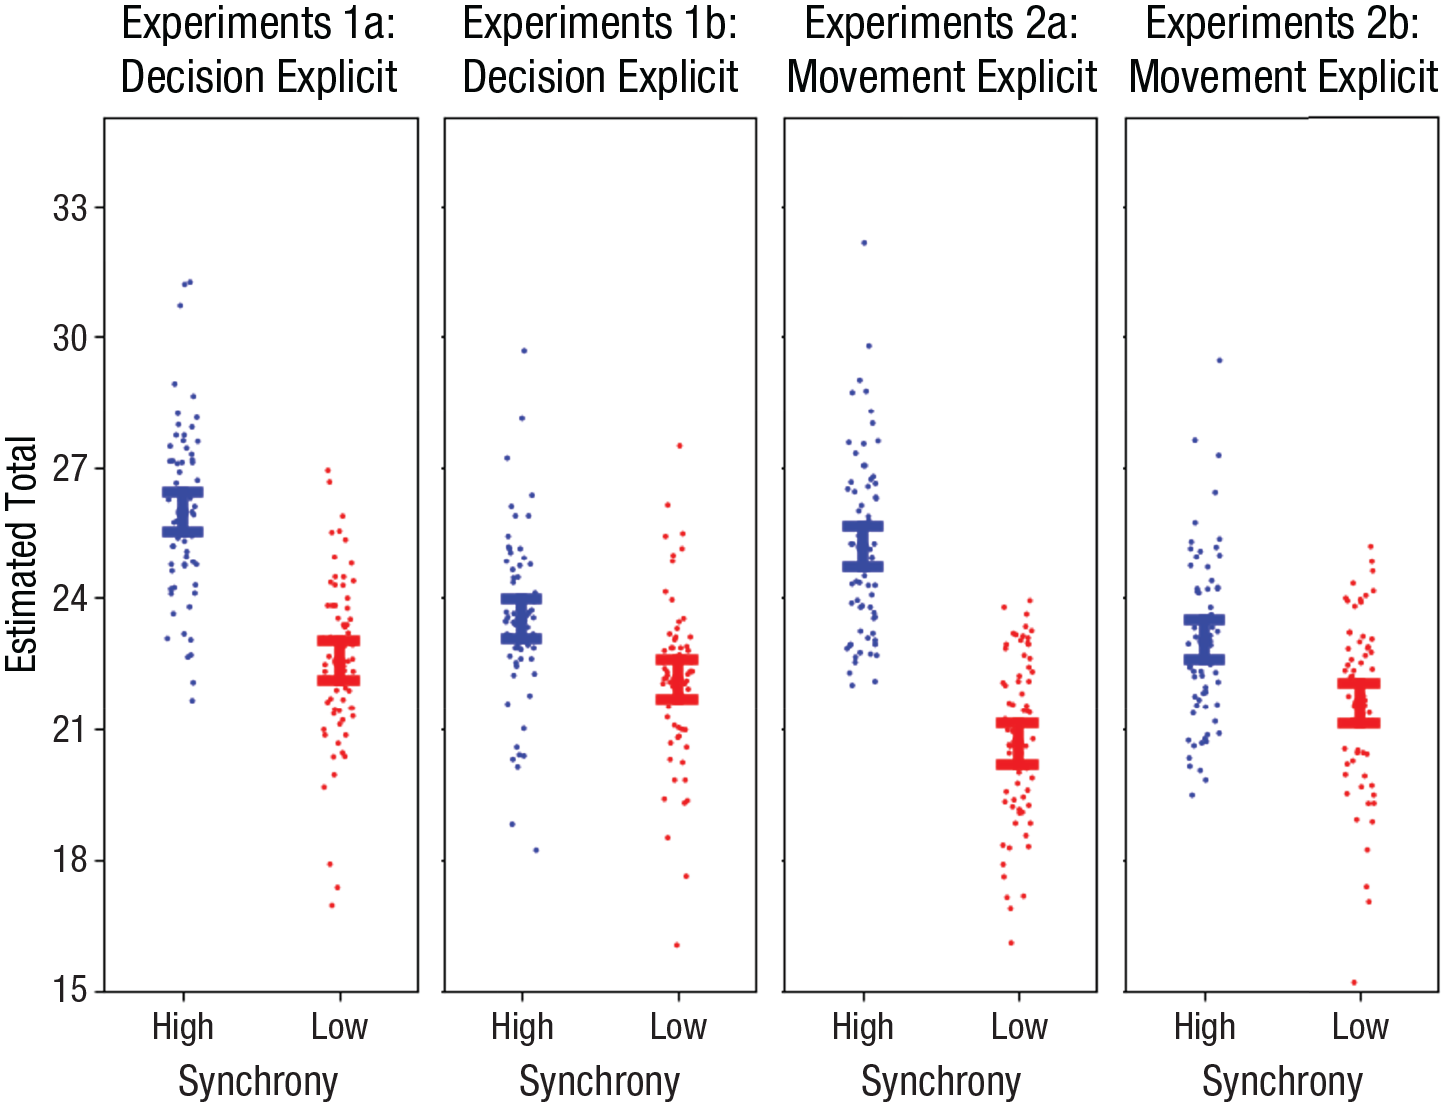
The effects of synchrony upon estimates of cooperation for all four experiments. In Experiment 1a, the synchrony of decision-making times was manipulated; in Experiment 1b, the synchrony of movements was manipulated. Participants were asked to pay attention to coordination in Experiments 1a and 2a but not in Experiments 1b and 2b. Error bars represent 95% within-subjects confidence intervals, and individual data points represent group-mean-centered ratings for each participant (Cousineau, 2005).
Experiment 1b: decision-making synchrony without explicit attention to coordination
A paired t test (two-tailed) comparing estimates of the pot total in high-synchrony trials with estimates of the pot total in low-synchrony trials revealed that participants estimated that the pot total was larger when the decision-making times were synchronized (M = 25.51, SD = 6.54) compared to when they were not synchronized (M = 22.14, SD = 6.32), t(67) = 2.97 p = .004, d = 0.36, 95% CI = [0.11, 0.6]. See Figure 2.
A 2 × 2 mixed analysis of variance with trial type (high synchrony, low synchrony) as a within-subjects factor and experiment type (implicit attention to synchrony, explicit attention to synchrony) as a between-subjects factor revealed a main effect of trial type, F(1, 134) = 52.78, p < .001, η p 2 = .28, and no significant main effect of experiment type, F(1, 134) = 2.71, p = .10, η p 2 = .02. There was an interaction between trial type and experiment type, F(1, 134) = 9.76, p = .002, η p 2 = .07, demonstrating that the difference in estimates between high-synchrony trials and low-synchrony trials was significantly larger for the explicit experiment (Experiment 1a) than the implicit experiment (Experiment 1b). As expected, post hoc t tests (Bonferroni-corrected for six comparisons) revealed that estimates were significantly higher for high-synchrony than low-synchrony trials for both implicit experiments, t(67) = 2.93, p = .024, d = 0.24, and explicit experiments, t(67) = 7.35, p < .001, d = 0.6. There was no significant difference between implicit and explicit experiments for low-synchrony trials, t(134) = −0.49, p = 1.0, d = −0.09. For high-synchrony trials, there was a nonsignificant trend between implicit and explicit experiments for high-synchrony trials, t(134) = −2.6, p = .06, d = −0.45. This may suggest that the interaction was at least partly driven by the instruction to rate the group’s coordination, which likely increased the perception of cooperativity in synchronous groups while not decreasing the perception of cooperativity in asynchronous groups. However, given the Bonferroni corrections, the study is underpowered to determine whether the difference between explicit and implicit attention is driven by a relative increase in ratings for synchronous trials or a relative decrease in ratings for asynchronous trials; thus, this finding should be interpreted with caution.
Experiment 2
Experiment 2a: method
Participants
We used the same stopping rule as in Experiment 1a; we did not carry out a separate G*Power analysis for this experiment but rather used the same power calculation as in Experiment 1a to determine our sample size. This means that we aimed for a final sample of 68 participants after exclusions. In total, we recruited 71 participants (37 male, 34 female; 3 were excluded). The sample had a mean age of 34.56 years (SD = 11.2).
Apparatus and stimuli
The apparatus and stimuli used in the public-goods game were the same as before. As in Experiment 1a, players were represented by boxes in the corners of the screen, and their completed donations were represented by envelopes appearing in the pot. However, this time we did not animate their decision time; instead, we animated the participants’ action in moving their donation from their box (which was the starting point of the movement) to the pot (which was the end point of their movement), with their mouse movements represented by a red circle (diameter = 0.03 units).
For each trial, the mean action time of all four players ranged around 6,000 to 7,000 ms. For high-synchrony trials the players’ action time had a standard deviation of 150 to 250 ms, and for low-synchrony trials the players’ action time had a standard deviation of 950 to 1,050 ms. These values were generated in the same way as in Experiment 1. Action time was divided into action-onset time and movement time, with the players being idle for the first half of their action time (i.e., onset time) and moving for the second half of their action time (i.e., movement time). To create movements, we generated for each player an array of equally spaced coordinates that drew a straight path from the players’ box in the corner of the screen to the public pot. (Array length was defined by the screen-refresh rate multiplied by the movement duration.) We added noise to players’ movements by programming trajectories to periodically deviate from the straight path by applying a Bézier curve function to the trajectory, employing up to four control points. These control points created up to four small curves in the trajectory (maximum deviation from the straight path = 0–0.01 units). We also programmed players to move with a bell-shaped velocity profile to resemble biological motion using a function that resampled the array of coordinates on the basis of a sigmoid (x = 0.4, y = 4.0), thereby transforming the spacing between the array coordinates to resemble a bell curve (i.e., less space between coordinates at the start and end of the movement, and more space between coordinates in the middle of the movement).
Procedure
The procedure was the same as in Experiment 1a except that participants were shown animations of the movement phase only, watching animations of the players (represented by boxes in the corners of the screen) dragging their donations into the pot. This phase represented players’ confidence in, and commitment to, their decision. They would see red circles that represented the players’ mouse cursors, moving from the players’ boxes to the pot in the center of the screen. Once the cursor reached the pot, an envelope would appear, showing that a decision had been made. Players were informed that the mouse movements were public information (i.e., players would see each other’s movements). The design of the experiment was the same as in Experiment 1a.
Exclusions
In total, we recruited 100 people to get a sample of 68 participants. From the original 100, 26 participants withdrew from the study, either because they revoked their consent, left the study early, or failed the understanding check during the instructions; they did not proceed with or complete the experiment. Three participants were excluded because they did not provide any responses. (No participants were excluded because they missed more than one catch question.) We also excluded 19 trials (0.8%) in which reaction times greater than 30 s were recorded and 10 trials (0.4%) in which we never received a response (i.e., participants either entered nothing or did not enter a valid number). We also excluded 3 participants who did not provide estimates for any of the trials.
Experiment 2b: method
Participants
As in the previous experiment, we aimed for a final sample of 68 participants after exclusions. In total, we recruited 68 participants (3 excluded; 21 male, 47 female, and 3 who identified as other). The sample had a mean age of 37.31 years (SD = 12.86).
Apparatus, stimuli, procedure, and design
The design was the same as in Experiment 2a except that there were no coordination ratings.
Exclusions
In total, we recruited 88 people to obtain a sample of 68 participants. From the original 88, 19 participants withdrew from the study, either because they revoked their consent, left the study early, or failed the understanding check during the instructions; they did not proceed with or complete the experiment. One participant was excluded because of a failure to give any responses; no one was excluded because of failure on more than one catch question. We also excluded 18 trials (0.8%, in which participant reaction times were greater than 30 s), and 33 trials (1.5%, in which we never received a response; i.e., participants either entered nothing, or did not enter a valid number).
Results of Experiment 2
Experiment 2a: movement synchrony with explicit attention to coordination
A paired t test (two-tailed) comparing estimates of the pot total in high-synchrony trials with estimates of the pot total in low-synchrony trials revealed that participants estimated the pot total was larger when the timing of the actions performed to reach the common pot was synchronized (M = 25.18, SD = 7.8) compared to when they were not synchronized (M = 20.69, SD = 7.6), t(67) = 9.004, p < .001, d = 1.1, 95% CI = [0.79, 1.39]. See Figure 2.
Experiment 2b: movement synchrony without explicit attention to coordination
A paired t test (two-tailed) comparing estimates of the pot total in high-synchrony trials with estimates of the pot total in low-synchrony trials revealed that participants estimated the pot total was larger when the actions performed to implement the decisions were synchronized (M = 23.04, SD = 7.7) compared to when they were not synchronized (M = 21.56, SD = 7.5), t(67) = 3.06, p = .003, d = 0.37, 95% CI = [0.12, 0.62]. See Figure 2.
A 2 × 2 mixed analysis of variance with trial type (high synchrony, low synchrony) as a within-subjects factor and experiment type (implicit, explicit) as a between-subjects factor revealed a main effect of trial type, F(1, 134) = 74.93, p < .001, η p 2 = .36, and no significant main effect of experiment type, F(1, 134) = .48, p = .49, η p 2 = .004. There was an interaction between trial type and experiment type, F(1, 134) = 19.99, p < .001, η p 2 = .13, with the difference in estimates between high-synchrony and low-synchrony trials being significantly larger for the explicit experiment than the implicit experiment. As expected, post hoc t tests (Bonferroni-corrected for six comparisons) revealed that estimates were significantly higher for high-synchrony trials than for low-synchrony trials for both implicit experiments, t(67) = 2.96, p = .022, d = 0.27, and for explicit experiments, t(67) = 9.28, p < .001, d = 0.85. There was no significant difference between implicit and explicit experiments for low-synchrony trials, t(134) = −1,05 p = 1.0, d = 0.18, or high-synchrony trials, t(134) = −2.32, p = −.13, d = −0.4.
General Discussion
This study demonstrates, in line with our predictions, that participants estimated groups who contributed to a public good synchronously to have acted more cooperatively compared to those whose contributions were asynchronous (see Supplemental Material 1 for an analysis ruling out the effects of subgrouping of the players’ decision/action times and the overall decision/action time of the group). Thus, synchrony may act as a useful cue for predicting how cooperatively a group has acted or is likely to act. Importantly, we also found that synchrony in both the decision-making and movement phases of a group’s actions increased estimates of cooperation.
To the best of our knowledge, this is the first demonstration that the synchrony by which groups of individuals make decisions and implement actions is taken to be informative about their level of cooperation. Our findings extend earlier work in two ways: First, we show that the perception of synchronous actions not only leads to higher estimates of rapport (Miles et al., 2009) and entitativity (Fessler & Holbrook, 2016) but also affects perceived cooperation. Second, our findings show that both synchrony of movements and synchrony of decision-making can affect perceived cooperation. More generally, our results suggest that cues about temporal dynamics from both the decision-making and movement phases of social interactions may contain useful information about a group’s willingness to act in line with the collective interest.
We found the effects of synchrony upon judgments of cooperation to be stronger when participants were prompted to explicitly attend to synchrony cues. However, the effects were still present when participants’ attention was not directed to the cues, suggesting that synchrony is a salient feature of a group’s performance that can spontaneously shape expectations of cooperation.
In addition to informing third-person evaluations about a group, individuals may also use synchrony to make decisions within a social interaction, deciding how cooperatively or conservatively to act in a group (Good et al., 2017). Synchrony between a group may act as an honest signal of the cooperative norms in a group (i.e., one that cannot be faked easily; Gintis et al., 2001). This may be especially useful to estimate cooperation when there is no direct access to the cooperative behavior of others. This may also allow us to estimate the longer-term stability of a repeated cooperative interaction (i.e., whether a group will continue to cooperate).
Overall, the ability to use synchrony to appraise interactions may have contributed to the success of our species throughout history by cooperating (Boyd & Richerson, 2009; Tomasello, 2009). Extending the notion that rhythmic activities, such as dance, evolved as systems to signal coalitional quality (Mehr et al., 2021), we demonstrate that the temporal dynamics of nonrhythmic activities may also signal the quality of a coalition. This raises the possibility that the unique role of rhythmic activities as a social signal may be due in part to a general ability to derive information from the timing of an interaction, with rhythmic interactions being special because they accentuate timing and give it a communicative function.
What are the cognitive mechanisms involved in the perception of synchrony between the actions of group members? When observing dyads or small groups, people are sensitive to the relations between individual actions that are performed to achieve joint outcomes (Kourtis et al., 2019; Loehr et al., 2013) and are able to represent the actions of multiple individuals’ relations in their motor systems (Cracco & Brass, 2018; Cracco et al., 2022). When observing larger groups, people form ensemble representations of the gist of the group, using the same mechanisms that allow them to rapidly summarize and abstract features of groups of objects in the environment (such as size or color) without attending to large numbers of individual objects independently, which would be difficult given the constraints of our attentional systems (Alt & Phillips, 2022; Alvarez, 2011). For instance, ensemble processing may allow people to rapidly abstract Gestalt properties such as symmetry, continuity, common fate, and synchrony from group actions (Lee & Blake, 1999; Wagemans et al., 2012; Wertheimer, 1923). This may be particularly economical for processing large groups where representing actions of individual members would not be feasible.
Moreover, how does perceived synchrony of decisions and actions lead observers to infer that group members are willing to act in the collective interest? One possibility is that people rely on their own past experiences, generalizing from experiences of many of the synchronized interactions they have been part of, where synchrony typically signals that they are well affiliated and on the same page as our coactors. Alternatively, we may ascribe traits to these groups, with synchrony being used as a cue that triggers attributions of semantic knowledge structures about the cooperativity of the group (Macrae & Bodenhausen, 2000).
Can our findings be leveraged to facilitate cooperative behavior where it is most needed? In many cases, when individuals perceive the risk of contributing to a public good as high while perceiving the potential reward from a public good as being low or uncertain (e.g., because the payoff will be revealed only in the distant future), they act conservatively. This is one of the key obstacles we face when considering global challenges, such as climate change. Considering that increasing synchrony between group members can increase their levels of cooperation (Good et al., 2017), can perceiving a group contributing to a public good synchronously nudge hesitant individuals toward cooperation? For instance, synchrony may signal that a group has strong cooperative norms, thereby leading the individual to perceive contributing to the public good as less risky or more worthwhile (i.e., assuring the individual that others are also contributing), or making the individual feel obligated to contribute (i.e., to avoid the negative consequences of violating the norm).
Limitations
We employed a largely Western sample recruited online. Because both ritualistic synchrony and performance in economic games may vary across cultures, there may be limits to the generalizability of our findings (Gelfand et al., 2020; Henrich et al., 2001, 2010).
Supplemental Material
sj-docx-1-pss-10.1177_09567976231223410 – Supplemental material for Synchrony Influences Estimates of Cooperation in a Public-Goods Game
Supplemental material, sj-docx-1-pss-10.1177_09567976231223410 for Synchrony Influences Estimates of Cooperation in a Public-Goods Game by Luke McEllin and Natalie Sebanz in Psychological Science
Footnotes
Transparency
Action Editor: Lasana Harris
Editor: Patricia J. Bauer
Author Contributions
References
Supplementary Material
Please find the following supplemental material available below.
For Open Access articles published under a Creative Commons License, all supplemental material carries the same license as the article it is associated with.
For non-Open Access articles published, all supplemental material carries a non-exclusive license, and permission requests for re-use of supplemental material or any part of supplemental material shall be sent directly to the copyright owner as specified in the copyright notice associated with the article.