
Abstract
Ethnic out-group members are disproportionately more often the victim of misidentifications. The so-called other-race effect (ORE), the tendency to better remember faces of individuals belonging to one’s own ethnic in-group than faces belonging to an ethnic out-group, has been identified as one causal ingredient in such tragic incidents. Investigating an important aspect for the ORE—that is, emotional expression—the seminal study by Ackerman and colleagues (2006) found that White participants remembered neutral White faces better than neutral Black faces, but crucially, Black angry faces were better remembered than White angry faces (i.e., a reversed ORE). In the current study, we sought to replicate this study and directly tackle the potential causes for different results with later work. Three hundred ninety-six adult White U.S. citizens completed our study in which we manipulated the kind of employed stimuli (as in the original study vs. more standardized ones) whether participants knew of the recognition task already at the encoding phase. Additionally, participants were asked about the unusualness of the presented faces. We were able to replicate results from the Ackerman et al. (2006) study with the original stimuli but not with more standardized stimuli.
Keywords
On November 22, 2018, police were called to a shooting in a shopping center in Hoover, Alabama. On the scene, they shot 21-year-old African American E. J. Bradford as the alleged shooter. Later that same night, police informed the public that Bradford was not the shooter but a friend of the original victim of the shooting, B. Wilson. Later that month, 20-year-old E. Brown was arrested as the actual shooter. Incidents like these have sparked a debate around racist incidents involving police force, culminating in the #Blacklivesmatter movement. Whereas many of the killings of Black men that fueled #Blacklivesmatter protests could be regarded as a misperception of threat by perfectly harmless Black men, the current case is different because it points to the tragedy of misidentification and shooting of an equally harmless Black man because he was believed to be someone else—here, an aggressive shooter.
Far from being an isolated case, misidentifications are responsible for a great number of injustices done to wrongfully attacked or even wrongfully convicted persons (The Innocence Project, 2020). The frequency of likelihood of such misidentification is, however, not colorblind but disproportionately higher for Black men (Kleider-Offutt et al., 2017). Many authors have pointed to the so-called other-race effect (ORE), the tendency to better remember faces of individuals belonging to one’s own ethnic in-group than faces belonging to an ethnic out-group (Hugenberg et al., 2010), as one causal ingredient in such tragic incidents. To better understand these underlying processes in person perception and person recognition, we thus sought to revisit an important aspect for which there are contradictory findings in the current literature: the role of emotional expressions.
The Functional Perspective
Robust evidence suggests an ORE, with people better remembering faces of individuals belonging to one’s own ethnic in-group than faces belonging to an ethnic out-group (Hugenberg et al., 2010; Meissner & Brigham, 2001; Young et al., 2012). Against this background, the seminal study by Ackerman and colleagues (2006) found that White participants remembered neutral White faces better than neutral Black faces (i.e., a classical ORE), but crucially, this pattern reversed for angry faces, where Black angry faces were better remembered than White angry faces (i.e., a reversed ORE). The apparent contradiction to the existing literature was explained by a functional perspective on person perception: Cognitive resources are selectively allocated on the basis of characteristics that appear especially relevant to the perceivers’ functional outcomes (Maner et al., 2003; Öhman et al., 2001). When an outgroup member (here, a Black person) is angry, this may imply threat for the perceiver (because of intergroup hostility); hence, it is functional to be able to encode this quickly and accurately. For neutral faces, such functionality is not given because in the absence of implied hostility, Black individuals are presumed to be less functional (i.e., relevant) for White perceivers.
The Stereotype Congruency Perspective
Despite these findings in support of a functional perspective to other-race person perception, other researchers have failed to reproduce findings in line with it (Corneille et al., 2007; Gwinn et al., 2015). In fact, these studies reported exactly opposite patterns; angry Black faces were remembered worse than angry White faces. Such results now question the functional perspective and instead are more compatible with a perspective of stereotype congruency: Because Blacks are commonly stereotyped as angry and threatening in the United States and Europe, people are more likely to process angry Black targets in a categorical manner—as mere (stereotype-congruent) exemplars of the activated category rather than unique individuals. Accordingly, stereotype-congruent faces are more likely to be misidentified than stereotype-incongruent faces, thereby leading to an increase in the ORE.
Open Questions and the Present Research
So far, both the functional and the stereotype congruency perspectives have reported data in their support. Thus, testing an identical hypothesis, two studies reported exactly opposite patterns. Whereas Ackerman et al. (2006) reported better individual memory for Black versus White angry faces, Gwinn and colleagues (2015) reported worse individual memory for Black versus White angry faces (see also Corneille et al., 2007). This begs the question of which procedural difference is responsible for these incongruent results. Some leads have already been suggested by Gwinn et al.: In their perspective, Ackerman and colleagues employed only a small set of highly striking and thus, more memorable, faces. In contrast, Gwinn and colleagues sampled a large set of 64 highly controlled faces from the Chicago Face Database (CFD; Ma et al., 2015; note, however, that neither the article itself nor our personal communication with the author could establish which exact stimuli were used). If this reasoning was correct, the different results between the two reports should be attributable to the greater memorability of less standardized images employed by Ackerman et al., compared with images from databases in which photos are taken under controlled conditions and standardized instructions to models employed by Gwinn and colleagues. Additionally, as participants in the Ackerman et al. study saw fewer photos than participants in the Gwinn et al. study, differences in encoding processes could have emerged (see Zhou et al., 2018). Another procedural difference between the two, however, is participants’ awareness of a recognition task. Whereas this task came as a surprise to participants in the Ackerman et al. study, participants in the Gwinn et al. study already knew that a memory task would have to be performed after the encoding phase. It might thus also be that the different results are attributable to the prewarning given in the Gwinn et al. study.
Statement of Relevance
Solving crimes often depends on eyewitnesses who can give important clues about the offender. Unfortunately, eyewitness testimonies are frequently biased and incorrect, and regularly, reports about wrongfully identified minority group members hit the headlines. Our tendency to better remember faces of individuals belonging to one’s own ethnic in-group than faces belonging to an ethnic out-group, the so-called other-race effect, has been identified as one causal ingredient in such tragic incidents. We aimed to replicate previous work demonstrating that White participants remembered neutral White faces better than neutral Black faces, whereas angry Black faces were better remembered than angry White faces. We were able to replicate these results with the original stimuli but not with more standardized stimuli. Irrespective of the question of which set is more or less representative, we can assert that empirical robustness and replicability do not necessarily translate to ecological validity and applicability to real-life settings.
In the current study, we thus sought to replicate the study conducted by Ackerman et al. (2006) and directly tackle the potential causes for different results with later work. Specifically, we manipulated whether participants knew of the recognition task already at the encoding phase (between subjects). Furthermore, we extended the stimuli set, using both the original photos and additional photos from the CFD used in earlier work (Gwinn et al., 2015; because information on the exact images used was not available, they were randomly sampled from the database). As further addition to the original work, we also asked participants afterward about how unusual they thought the faces were (see also Gwinn et al., 2015). This design constitutes a fair test of the replicability and robustness of the original study and thus provides important insights in the interplay of the ORE and displays of anger. By also tapping into the perceived unusualness of the target faces and considering different task instructions, we aimed to empirically substantiate the speculation that the different results were attributable to these factors. The present results would have implications for the relevance of the effects for the real world: If the direction of the effect is contingent on a prewarning, it might be safe to say that findings without a warning represent an ecologically more valid estimate of what happens in the field. If, however, the discrepancies between studies are a function of the stimulus sets, the question of ecological validity is one that can be answered only on the basis of stimulus sets that better represent the informational ecology. Therefore, participants’ ratings of typicality might provide a lead in this regard.
Open Practices Statement
The study design, all instructions and materials, and the analysis plan were preregistered on the Open Science Framework (OSF; https://osf.io/xcyka/). Additionally, detailed analyses can be found on the OSF.
Method
Data were collected between October 2022 and March 2023. The methods were based on the detailed descriptions of the original work (Ackerman et al., 2006), supplemented with information received from the first author by email about instructions for the participants and all stimulus materials. Before data collection, we received institutional review board approval at Chicago University (Approval No. IRB19-0895). The protocol was carried out in accordance with the provisions of the World Medical Association Declaration of Helsinki.
Design
The experiment consisted of two blocks, one using the original images used by Ackerman et al. (2006) and the other one using images of the CFD, which were partially previously used by Gwinn et al. (2015). For the procedure, we closely replicated the original design by Ackerman et al. but added one additional between-subjects factor, that is, whether the recognition test was announced before encoding (as done by Gwinn et al., 2015). To stay as close as possible to the original protocol, we also included two factors of minor relevance to the current purpose—distractor presence and presentation duration (both between subjects). Both factors were included in previous work to investigate influences of possible cognitive constraints. In the original work, both factors did not lead to significant interactions with target race or target expression. Nevertheless, by including these two factors, we can perform an exact replication of the previous work.
Importantly, we manipulated whether participants first completed the task with the original Ackerman stimuli or the CFD stimuli. As the recognition phase needed to follow the presentation of one set of stimuli to stay closer to the original study, in the second block participants knew that there would be a recognition phase independent of whether there was an announcement. We thus never announced the recognition phase in the first block but always in the second block and counterbalanced the order of stimulus sets. The between-subjects factor of counterbalanced block order therefore determined whether the announcement was identical to both original studies (no announcement for the Ackerman stimuli, announcement for the CFD stimuli) or counter to the original studies (no announcement for the CFD stimuli, announcement for the Ackerman stimuli).
The study had a 2 (target race: Black vs. White) × 2 (target expression: neutral vs. angry) × 2 (stimuli: Ackerman stimuli vs. CFD stimuli) × 2 (distractor presence: present vs. absent) × 2 (stimuli set order: Ackerman stimuli first vs. Ackerman stimuli last; because order was fully confounded with announcement of recognition phase, this factor also determined for which stimulus set this was announced) × 3 (presentation duration: 500 ms vs. 1,000 ms vs. 4,000 ms) mixed design. Target race, target expression, and stimuli served as within-subjects factors; stimuli set order, distractor presence, and presentation duration served as between-subjects factors. Because of their lack of meaningful effects in the original study, the latter two were of no theoretical relevance but were merely added to stay as close as possible to the original study.
Materials
We used materials that were identical to those in the original study (generously provided by Josh Ackerman; for the Gwinn stimuli, we had to rely on a random sample from the database used by the original study because neither the publication nor Jason Gwinn in personal communication could firmly establish which images were used; see Fig. 1).
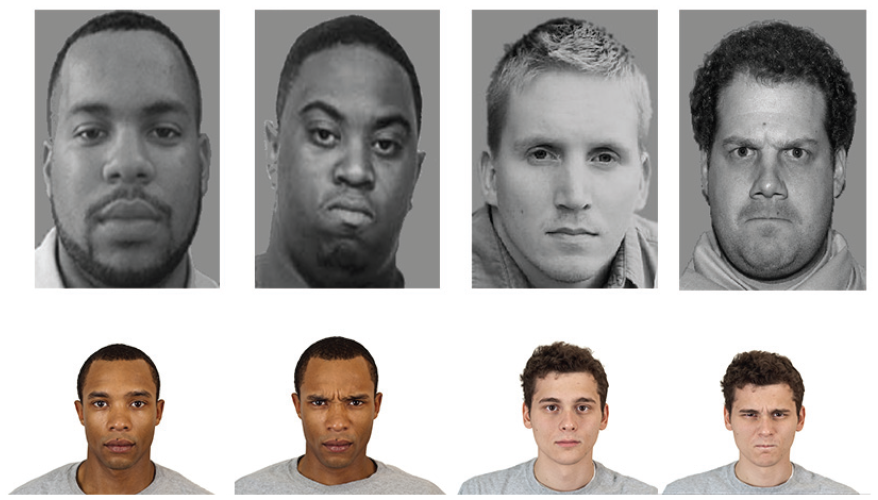
Stimuli examples of neutral and angry Black and White faces from the studies by Ackerman et al. (2006; row above) and Gwinn et al. (2015; row below).
Power analyses
G*Power was used for the a priori power analysis (Faul et al., 2007). The central effects for the hypothesis were a 2 (angry vs. neutral) × 2 (White vs. Black) interaction on recognition accuracy and response bias. The same effects can be expressed simply as a mean difference between difference scores: (White neutral – Black neutral) vs. (White angry – Black angry). With additional information from Josh Ackerman, we estimated the effect sizes for these differences between difference scores to be dz = 0.48, 95% confidence interval (CI) = [0.34, 0.62] for recognition accuracy, and dz = 0.60, 95% CI = [0.46, 0.75] for the response bias in the original study. To detect an effect of the size of the lower bound of the smaller (and more relevant) effect on recognition accuracy, we needed a dz of 0.34, with 95% power required for a total sample size of 115 (two-tailed test). Because we added a between-subjects factor (order of stimulus set), only one half of our sample constituted a direct replication of the original studies (those with the Ackerman stimuli first without a recognition announcement). This resulted in a total sample size of 230 for the replication study, equipping each of the direct replication conditions (no announcement for the Ackerman stimuli) with 95% power to detect an effect at the lower bound of the 95% CI of the original Ackerman findings. However, to be able to account for possible publication bias and to guarantee that our study was not underpowered, we decided to collect a total of 400 participants for this replication. For the central effect size, the double difference score of (White neutral – Black neutral) versus (White angry – Black angry), a sample size of 400 participants equipped us with 90% power to find evidence for equivalence in the critical smallest effect size of interest window from dz = −0.165 to dz = 0.165.
Participants
Participants were recruited via the Mindworks lab infrastructure at Chicago University. The 401 participants (241 women, 147 men, 13 diverse; age: M = 35.03 years, SD = 14.51) received compensation worth about US$6 for a 30-min study. They were randomly assigned to conditions and performed the study individually. Because we preregistered to sample only White participants (to avoid interpretative confusion of the ORE), we excluded five participants who self-reported another racial category (one Black, four other), leaving a total of 396 participants in the sample.
Procedure
We did not include any measures in this study that are unreported. Participants were first asked to give written informed consent. Procedurally, the first block of the experiment was then the direct replication of the Ackerman et al. (2006) study, but it was counterbalanced between participants whether the presented stimuli were the original ones or the CFD stimuli (as in the study by Gwinn et al., 2015). In the encoding phase, participants were presented randomly with the photos of 16 grayscale front-oriented faces (5 in. × 3.5 in.) of Black and White men showing either angry or neutral expressions. In the distractor-present condition, the 16 stimulus faces were presented randomly together with 16 grayscale abstract art images of similar size. In the distractor-absent condition, only the photos of 16 stimulus faces were presented. Between each photo, there was a 3,000-ms delay, and depending on presentation duration, each photo was presented for either 500 ms, 1,000 ms, or 4,000 ms. Participants then watched a 5-min video clip of landscapes as a filler task, after which they performed the memory task. This memory task included the previously shown photos of stimuli faces and additionally 16 new photos of faces not presented before. The new faces also showed either neutral or angry expressions. As in the original study, photos of stimuli faces and photos of new faces were counterbalanced across participants. For each photo, participants were asked to indicate on a 6-point Likert-type scale (ranging from 1 = definitely did not see to 6 = definitely did see) whether they had seen the photo or not. After this, participants ran through a second block, this time with an announcement that there would be a recognition phase. Everything was identical to the first block, except that the stimulus set was the one not previously seen. Subsequently, an additional measure was added to be able to investigate whether unusualness could be responsible for previously found effects (as suggested by Gwinn et al., 2015). We asked participants to think of a typical African American or typical Caucasian American and to indicate on a 7-point Likert-type scale (ranging from 1 = not at all unusual to 7 = very unusual) how unusual each face looks. We explained that “unusual” in this case means to rate the images on how similar they are to the typical image of the respective category they thought of before. Finally, participants provided demographic information (sex, age, cultural background) and were thanked, paid, and debriefed.
Data analyses
To enhance the evaluation of independent replications, we first conducted all analyses separately for both stimuli sets, with and without recognition phase announcement (resulting in four analyses) exactly as in the original article (Ackerman et al., 2006). That is, recognition scores were recoded into binary yes/no judgments, and nonparametric signal detection sensitivity scores (A′) and response bias scores (B′′d) were calculated for each participant and for each target race and target expression combination. To deal with hits or false alarm rates of 0 or 1 (for which problems arise because z will be –∞ or +∞), we applied the log-linear approach (Hautus, 1995; Stanislaw & Todorov, 1999). Whereas the sensitivity scores reflected recognition accuracy, response bias scores reflected participants’ general threshold for responding with “seen” or “not seen” to a stimulus category. For the theoretical interpretation, we focused on sensitivity scores as a central outcome (results for response bias are included on the OSF). Other theoretically irrelevant factors carried over from the Ackerman et al. (2006) study, such as the display duration or the presence of an abstract art photo, were ignored. Detailed analyses can be found on the OSF.
Results
Primary replication
For the primary replications, we conducted repeated measures analyses of variance (ANOVAs) for the sensitivity scores in a 2 (target race) × 2 (target expression) repeated measures ANOVA collapsed across presentation duration times and distractor presence for the condition in which Ackerman stimuli were presented first (without warning) and CFD stimuli were presented second (with warning).
For the Ackerman stimuli, this analysis yielded the same interaction effect as reported in the original article, F(1, 198) = 13.66, p < .001, η p 2 = .02, 95% CI = [0.00, 0.05] (see Fig. 2). Paired t tests showed that only for the neutral stimuli, there was a recognition deficit for Black faces relative to White faces (an ORE), t(198) = 4.25, p < .001, Cohen’s dz = 0.30, 95% CI = [0.16, 0.44], whereas the same was not true for angry faces for which the effect was even in the descriptively opposite direction, t(198) = −0.92, p = .357, Cohen’s dz = −0.07. Additionally, there was a substantial main effect of target expression, F(1, 198) = 24.79, p < .001, η p 2 = .04, 95% CI = [0.01, 0.08]; angry faces were recognized with higher accuracy than neutral faces. A just significant main effect of target race, F(1, 198) = 5.74, p = .017, η p 2 = .01, 95% CI = [0.00, 0.03], was in the direction of the ORE (lower sensitivity for Black faces) but qualified by the interaction reported above.
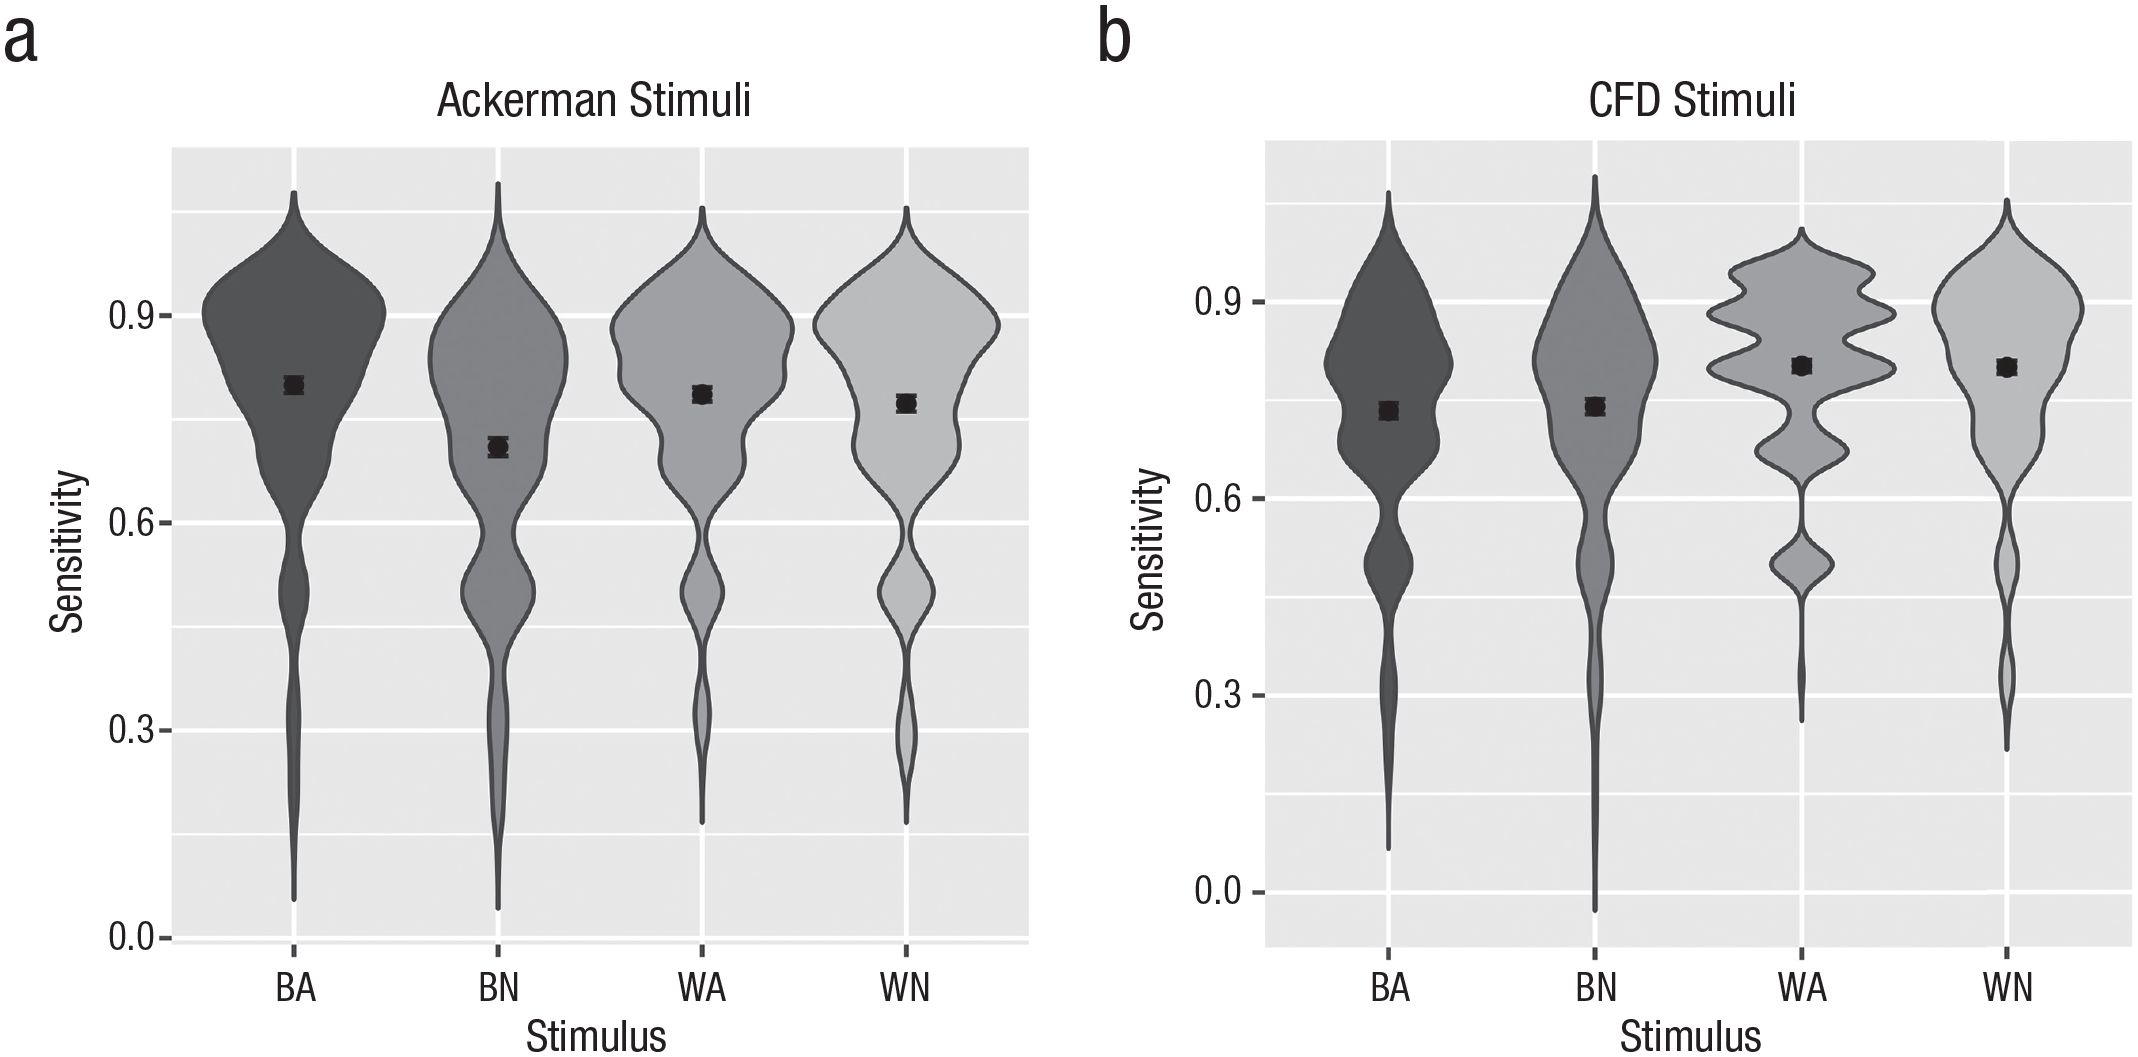
Recognition sensitivity (A′) for Black angry (BA), White angry (WA), and neutral faces (BN and WN). Results for the stimuli used by Ackerman et al. (2006) without announcement (left side; a) and for the Chicago Face Database stimuli with announcement as in the study by Gwinn et al. (2015; right side; b).
For the (announced) recognition sensitivity for the stimuli sampled from the CFD stimulus pool as in the Gwinn et al. (2015) study, the same analysis yielded only a main effect of target race, F(1, 198) = 48.24, p < .001, η p 2 = .08, 95% CI = [0.04, 0.12], with Black faces being recognized worse than White faces (see Fig. 3). No significant main effect or interaction of target expression was observed (ps > .64). This experimental setup thus replicated the well-established ORE both for the neutral, t(198) = 4.26, p < .001, Cohen’s dz = 0.30, and for the angry stimuli, t(198) = 5.91, p < .001, Cohen’s dz = 0.42.
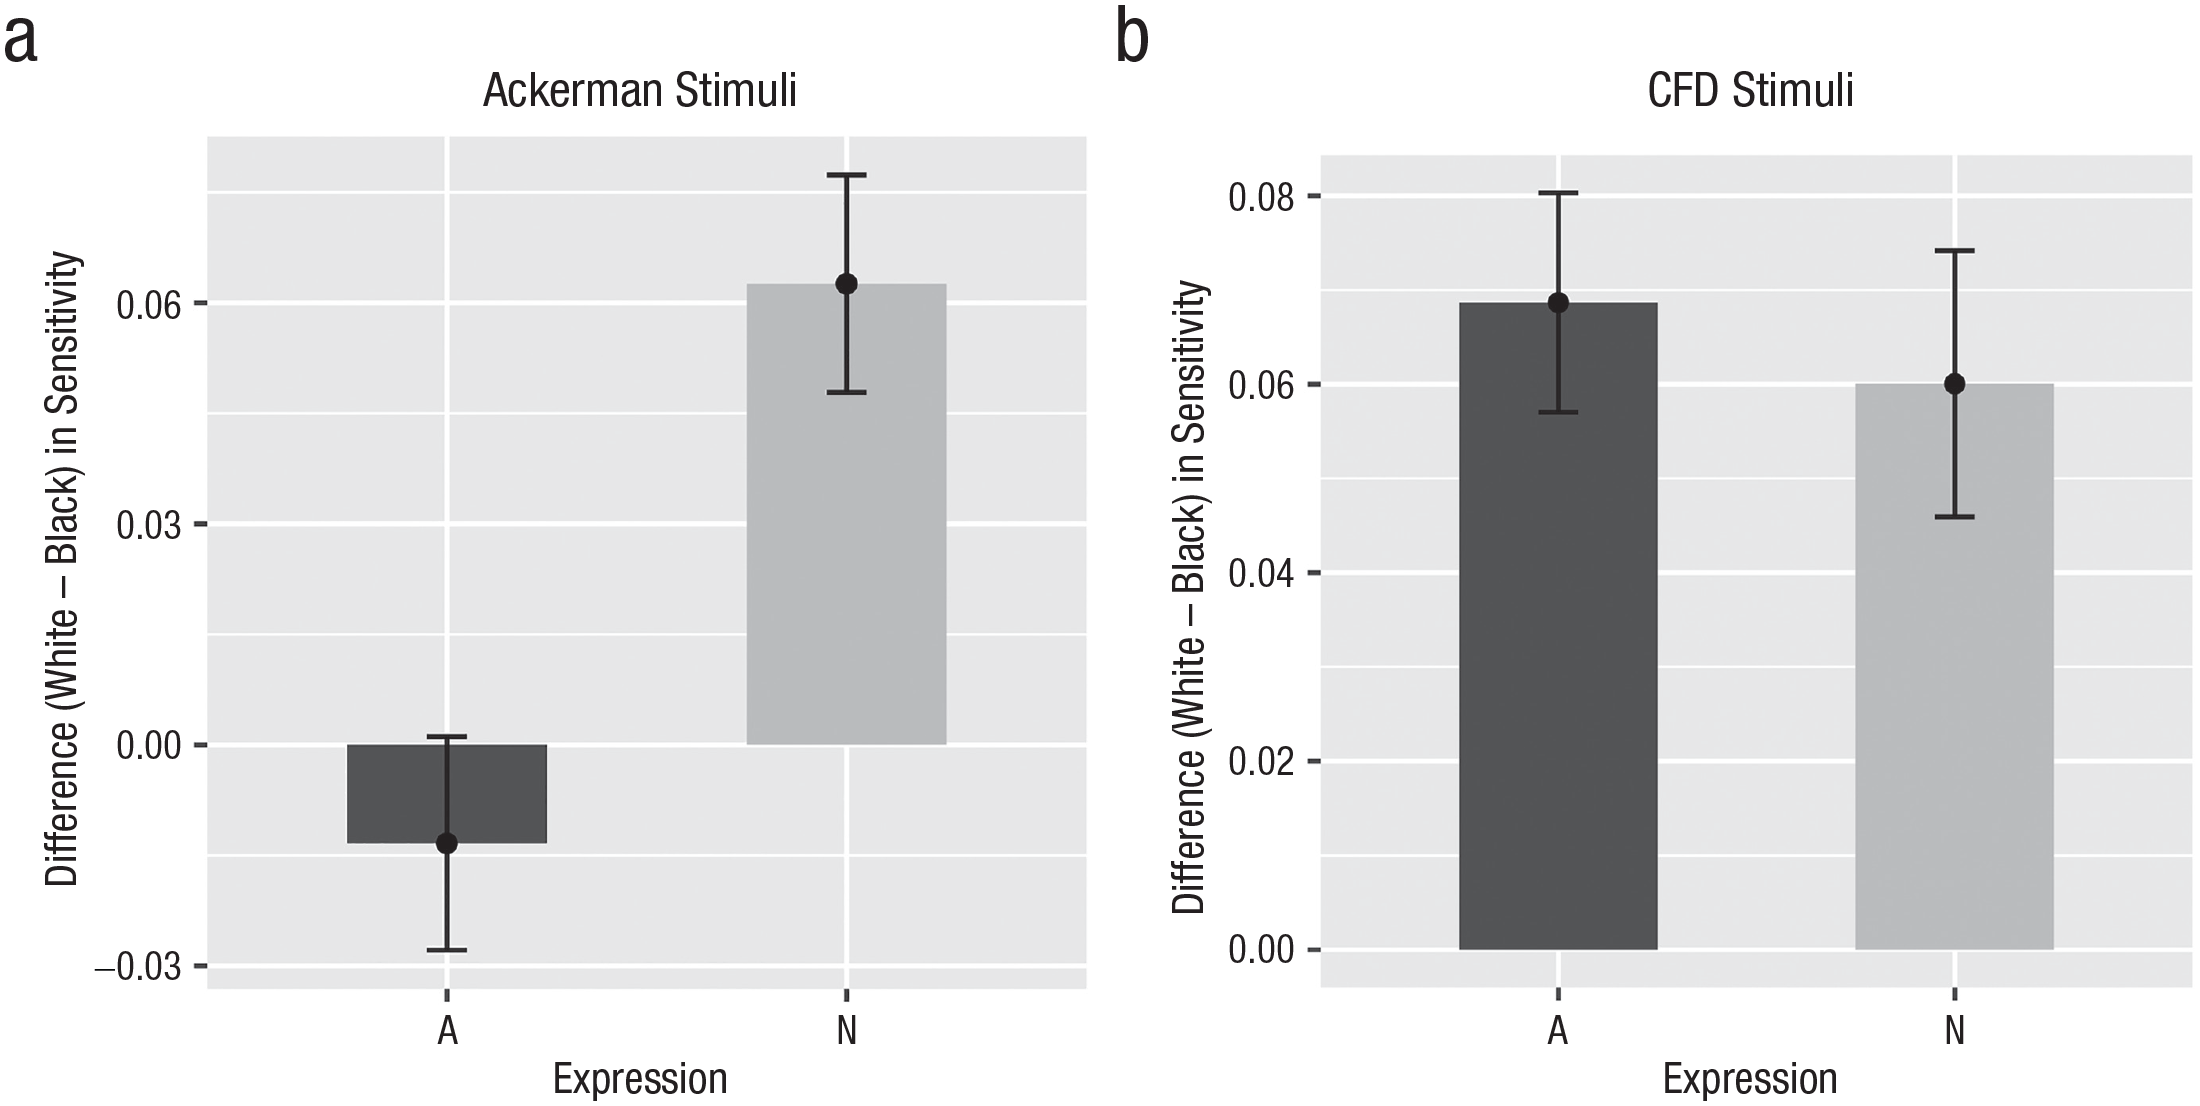
Difference in recognition sensitivity (White – Black) separately for each target expression (A = angry, N = neutral) for the Ackerman stimuli without announcement (left side; a) and for the Chicago Face Database (CFD) stimuli with announcement as in the study by Gwinn et al. (2015; right side; b).
Deconfounding announcement and stimulus set
In light of the substantial divergence of the results for the two stimulus sets (confounded with order), we explored whether this was due to stimulus sets or due to the order (and announcement). We thus analyzed the conditions in which CFD stimuli were presented first (without warning) and Ackerman stimuli were presented second (with warning). If the announcement of the recognition phase was responsible for this disparity, we would expect each stimulus set to produce opposite patterns to the ones in the other condition. If, however, it was a stimulus effect (as suggested by Gwinn et al., 2015), both interactions should be identical, independent of order (and hence, recognition announcement).
We thus conducted the same set of repeated measures ANOVAs for the other order condition. For the Ackerman stimuli (now in an announced recognition), this analysis again yielded the predicted interaction of target race and target expression, F(1, 196) = 4.31, p = .038, η p 2 = .007, 95% CI = [0.00, 0.03], and a main effect of target expression, F(1, 196) = 6.75, p = .010, η p 2 = .01, 95% CI = [0.00, 0.03], albeit weaker. Again, there was an ORE for the neutral faces, t(196) = 2.14, p = .034, Cohen’s dz = 0.15, but not for angry stimuli, t(196) = −0.79, p = .432, Cohen’s dz = −0.06.
For the (now unannounced) recognition of stimuli sampled from the CFD, we again observed only a main effect of target race, F(1, 196) = 32.49, p < .001, η p 2 = .05, 95% CI = [0.02, 0.09], with a main effect of target expression just short of significance, F(1, 196) = 3.62, p = .058, but no sign of an interaction of the two factors (p > .40). We again observed an ORE for neutral, t(196) = 4.55, p < .001, Cohen’s dz = 0.33, as well as for angry stimuli, t(196) = 3.73, p < .001, Cohen’s dz = 0.27.
In summary, we thus replicated the interaction of target race and target expression for the stimuli used in the original study for both order and announcement conditions but found only a main effect of target race (the ORE) for stimuli sampled from the CFD, also in both order/announcement conditions. This suggests that differences in the results are likely not due to the announcement of the recognition phase but, rather, due to the stimuli themselves. To solidify this, we conducted an omnibus ANOVA on the full data set with target race, target expression, their interaction, and stimulus set as within-subjects factors, as well as counterbalancing order as a between-subjects factor. This ANOVA yielded the theoretically informative target race by target expression by stimulus set interaction, F(1, 394) = 7.44, p = .006, η p 2 = .003, 95% CI = [0.00, 0.01], suggesting a different size or direction of the target race by target expression interaction depending on stimuli. The alternative explanation of an order effect was not supported by a significant target race by target expression by order interaction, F(1, 394) = 0.02, p = .885.
Equivalence testing
As preregistered, we also subjected the central effect of comparing the difference score (White – Black) of neutral versus angry faces to two one-sided equivalence tests (Lakens et al., 2018) against the smallest effect size of interest of dz = ±0.165. Collapsed across the order conditions, this comparison was outside of the equivalence bound and significantly different from zero, t(395) = −4.12, p < .001, Hedges’s gz = −0.21, 95% CI = [–0.29, –0.12], for the Ackerman stimuli. For the CFD stimuli, this contrast was not significantly different from zero, t(395) = −0.29, p = .773, Hedges’s gz = −0.01, 95% CI = [–0.10, –0.07], but larger than the lower bound of the equivalence bound, t(395) = 2.99, p < .001, and smaller than the upper bound, t(395) = −3.57, p < .001. The moderation of the ORE by target expression was thus significantly smaller than the predefined smallest effect size of interest.
Follow-up analyses on unusualness ratings
In an exploratory analysis, to address the suspicion voiced by Gwinn et al. (2015) that data in support of the functional perspective may be an artifact of stimulus unusualness (and hence, greater memorability, particularly for angry Black faces), we tested whether Black angry faces were indeed rated as particularly unusual compared with the other three categories of faces in both stimuli sets, using the mean unusualness scores for each face. Results suggested that among the Ackerman stimuli, angry faces were rated as more unusual than neutral faces, F(1, 28) = 83.95, p < .001, η p 2 = .75, 95% CI = [0.57, 0.84], but this was not significantly (albeit descriptively) moderated by target race, F(1, 28) = 4.15, p = .051. For the CFD stimuli, angry faces were also rated as more unusual than neutral faces, F(1, 136) = 57.69, p < .001, η p 2 = .30, 95% CI = [0.18, 0.41], but independent of target race, F(1, 136) = 0.46, p = .499 (see Fig. 4).
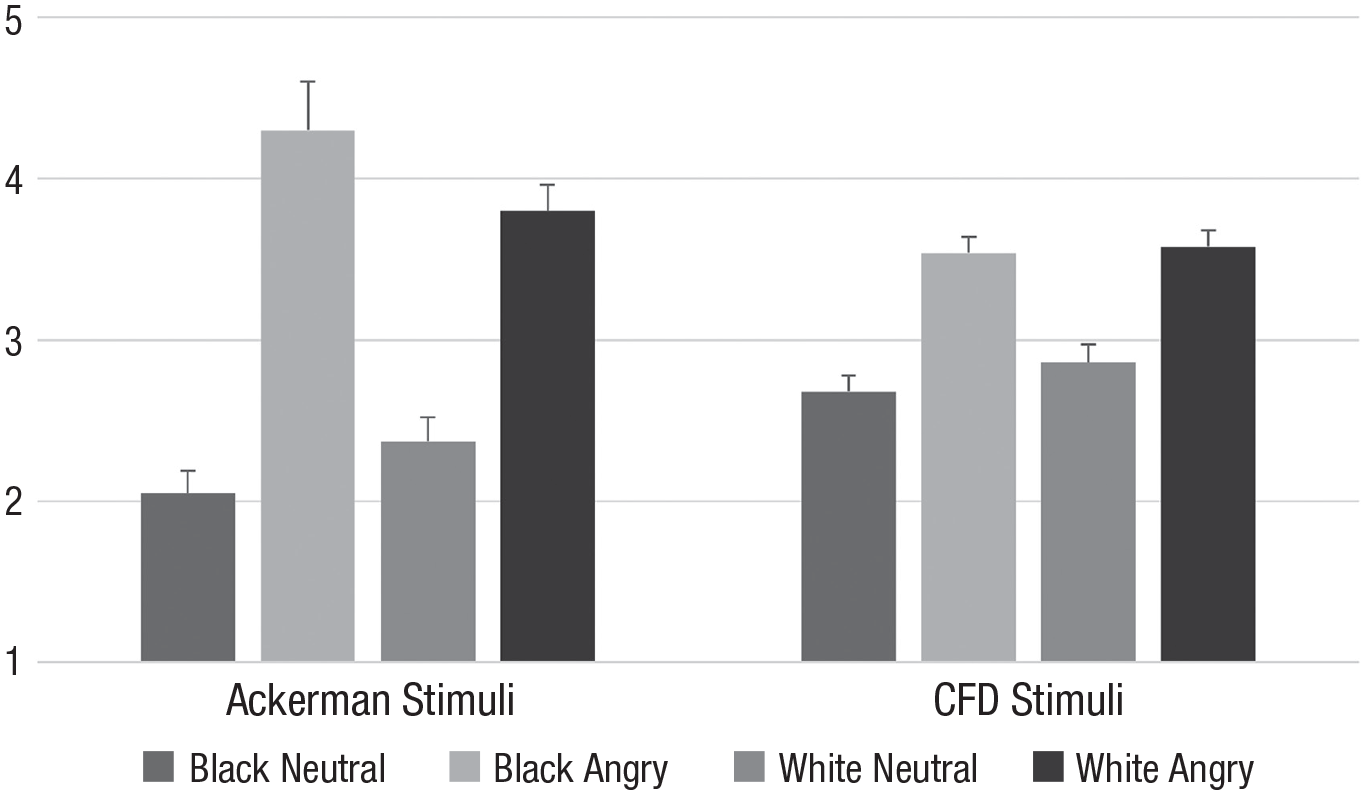
Unusualness ratings as a function of target race and target expression for stimuli used by Ackerman et al. (2006; left side) and Gwinn et al. (2015; right side). CFD = Chicago Face Database.
A raw correlation of the (continuous) recognition ratings with their respective (averaged) unusualness ratings yielded a (weak) indication, however, that participants indeed had particularly strong memory for particularly unusual images, r(12958) = .095, p < .001, 95% CI = [0.078, 0.112]. With this raw correlation providing at least some indication for the role of unusualness, we formally tested whether the memory effects would vanish when we controlled for unusualness. To this end, we first aimed at establishing the conceptually relevant interaction of race and expression on the raw recognition ratings. We conducted linear mixed models predicting recognition ratings of all targets with their consensual unusualness rating, target race, and target expression and their interaction as fixed factors and participants as a random factor. This was also conducted for the dichotomized recognition rating, where the same pattern emerged. For the Ackerman stimuli, these analyses replicated the interaction of target race and target expression (when not controlling for unusualness; B = −0.260, SE = 0.073, p < .001). Adding unusualness ratings to the equation yielded a significant prediction of recognition by unusualness (B = 0.251, SE = 0.034, p < .001) but did not change the critical interaction to nonsignificant (B = −0.469, SE = 0.078, p < .001). For the stimuli sampled from the CFD, however, the mixed linear model on the raw recognition scores failed to replicate the main effect of target race reported above (B = −0.033, SE = 0.055, p = .547). Thus, the raw recognition ratings of only the targets (without controlling for response bias by incorporating reactions to distractors) did not yield the same results as the signal detection sensitivity estimates. Controlling for unusualness (B = 0.240, SE = 0.032, p < .001) was thus not informative for the question of whether this will diminish an effect.
To enhance the comparability with the main analyses, we resorted to sensitivity scores again and included unusualness ratings for both targets and distractors. Because this would have created a constant for the Ackerman stimuli (all participants saw all stimuli either as targets or as distractors), we created a random split for each participant. Specifically, we split both stimulus sets employed in the recognition phase in two equal halves with equal numbers for targets and distractors of each race-by-expression combination. We then calculated sensitivity scores (A′) for each of those halves as well as the consensual unusualness of that half (by averaging consensual ratings for all included stimuli). These sensitivity scores (A′) were then predicted with target race, target expression, and their interaction including a random intercept per participant. As expected, for the Ackerman stimuli this replicated both the main effect of expression (B = −0.064, SE = 0.009, p < .001) and the interaction of target expression and target race (B = 0.056, SE = 0.012, p < .001). Adding the unusualness estimates (B = −0.029, SE = 0.016, p = .071) did not reduce the critical interaction effects to nonsignificance (B = 0.079, SE = 0.018, p < .001), nor did it reduce the (theoretically less relevant) main effect of target expression (B = −0.13, SE = 0.037, p < .001).
For the CFD stimuli, the linear mixed model also replicated the above-mentioned main effect of target race (B = 0.054, SE = 0.009, p < .001). Adding category unusualness (B = 0.006, SE = 0.011, p = .579) did not change this result. Hence, our measure of unusualness provided only weak support for the notion that the angry Black stimuli used by Ackerman were seen as particularly unusual and were thus particularly well remembered.
We had preregistered to also report the (theoretically less informative) results for response bias estimates (as in the study by Ackerman et al., 2006). We will provide only a brief summary and ask readers to refer to the online supplement on the OSF for detailed analyses. In a nutshell, there was a robust response bias (nonparametric B′′d) for the CFD stimuli as well as the neutral Ackerman stimuli to have a more conservative bias for White faces and a liberal bias for Black faces. Thus, participants were more inclined to interpret Black faces as previously encountered and White faces as not previously encountered. For the Ackerman stimuli with angry expressions, no race-contingent response bias occurred.
Discussion
The results of our registered replication study largely mirrored those originally reported by Ackerman and colleagues (2006): The classical ORE of White participants’ worse memory for Black compared with White faces is attenuated (and descriptively albeit not significantly reversed) for angry faces. This was independent of whether the recognition phase was announced (as in the study by Gwinn et al., 2015) or not (as in the original study). Importantly, however, the same effect could not be replicated with stimuli randomly sampled from the CFD (Ma et al., 2015), as done by Gwinn and colleagues (2015). Here, however, the results diverged in that we did not establish an even more pronounced ORE for angry faces (as found by Gwinn et al., 2015) but merely replicated the well-known basic ORE, independent of emotional expression (this effect was also not contingent on whether the recognition was announced).
Our findings thus do not provide a definite answer as to whether the functional perspective or the stereotype congruency perspective is more accurate. Only the original Ackerman stimuli lend support to the functional perspective, whereas the stereotype congruency perspective did not receive any support at all. The present data may thus be more informative at the level of research methodology than theory.
The most important takeaway of our study is that we can thus positively confirm that stimulus selection matters a great deal. Although psychological research is meant to take (more or less random) stimuli as good representations of the information ecology to generalize from their findings to the real world, this goal of “representative design” (Brunswik, 1955) is hardly ever met. Our results highlight the far-reaching consequences of stimulus selection. Although our data cannot speak to the issue of whether the stimuli used by Ackerman or those sampled from the CFD provide a better representation of the information ecology, an argument could be made that stimuli randomly sampled from a photo database developed for other purposes may be more adequate in that regard than a set of stimuli purposefully collected for the research question at hand.
If that were true, something about the Black angry faces employed in the original study led to a better recognition performance than typical for Black faces. Gwinn et al. (2015) already voiced the suspicions that these faces were particularly unusual and hence particularly memorable. We tested this intuition and replicated Gwinn’s finding that indeed the Black angry faces used by Ackerman et al. (2006) were judged as somewhat more unusual. Correlating average unusualness scores with raw recognition ratings provided initial evidence for better memorability of unusual faces. Problematically, however, these raw recognition ratings did not replicate the ORE for the CFD stimuli. This highlights the conceptual distinction between raw recognition (that is partially contaminated by response bias to claim recognizing stimuli) and the methodologically superior sensitivity scores (which are theoretically orthogonal to response biases). It is thus questionable whether the analyses based on raw recognition ratings provide a fair test.
Contrary to the claim that higher unusualness might explain the better memory performance, however, statistically controlling for unusualness did not eliminate the interaction of race and expression on either raw recognition ratings or sensitivity scores. At present, we can thus conclude that despite some initial hints in that direction, we lack strong evidence for the role of unusualness of Black angry stimuli driving the effect. In the current study, unusualness ratings followed exposure to and memory recall of all stimuli. Because the CFD images were developed in a highly controlled setting and therefore more similar to each other, this earlier exposure could bias the mental prototype that participants were asked to generate in the unusualness ratings. This could have had an impact in subsequent ratings, leading to stronger unusualness ratings for the less standardized Ackerman stimuli. Furthermore, it could be that the faces that participants remembered particularly well were judged to be more unusual post hoc.
Irrespective of the question of which set is more or less representative or which of their respective features is responsible for the divergent patterns of results, we can assert that empirical robustness and replicability do not necessarily translate to ecological validity and applicability to real-life settings. To make psychological science informative for real-world problems (such as eyewitness testimonies), our experimental designs need to mimic the information ecology, ideally by employing random sampling of stimuli from the population of potential stimuli in the spirit of representative design (Brunswik, 1955). Admittedly, sampling from the CFD also has its limitations in that regard because, strictly speaking, the observed effects can be generalized only to the population from which we sampled—that is, full frontal close-ups of Black and White Chicago residents in salt-and-pepper colored shirts. Future research may further strengthen the scope of generalizability by sampling images from even wider databases less selectively (e.g., Bainbridge et al., 2013).
Footnotes
Acknowledgements
We thank Alex Koch, Zen Nguyen, Angelique Alexos, Angelysse Madsen, Harrison Heymann, Jenna Williams, Andrea Rivera-Martinez, Michelle Verlinsky, Saarthak Ravi, Ray Najjar, Meridith Mok, Abigail Schwartz, Jessi Ingram, Dylan Morrow, Helen Yap, and Spencer Kunz for their help in collecting data.
Transparency
Action Editor: Kate Ratliff
Editor: Patricia J. Bauer
Author Contribution(s)
Roland Imhoff and Barbara C. N. Müller contributed equally to this study.