
Abstract
Much of what we know and love about music hinges on our ability to make successful predictions, which appears to be an intrinsically rewarding process. Yet the exact process by which learned predictions become pleasurable is unclear. Here we created novel melodies in an alternative scale different from any established musical culture to show how musical preference is generated de novo. Across nine studies (n = 1,185), adult participants learned to like more frequently presented items that adhered to this rapidly learned structure, suggesting that exposure and prediction errors both affected self-report liking ratings. Learning trajectories varied by music-reward sensitivity but were similar for U.S. and Chinese participants. Furthermore, functional MRI activity in auditory areas reflected prediction errors, whereas functional connectivity between auditory and medial prefrontal regions reflected both exposure and prediction errors. Collectively, results support predictive coding as a cognitive mechanism by which new musical sounds become rewarding.
Keywords
Why do we love music? In contrast to other pleasures in life, such as food and sex, music has no obvious adaptive value, yet an attraction to music is ubiquitous across cultures and across the life span. Indeed, both listening to and performing music ranks highly among life’s greatest pleasures (Dube & Le Bel, 2003) and reliably engages the dopaminergic reward system (Ferreri et al., 2019; Salimpoor et al., 2011, 2013).
Classic work has long examined the hypothesis that the attractiveness of a stimulus is enhanced by exposure: The mere-exposure effect posits that repeated exposure to a given perceptual stimulus is a sufficient condition to enhance one’s attitude toward it (Temme, 1984; Zajonc, 1968). Supporting this idea, experiments in visual aesthetics have shown that manipulating the co-occurrence of different stimulus features and frequencies of stimulus presentation (e.g., comparing homogeneous presentations vs. heterogeneous presentations) can change the strength of the exposure effect on preference (Bornstein, 1989; Seamon et al., 1998). In the musical domain, repeated exposure to sound sequences can change preferences for those sequences (Loui et al., 2010). This attitudinal change can occur regardless of the complexity of musical stimuli (Madison & Scholde, 2017) and can give rise to habituation effects after many repeated exposures as well as familiarity effects after fewer exposures, resulting in the classic inverted-U model of preference as a trade-off between familiarity and novelty (Berlyne, 1971; Chmiel & Schubert, 2017; Schultz, 2015). These lines of evidence for the mere-exposure effect suggest that the main determinant of musical preferences is repeated exposure to co-occurring sequences of stimuli—or, in statistical terms, the n-gram frequency of exposure.
More recently, neuroscientific studies have inspired a predictive-coding model of music-evoked pleasure. Because predictions and reward signals are ubiquitous features of the central nervous system that underlie perception, action, and emotion (Clark, 2013; Engel et al., 2001; Friston, 2010; Schultz, 2000), so too may the rewarding effects of music listening come from making successful predictions and minimizing prediction errors (Gold, Pearce, et al., 2019; Vuust et al., 2022). In addition to sequence-specific knowledge, or veridical expectations, musical predictions are also informed by statistically learned patterns in music, or schematic expectations (Schubert & Pearce, 2016). Schematic expectations for music, according to the predictive-coding model, can unfold at multiple levels, whether they be stylistic (hip-hop, jazz), structural (melody, tonality), temporal (rhythm, meter), and/or acoustic (pitch, timbre) factors (Guo & Koelsch, 2016; Huron, 2006; Justus & Bharucha, 2001; Margulis, 2014). The predictive-coding model can account for the mere-exposure effect by positing that repeated exposure increases the efficiency of predictions (Ivanchei & Asvarisch, 2018), resulting in increased liking of stimuli that carry predictive value (Braem & Trapp, 2019).
An important motivation of the predictive-coding model comes from work on statistical learning, classically applied to the study of language acquisition (Saffran et al., 1996). Studies in statistical learning have manipulated transitional probabilities (i.e., the likelihood that one item occurs immediately after another in a sequence of various stimuli; Schapiro & Turk-Browne, 2015) to test their effects on learning, memory, and perceptual segmentation. Applied to the domain of musical expectations, becoming familiar with these transitional probabilities can also be thought of as forming schematic expectations, thus offering a mechanism by which novel music can be preferred. Furthermore, because the predictive-coding model draws on theories of dopaminergic function (Clark, 2013; Engel et al., 2001; Friston, 2010; Schultz, 2000), measuring activity in the reward system of the brain with functional MRI (fMRI) is a strong test of our ability to manipulate exposure and prediction.
Statement of Relevance
All known societies appear to enjoy listening to music, yet there is still scientific debate as to what makes music so pleasurable and what function it might serve. One prominent theory is that music co-opts our inclination to try to predict events in the future, and we find the ability to form successful predictions to be rewarding. The relationship between learning to predict in music and reward has been difficult to prove, however, because we typically learn the patterns of most music we encounter early in life. Here, we overcome this limitation by evaluating how preferences develop over time to music composed in a completely unfamiliar musical system. Across nine studies, we show that listeners from two different cultures (the United States and China) can rapidly learn this novel musical system from repeated exposure and quickly come to prefer melodies for which they can successfully predict how they will end. We find that this learning is tied to the activity and functional connectivity of the auditory and reward systems of the brain and influenced by individual differences in reward sensitivity to music. Collectively, the results offer a possible mechanism by which music can become rewarding.
Although the precise relationships between exposure, prediction error, and reward may vary across cultures (Savage & Fujii, 2022) and/or with individual differences in reward sensitivity to music (Gold, Mas-Herrero, et al., 2019), it is often challenging to understand how exposure relates to learning and reward because when encountering most stimuli, even for the first time, we make use of overlearned predictions to which we may have been exposed throughout our lives. This is especially the case with musical structures, such as common sets of pitches or musical scales that we have implicitly acquired from lifelong exposure (Savage et al., 2015). As a concrete example of such knowledge, most listeners within Western cultures show implicit knowledge of, and preference for, common-practice Western musical-scale structures based around the octave, which is a doubling of acoustic frequency (Gill & Purves, 2009). We circumvent this challenge of overlearned predictions by incorporating a unique and unfamiliar musical system: the Bohlen-Pierce (B-P) scale, which is based on a tripling of acoustic frequency, thus differing acoustically and statistically from the world’s existing musical systems (Loui, 2022).
Here we extend and clarify the predictive-coding model by testing the effects of exposure and prediction error on musical learning and preference using naturalistic music composed in grammatical structures defined in the B-P scale (Loui et al., 2010). In Studies 1 through 4, we investigated the degree to which self-reported familiarity and liking ratings reflect exposure and prediction error. Exposure was manipulated by presenting novel naturalistic musical melodies a variable number of times, and prediction error was manipulated through structural alterations to the endings of the exposed melodies, resulting in changes to the statistical properties (frequencies and transitional probabilities) relative to the exposure set (as illustrated in Fig. 1). In Study 5, we tested these relationships in cases of congenital and acquired music anhedonia. In Study 6, we reversed the presentation of altered and original sets of melodies; this allowed us to tease apart the differential contributions of schematic expectations (based on transitional probability of chords) and veridical expectations (based on n-gram frequency of the whole melody) to familiarity and liking ratings. In Study 7, we ensured that the results from previous studies were not due to anchoring effects. In Study 8, we tested the effects of culture on predictions and reward in a cross-cultural replication on a sample from China. Finally, in Study 9, we evaluated effects of this learning on reward-system activity and connectivity using fMRI. Together, the studies traced the trajectory of preference learning from exposure to melodic and statistical structures in a novel musical system. The human ability to recognize and learn statistical properties of stimuli via mere exposure has been posited to underlie multiple cognitive tasks beyond music, including language acquisition (Han et al., 2011; Saffran et al., 1996) and decision-making (Haruno et al., 2004). Accordingly, our results provide a mechanistic account not only for why people enjoy music but also the circumstances under which our ability to predict leads to reward, a concept that underlies much of motivated behavior. The stimuli, data, and code are available online at https://osf.io/n84d5, along with the preregistration for these studies.
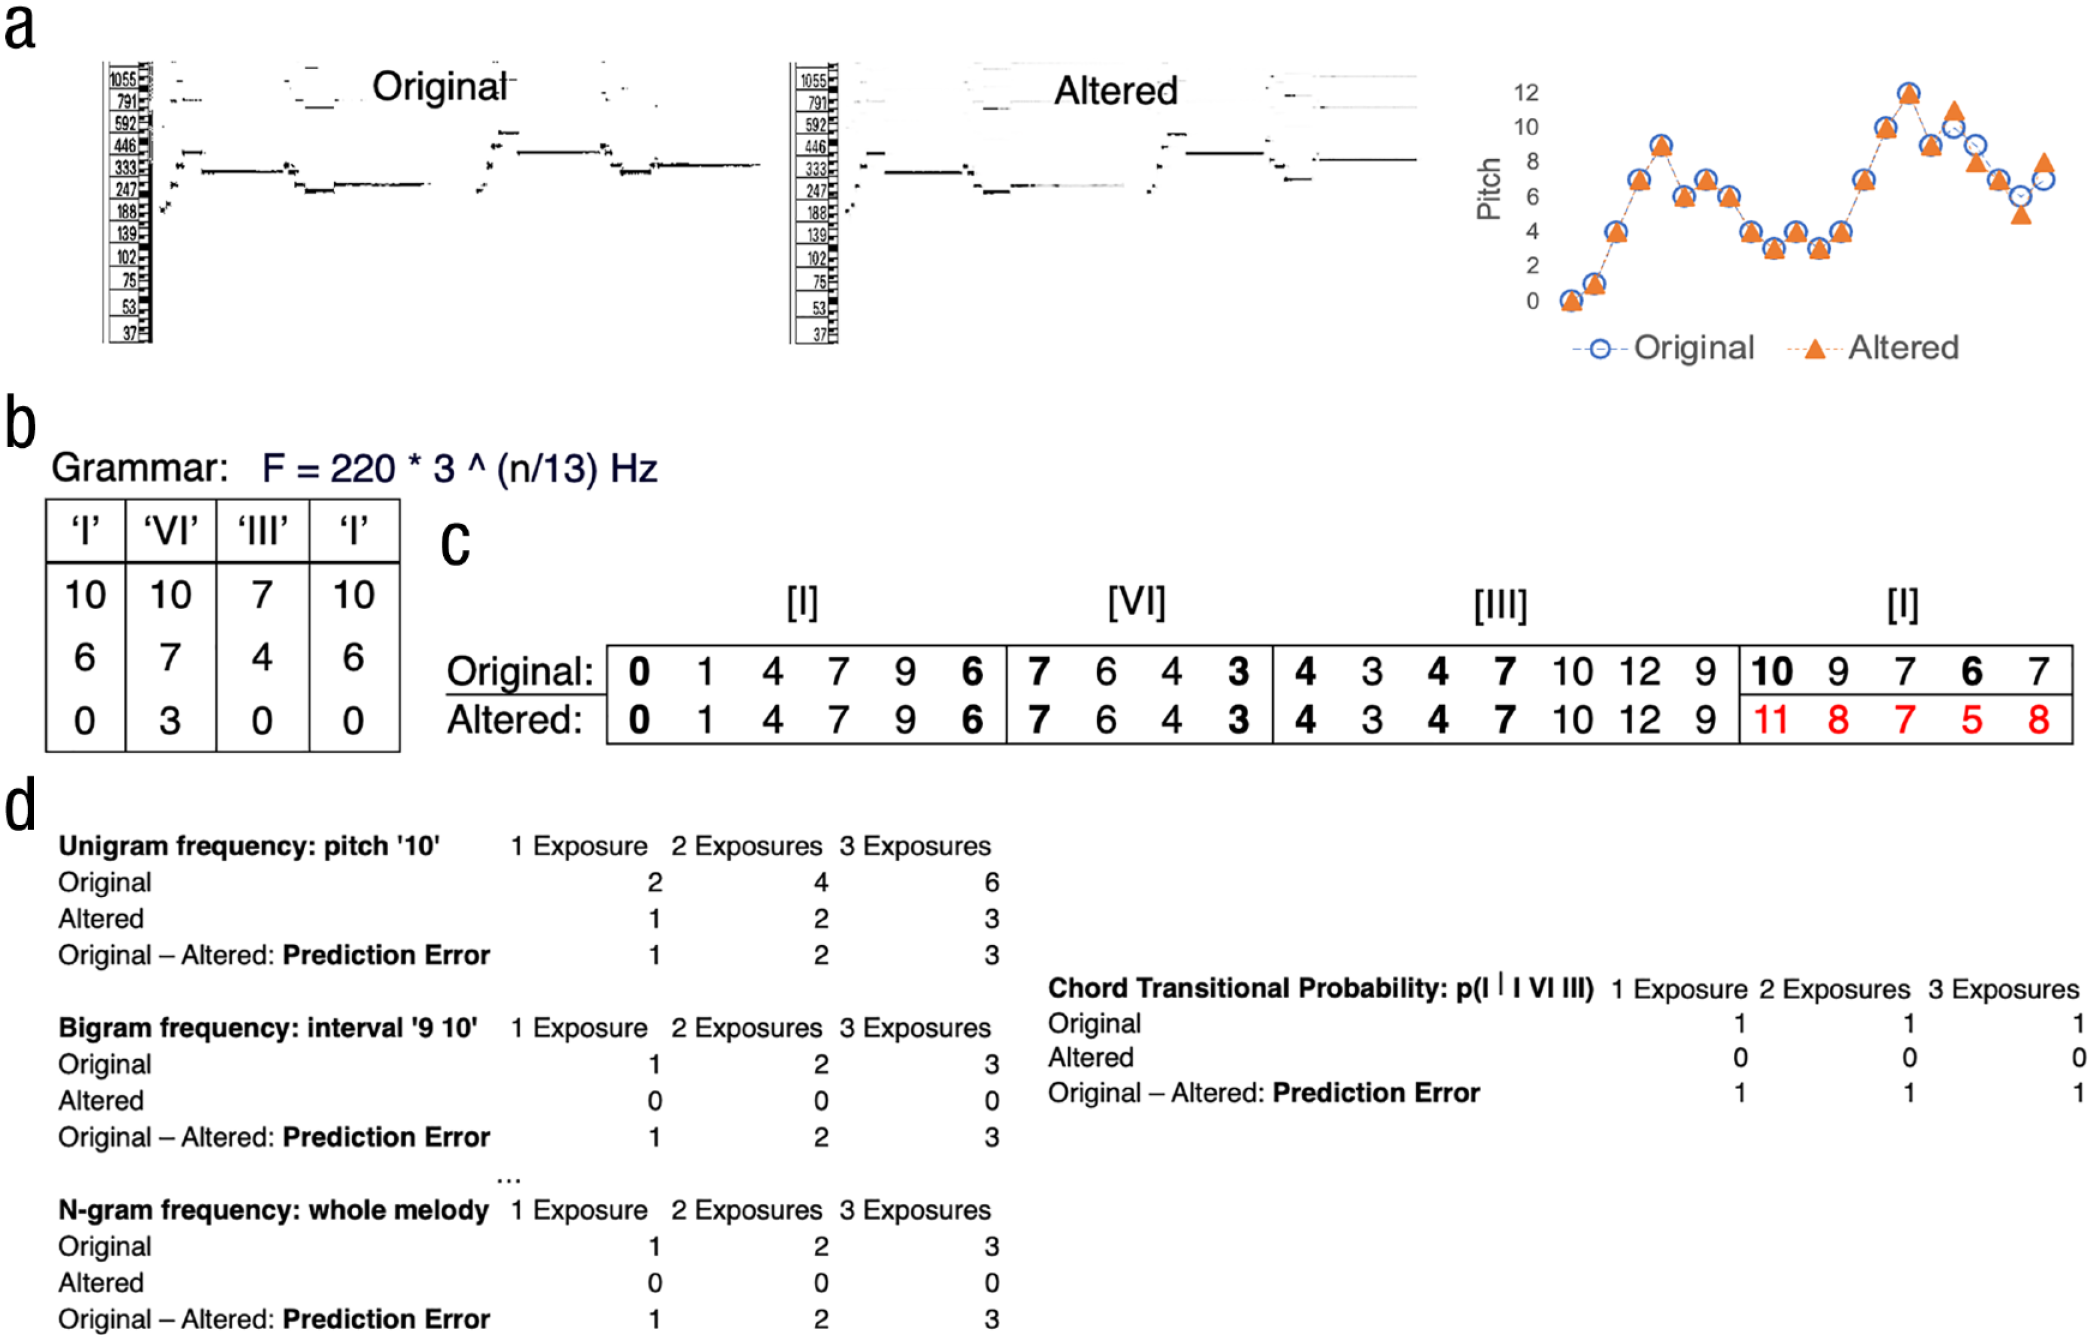
A melody in the Bohlen-Pierce scale and its predicted effects of exposure and prediction error on familiarity and liking. Pitch-time representations of an example original melody and its altered counterpart are shown in (a): pseudospectrogram representations of the original and altered melodies are shown in the two left panels, and the subtle difference between the two melodies can be seen by overlaying the two melodies as shown in the right panel. Grammatical structure of the Bohlen-Pierce scale (from Loui et al., 2010) is shown in (b): Each roman numeral denotes one chord with three chord tones. The fundamental frequency of each chord tone “n” is determined by the Bohlen-Pierce scale formula on the right. Numerical representations of the example original and altered melodies from (a) are shown in (c). Because we opted for more naturalistic musical stimuli, each melody also contains nonchord tones (“passing tones”) in addition to chord tones that belong to the chord progression. In panel (c), chord tones within the original and altered melodies are shown in bold. Importantly, the altered ending, which is shown in red, does not contain any tones from the last chord as determined by (b). Example unigram, bigram, and n-gram frequencies given one, two, and three exposures to the original and altered melodies and the differences between them that give rise to the prediction error are shown in panel (d) left. In panel (d) right: transitional probability of the underlying chords are shown given different numbers of exposure to the original and altered melodies and the difference between them, that gives rise to the prediction error.
Method
Stimuli
The stimuli used in all studies were composed in the B-P scale. Although most musical systems around the world are based around the octave, which is a 2:1 ratio in frequency, the B-P scale is based on a 3:1 ratio (tritave rather than octave) that is divided into 13 logarithmically even steps. This 13-tone scale can be used to generate musical intervals and chords that have low-integer ratios and are perceived as psychoacoustically consonant (Mathews et al., 1988). Although music in the B-P scale is known to some composers, performers, conductors, and scholars, it is considered “nonstandard” (Hajdu, 2015) and has not been adopted into any mainstream musical culture to date. Monophonic melodies were composed in the B-P scale by a musician and research assistant in the lab (E. Zhang) in the digital audio workstation Ableton Live on a Korg nanoPAD2 USB MIDI and played on a MIDI clarinet instrument from the plugin library Xpand!2 by Air Music Tech. The clarinet was chosen because its timbre has higher energy at odd harmonics than at even harmonics; this spectral distribution is easier to learn because of its congruence with the B-P scale (Loui, 2022). In total, fourteen 20-s B-P melodies were composed that followed the same artificially derived harmonic structure as past studies (Loui et al., 2010). Light compression and reverb were applied to all stimuli to bring them to the same volume and were subsequently exported as 44.1kHz .mp3 files. An altered version of each melody was also created to be identical to the original piece except for the ending, which was changed to violate the grammatical structure of the B-P scale. Specifically, the violations preserved the rhythmic structure (i.e., timing and length of notes) of an earlier section of the melody as reflected by a “call-and-response” effect but deviated from the melodic structure (i.e., stepwise relationship between notes) by randomly shifting the pitch of the notes either up or down from chordal tones of the expected last chord (Loui et al., 2009, 2010, 2011). The call-and-response effect was implemented in all melodies to incite a sense of musical completeness and was mediated by both rhythmic and melodic aspects, so the effect was partially preserved by maintaining a mirrored rhythmic structure to control for the altered melodic structure. The original and altered melodies are available online at https://osf.io/n84d5, along with the preregistration as well as data and code for this study. In all studies except Study 6, the altered melodies were presented only once (during the postexposure phase). Finally, two of the melodies were used only as part of the perceptual cover task (during the exposure phase). A vibrato effect was added to a single note in these two melodies, and during the task participants were asked to press a key whenever they heard the vibrato note. To decrease expectations, we created six versions of each, in which the location of this vibrato note varied across each version.
Study 1
Participants
An a priori power analysis using pilot data (n = 46) indicated that a sample size of 165 would achieve 0.80 power to detect a medium effect size (Cohen’s f = 0.27) for the effect of the number of presentations on liking ratings at a significance level of 0.05. Participants were Prolific workers in the United States between the ages of 18 and 65 years. We recruited 234 participants for Study 1, of which 66 participants were excluded for failing our perceptual cover task (see below), resulting in a final sample size of N = 169 (104 females; mean age = 32.03 years).
To measure individual differences in music-reward sensitivity and identify musical anhedonics, participants completed the Barcelona Music Reward Questionnaire (BMRQ), a 20-item questionnaire based on five factors: musical seeking, emotion evocation, mood regulation, sensory-motor, and social reward. Participants also completed the Goldsmith Musical Sophistication Index (Gold-MSI), a self-report measure of musical skills and behaviors (Müllensiefen et al., 2014); the Revised Physical Anhedonia Scale (PAS), a self-report measure of general anhedonia (Chapman et al., 1976); and the Ten-Item Personality Inventory (TIPI), a brief measure of the Big Five personality traits (Gosling et al., 2003). All scales were scored in accordance with the original publications.
Procedure
For all studies in this report, participants first consented to participate according to Northeastern University Institutional Review Board-approved protocol. Participants were screened using an online headphone check (Woods et al., 2017) to ensure that they were using headphones and could hear our stimuli properly before undergoing the three phases of our study. In Phase 1 (preexposure), participants listened to eight of the B-P melodies one at a time and provided liking and similarity ratings using a Likert scale (1 = strongly dislike to 6 = strongly like; 1 = not familiar at all to 6 = very familiar)for each melody. Because the preexposure ratings were intended for a different analysis on the effects of novelty rather than reward learning, they will be presented in a separate report; here we focus on postexposure ratings.
In Phase 2 (exposure), the eight melodies heard in Phase 1 were played for participants a varying number of times (either two, four, eight, or 16), with two melodies in each condition (not including the single presentation used for the preexposure ratings in Phase 1). The specific melodies in each of the four exposure conditions were counterbalanced across participants. Furthermore, the presentation order was pseudorandomized so that no melody was heard consecutively. During this phase, participants were asked to complete a perceptual cover task in which they were instructed to listen for notes that contained a “warble” sound (vibrato) and to press the “v” key on their keyboard as soon as they heard it. Six of the trials (created from two different B-P melodies) heard in the exposure phase contained vibrato notes, with the vibrato occurring at different points of the melody. In total, participants heard sixty-six 20-s melodies during Phase 2, resulting in an exposure phase that lasted 22 min.
During Phase 3 (postexposure), participants heard 20 total melodies: each of the eight melodies again (without vibrato—the same as Phase 1), along with two new melodies that they had not heard in Phase 1 or 2 (thus, the zero-exposure condition), as well as the altered versions (different endings) of these 10 melodies. Including the zero-exposure condition additionally allowed us to compare the effects of schematic and veridical expectations because any differences in the ratings for this condition must be attributed to the learning of schematic expectations. Participants provided liking and familiarity ratings for each of these 20 trials using the same scale as in Phase 1. After completing Phase 3, participants were redirected to an online survey where they provided demographic information and completed individual-difference measures, including the BMRQ and PAS.
Exclusion criteria
Participants who did not accurately perform the perceptual cover task of identifying the warble/vibrato notes during exposure were removed from all subsequent analyses. Specifically, for each participant, we calculated d′ from the total number of hits (number of vibrato melodies for which a “v” was pressed), misses (number of vibrato melodies for which a “v” was not pressed), false alarms (number of nonvibrato melodies for which a “v” was not pressed), and correct rejections (number of nonvibrato melodies for which a “v” was not pressed). The difference between z-transformed hit and false-alarm rates was used to calculate d′, with the adjustment for which 0.5 errors were assumed for participants who made no errors (Wickens, 2001). The d′ measure therefore indicates how well participants could discriminate between a warble note and a nonwarble note and was used to remove participants who did not follow instructions for the perceptual cover task. Any participant who had a d′ < 1 was removed from subsequent analyses (Wickens, 2001), as was specified in our preregistration. However, in follow-up analyses we did explore whether keeping the participants who did not reach the d′ criterion changed the results; these exploratory analyses are included in the Supplemental Material available online.
Study 2
Participants
To maintain consistency, we used the same target sample size from our a priori power analysis for Study 1 for Studies 2 through 4. We recruited 221 participants, 57 of whom were excluded for failing our perceptual cover task, resulting in a total sample size of 164 (93 females; mean age = 32.67 years).
Procedure
Participants underwent the same procedure as in Study 1, with the exception that 10 melodies were presented either, two, four, six, 10, or 14 times during Phase 2 (the exposure phase), with two melodies in each condition. The rationale behind these different numbers of presentations was to chart a continuous trajectory of exposure and relate it to liking and familiarity, without fatiguing individual participants with an excessively long exposure phase.
Study 3
Participants
We recruited 214 participants, 45 of whom were excluded for failing our perceptual cover task, resulting in a total sample size of 169 (89 females; mean age = 32.27 years).
Procedure
Participants underwent the exact same procedure as in Study 1, with the exception that the order of melodies heard in the preexposure phase was completely randomized.
Study 4
Participants
We recruited 222 participants, 57 of whom were excluded for failing our perceptual cover task, resulting in a total sample size of 165 (83 females; mean age: 31.78 years).
Procedure
Participants underwent the exact same procedure as in Study 2, with the same 10 melodies during exposure phase, with the exception that the order of melodies heard in the preexposure phase was randomized and counterbalanced across participants.
Study 5
Participants
The congenital music-specific anhedonic (a 58-year-old male with the initials BW) had participated in a previous case study in our lab (Loui et al., 2017). The acquired music-specific anhedonic (a 53-year-old female with the initials NA) had reached out to the final author (P. Loui) after self-reporting a loss in pleasure derived from music listening after having received repetitive transcranial magnetic stimulation treatment for depression after the death of a loved one. Because both of these cases were self-identified as musically anhedonic rather than recruited online using Prolific, they were treated as separate case studies rather than included in the same group for Studies 1 through 4. Both of these cases had low scores on the extended BMRQ (eBMRQ; eBMRQ: BW = 30; eBMRQ: NA = 43; Cardona et al., 2022) but normal PAS scores (PAS auditory: BW = 8; PAS auditory: NA = 4; PAS nonauditory: BW = 14; PAS nonauditory: NA = 15).
Stimuli
We used a subset of four nonaltered melodies that were rated, on average, the highest in postexposure liking ratings across Studies 1 through 4 for Study 6. These, along with their altered versions, resulted in eight unique melodies presented to the participants in this study. Participants also completed the eBMRQ, which includes an additional sixth factor consisting of four additional items that measures experiences of absorption in music listening (Cardona et al., 2022).
Procedure
Participants underwent the same procedure as previous studies, with the exception that melodies were presented either zero, four, 10, or 14 times during the exposure phase and that there was only one melody assigned to each condition.
Study 6
Participants
We recruited 279 participants, 116 of whom were excluded for failing our perceptual cover task, resulting in a total sample size of 163 (64 females; mean age: 35.46 years).
Procedure
Participants completed the same procedure as in Study 1, with the exception that altered melodies were presented in the preexposure and exposure phase of the study. In this study, original melodies were presented only in the postexposure phase.
Stimuli
The same stimuli used in Studies 1 and 3 were used in Study 5. Participants in Study 5 also completed the eBMRQ instead of the BMRQ.
Study 7
Participants
We recruited 244 participants, 64 of whom were excluded for failing our perceptual cover task, resulting in a total sample size of 180 (78 females; mean age = 35.62 years).
Procedure
Participants underwent the exact same procedure as in Study 1, with the exception that they were not asked to provide familiarity ratings.
Study 8
Participants
Participants were recruited via WeChat, a Chinese instant messaging app. A poster containing a QR code was sent in several group messages of students of Beijing Normal University who subsequently shared this code via word of mouth and personal WeChat messages. We recruited 216 participants but excluded 56 for failing our perceptual cover task and four for completing the task twice, resulting in a total of 156 (106 females; mean age: 23.09 years).
Stimuli
The same stimuli used in Studies 2 and 4 were used in Study 7. Participants in Study 7 also completed the eBMRQ instead of the BMRQ.
Procedure
The QR code led to a questionnaire that recorded participants’ name and email address. An email was then sent to the address participants provided that contained a link to the experiment. This link redirected participants to our experiment, in which they subsequently underwent the same Procedure as Study 4.
Study 9
Participants
Participants in this study were either undergraduates at Northeastern University who completed the study (both the online task and an in-person fMRI scan) for course credit or young adults recruited via word of mouth from the Boston area. A total of 21 participants (15 females; mean age = 19.8 years) completed the fMRI version of our task.
Stimuli
The same stimuli and materials that were used in Study 6 were used in Study 7, including the eBMRQ.
Procedure
Participants underwent the same procedure as in Study 5 as well as an fMRI scan immediately after completing the online behavioral study. During the scan, participants listened to 24 clips of music once. Eight of the clips were B-P melodies that participants had heard previously during the task (at 0/4/10/14 presentations; both original and altered melodies). The remaining trials acquired were not in the B-P scale and were not used in the analysis for the current study. Each trial consisted of 20 s of passive listening followed by 2 s to rate the melody for liking (on a scale from 1 to 4) and 2 s to rate the melody for familiarity (also on a a scale from 1 to 4).
fMRI data acquisition
Images were acquired using a Siemens Magnetom 3T MR scanner with a 64-channel head coil at Northeastern University Biomedical Imaging Center. fMRI data were acquired as echo-planar imaging functional volumes covering the whole brain in 48 axial slices—fast repetition time (TR) = 475 ms, echo time (TE) = 30 ms, flip angle = 60°, field of view (FOV) = 240 mm, voxel size = 3 × 3 × 3 mm3, slice thickness = 3 mm, anterior to posterior, z volume = 14.4 mm—in a continuous-acquisition protocol of 1,440 volumes for a total acquisition time of 11.4 min. T1 images were also acquired using an MPRAGE sequence, with one T1 image acquired every 2,400 ms for approximately 7 min. Sagittal slices (0.8 mm thick, anterior to posterior) were acquired covering the whole brain (TR = 2,400 ms, TE = 2.55 ms, flip angle = 8°, FOV= 256, voxel size = 0.8 × 0.8 × 0.8 mm3). As part of the existing protocol we also acquired resting-state and diffusion tensor imaging sequences, but these were not used for this study.
fMRI data analysis
Preprocessing
fMRI data were preprocessed using Statistical Parametric Mapping Version 12 (SPM12; Penny et al., 2011) with the CONN toolbox (version CONN22.a; Whitfield-Gabrieli & Nieto-Castanon, 2012). Preprocessing steps included functional realignment and unwarping, functional centering, slice-time correction, outlier detection using the artifact-detection tool, functional and structural segmentation and normalization to the Montreal Neurological Institute (MNI) template, and functional smoothing to an 8-mm gaussian kernel (Friston et al., 1995). Denoising steps for fMRI data included white matter and cerebrospinal fluid confound correction (Behzadi et al., 2007) and bandpass filtering to a frequency between 0.008 and 0.09 Hz.
First- and second-level analyses were completed in SPM12. For each participant, data were converted from 4D to 3D images, resulting in 1,440 scans. The model was specified using the following criteria: interscan interval = 0.475 s, microtime resolution = 16, microtime onset = 8, and duration = 42. Only data from the time while the participant was listening to the musical excerpt were included in this model. Each of the eight trial types (0/4/10/14 presentations of both original and altered melodies) was modeled separately, and trials during which participants were listening to non-B-P melodies were included as a separate condition so as to be regressed out of the model’s intercept. The resulting first-level contrasts were then analyzed using a one-sample t test across all participants at the second level. Whole-brain results were rendered to a standard MNI brain. Results from the second-level analyses were statistically corrected using a voxel threshold of p < 0.05 (false discovery rate-corrected) through the CONN toolbox. Beta weights for regions of interest (ROIs) in Heschl’s gyrus (HG) and the medial prefrontal cortex (mPFC) were extracted from participants’ first-level SPM.mat files using the CONN toolbox atlas and correlated separately for each trial to test for the effects of alteration and number of presentations on the functional connectivity between auditory and reward-sensitive regions.
Results
Analysis plan
For all studies, participants provided familiarity and liking ratings for melodies composed in a predefined grammatical structure (based on the B-P scale; Loui et al., 2010) that were either (a) presented a variable number of times in an exposure phase (effect of exposure) or (b) altered to have a different ending from the original melodies that were presented during exposure (effect of prediction error). In each study, only one set of melodies was presented during the exposure phase (“original” melodies), whereas the other set of melodies contained previously unexposed endings and therefore generated a prediction error (“altered” melodies). Both groups of melodies were rated on both familiarity and liking in a postexposure rating phase.
To investigate the effects of exposure and prediction error on these postexposure familiarity and liking ratings, we constructed linear mixed-effect models using the R package lme4 (Bates et al., 2014). We included prediction error—“original” (no prediction error elicited) versus “altered” (prediction error elicited)—as an interaction term in these models, which was effect-coded such that the main effect of exposure represents the average effect across both types of melodies. In all models, we investigated the main effect of exposure, the main effect of prediction error, and the difference in the effect of prediction error as a function of exposure (the interaction term in the model). This interaction term also allowed us to tease apart the effects of n-gram frequencies and transitional probabilities on statistical-learning mechanisms. As illustrated in Figure 1, if preference is informed by n-gram frequencies, then the size of the prediction error would increase with exposure (i.e., there would be an interaction between exposure and prediction error). Conversely, if preference is informed only by transitional probability, then there would be no interaction because the size of the prediction error does not increase with exposure. We specified by-participant random slopes (including the interaction term) and intercepts and by-item (melody) random intercepts. Continuous predictor and dependent variables were standardized before being entered into the model. The significance of fixed effects (exposure and prediction error) was determined using the Satterthwaite method to approximate the degrees of freedom with the lmerTest package (Kuznetsova et al., 2017).
Study 1
Participants listened to eight monophonic musical melodies composed in the B-P scale during the exposure phase. The number of presentations varied for each melody (either two, four, eight, or 16 times with two melodies in each condition). After exposure, participants rated familiarity and liking for each melody along with two melodies not heard in the exposure phase (thus presented zero times during exposure), as well as altered versions of the 10 melodies that were identical except for an unexpected ending. For familiarity ratings, there was a significant interaction between exposure and prediction error, β = 0.01, t(1883) = 3.99, p < 0.001: The effect of prediction error—main effect: β = 0.16, t(1169) = 6.33, p < 0.001—increased as a function of exposure—main effect: β = 0.33, t(171) = 21.23, p < 0.001. For liking ratings, there was also a significant interaction between exposure and prediction error, β = 0.05, t(1200) = 2.27, p = 0.02: The effect of prediction error on liking ratings—main effect: β = 0.11, t(1793) = 4.94, p < 0.001—also increased as a function of exposure—main effect: β = 0.03, t(1169) = 2.05, p = 0.04. Thus, both exposure and prediction errors informed both familiarity and liking ratings because participants reported more preference and familiarity for melodies that were both exposed more often and that did not elicit a prediction error. These results are consistent with predictions of the predictive-coding model, such that the effect of prediction error on liking ratings increased with the magnitude of the error.
Study 2
In Study 2, we extended the findings from Study 1 to determine the degree to which changing the specific numbers of presentations during the exposure phase affected liking ratings. In a new group of participants, we replicated Study 1 but with melodies that were presented either zero, two, four, six, 10, or 14 times. For familiarity ratings, there was again a significant interaction between exposure and prediction error, β = 0.06, t(3411) = 2.81, p = 0.005: Again, the effect of prediction error—main effect: β = 0.14, t(1545) = 5.87, p < 0.001—increased as a function of exposure—main effect: β = 0.3, t(163) = 15.71, p < 0.001. For liking ratings, we again found a significant main effect of number of presentations, β = 0.02, t(163) = 2.1, p = 0.04, and prediction error, β = 0.02, t(171) = 6.35, p < 0.001. However, we did not detect an interaction between prediction error and exposure, β = 0.13, t(3179) = 1.06, p = 0.29. Because the sample size of these studies was chosen to detect the effect of exposure rather than an interaction (see the Materials and Methods section), the lack of interaction could simply be due to insufficient statistical power; thus, we went on to replicate and extend these studies and to test for an interaction with aggregated data across several studies.
Studies 3 and 4
Studies 3 and 4 were designed to replicate the findings from Studies 1 and 2 with a new sample. Study 3 used the same numbers of presentation as Study 1 (0, 2, 4, 8, 16), and Study 4 used the same numbers of presentation as Study 2 (0, 2, 4, 6, 10, 14). For familiarity ratings in Study 3, there was a significant interaction between exposure and prediction error, β = 0.07, t(2305) = 2.79, p = 0.005: Again, the effect of prediction error, β = 0.14, t(1168) = 5.81, p < 0.001, increased as a function of the number of presentations—main effect: β = 0.33, t(168) = 18.81, p < 0.001. For liking ratings, we also replicated the main effect of exposure, β = 0.06, t(169) = 3.66, p < 0.001. Again, melodies that did not elicit a prediction error were preferred over melodies with prediction errors, β = 0.07, t(1507) = 3.15, p = 0.002. There was no interaction between the two, β = 0.01, t(1434) = 0.56, p = 0.57. For familiarity ratings in Study 4, we replicated the main effect of exposure, β = 0.34, t(163) = 19.62, p < 0.001, and prediction error, β = 0.17, t(1923) = 7.08, p < 0.001. We did not detect an interaction between prediction error and exposure, β = 0.04, t(2026) = 1.66, p = 0.1. For liking ratings in Study 4, we replicated the significant effect of exposure, β = 0.03, t(162) = 2.14, p = 0.03. Melodies that did not elicit a prediction error were once again rated as more liked than melodies that did, β = 0.09, t(3316) = 4.67, p < 0.001. There was no interaction between prediction error and exposure, β = 0.02, t(1801) = 0.87, p = 0.38. Together, these four studies consistently show that the main effects of exposure and prediction error were robust for both familiarity and liking, but the interaction was much more variable, especially for liking. Because Studies 1 through 4 used different samples of participants but the same stimuli with different numbers of presentations, we proceeded to combine the data from these studies for a mini meta-analysis to evaluate the effects of, and interaction between, prediction error and exposure on familiarity and liking across a larger sample.
Mini meta-analyses of Studies 1 through 4
Familiarity ratings show a logarithmic relationship with exposure
When considering the shape of the relationship between exposure and familiarity, we expected that familiarity ratings would show a logarithmic relationship with exposure (i.e., participants would learn the stimuli after a certain amount of presentations, after which subsequent presentations do not make them more familiar), as opposed to a more linear relationship (i.e., ratings continue to increase with the exposure). We compared the fit between logarithmic and linear models for combined data across Studies 1 through 4 (n = 667). These models had the same random-effects structure as previous models. Results from this mini meta-analysis showed both the main effects of the number of presentations and alterations, as well as significant interactions between alterations and the number of presentations, in both linear and logarithmic models. As suggested by Zuur et al. (2009), we estimated parameters using maximum likelihood to enable model comparison, and Akaike’s information criterion (AIC) was compared across these models to compare their fit. This revealed that a logarithmic model (AIC = 31575) was a better fit compared with a linear model (AIC = 33986) to model the relationship between the number of presentations and familiarity ratings (see Table 1 and Fig. 2).
Standardized β Coefficients, Associated p Values, and R2 Values for Each Model Fit for Familiarity and Liking Ratings
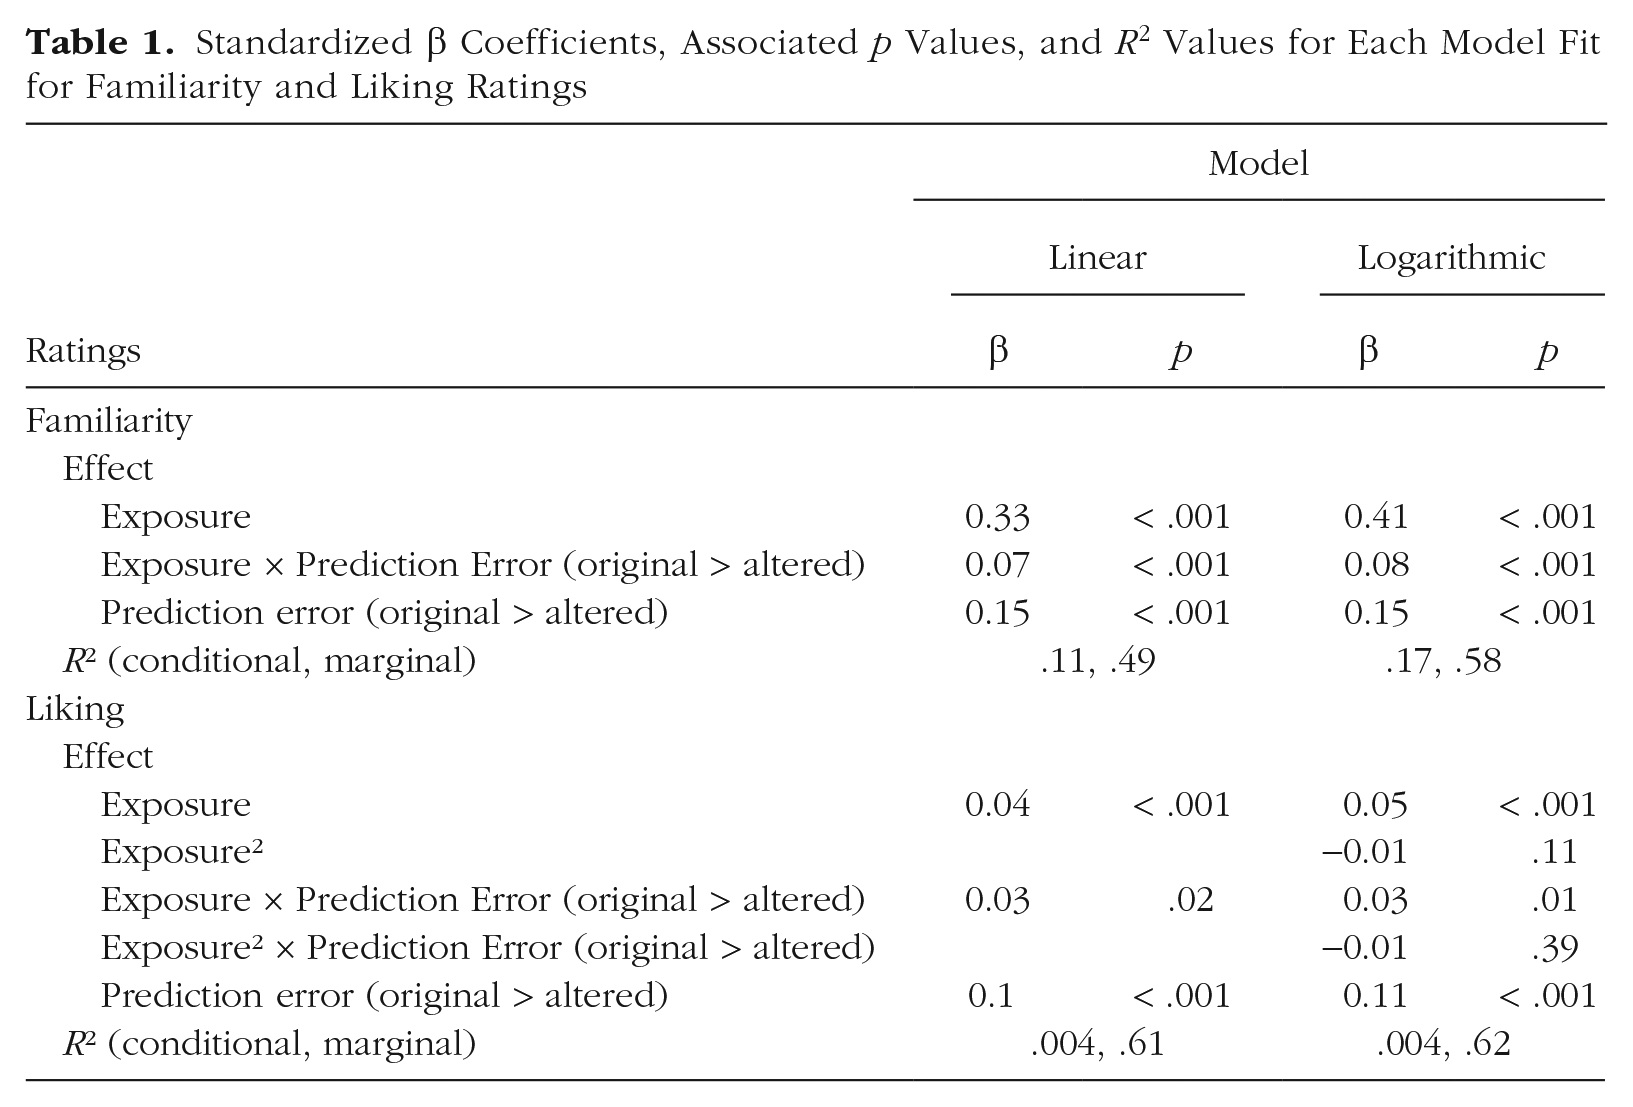
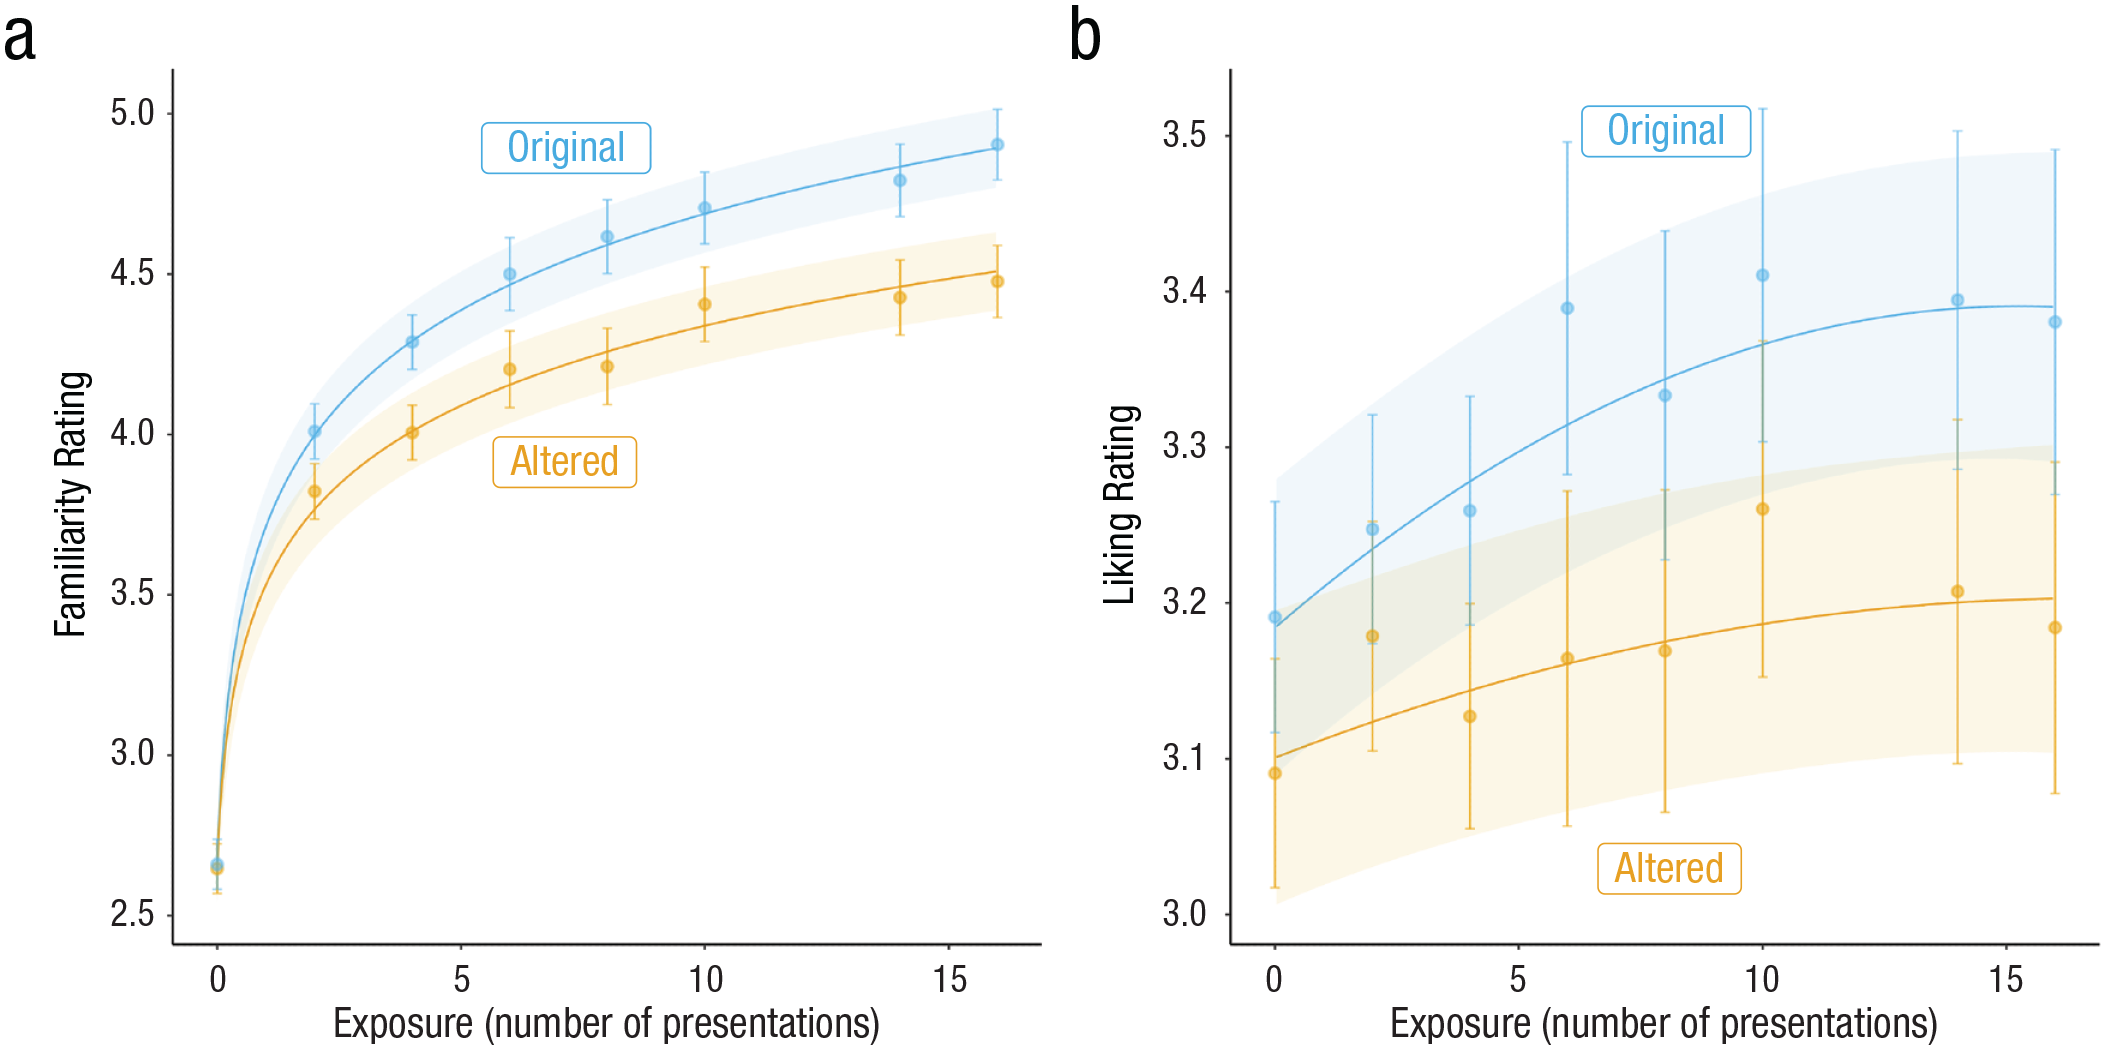
Best-fit model predictions of familiarity and liking ratings as a function of exposure and prediction error (“original” melodies did not elicit a prediction error, whereas “altered” melodies did) across Studies 1 through 4. Points and associated error bars indicate mean ratings and 95% confidence intervals.
Liking ratings show a quadratic relationship with exposure
We used the same approach to best describe the relationship between liking ratings and exposure. However, because the trajectory between exposure and liking typically shows an inverse-U relationship (for a review, see Chmiel & Schubert, 2017), we compared model fits of a linear and quadratic model using a likelihood-ratio test. Both linear and quadratic models showed significant main effects of the number of presentations and alterations, as well as significant interactions between the two. The quadratic model was found to best describe the relationship between the number of presentations and liking ratings, χ2(13) = 127.03, p < 0.001 (for model fits, see Table 1; for model predictions plotted with mean and 95% confidence intervals, see Fig. 2). Together, these results are consistent with the predictions of the predictive-coding model: The fact that the effect of prediction error increased as a function of exposure suggests that the minimization of prediction errors best accounts for the generation of musical preferences in the context of this novel musical environment.
Music-reward sensitivity influences the learning trajectory
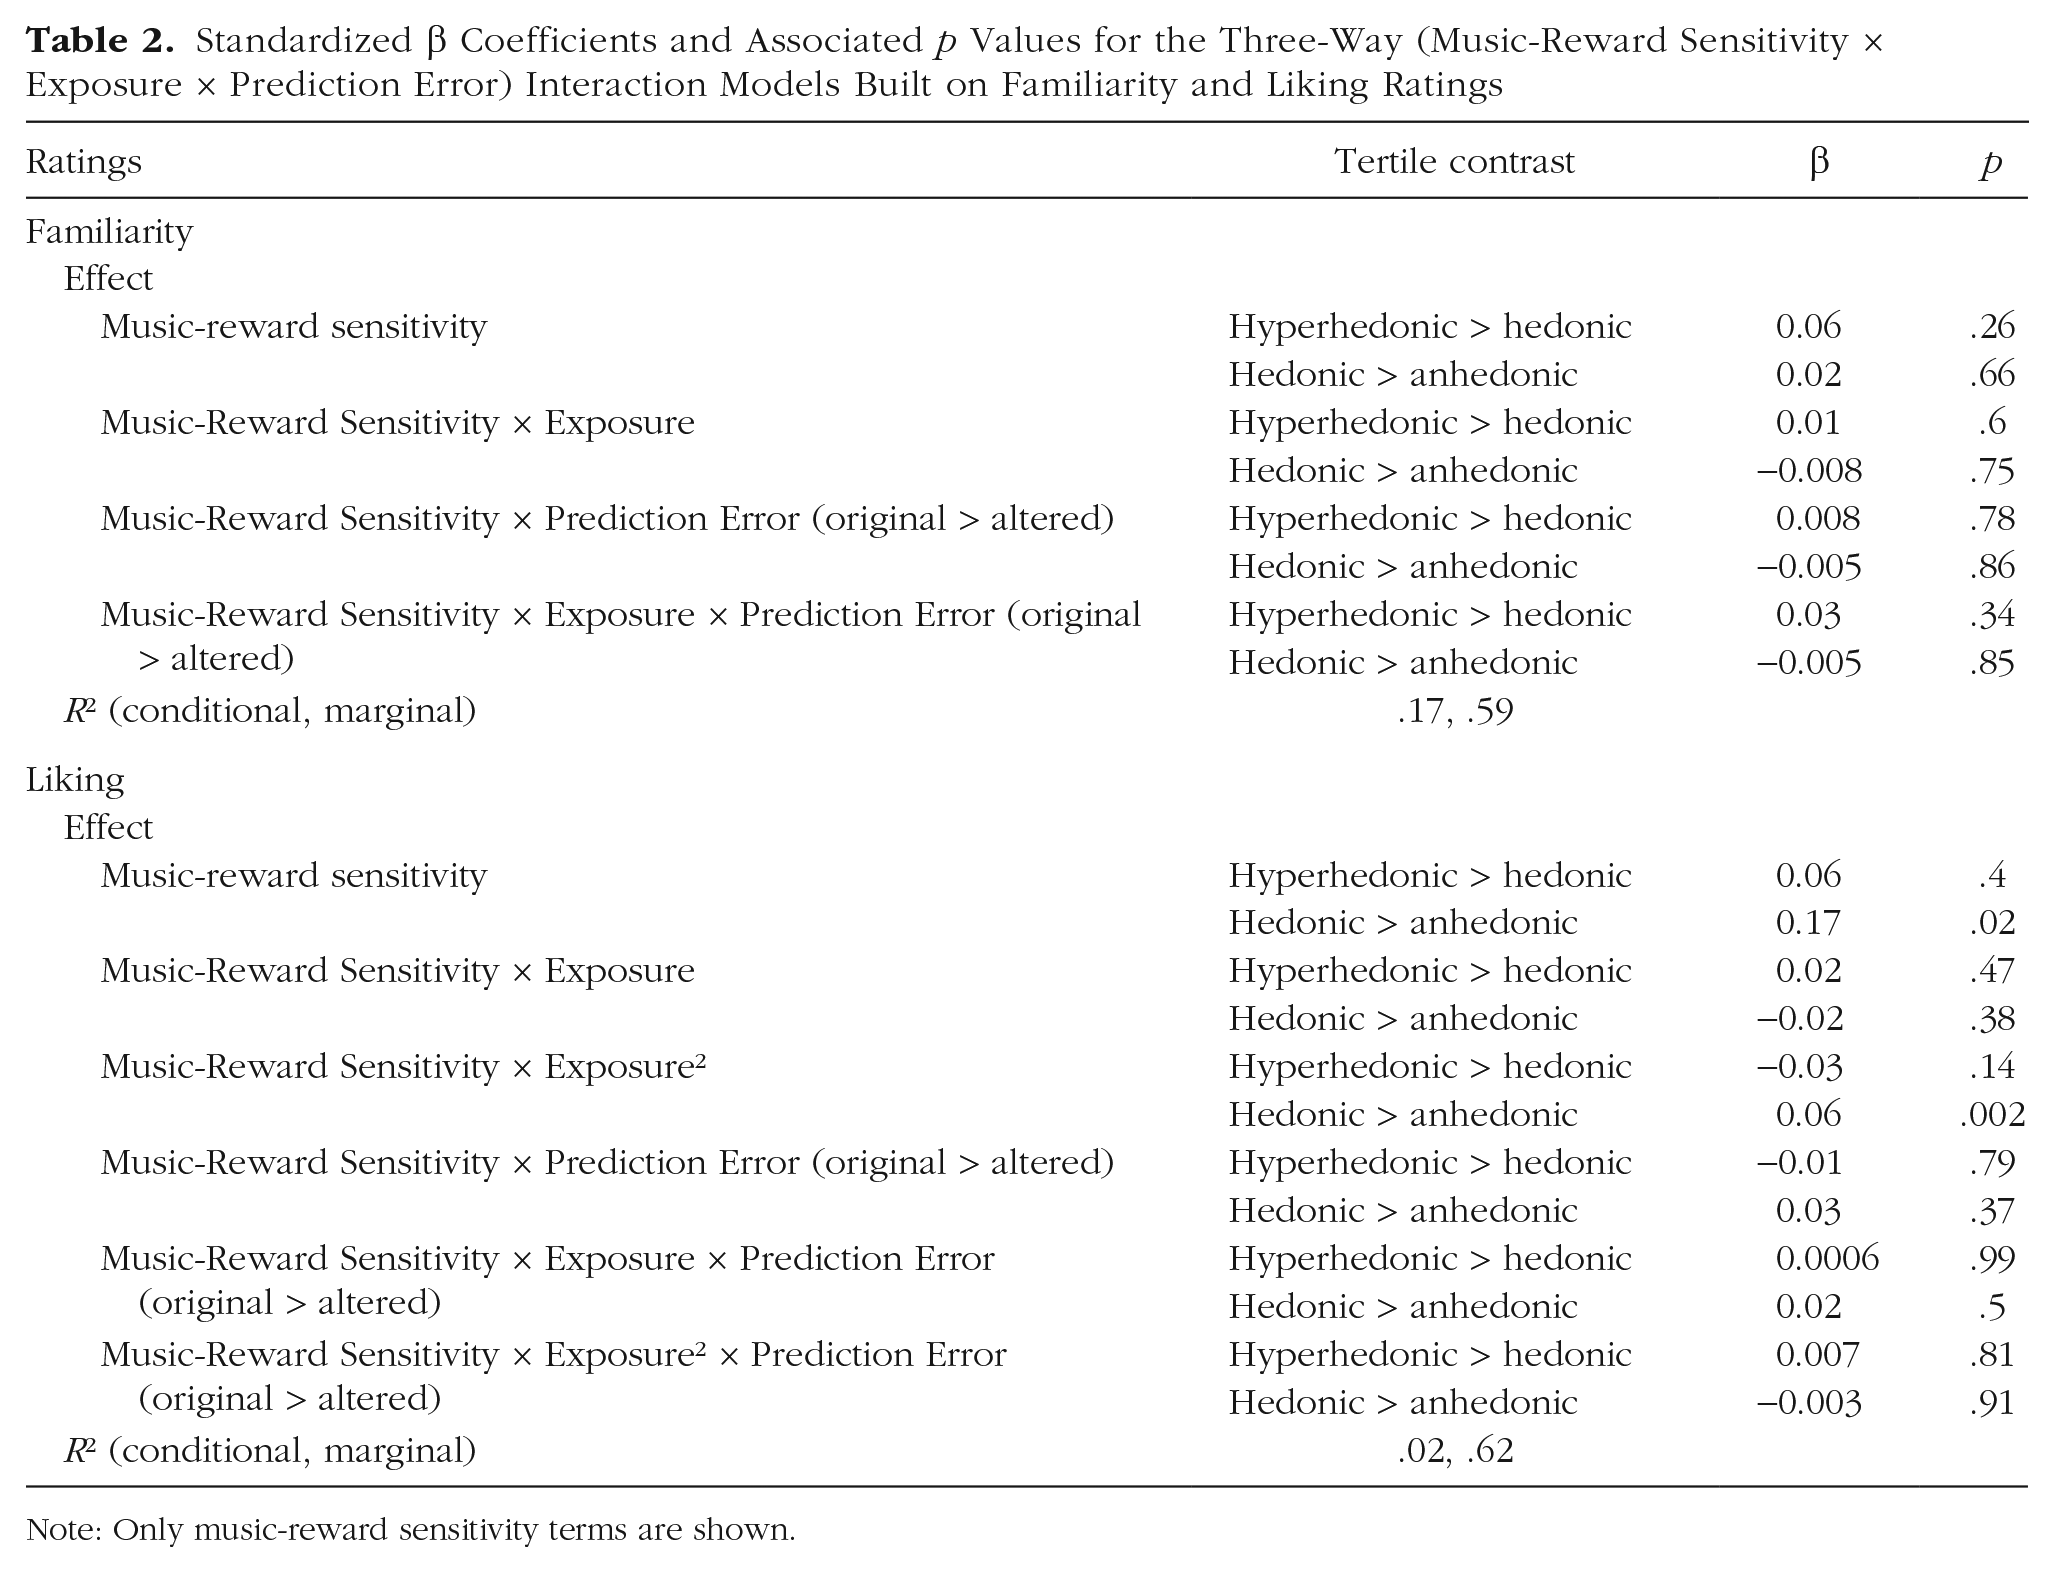
Although results from Studies 1 through 4 showed musical preferences were informed by both exposure and prediction error across an aggregated sample of 667 participants, past work has also shown considerable individual differences in music-reward sensitivity, which affects the degree to which individuals enjoy music listening (Martinez-Molina et al., 2016). Thus, we tested the hypothesis that liking ratings of individuals with low music-reward sensitivity (i.e., musical anhedonics) would show decreased sensitivity to our manipulations of both exposure and prediction error. Following past work (Martinez-Molina et al., 2016), we split our aggregated sample into tertiles using the BMRQ, a measure of music-reward sensitivity (Mas-Herrero et al., 2013). These tertiles represent relatively high (hyperhedonic; BMRQ = 86–100), medium (hedonic; BMRQ = 76–85), and low (anhedonic; BMRQ = 26–75) sensitivity to music reward in our sample. To test our hypothesis, we added an interaction term for music-reward sensitivity to our best-fitting models (logarithmic for familiarity ratings and quadratic for liking ratings). Because this measure indexes individual differences in music-reward sensitivity, we expected differences across these tertiles only on liking ratings. If musical anhedonics’ liking ratings are less sensitive to exposure effects than their more hedonic counterparts, then they will show a different trajectory between liking ratings and exposure (i.e., an interaction between music-reward sensitivity and exposure). If they are less sensitive to prediction errors, then they will show a decreased effect of prediction error (i.e., an interaction between music-reward sensitivity and prediction error). For these analyses, this variable was dummy-coded to treat the hedonic group as the reference level. We interpreted any interaction between the number of presentations and music-reward sensitivity as evidence that the relationship between familiarity and/or liking ratings and the number of presentations differed across groups.
For familiarity ratings, there were no differences in ratings across the three tertiles. Further, there were no significant two-way interactions between music-reward sensitivity and exposure or prediction error and no significant three-way interaction between music-reward sensitivity, exposure, and prediction error (for model fits, see Table 2; for model predictions plotted with mean and 95% confidence intervals, see Fig. 3). This suggests that musical anhedonics familiarize themselves similarly to music compared with their more hedonic counterparts in that their ratings were similarly sensitive to both exposure and prediction error.
Standardized β Coefficients and Associated p Values for the Three-Way (Music-Reward Sensitivity × Exposure × Prediction Error) Interaction Models Built on Familiarity and Liking Ratings
Note: Only music-reward sensitivity terms are shown.
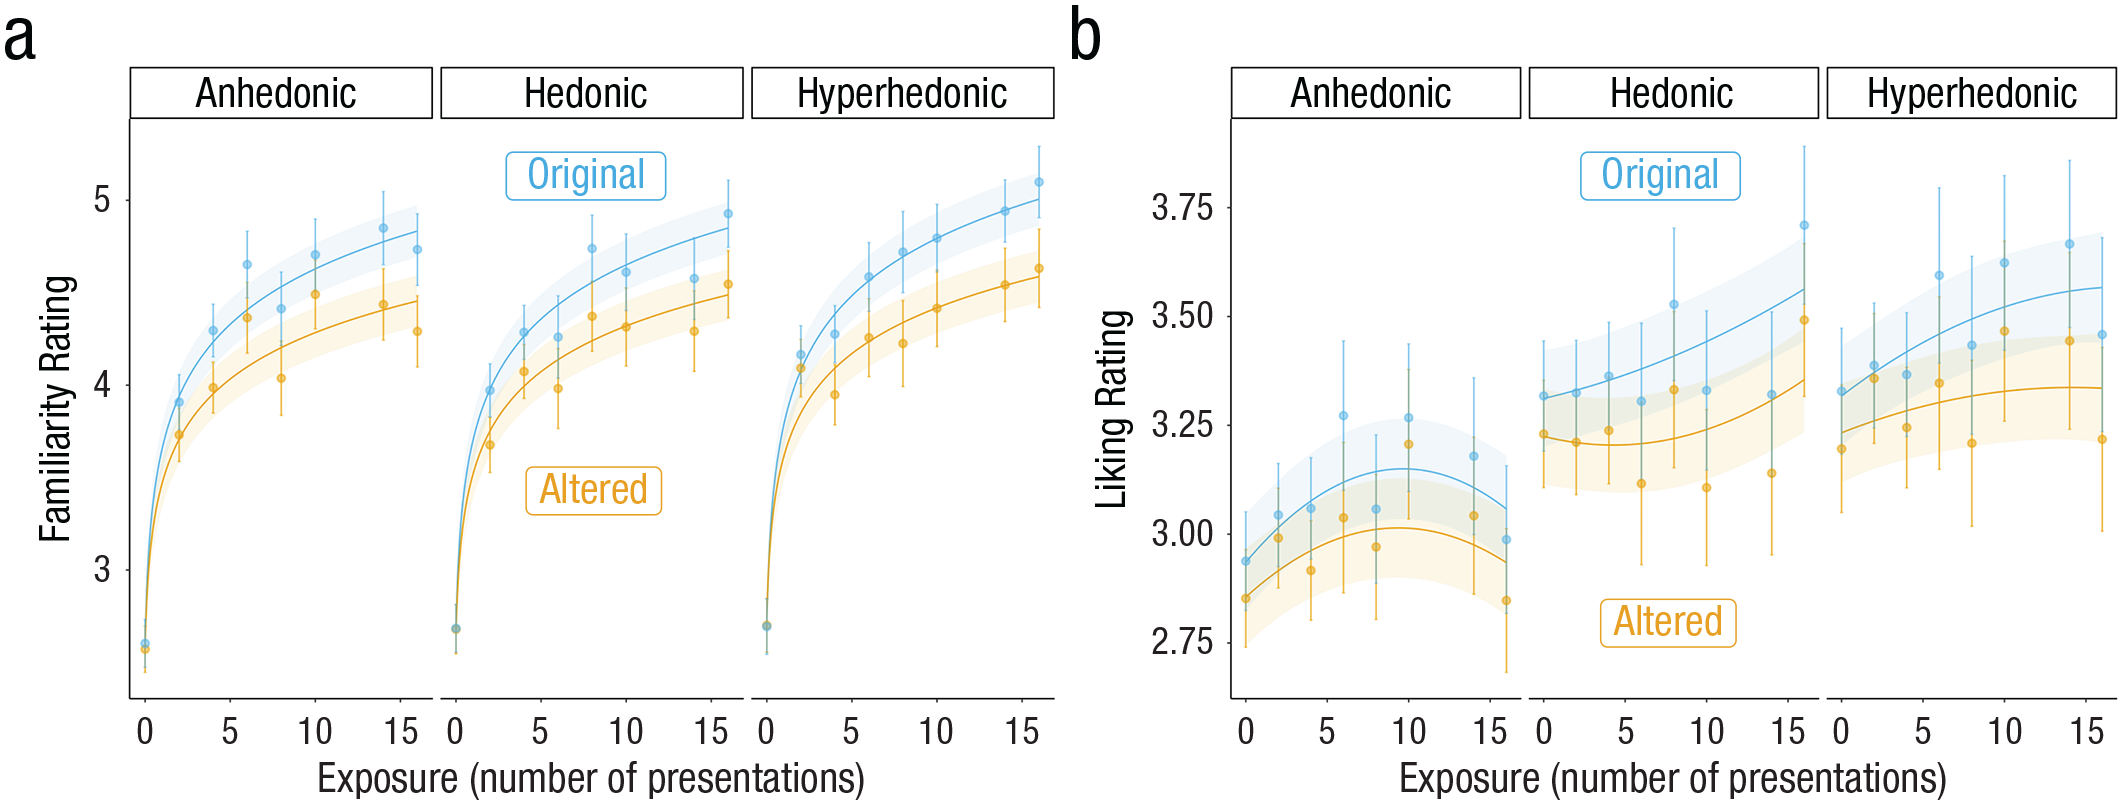
Model-predicted familiarity and liking ratings as a function of exposure, prediction error, and music reward sensitivity (tertile split on Barcelona Music Reward Questionnaire: anhedonic, hedonic, and hyperhedonic groups). Points and associated error bars represent 95% confidence intervals.
For liking ratings, there was a significant difference across groups: The hedonic group rated melodies as more liked than the anhedonic group, β = 0.17, t(663) = 2.36, p = 0.02. There were no significant linear interactions between exposure and music-reward sensitivity, and there were no interactions between prediction error and music-reward sensitivity. There was no significant three-way interaction between music-reward sensitivity, exposure, and prediction error. We did, however, detect an interaction between the quadratic exposure term and music-reward sensitivity, β = 0.06, t(649) = 3.05, p = 0.002. Whereas the anhedonic group showed a significant inverse-U relationship between exposure and liking ratings, β = −0.04, t(650) = −3.12 p = 0.002, the hedonic and hyperhedonic groups did not—hedonic: β = 0.02, t(649) = 0.24; hyperhedonic: β = −0.01, t(675) = 0.95, p = 0.34 (for all results, see Table 2 and Fig. 3). These results suggest that, although all groups responded similarly to prediction errors, continued exposure to these melodies led to increased liking in all but the anhedonic group.
Study 5
Although results from the tertile split above show that large online samples can capture a range of music-reward sensitivity that predicts differences in learning to like new music, extreme cases of insensitivity to reward can be effective tests of the models derived from the studies above. In Study 5 we tested the models relating exposure and prediction error to familiarity and liking for the anhedonic, hedonic, and hyperhedonic subgroups on two case studies of music-specific anhedonia, a condition in which listeners derive no pleasure from listening to music (Mas-Herrero et al., 2014). BW and NA are individuals who presented with congenital and acquired music-specific anhedonia, respectively. Both participants underwent a streamlined version of our study paradigm, with melodies presented zero, four, 10, and 14 times, and only one melody per condition. We calculated the mean squared error (MSE) for liking and familiarity ratings of both the original and altered versions of these melodies using model predictions from the three-way (Exposure × Prediction Error × Music-Reward Sensitivity) interaction models at all three levels of music-reward sensitivity. Because results of the mini meta-analysis indicated that there was no difference in the relationship between exposure and familiarity ratings across the music-reward tertiles (i.e., no interaction between exposure and reward sensitivity), we did not expect the model’s anhedonic predictions to have the lowest MSE for the familiarity ratings of our case studies. In contrast, because we did detect differences in the exposure-liking trajectory for musical anhedonics in our mini meta-analysis, we did expect the model’s predictions for anhedonics’ liking ratings to have the lowest MSE for our case studies.
For familiarity ratings, the model prediction at the hyperhedonic level best matched music-specific anhedonics’ responses (i.e., the model showed the lowest MSE of 18.13 at the hyperhedonic level), followed by the hedonic (19.95) and anhedonic (20.18) levels. This relatively better fit of the hyperhedonic predictions stems from the fact that all but one familiarity rating of the melodies that these participants made were extreme values of 1 or 6, thus likely representing a binary between knowing or not knowing these stimuli. This resulted in the lowest MSE for the hyperhedonic predictions because the latter had the steepest (although not statistically significantly different) slope relating familiarity to exposure compared with the other tertiles. This suggests that both musical anhedonic cases were indistinguishable from hyperhedonics in their familiarity ratings, consistent with the finding that there were no significant interactions with music-reward sensitivity from the meta-analysis of Studies 1 through 4 above. In contrast, for liking ratings, the model had the lowest MSE (3.66) from the anhedonic level when predicting the music-specific anhedonics’ data compared with both the hedonic (4.97) and hyperhedonic (5.01) levels. This shows that the liking ratings of these cases were indeed more similar to the anhedonic group and different from that of the hedonic and hyperhedonics, consistent with the mini meta-analysis of Studies 1 through 4 above. Taking the familiarity and liking ratings together, these case studies provide further support for the idea that both cases of congenital and acquired musical anhedonia had less difficulty with learning these melodies than with deriving reward from them.
Study 6
Although the studies above generally support the predictive-coding model, both schematic and veridical expectations were manipulated simultaneously. Specifically, structural alterations introduced in the altered melodies violated schematic expectations because they contained statistically infrequent pitch patterns and veridical expectations because they violated participants’ specific predictions about that melody. The zero-exposure condition circumvents this issue somewhat because the two melodies in that condition differ only in schematic expectations and not in veridical expectations, but Studies 1 through 5 were not designed and powered to statistically test for differences in the zero condition only. Thus, to further probe whether the effect of the prediction error in these studies can be attributed more to schematic or veridical expectation violation, we ran an additional follow-up study in which the melodies previously presented only in the postexposure rating phase were now presented in the exposure phase (at zero, two, four, eight, and 16 times), whereas those originally in the exposure phase were now presented only in the postexposure rating phase. Because the endings of the melodies in the exposure phase of this study are nongrammatical (meaning that there were less schematic expectations to be acquired for these endings), the prediction-error manipulation is relatively limited to violations of veridical expectations (Fig. 4). As a result, if subjective ratings are more sensitive to schematic expectations, then there should be less of an effect of prediction error in this study compared with the previous studies because there are less schematic expectations to be learned in this study than in the previous ones. Conversely, if these ratings are more sensitive to veridical expectations, then there should be an effect of prediction error, such that those that do not elicit a prediction error (i.e., presented in the exposure phase) are more familiar/preferred compared with those that do.
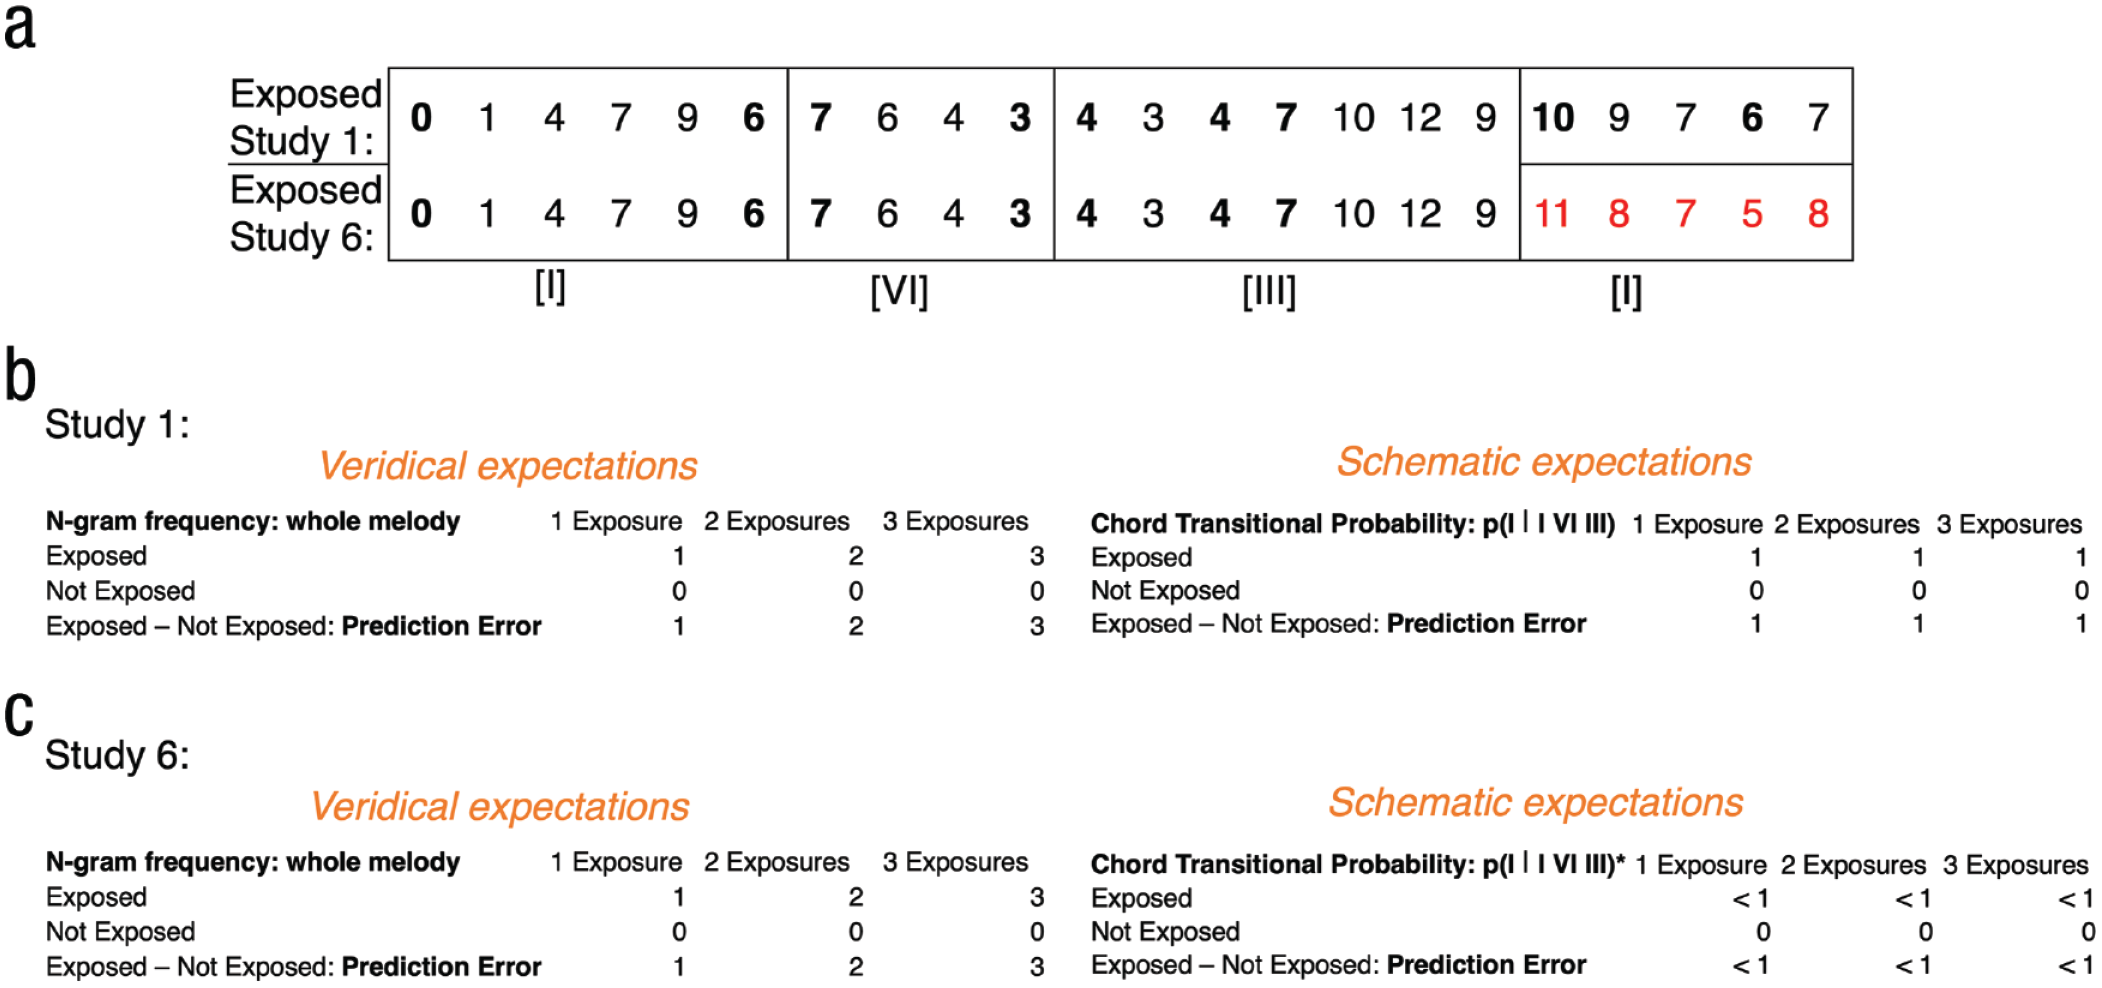
Differentiating veridical and schematic expectations between Studies 1 and 6. The same example melody from Figure 1 but with the altered melody (which did not conform to the chord-based grammatical structure; a) is now presented in Study 6. Veridical expectations, as defined here by n-gram frequency for the whole melody, increase with exposure, whereas schematic expectations, as defined here by transitional probability between chords, remain stable with exposure to the original set of melodies (b). In contrast, with exposure to altered melodies (c), which do not resolve on the same chord, the transitional probability between the two last chords is lower in Study 6 than it is in Study 1. This results in a proportionally lower exposure to schematic expectations relative to the same amount of exposure to veridical expectations in Study 6, relative to Study 1.
For familiarity ratings, we replicated the significant effect of exposure, β = 0.31, t(161) = 15.19, p < 0.001, but found no main effect of prediction error, β = 0.01, t(2129) = 0.48, p = 0.63, and no interaction between exposure and prediction error, β = −0.04, t(2786) = −1.77, p = 0.08 (Fig. 5a). For liking ratings, we found a significant effect of exposure, β = 0.03, t(159) = 2.36, p = 0.02, and prediction error, β = 0.05, t(2595) = 2.27, p = 0.02, such that melodies that did not elicit prediction errors were preferred over those that did (Fig. 5b). We did not detect an interaction between exposure and prediction error, β = −0.007, t(2519) = −0.31, p = 0.75. These results provide preliminary evidence that, whereas familiarity ratings were more sensitive to schematic expectations, liking ratings were more influenced by veridical expectations.
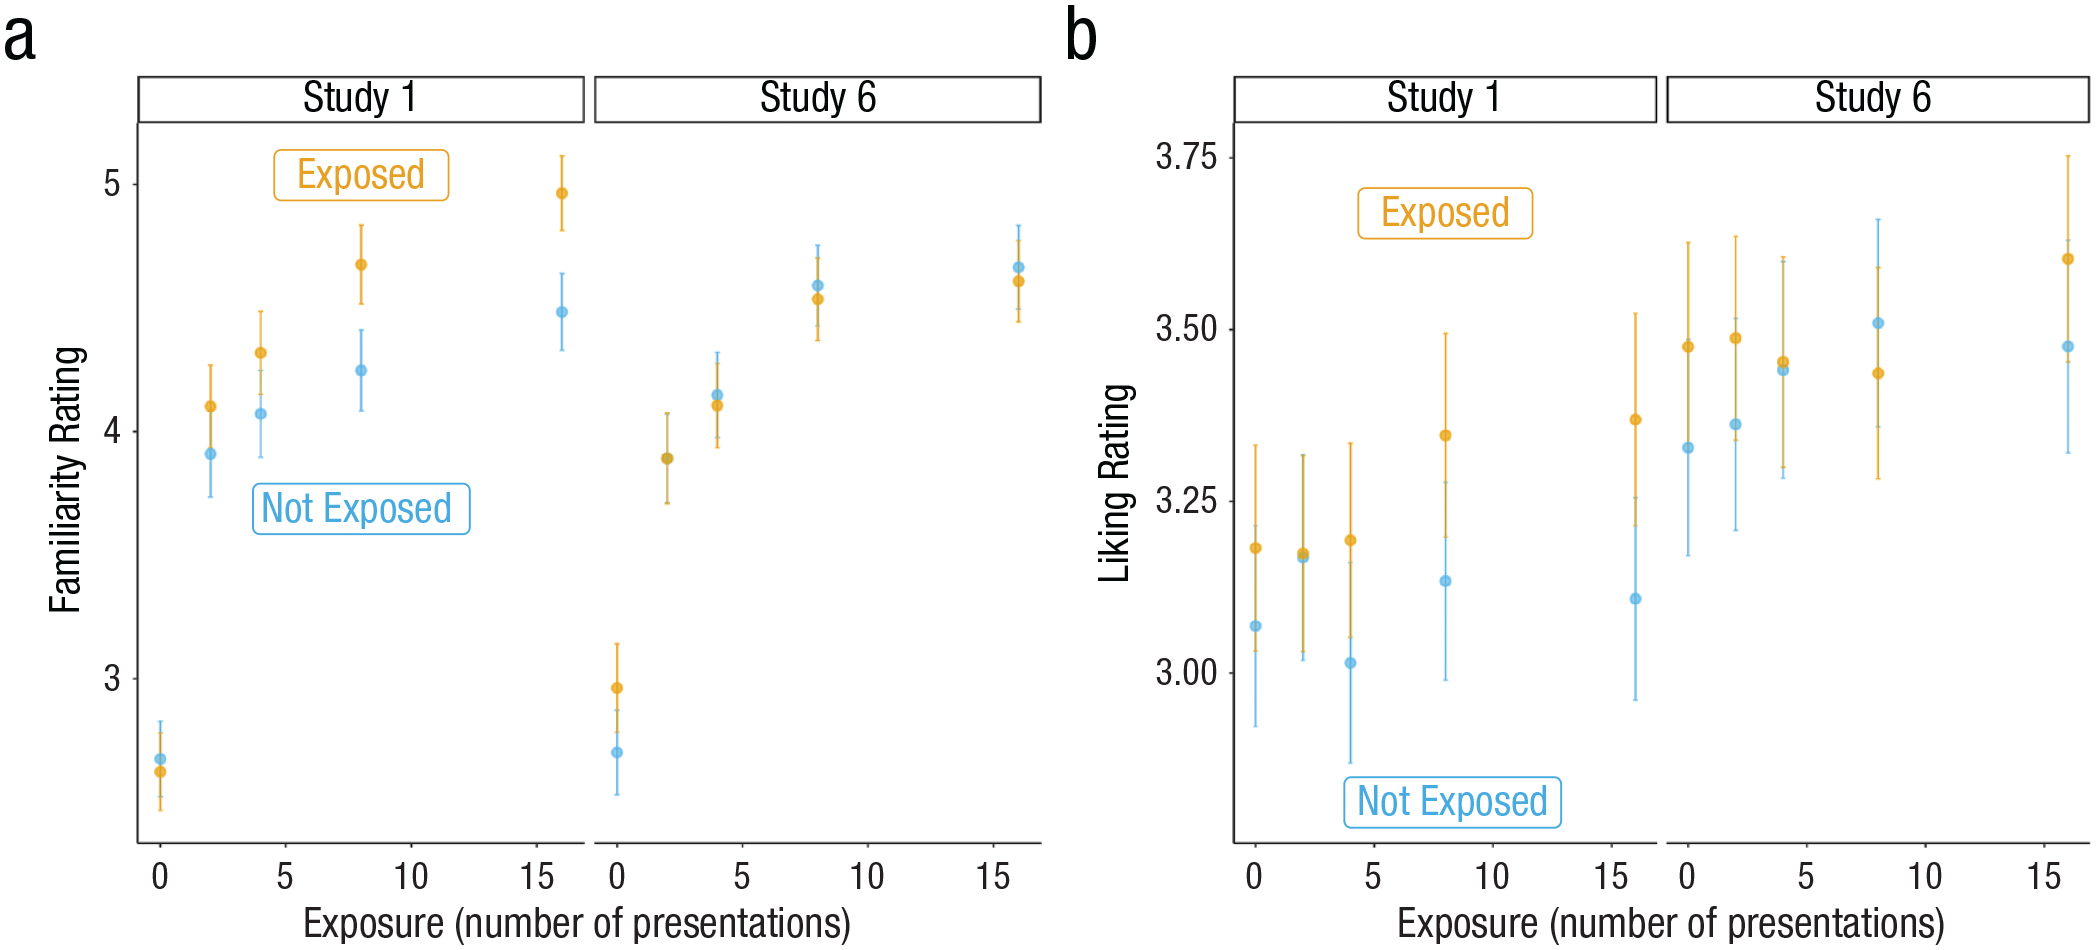
Means and 95% confidence intervals of familiarity and liking ratings across Study 1 (exposed to fully grammatical melodies) and Study 6 (exposed to melodies with ungrammatical endings). “Exposed” melodies did not elicit prediction errors, whereas “Not Exposed” melodies did.
Mini meta-analyses of Studies 1 and 6
To further characterize the relationship between schematic and veridical expectations on familiarity and liking ratings, we aggregated data across Studies 1 (exposed to fully grammatical melodies) and 6 (exposed to melodies with ungrammatical endings). We then modeled both familiarity and liking ratings as a function of a three-way interaction between study (Study 1 vs. Study 6), prediction error, and exposure. This enabled a direct comparison across studies in which there was a relative difference in the degree to which prediction errors violated schematic expectations (with there being more of a schematic expectation violation in the manipulation in Study 1). Thus, if ratings were more sensitive to schematic expectations, then there should be a significant interaction between study and prediction error, such that the effect of the prediction error is stronger for Study 1 compared with Study 6. Conversely, if ratings were more sensitive to veridical expectations, then the effect of alteration should be no different between these two studies.
Schematic expectations inform familiarity
For familiarity ratings, there was a significant three-way interaction (Study × Prediction Error × Exposure) such that the interaction between the prediction error and number of presentations differed across the two studies, β = −0.14, t(5915) = −4.07, p < 0.001. Whereas the effect of the prediction error increased as a function of exposure in Study 1, β = 0.1, t(5914) = 3.99, p < 0.001, the effect of the prediction error remained the same across exposure in Study 6, β = −0.04, t(5915) = −1.79, p = 0.07. Importantly, there was also a significant two-way interaction (Study × Prediction Error) such that the effect of the prediction error was weaker in Study 6 than in Study 1, β = −0.15, t(5913) = −4.13, p < 0.001 (for means and 95% confidence intervals, see Fig. 5a). There was neither a main effect of study, β = 0.003, t(330) = 0.04, p = 0.97, nor an interaction between study and exposure, β = −0.02, t(327) = −0.96, p = 0.34. These results provide further evidence that familiarity is more sensitive to schematic expectations and suggest that the relative increase in schematic expectations evoked by the melodies that did not elicit a prediction error in Study 1 was critical in increasing the effect of prediction error as a function of exposure.
Veridical expectations inform liking
For liking ratings, there was neither a significant three-way interaction between exposure, prediction error, and study, β = −0.06, t(4192) = −1.82, p = 0.07; a two-way interaction between exposure and study, β = 0.002, t(329) = 0.1, p = 0.92; nor a two-way interaction between prediction error and study, β = −0.06, t(5163) = −1.81, p = 0.07. There was a main effect of study on liking ratings, such that melodies were rated, overall, as more liked in Study 6 compared with Study 1, β = 0.2, t(330) = 2.48, p = 0.01 (for means and 95% confidence intervals, see Fig. 5b). Because we did not detect a difference in the effect of prediction error across studies, these results suggest that, unlike familiarity ratings, liking ratings seem to be more informed by veridical expectations.
Study 7
In the first six studies, participants were always asked to provide familiarity ratings before liking ratings. For this reason, one possible interpretation is that participants consistently rated the most familiar melodies from Studies 1 through 6 as most liked because of anchoring and/or demand effects. To rule out these possibilities, we ran an additional study in which participants completed the identical procedure as Studies 1 and 3 but did not rate any melodies on familiarity. There was still an effect of both exposure, β = 0.04, t(181) = 2.47, p = 0.01, and prediction error, β = 0.1, t(2227) = 4.87, p < 0.001, on liking ratings but no interaction between the two, β = 0.001, t(2461) = 0.06, p = 0.95.
To formally compare whether removing familiarity ratings impacted the effect of our manipulations on liking ratings, we collapsed data from Studies 1 and 7 and modeled liking ratings as a three-way interaction between study (Study 1 vs. Study 7), prediction error, and exposure. This model did not detect any two-way interactions between study and exposure, β = 0.008, t(349) = 0.36, p = 0.72, or study and prediction error, β = −0.006, t(4310) = −0.21, p = 0.84, or a three-way interaction, β = −0.05, t(3785) = −1.6, p = 0.11. Together, these results suggest the results of Studies 1 through 6 are not due to anchoring or demand effects.
Study 8
Studies 1 through 7 together establish that the effects of exposure and prediction error on liking and familiarity are not explained by task demands and are blunted in groups with reduced reward sensitivity. Although the B-P scale is not used widely in any known culture, it is still possible that differences in the styles of music that we are exposed to from birth via our culture would impact how we learn and respond to these B-P melodies. To assess this possibility, we tested whether the trajectories identified in Studies 1 through 7 are indeed similar across cultures. Study 8 extends the findings to investigate possible cultural effects on the process of becoming familiar with and preferring new pieces of music. To this end, we recruited 156 participants from China to complete the identical procedure as Study 4. For familiarity ratings, there was a significant interaction between exposure and prediction error, β = 0.08, t(1758) = 3.13, p = 0.002: The effect of prediction error—main effect: β = 0.11, t(2437) = 4.49, p < 0.001—increased as a function of exposure—main effect: β = 0.3, t(154) = 14.9, p < 0.001. For liking ratings, we replicated both the significant main effect of exposure, β = 0.06, t(155) = 4, p = 0.001, and prediction error, β = 0.12, t(189) = 5.29, p < 0.001. There was no interaction between prediction error and exposure, β = 0.007, t(971) = 0.32, p = 0.75.
To further test whether familiarity- and liking-rating trajectories matched that of the U.S. sample, we again fit two classes of models (logarithmic and linear for familiarity ratings and linear and quadratic for liking ratings) to these data. This revealed that, again, a logarithmic model best fit familiarity ratings (linear model AIC = 8958.3; logarithmic model AIC = 8376.9). A likelihood-ratio test also indicated that a quadratic model fit the liking-rating data better than a linear model, χ2(13) = 127.03, p < 0.00 (for model predictions plotted with means and 95% confidence intervals, see Fig. 6), similar to the aggregated U.S. sample.
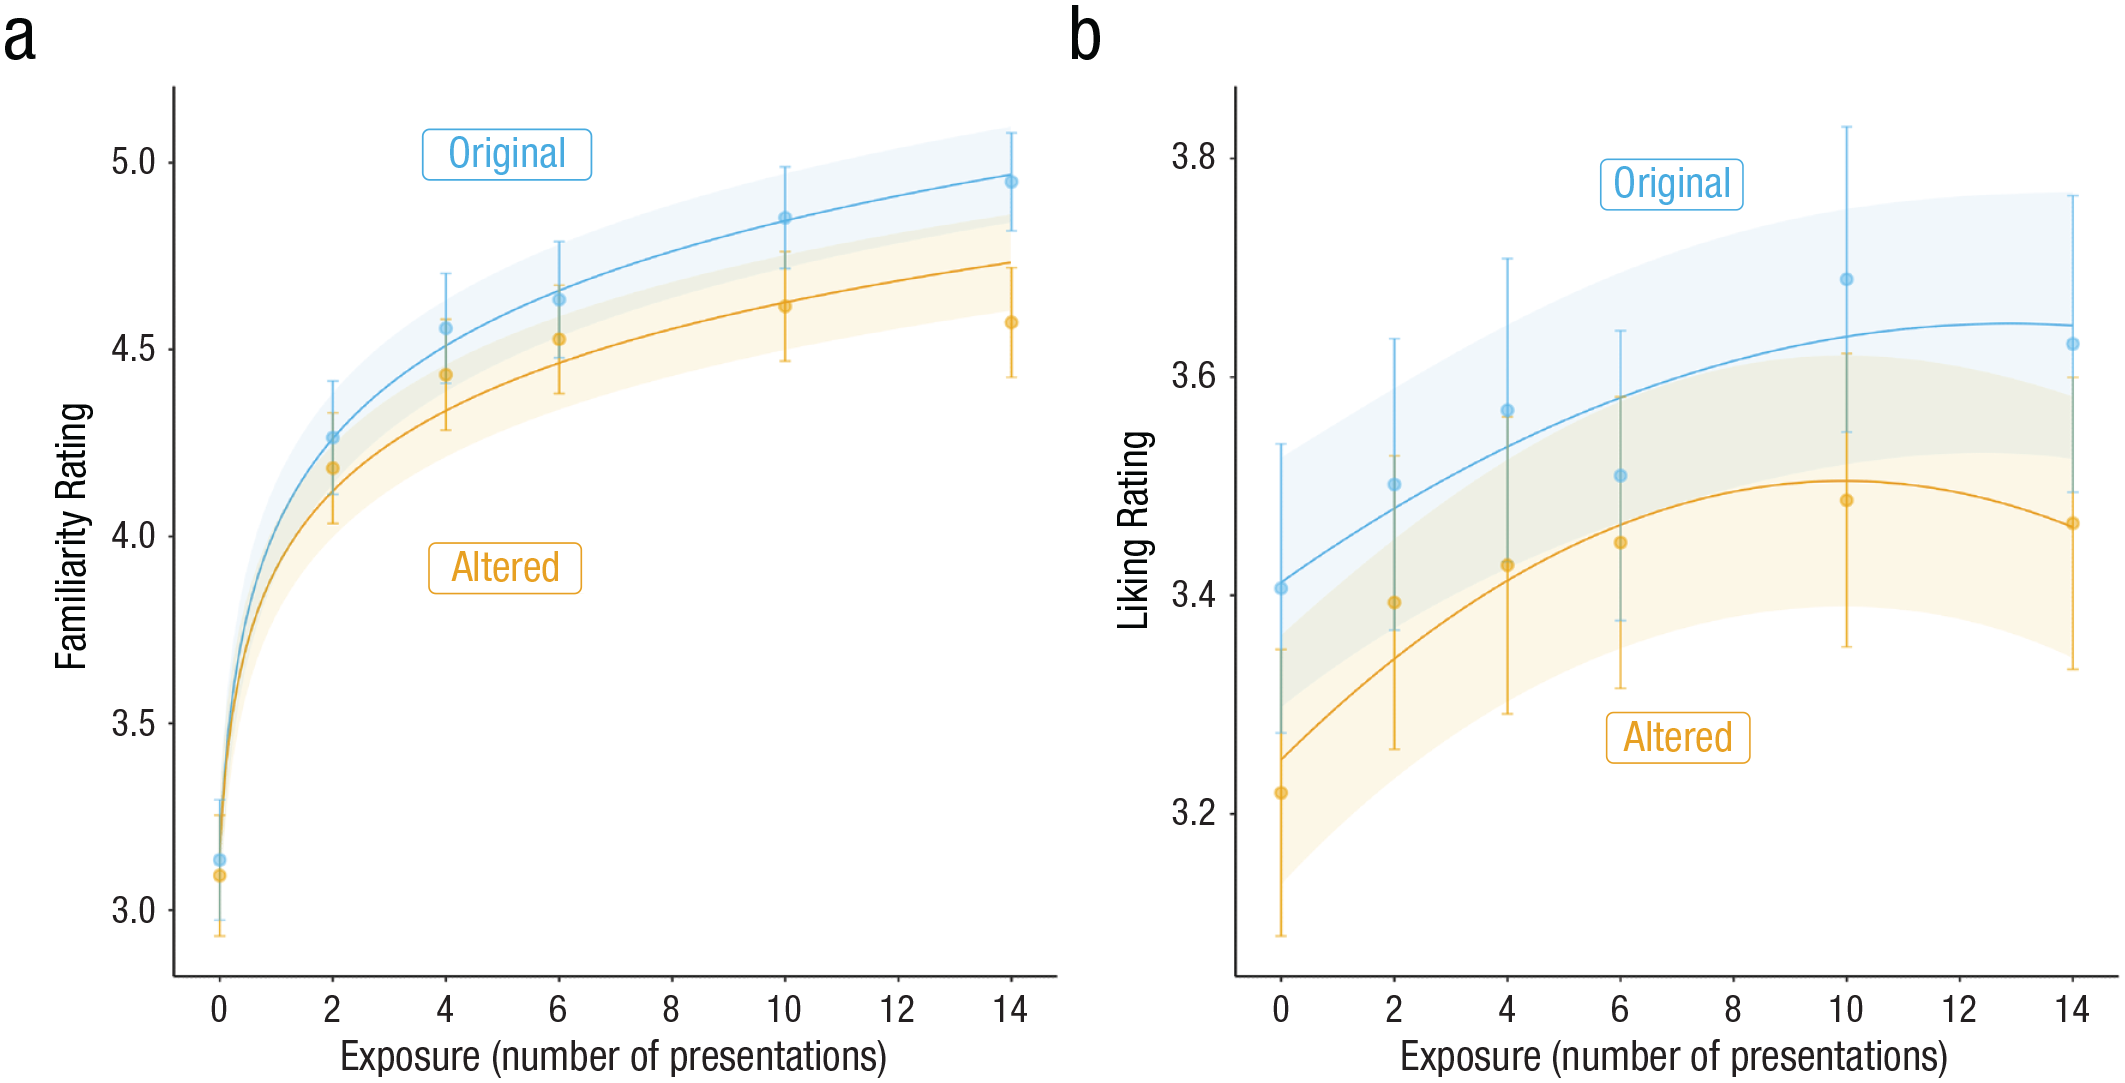
Cross-cultural replication of the effects of alterations and number of presentations on familiarity and liking ratings. The best-fitting model predictions with mean ratings and 95% confidence intervals are shown.
Study 9
Although the behavioral studies above provide support for the cross-cultural applicability of the predictive-coding model, a key component of this model posits the involvement of the reward network in the brain. In Study 9, we related exposure and prediction error to fMRI activity in the reward system. Twenty-one young adults participated in the same study design as in Study 7 outside of the scanner and then listened to the eight melodies from Study 8 during fMRI as part of a larger scale study in the lab looking at effects of music-based interventions in young adults and older adults (Quinci et al., 2022). Whole-brain, univariate analyses showed greater activation for melodies that did not elicit prediction errors compared with those that did in the right HG (Fig. 7a), suggesting that the auditory cortex is sensitive to prediction errors.

fMRI results. Greater activation for original (no prediction error elicited) than for altered (prediction error elicited) melodies in HG are shown in (a), confirming that auditory regions implement predictions. Higher functional connectivity, as quantified by correlations in β series between auditory regions (HG) and reward regions (mPFC) for original melodies than for altered melodies (b), increases with exposure (as quantified by number of presentations) for original but not for altered melodies. fMRI = functional MRI; HG = Heschl’s gyrus; mPFC = medial prefrontal cortex.
Given previous evidence showing that coactivation of the reward and auditory brain areas is associated with musical preferences and learning (Quinci et al., 2022), we also assessed the degree to which functional connectivity between these regions is modulated by predictive coding. The functional connectivity between auditory and reward areas was quantified by correlating the time series of β values extracted from HG (a sphere around the central voxel from the whole-brain analysis from Fig. 7a) and reward-sensitive ROIs in the nucleus accumbens and mPFC (see the Materials and Methods section). A two-way within-subjects analysis of variance with the dependent variable of auditory-reward functional connectivity, with the factors of prediction error and exposure, showed a significant main effect of prediction error, F(1,20) = 5.24, p = .033, η p ² = .21, and a significant main effect of exposure, F(3,60) = 3.31, p = .026, η p ² = .14. Figure 7b shows a linear relationship for original melodies as well as the effect of alteration. The same pattern was not observed for functional connectivity between HG and the nucleus accumbens—prediction error: F(1,20) = 1.61, p = .22, η p ² = .074; exposure: F(3,60) = .30, p = .83, η p ² = .015.
Discussion
Across nine studies, we provide novel evidence to support a predictive-coding account for musical preference that encompasses the effects of mere exposure on statistically learned expectations. We show that listeners from two different cultures can rapidly learn from exposure and prediction errors in novel music. This learning maps onto the brain’s reward system and is sensitive to individual differences in reward sensitivity to music.
In Studies 1 through 4, we established that changing the number of presentations (exposure) as well as altering the endings of melodies (prediction errors) affected self-reported liking ratings for music, which ultimately provided evidence in support of the predictive-coding model. Meta-analyses across Studies 1 through 4 and neuropsychological results from Study 5 confirmed that individuals with musical anhedonia acquired familiarity in the same way as controls but did not derive preferences from familiar sequences in the same way as their musically hedonic counterparts. Study 6 showed that familiarity ratings were more sensitive to schematic compared with veridical-expectation violations, whereas liking ratings were more sensitive to veridical expectations. Study 7 tested for liking without testing for familiarity and established the same pattern of results, confirming that the effects of exposure and prediction error on liking were not due to anchoring effects. Study 8 established that both Chinese and American participants were affected by exposure and prediction errors in this musical system that was unfamiliar to both cultures. Finally, Study 9 tied this relationship between exposure, prediction error, and reward to increasing functional connectivity between the auditory and reward systems. Rather than simply showing that familiarity leads to liking, results reconciled the exposure- and prediction-based accounts for music preference and extended the predictive-coding model in three key directions: toward unfamiliar statistically and probabilistically novel music, toward a more culturally independent context via a cross-cultural comparison, and toward its specific disruption in cases of musical anhedonia.
The degree to which veridical versus schematic expectations influence musical reward has historically been difficult to assess because we are usually overexposed to particular musical genres that follow the same statistical patterns. The usage of the B-P scale allows us to evade the preexisting expectations that have accumulated from music exposure throughout our lives and offers an experimental tool to tease apart the influences of veridical and schematic expectations on musical reward. Here we have operationally defined veridical expectations as predictions for n-grams and schematic expectations as predictions for transitional probabilities between chords. This, combined with the inclusion of a zero-exposure condition as well as Study 6 in which altered melodies were presented during exposure, allowed us to begin to tease apart the effects of veridical versus schematic expectations on musical reward.
Listeners in Study 6 preferred the less schematically expected but similarly exposed altered melodies over their complements (which had been presented in the exposure phases of Studies 1 through 5), resulting in effects of exposure and prediction error on liking. This result rules out the alternative explanation that the effect of prediction error in the earlier studies could have been due to specific features of these melodies leading them to be more preferred. Furthermore, participants’ ratings of liking—but not familiarity—continued to be responsive to the elicited prediction error in Study 6, suggesting a relative greater importance of veridical over schematic expectations for musical preferences because there were less schematic expectations to use for learning the melodies in Study 6 compared with Study 1. Thus, it is possible that the relatively greater veridical expectation learning in Study 6 (compared with Study 1) additionally explains why there were higher liking ratings for melodies in Study 6 compared with Study 1, as revealed in our second mini meta-analysis. This mini meta-analysis also revealed a significant three-way interaction (Study × Prediction Error × Exposure) on familiarity ratings, such that the effect of prediction error increased as a function of exposure in Study 1 but not Study 6. We argue that this effect is due to the fact that the melodies presented during exposure in Study 6 evoked a relative decrease in schematic expectations while keeping veridical expectations the same relative to Study 1. Rather than claiming that familiarity always leads to liking, or that we only like what is familiar, the fact that schematic and veridical expectations differentially contributed to familiarity and liking ratings suggests that multiple, independent levels of prediction come into play in forming musical reward. The result is in line with prior work (Loui et al., 2010) showing that repeated listening to a small number of B-P melodies (which increased veridical expectations without increasing schematic expectations) resulted in higher preference ratings for those melodies, but nonrepeated listening to a larger number of B-P melodies, although resulting in grammar learning (which is more akin to the learning of schematic expectations in the current study), did not lead to preference change.
Chinese and American participants both showed effects of both types of manipulations on liking and familiarity ratings. The best-fitting model was similar across the two cultures, with a logarithmic model best fitting familiarity ratings and a quadratic model best fitting liking ratings. This adds to the discussion on the role of cultural background on the predictive-coding model by suggesting that the statistical-learning processes that drive familiarity and liking are relatively free of the influence of culture when the musical materials are similarly unfamiliar to both cultures to begin with. In contrast, the role of culture is more observable for other tasks beyond liking and familiarity ratings, such as in tasks involving imagination and the generation of narratives (Loui et al., 2023). Future studies may further disentangle the influence of schematic and veridical expectations in learning across different cultures. That being said, in practice the two expectations generally co-occur. Thus, complete experimental dissociation of one from the other is likely not possible when using more dynamic, naturalistic musical stimuli.
Although the effects of cultural background on predictive coding are subtle, individual differences on reward sensitivity appeared to play a crucial role in linking predictive coding with musical reward. The consistency of the familiarity-rating results (as well as the effect of prediction error on liking ratings) across tertiles underscores that musical anhedonics still learned the melodies and were forming preferences to some degree. However, the fact that there was a difference in the effect of exposure on liking ratings across tertiles suggests that aesthetic preferences vary by the degree of exposure required to reach maximal preference. Specifically, the finding that the anhedonic group showed the strongest quadratic relationship with exposure in liking ratings suggests that anhedonics require less exposure before they become overexposed for their own liking, which may explain their general lower preference for music overall.
Importantly, our study is the first to show that exposure to music de novo is associated with changes in the reward circuitry of the brain. Electrocortical (EEG and ECoG) recordings have shown that the middle HG is sensitive to melodic expectations (Di Liberto et al., 2020), and fMRI studies have found that auditory and reward-related areas of the brain (including the amygdala, hippocampus, and ventral striatum) show increased activation during musical-prediction errors (Gold, Pearce, et al., 2019) as well as during unexpected and/or unpredictable chord sequences (Cheung et al., 2019). However, because previous studies used familiar musical stimuli rooted in the Western musical tradition, it was not possible to determine when in the process of exposure the auditory and reward systems become engaged. Here, we observed that sensitivity to prediction errors emerged specifically in the middle HG, thus extending previous EEG/ECoG results. Furthermore, increased functional connectivity between HG and the mPFC was observed when participants listened to pieces that were more exposed, suggesting that the influence of repeated exposure on liking is subserved by changes in communication between the auditory and reward networks.
Several outstanding questions stem from these studies that warrant future exploration. First, it remains to be seen whether preference ratings would continue to increase with more than 16 exposures. It is quite possible that the positive relationships found here between exposure and liking reflects the positive side of a quadratic function and that if we were to extend the number of repetitions in this paradigm we would see preference ratings begin to decrease at an inflection point. Given that we chose to optimize for longer, more dynamic pieces of music, it was not feasible to increase the number of exposures beyond 16 without altering other key aspects of the design, introducing fatigue or habituation, or otherwise increasing cognitive demand in ways that would confound the study. Future studies with shorter stimuli may be able to assess the full extent of the relationship between liking and repetition in B-P stimuli and the degree to which relative frequencies (14 relative to 10 vs. 14 relative to two) play a part.
Second, although the current fMRI study shows sensitivity to prediction in the reward system, it is not sufficiently powered to assess possible individual differences in neurobiology between musical anhedonics and hedonics. Previous neuroimaging studies that included participants with musical anhedonia have shown reduced structural and functional connectivity between auditory and reward-sensitive areas in musical anhedonics (Loui et al., 2017; Martinez-Molina et al., 2019) and that alterations of frontostriatal pathways can lead to either increases or decreases in subjective liking ratings of music (Mas-Herrero et al., 2021). Future neuroimaging studies are needed in this special population, and also across cultures, to establish how the mechanisms of learning relate to auditory-reward connectivity.
In sum, we developed an innovative paradigm to assess the effects of exposure and prediction errors in novel music on musical preference across cultures and in special populations. Our results are the first to show the multiple levels by which exposure and prediction errors in music generate reward and provide strong evidence for this learning process across two cultures. Individuals with musical anhedonia did not show the same patterns as a result of exposure, offering a testable mechanism by which the human brain learns to predict sounds from our environment and to map those predictions onto reward. Because the relationship between predictions and reward underlie much of motivated behavior (Clark, 2013; Friston, 2010; Schultz, 2015), examining the emergence of this relationship during the course of a study may provide a better understanding of how these foundational neurocognitive systems may go awry in a variety of psychiatric and neurological disorders.
Supplemental Material
sj-docx-1-pss-10.1177_09567976231214185 – Supplemental material for Generating New Musical Preferences From Multilevel Mapping of Predictions to Reward
Supplemental material, sj-docx-1-pss-10.1177_09567976231214185 for Generating New Musical Preferences From Multilevel Mapping of Predictions to Reward by Nicholas Kathios, Matthew E. Sachs, Euan Zhang, Yongtian Ou and Psyche Loui in Psychological Science
Footnotes
Transparency
Action Editor: Daniela Schiller
Editor: Patricia J. Bauer
Author Contributions
Nicholas Kathios and Matthew E. Sachs contributed equally as shared first authors.
References
Supplementary Material
Please find the following supplemental material available below.
For Open Access articles published under a Creative Commons License, all supplemental material carries the same license as the article it is associated with.
For non-Open Access articles published, all supplemental material carries a non-exclusive license, and permission requests for re-use of supplemental material or any part of supplemental material shall be sent directly to the copyright owner as specified in the copyright notice associated with the article.