
Abstract
We investigated a novel cognitive-ecological account for misbeliefs about the relationship between food healthiness and tastiness. We propose that different frequencies of healthy and tasty foods in contrasting contexts can trigger perceptions that health and taste are related in ways that diverge from the actual health–taste correlation in the presented food. To investigate this proposal, we conducted three studies (total N = 369), including a taste test, with adult Prolific academic participants from the United Kingdom and undergraduate psychology students from Austria. Our results showed that different frequencies of healthy and tasty food across contrasting contexts can trigger misbeliefs about the relationship between health and taste. These findings demonstrate that properties of the food ecology combined with basic cognitive processes can help explain the formation of beliefs about food such as that unhealthy food tastes better than healthy food. Our study extends the existing explanations for food beliefs and provides a perspective on how they can be changed.
Keywords
Many people believe that unhealthy food tastes better than healthy food, leading them to eat less healthily (Briers et al., 2020; Garaus & Lalicic, 2021; Raghunathan et al., 2006; Turnwald et al., 2022). This belief that unhealthy food is tastier (“unhealthy = tasty” belief) persists despite the availability of tasty healthy foods, such as healthy alternatives to existing foods (e.g., Campbell, 2020; Rolls & Hermann, 2012) or home-cooked meals (Mills et al., 2017), and people often perceive the same foods as healthy and tasty (Haasova & Florack, 2019; Jo & Lusk, 2018).
Why do many people still believe that unhealthy food tastes better? Researchers proposed two explanations for food beliefs. First, internal explanations propose that the “unhealthy = tasty” belief is an expression of the Protestant ethic (Raghunathan et al., 2006; Weber, 1998), a higher order belief that whatever is wholesome must be achieved through hard work, whereas whatever is fun comes with a cost. Accordingly, people might think healthy eating is hard work and cannot be pleasant at the same time. Hence, they might expect a worse taste from healthy food, resulting in an “unhealthy = tasty” belief (Raghunathan et al., 2006). Second, external explanations propose that messages in line with the “unhealthy = tasty” belief are conveyed through personal communication and the media (Raghunathan et al., 2006). For instance, popular U.S. films and television shows describe unhealthy food with more appealing language (Turnwald et al., 2022), and there is more marketing for unhealthy than for healthy food (World Health Organization, 2022).
We offer a cognitive-ecological account for food beliefs that stands in contrast to existing explanations. We illustrate that food beliefs can result from the interplay between the food ecology and cognitive processes by which people infer contingencies between variables. To assess the genuine contingency between two variables, such as health and taste, people need to consider their joint occurrences, that is, how many foods are both healthy and tasty, both unhealthy and tasty, and so on (Allan, 1993). Given that people eat several times a day and do not always attend to food health and taste at the same time, they may have difficulties assessing the genuine contingency. Instead, people could rely on how often they observe each variable overall (i.e., their base rates) to infer a contingency (Fiedler et al., 2009). For example, they might infer an unhealthy–tasty contingency if they observe more tasty than not-tasty food and more unhealthy than healthy food in a context (e.g., a restaurant). People are especially likely to infer a contingency if there is a contrasting context (e.g., a restaurant) with more not-tasty and healthy food (Fiedler & Freytag, 2004).
Contingency inferences from base rates may differ from or even contradict genuine contingencies because base rates of two variables can be skewed even though the variables are unrelated or related in the opposite direction. Therefore, they are termed pseudocontingencies in the literature (e.g., Fiedler et al., 2009; Fiedler & Freytag, 2004). Imagine growing up in a household where there are many tasty but unhealthy fast foods. You also try the food in the school cafeteria, where there may be more healthy but less tasty food than at home. Yet the few healthy foods at home might also taste good, and the few unhealthy foods at the school cafeteria might also taste bad. In this situation, the pseudocontingency inferred from the base rates is that unhealthy and tasty foods are related, whereas the genuine contingency is that healthy and tasty foods are related (Fig. 1).
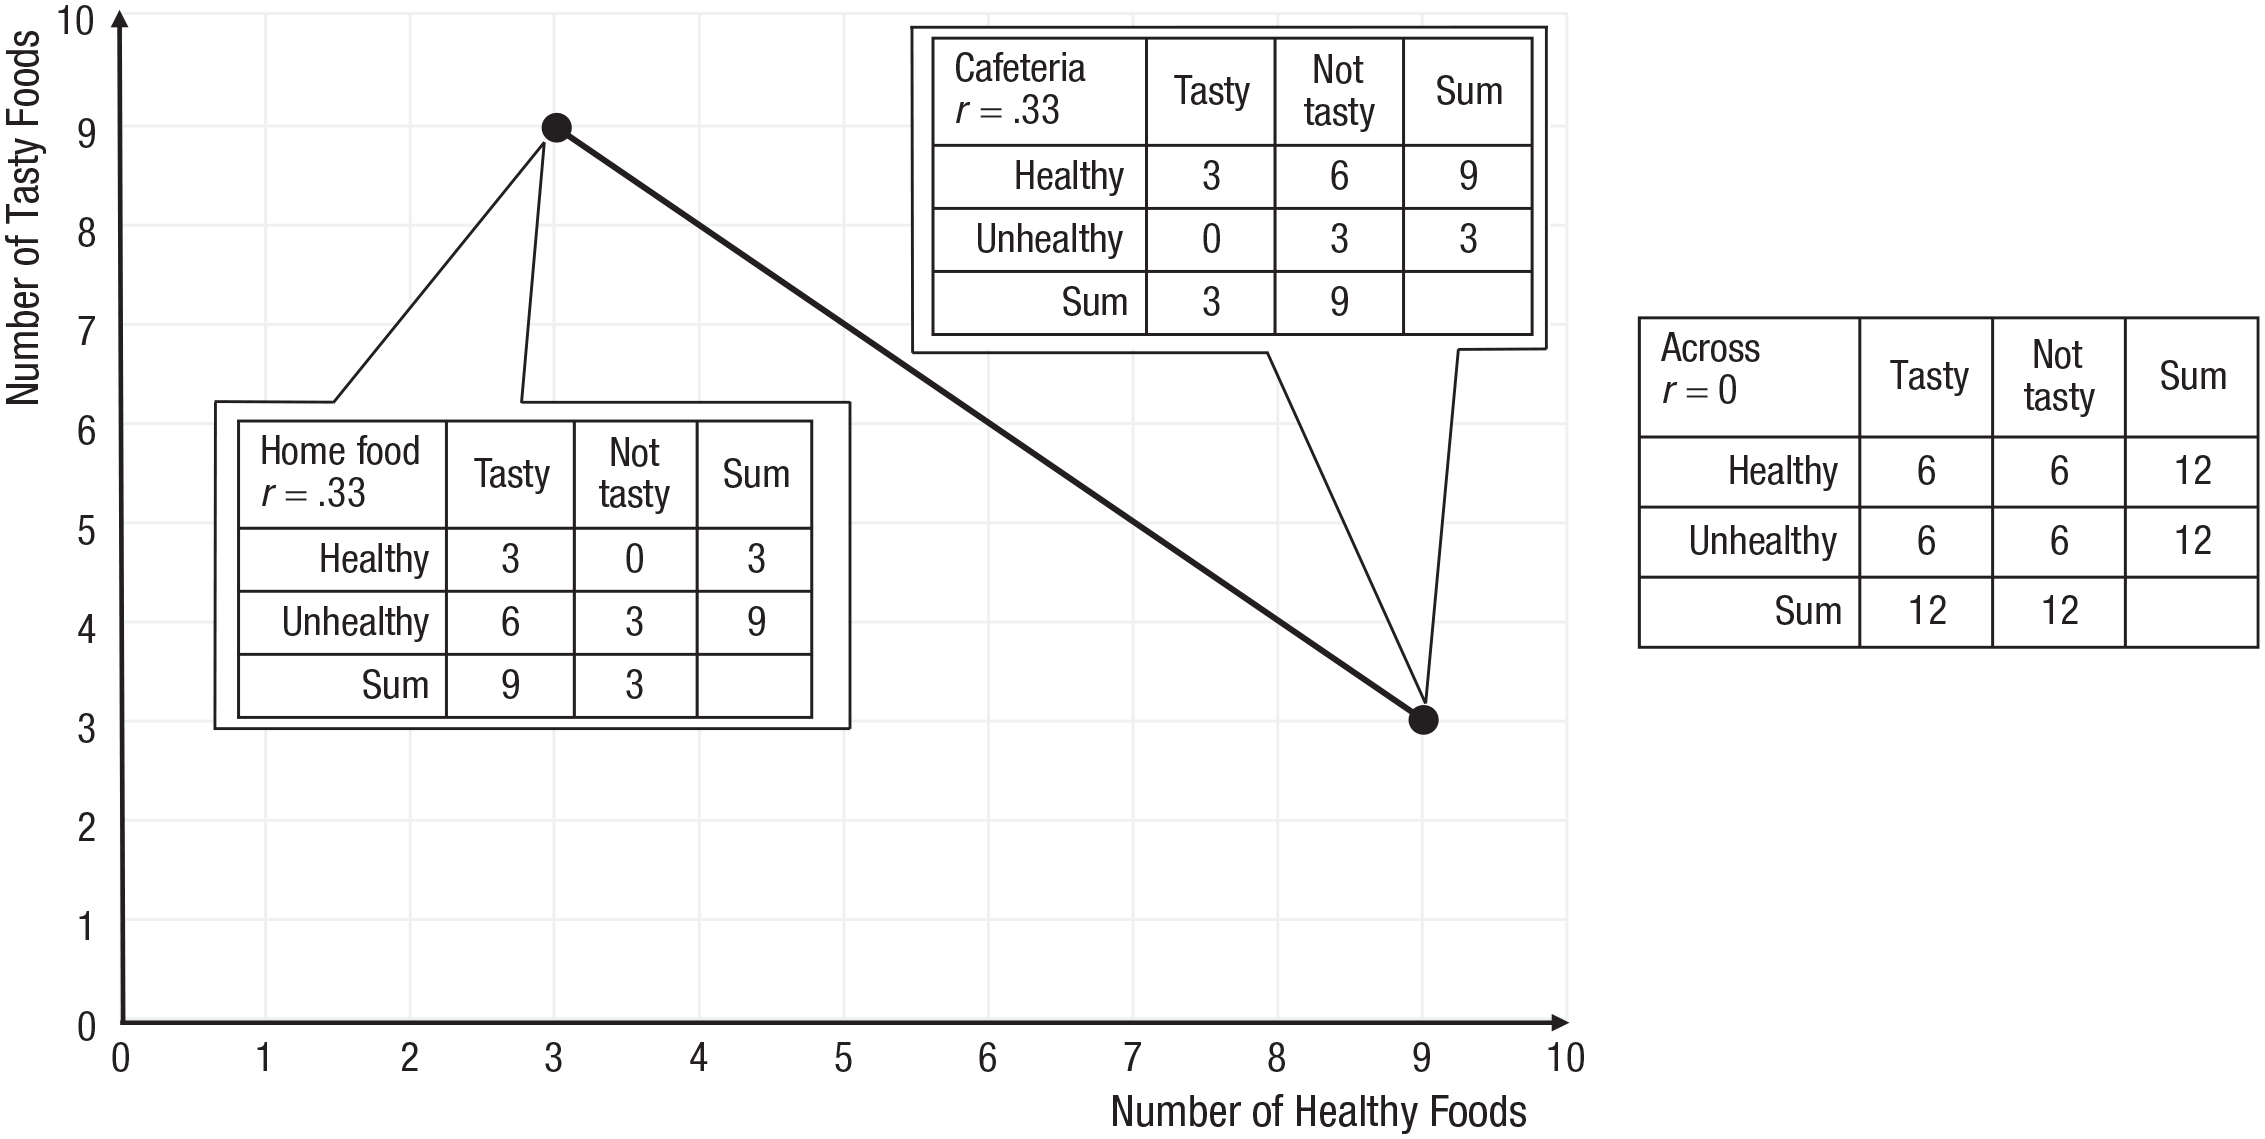
Pseudocontingency, inferred from different frequencies of healthy and tasty foods across contexts. In one context (home), there is more unhealthy and tasty food than in another context (cafeteria), suggesting an unhealthy–tasty contingency. But the genuine contingency is healthy–tasty within each context and zero across contexts. Graph inspired by Vogel et al. (2022).
Statement of Relevance
Many people eat too much unhealthy food because they think it tastes better than healthy food. But tasty healthy foods are available, and when looking at single foods, people often think the same foods are healthy and tasty. Therefore, it is important to find out why people have this belief. Our studies show that the belief depends on the frequency of healthy and tasty food in people’s environment. If there are much more unhealthy and tasty foods in one place than another, people think unhealthy and tasty go together. But this might be an illusion and, in reality, the healthy foods may taste just as good or even better. Our findings suggest that changing people’s belief that unhealthy food tastes better will require food environments to be changed such that they bring more healthy food to people’s attention (e.g., offering more healthy foods on restaurant menus, depicting more healthy foods on TV).
In the present research, we demonstrated a mechanism that helps explain the formation of misbeliefs about the health–taste relationship due to opposing food base-rate trends across contrasting contexts, potentially contributing to food beliefs. The present studies tested the formation of pseudocontingencies between health and taste in the laboratory. However, contrasting food contexts likely exist in the real world as well. For example, different types of restaurants vary in the amount of healthy food options they offer (Yoon et al., 2020). Similarly, in popular U.S. films, healthy foods are depicted with different frequencies in different contexts (Turnwald et al., 2022). To provide further support that people perceive contrasting food contexts in reality, we conducted a pilot study (N = 106). We asked participants to estimate the percentage of healthy and tasty food in four different food contexts. Participants especially estimated more tasty and less healthy food in a fast-food chain compared with a cafeteria (Fig. 2; see the Supplemental Material available online for details).
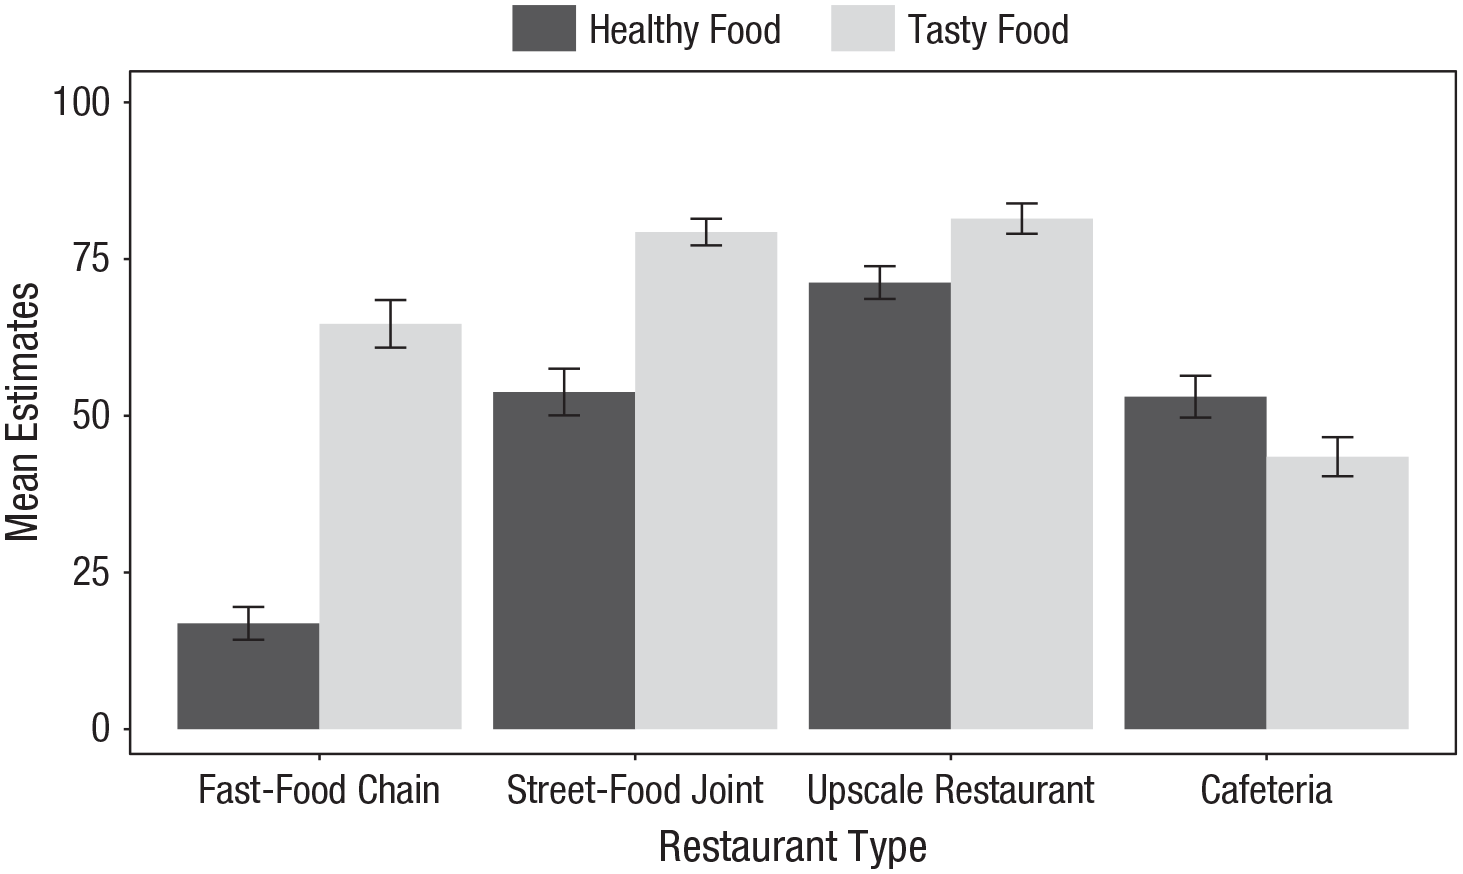
Mean percentage estimates of healthy and tasty foods in each of the four contexts (pilot study). Error bars represent 95% confidence intervals.
Our approach helps explain why people can perceive a healthy–tasty contingency at the individual food level but form an “unhealthy = tasty” belief overall. We hypothesized that people perceive an unhealthy–tasty relationship if there is more tasty and unhealthy food in one context than another regardless of the actual contingency, hence representing a pseudocontingency inference. Conversely, people perceive a healthy–tasty relationship if there is more tasty and healthy food in one context than another.
We tested our hypothesis in three studies in which participants viewed food health and taste ratings from two contexts (i.e., delivery apps, eating places, and boxes with taste samples). We manipulated the base rates of tasty foods across these contexts between participants to either increase (harmonious base rates) or decrease (conflicting base rates) in accordance with base rates of healthy foods. Study 1 demonstrated that people infer health–taste relationships from health and taste base rates across contexts. Study 2 showed that even if people receive information about the actual contingency, they still rely on base rates, leading to misbeliefs about the health–taste relationship. Study 3 replicated the effect when people really consumed the food.
Open Practices Statement
All studies were preregistered on OSF (https://osf.io/7drza). Deidentified data, codebooks, and data-analysis scripts for all studies are also publicly available at https://osf.io/7drza. All studies were approved by the institutional review board of the Department of Occupational, Economic, and Social Psychology at the University of Vienna.
Study 1: People Infer Health–Taste Relationships From Base Rates
Method
Participants
One hundred fifty participants from the United Kingdom, recruited via the Prolific academic panel, participated in the online study in exchange for GBP£0.90. The sample consisted of 49.33% women, 49.33% men, and 1.33% other genders. The sample’s mean age was 40.96 years (SD = 13.53) and mean body mass index (BMI) was 25.38 (SD = 4.81). In addition to the preregistered exclusion criteria, we removed two outliers for calculating the mean BMI with unrealistic values (42.19 and 180.53, respectively), as identified in a box plot analysis (see analyses scripts at https://osf.io/7drza).
Procedure
We preselected Prolific participants who were native English speakers and not on a diet. Additionally, we screened out participants who failed an attention check item (Abbey & Meloy, 2017) at the beginning of the study. We told participants that the study investigated how people interpret customer reviews. After providing written informed consent, participants imagined that there were two new food delivery apps with fictitious names, “Eats” and “Zanana,” which represented the contrasting contexts. We then presented them with two bar charts on the same page, which respectively summarized the percentage of tasty and healthy food reviews from these two apps, representing the health and taste base rates in each context. We told participants to look at the graphs and answer some questions about the apps (the graphs remained on the screen the whole time). First, we asked them to estimate the base rates of healthy and tasty food for each app to check whether they recognized the different frequencies across contexts. Then, participants indicated their perceived health–taste relationship for the first app, followed by their perceived health–taste relationship for the second app. Finally, they indicated their perceived health–taste relationship and their preference for healthy versus unhealthy food across both apps overall. After completing the dependent measures, participants filled in the Protestant ethic scale so we could control for this variable. At the end of the experiment, participants provided demographic data and were fully debriefed.
Materials
Participants viewed two bar charts on the same page. These charts ostensibly summarized health and taste ratings of the food from two contexts—specifically, fictitious food delivery apps named “Eats” and “Zanana.” The graph on the left side of the page displayed the percentage of tasty foods from each app, and the graph on the right displayed the percentage of healthy foods from each app. The percentage of tasty and healthy foods for the two apps in each graph were presented with differently colored bars (Fig. 3).
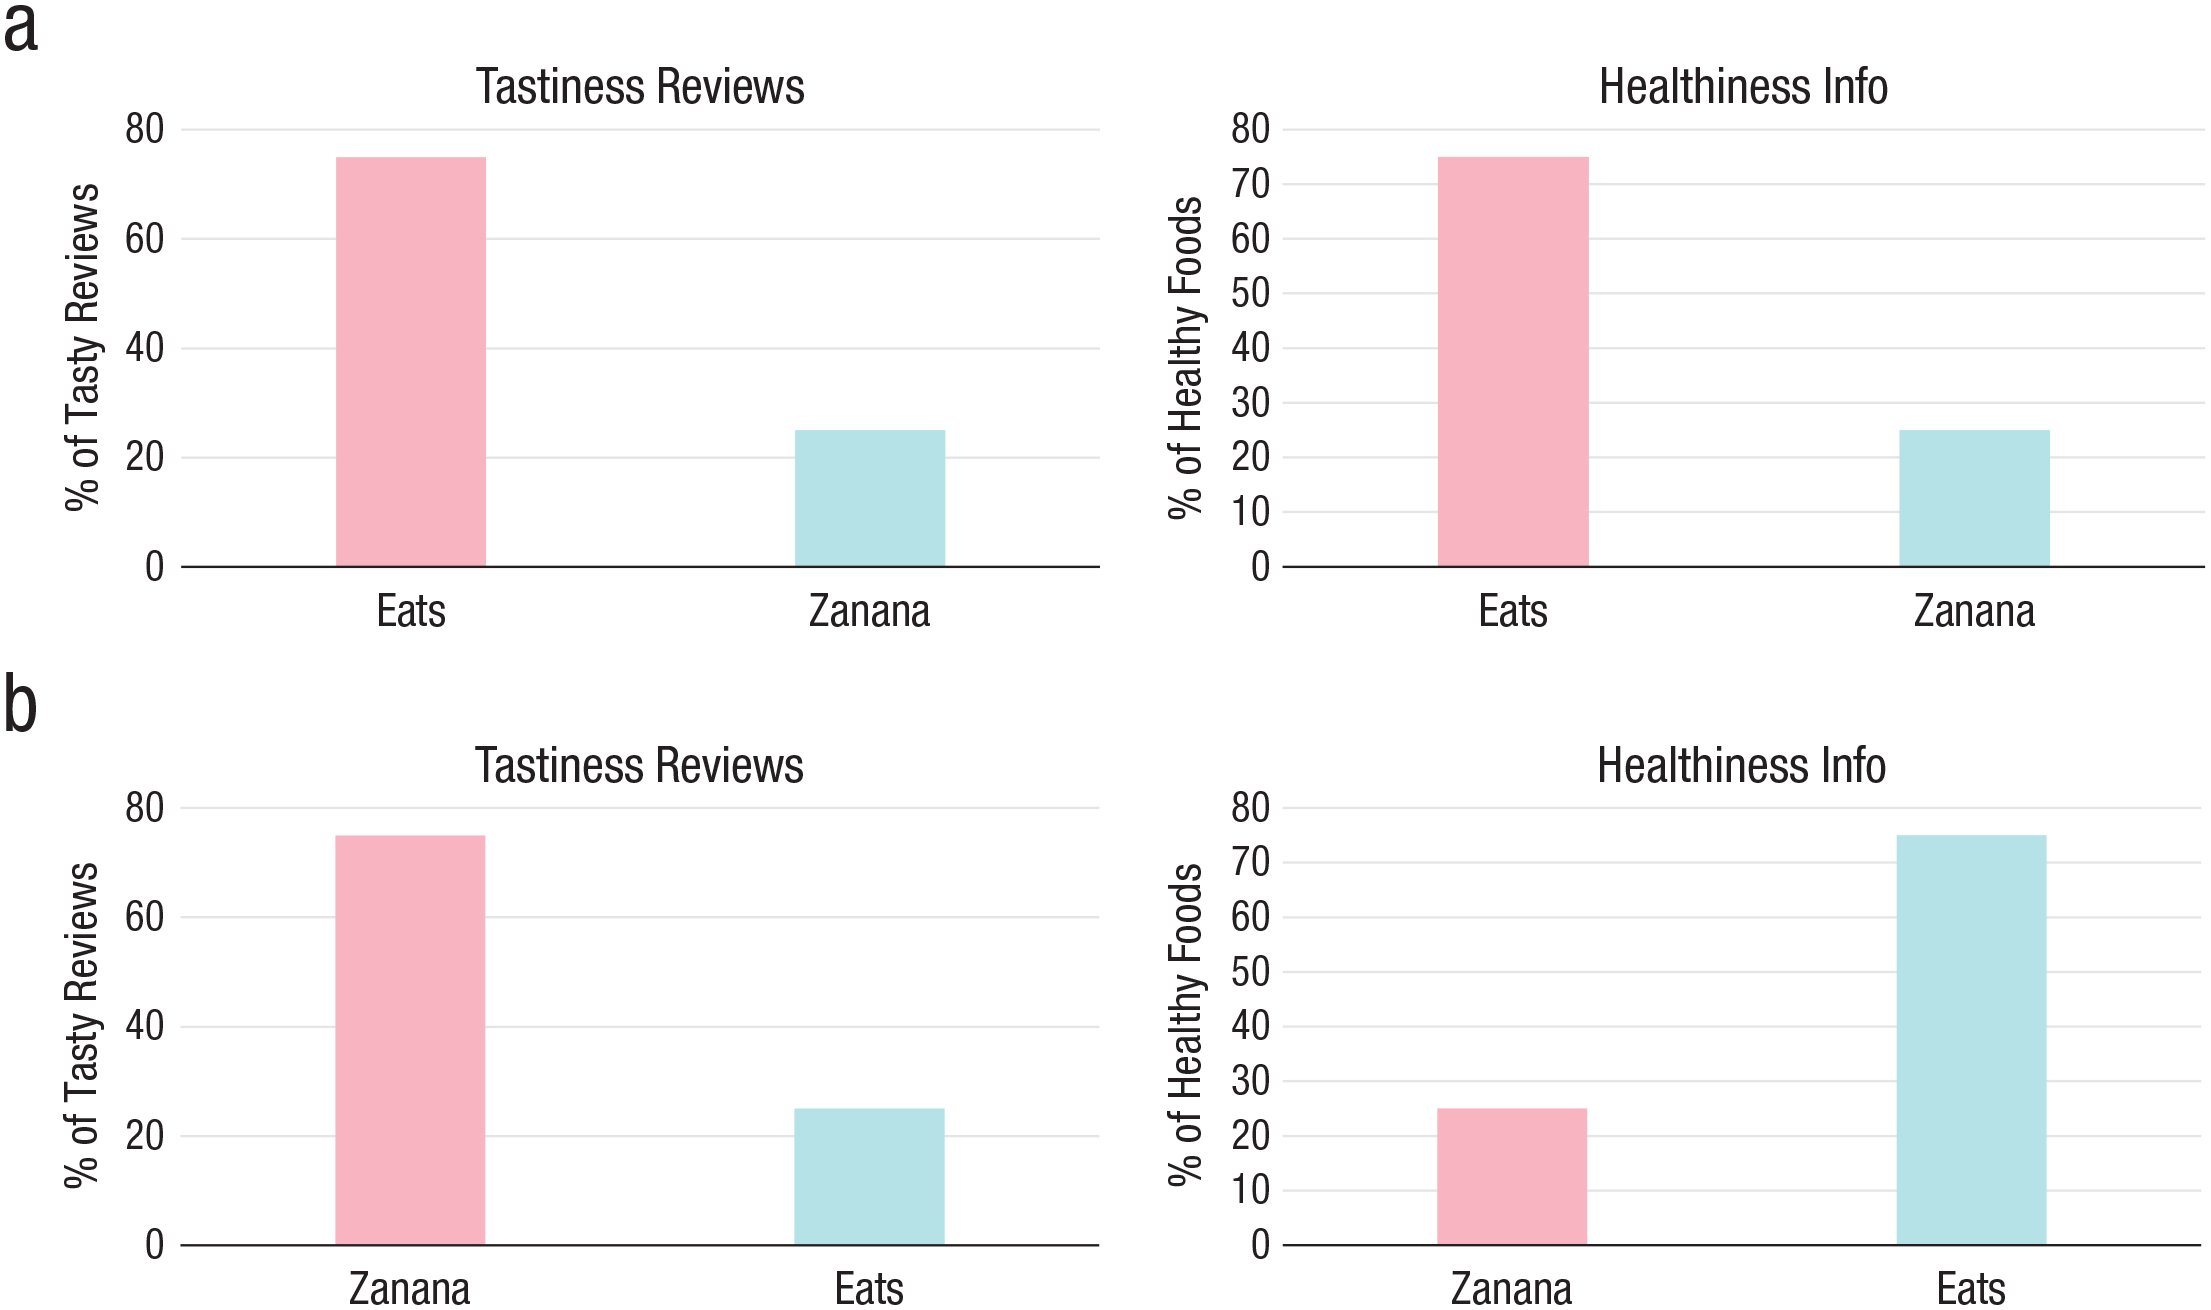
Bar charts summarizing health and taste reviews of two food apps, used as stimuli in Study 1. Panel (a) illustrates harmonious base rates (first app both 75% tasty and healthy food, second app both 25% tasty and healthy food), and Panel (b) illustrates conflicting base rates (first app 75% tasty and 25% healthy food, second app 25% healthy and 75% tasty food). The names of the first and second app varied randomly between participants, whereas the bar colors were always the same.
Design
Participants were randomly assigned to two base-rate manipulations. When base rates were harmonious, there was both 75% tasty and healthy food in one app and 25% tasty and healthy food in the other app. When base rates were conflicting, there was 75% tasty and 25% healthy food in one app and 25% tasty and 75% healthy food in the other app. Hence, across apps, base rates of tasty foods either increased or decreased with base rates of healthy foods. Note that the stimuli provided no information about joint occurrences of healthy/unhealthy and tasty/not-tasty food, meaning that it was impossible to calculate the genuine contingency between food healthiness and tastiness. We randomized the names of the first and second app (“Eats” and “Zanana”) between participants.
Measures
Perceived health–taste relationship
The dependent variable was the perceived relationship between health and taste, which we assessed in two ways (measures adapted from Harris et al., 2020). To obtain conditional probability estimates, we asked participants to estimate for each app how likely they would be to get a tasty food when ordering a healthy and an unhealthy food, respectively, on two slider scales from 0% to 100%. To obtain relative contingency beliefs, we asked participants to indicate which foods tasted better, on a slider scale from 1, the unhealthy foods, to 100, the healthy foods. The latter measure was administered regarding each app separately (i.e., within contexts) as well as both apps overall (i.e., across contexts).
Preference for healthy food
Participants indicated what kind of food they would be most likely to order if they wanted to order a tasty food via one of the apps (using a Likert scale from 1, an unhealthy food, to 11, a healthy food).
Protestant ethic
We assessed participants’ Protestant ethic (Mirels & Garrett, 1971) to control for its possible influence. We administered 11 items from Katz and Hass (1988), to which participants indicated their agreement on a 6-point Likert scale from 0, strongly disagree, to 5, strongly agree (e.g., “I feel uneasy when there is little work for me to do”; Cronbach’s α = .84).
Data analysis
We analyzed the data using the rstatix (Kassambara, 2021) package in R (Version 4.1.2; R Core Team, 2021). In all studies, we calculated mixed analyses of variance (ANOVAs) on participants’ perceived health–taste relationship. In each analysis, the independent variables were the between-subjects factor base-rate manipulation (harmonious vs. conflicting), the within-subjects factor context (e.g., first vs. second app), and their interaction. Using G*Power (Faul et al., 2007), we predetermined that a sample size of 150 would be necessary to detect a medium-size between-subjects effect with an α of .05 and a statistical power of .80 in a mixed ANOVA for Studies 1 and 2. We analyzed dependent variables pertaining to both contexts overall with univariate ANOVAs in which base-rate manipulation (harmonious vs. conflicting) was the independent variable. In all studies, we additionally controlled for any stimulus randomizations and individual characteristics by running the analyses again with these variables included as factors and covariates, respectively. This did not change the main findings in any of the studies (for a detailed report, see the R markdown files at https://osf.io/7drza).
In all studies, we recoded all measures for the perceived health–taste relationship such that a negative value indicated an unhealthy–tasty relationship and a positive value a healthy–tasty relationship. For the conditional probability estimates in Study 1, in addition to the preregistered analyses, we calculated for each app the difference between the estimated likelihood of getting a tasty meal between the healthy and unhealthy meal. Reliability between the two indicators for the perceived health–taste relationship was acceptable in the first context (Cronbach’s α = .77) but low in the second context (Cronbach’s α = .53), so we analyzed the dependent variables separately.
Results
Manipulation checks
In this and all following studies, we analyzed participants’ base rate estimates of healthy and tasty foods in each context (for a detailed report, see https://osf.io/7drza). According to the analyses, participants in all studies accurately identified the different frequencies of healthy and tasty foods in the respective contexts and base-rate manipulations.
Main analyses
Our hypothesis was that if there is more unhealthy and tasty food in one context than another (i.e., conflicting base rates), people perceive an unhealthy–tasty relationship. Conversely, if there is more healthy and tasty food in one context than another (i.e., harmonious base rates), people perceive a healthy–tasty relationship, even without any information about the actual contingency present. As predicted, we found a strong effect of base-rate manipulation on both dependent measures (see Table 1 for an overview of all results), within as well as across contexts.
Results of Analyses of Variance on the Effects of Base-Rate Manipulation (Between Subjects; Harmonious vs. Conflicting), Context (Within Subjects; First vs. Second App), and Their Interaction on the Perceived Relationship Between Health and Taste (Study 1)
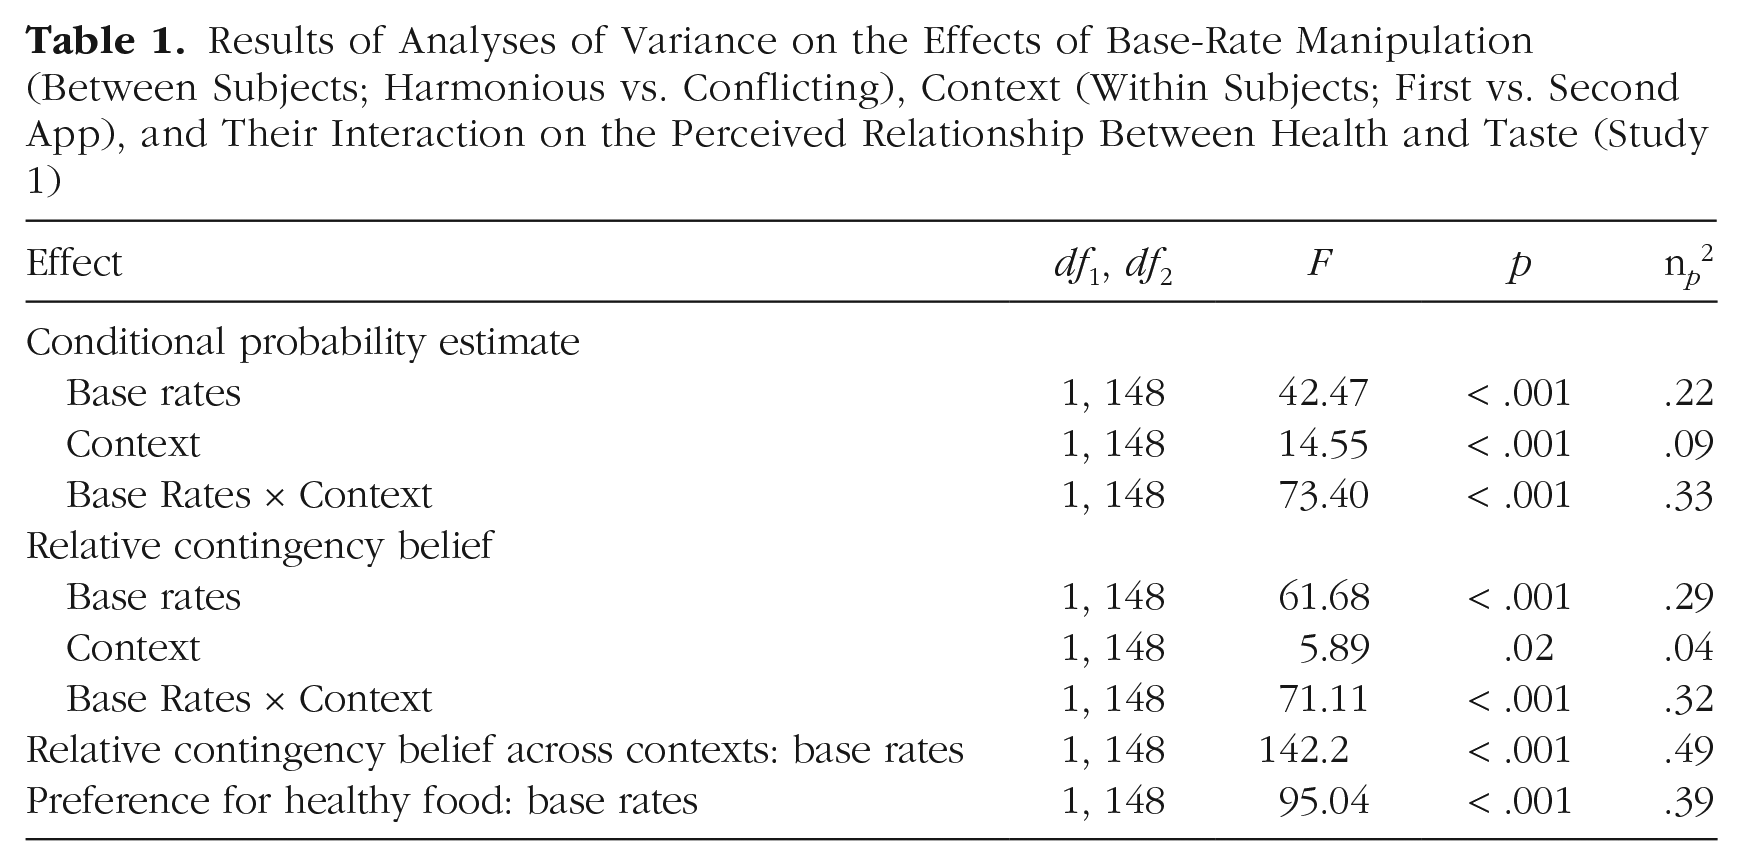
Across both contexts, participants viewing harmonious base rates perceived a healthy–tasty relationship (M = .13, SD = .20; relative contingency-belief item pertaining to both apps, with zero indicating a neutral health–taste relationship), whereas participants viewing conflicting base rates perceived an unhealthy–tasty relationship (M = –.26, SD = .20; see Fig. 4a). Participants viewing harmonious base rates also would more likely order a healthy meal from any app (M = 10.24, SD = 3.77; on a scale from 1 to 11) than participants viewing conflicting base rates (M = 4.99, SD = 2.64; see Fig. 4b).
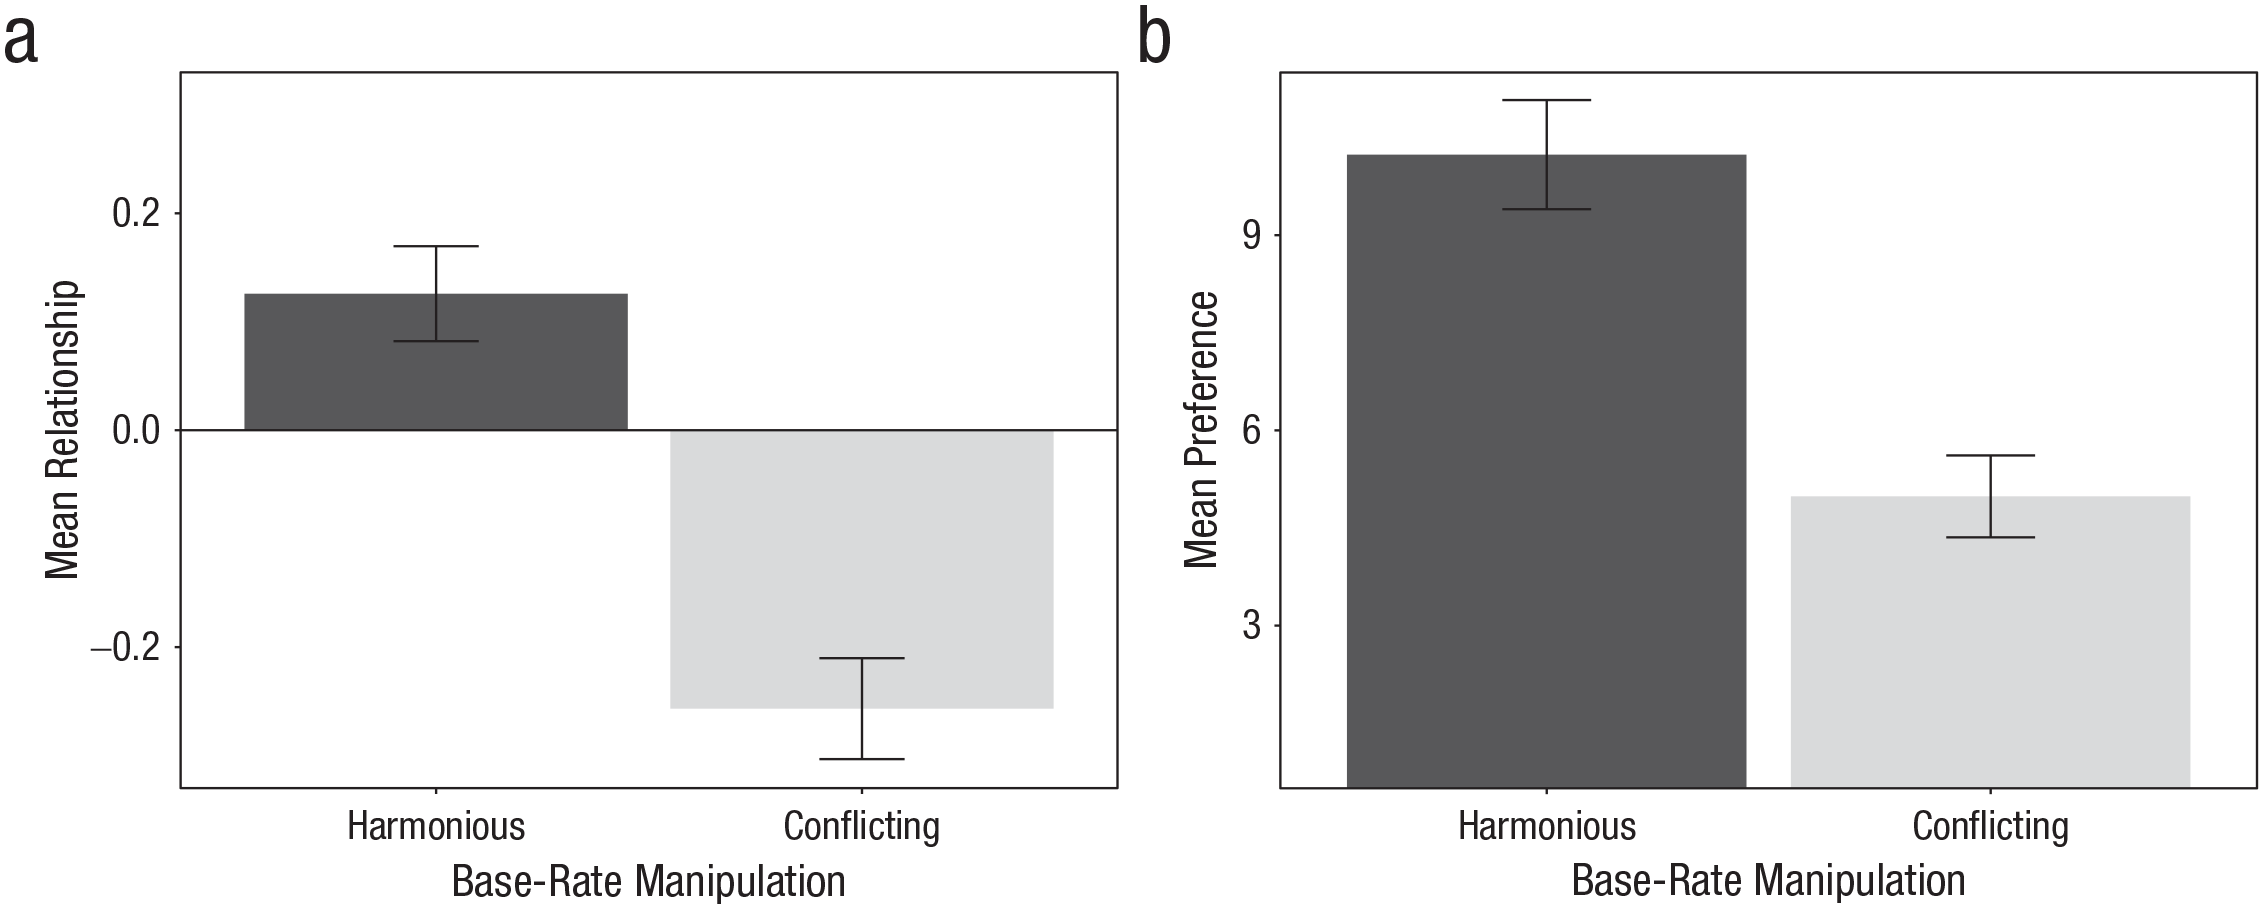
Mean perceived health–taste relationship across contexts (a) and preference for a healthy meal (b) in the two base-rate manipulations (Study 1). Error bars represent 95% confidence intervals.
The two indicators of the perceived relationship within the separate contexts (i.e., apps) were also affected by medium-size effects of context and strong interaction effects between base-rate manipulation and context. In the context with many tasty foods, participants viewing harmonious base rates perceived a healthy–tasty relationship, and participants viewing conflicting base rates perceived an unhealthy–tasty relationship, as expected. In the context with few tasty foods, participants perceived an unhealthy–tasty relationship regardless of the base-rate manipulation on both dependent variables (see Fig. 5). All results remained stable when analyses controlled for Protestant ethic as a covariate (for a detailed report, see the R markdown files at https://osf.io/7drza).
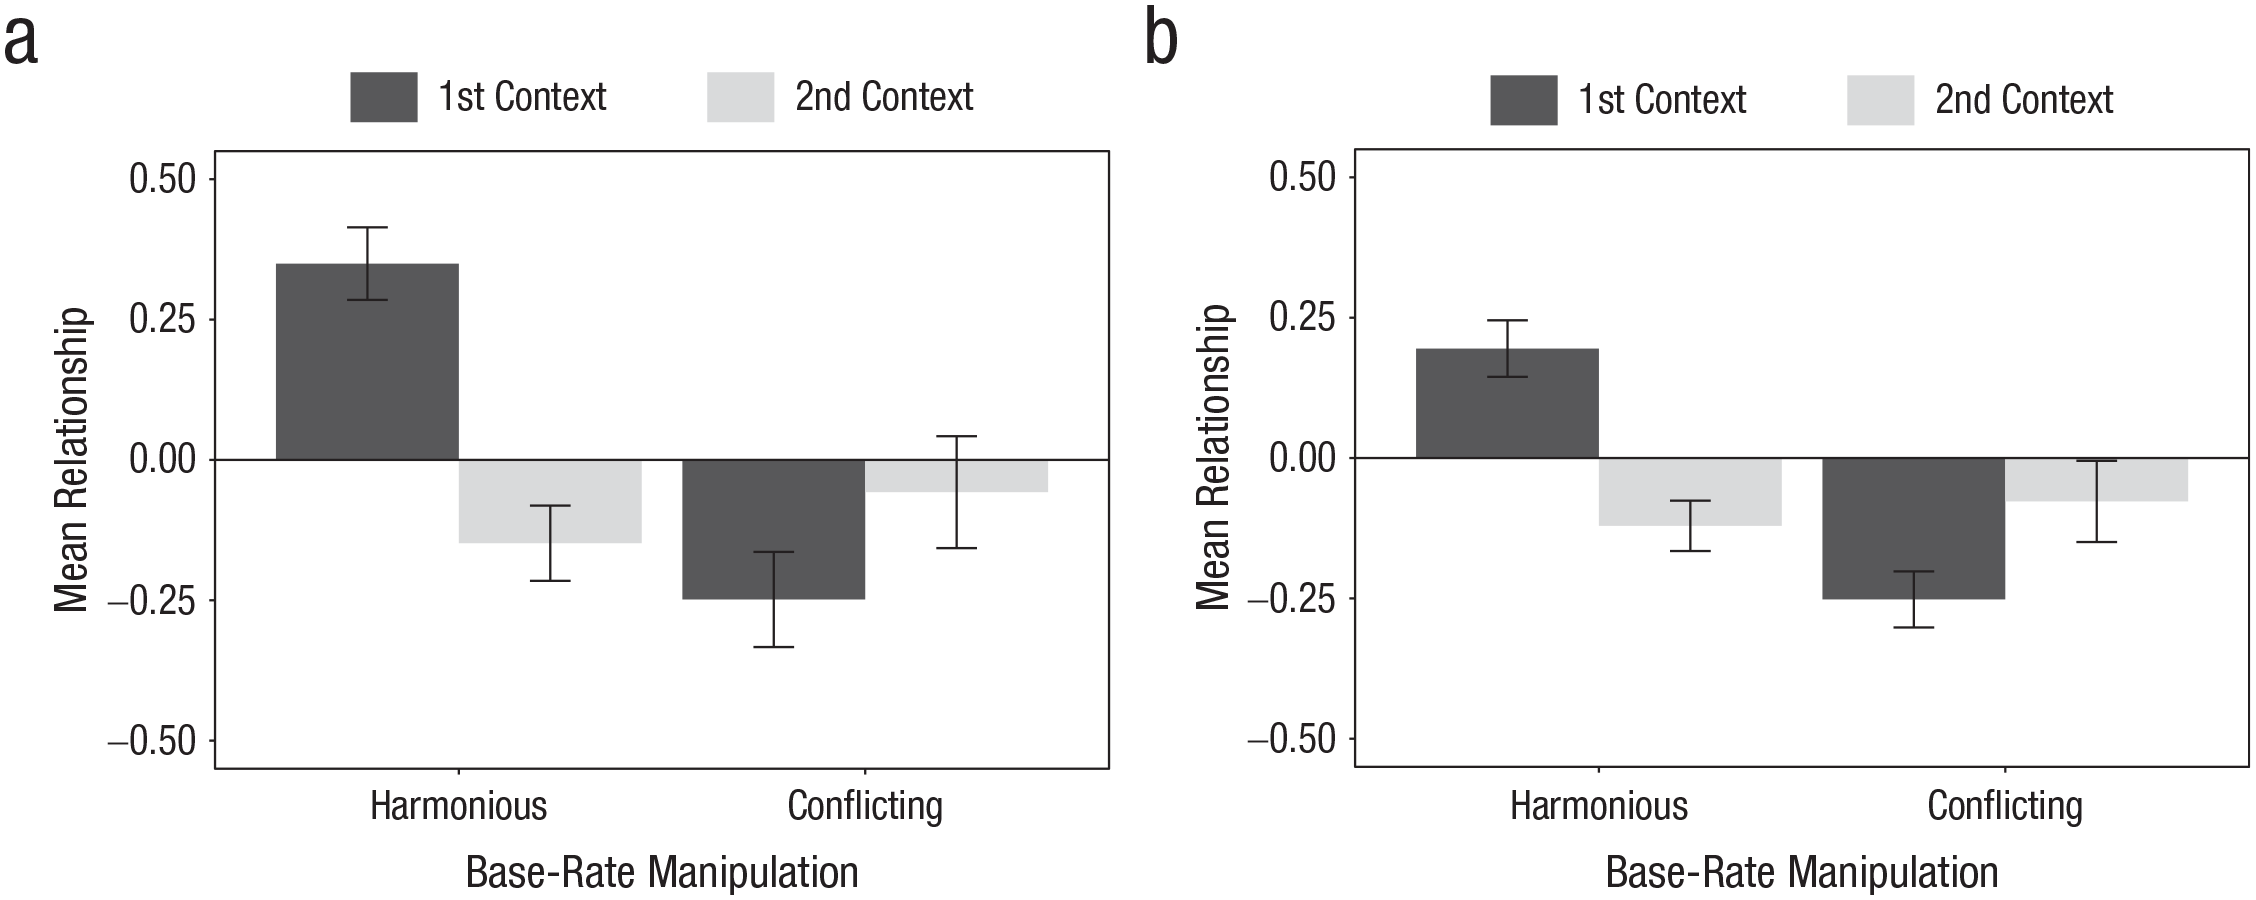
Mean perceived health–taste relationship as indicated by conditional probability estimates (a) and relative contingency beliefs (b) in each of the two contexts and base-rate manipulations (Study 1). Error bars represent 95% confidence intervals.
Discussion
In Study 1, participants inferred health–taste relationships from base rates of healthy and tasty food across contrasting contexts, also affecting the preference for healthy versus unhealthy food. Participants perceived an unhealthy–tasty relationship and preferred unhealthy food when there was more tasty and unhealthy food in one context than another. They perceived a healthy–tasty relationship and preferred healthy food when there was more tasty and healthy food in one context than another.
In Study 1, participants viewed aggregated health and taste ratings, not individual foods, meaning that they had no information about the actual contingency. In Study 2, we provided participants with ratings of single foods’ health and taste (i.e., the actual contingency) and tested whether they nevertheless inferred the health–taste relationship on the basis of base rates.
Study 2: People Neglect Information About Actual Contingencies
Method
Participants
One hundred fifty-six undergraduate psychology students, who were naive to the research hypothesis, were recruited via the university’s laboratory administration system to participate in a laboratory study in exchange for course credit. The sample consisted of 73.7% women; the sample’s mean age was 21.49 years (SD = 3.74) and mean BMI was 21.72 (SD = 2.74).
Procedure
Only participants who indicated they spoke German as their first language, or as well as their first language, and were not on a diet were eligible for the study. These participants were identified by an online screening survey. After obtaining written informed consent, we instructed participants to imagine that they had moved to a new town for work and tried out the food from two different contexts (cafeterias at the workplace and restaurants in the neighborhood, in random order). Participants first viewed the taste ratings of 12 meals from the first context (e.g., cafeterias) on separate pages in random order. Each rating disappeared after 2 s, and participants were asked to recall the rating as an attention check. After they had seen all 12 taste ratings, we asked participants to estimate the base rates of tasty and not-tasty food in the context as a manipulation check. Next, participants viewed the health ratings of the same 12 meals from the first context in the same manner and subsequently estimated the base rates of healthy and unhealthy food in the context. Afterwards, participants indicated their perceived health–taste relationship within the first context. This procedure was repeated for the second context (e.g., restaurants).
Then, participants indicated their perceived health–taste relationship regarding the town as a whole (i.e., across contexts). Finally, they completed a prediction task in which they predicted new meals’ tastiness from their given healthiness and vice versa. The procedure is summarized in Figure 6. At the end of the experiment, participants provided demographic data and were fully debriefed.
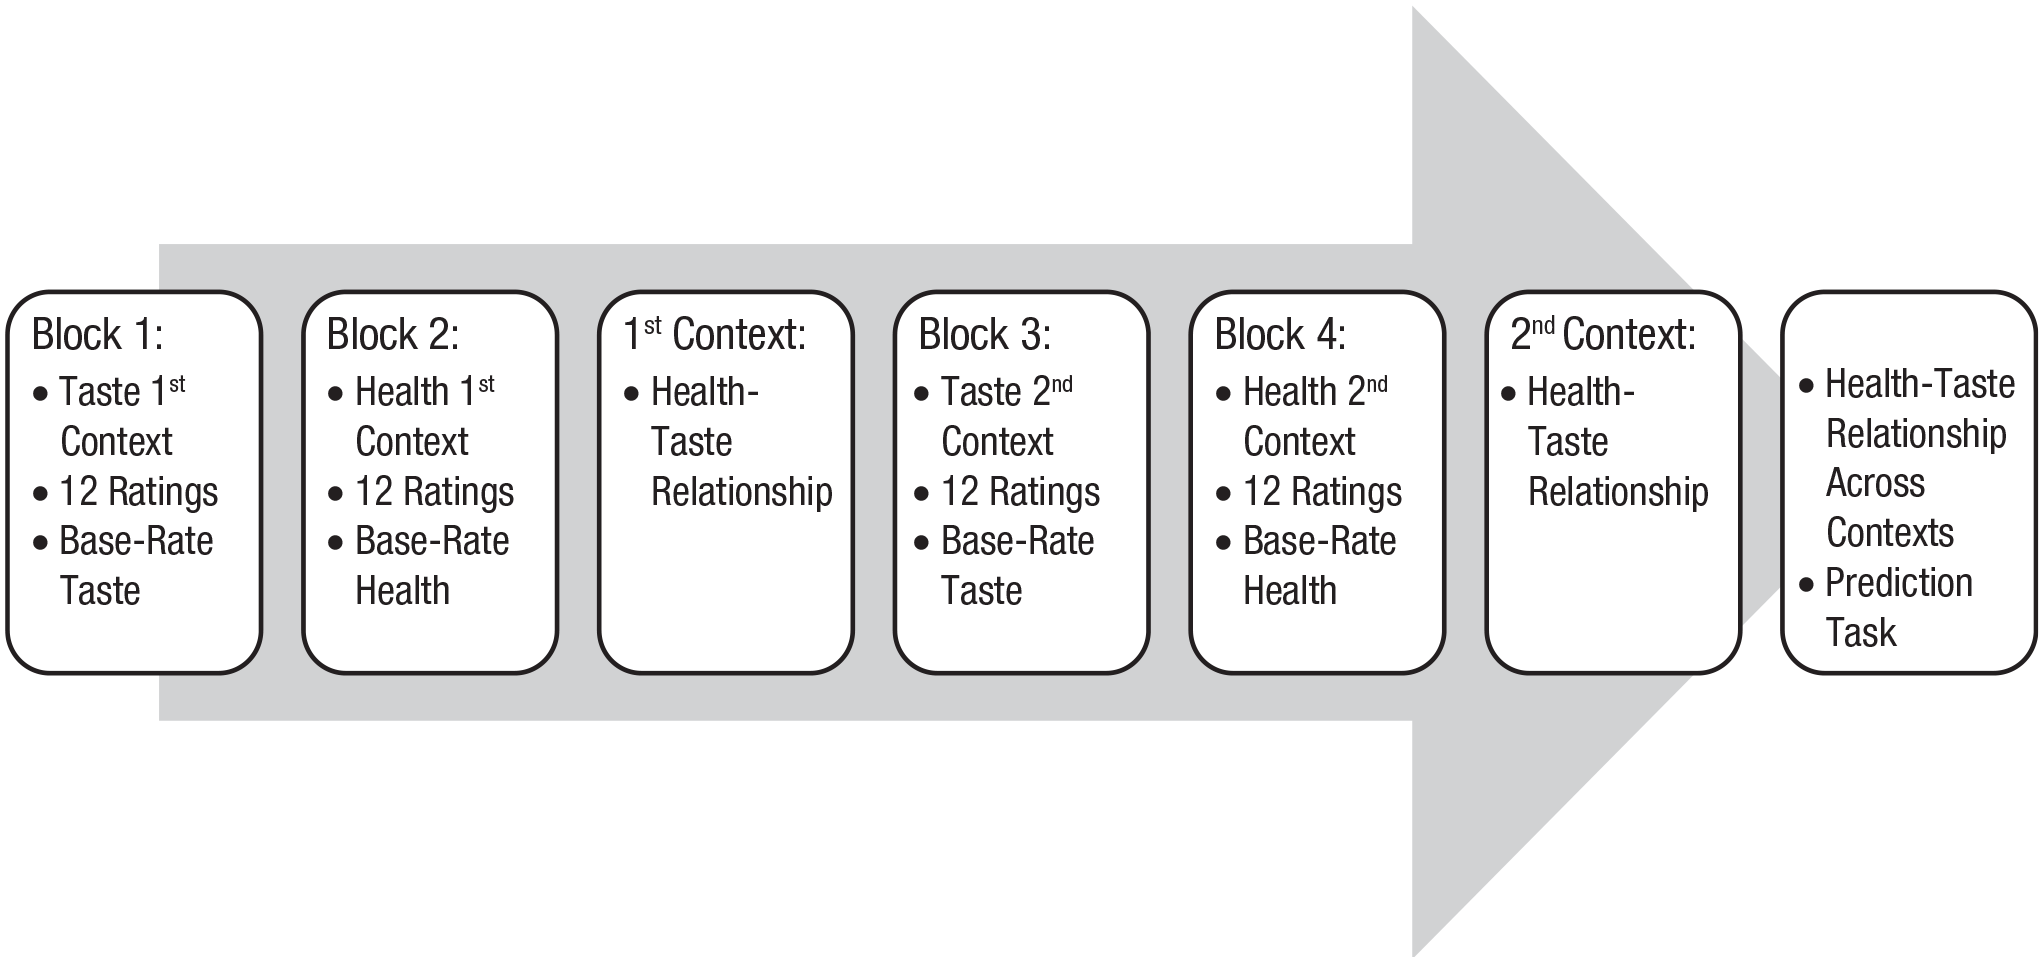
Experimental procedure (Study 2). The names of the first and second context (“cafeterias” and “restaurants”), as well as the background colors (pink and green), varied randomly between participants.
Materials
Participants viewed taste and health ratings of 24 individual meals from two contexts: cafeterias at the workplace and restaurants in the neighborhood. The ratings for the different contexts were presented on differently colored backgrounds (pink and green). Taste ratings were indicated by a star rating from 1 (bad taste) to 5 (good taste). Health ratings were indicated by a Nutri-Score, which displayed the meal’s healthiness by means of a letter and a traffic-light color, with a green “A” or “B” representing high healthiness and an orange “D” and a red “E” representing low healthiness (Santé Publique France, 2018). Along with each rating, participants saw the context and the individual meal number (see Fig. 7).
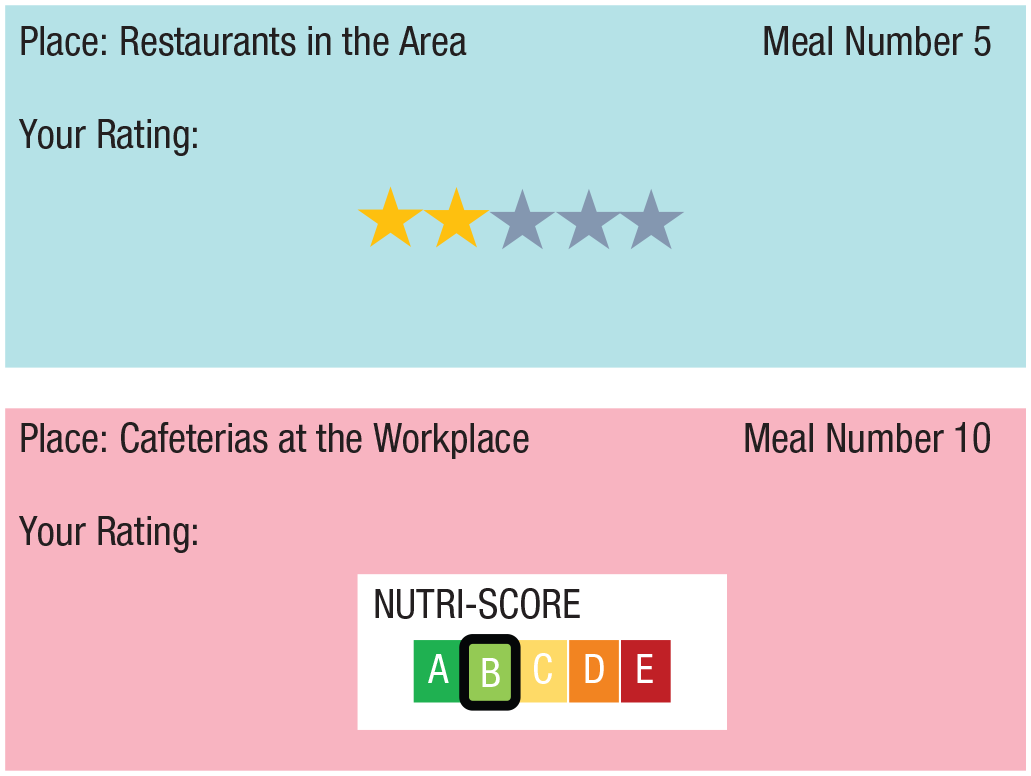
Example stimulus (Study 2). The names of the first and second context (“cafeterias” and “restaurants”), as well as the background colors (pink and green) varied randomly between participants.
Design
As in Study 1, frequencies of tasty foods across contexts either increased (harmonious base rates) or decreased (conflicting base rates) with frequencies of healthy foods. But importantly, the actual contingency was in the opposite direction from what the base rates would suggest within each context and zero across both contexts. Also, there was a control group in which base rates of healthy and tasty food were the same in both contexts and contingencies between health and taste were zero. For details, see the Supplemental Material. We randomized the names of the first and second context (“cafeterias” and “restaurants”), as well as the background colors (pink and green), between participants.
Measures
The dependent variable was the perceived relationship between health and taste, which we assessed in three ways. First, joint frequency estimates were assessed by asking participants to estimate, for each context, how many meals were both healthy and tasty, both unhealthy and tasty, and so on, by entering four numbers in separate text boxes, which had to amount to 12. We calculated the rφ coefficient on the basis of the four estimates. Second, to assess contingency beliefs, we asked participants to indicate whether the healthy meals tasted worse, as good as, or better than the unhealthy meals, and vice versa. They indicated their belief on a 100-point slider scale. This measure was administered separately for the cafeterias and restaurants (i.e., within contexts; Cronbach’s αs = .89 and .88, respectively) as well as regarding the meals in the town as a whole (i.e., across contexts; Cronbach’s α = .88).
Finally, we created a prediction task, in which we presented participants with 16 ratings of either the tastiness or the healthiness for some new meals in the contexts, separately and in random order. Participants’ task was to predict the meal’s rating on the respective other feature. Taste and health ratings were presented as well as measured as star ratings and Nutri-Scores, respectively, as in the learning trials. We calculated Pearson’s correlation coefficient between the given and predicted ratings.
Results
Before conducting the preregistered analyses, we averaged the three indicators of the perceived health–taste relationship into one variable indicating the perceived health–taste relationship within contexts (Cronbach’s αs = .69 and .76). We found a strong effect of base-rate manipulation on the perceived health–taste relationship within contexts, F(2, 153) = 32.54, p < .001, η p 2 = .30, as well as across contexts, F(2, 153) = 18.18, p < .001, η p 2 = .19. Across contexts, participants viewing harmonious base rates perceived a healthy–tasty relationship (M = .10, SD = .22), whereas participants viewing conflicting base rates perceived an unhealthy–tasty relationship (M = –.13, SD = .20). Participants in the control group perceived a relationship close to zero (M = .04, SD = .19), but it did not differ significantly from the harmonious base-rate manipulation (padjusted = .36; see Fig. 8).
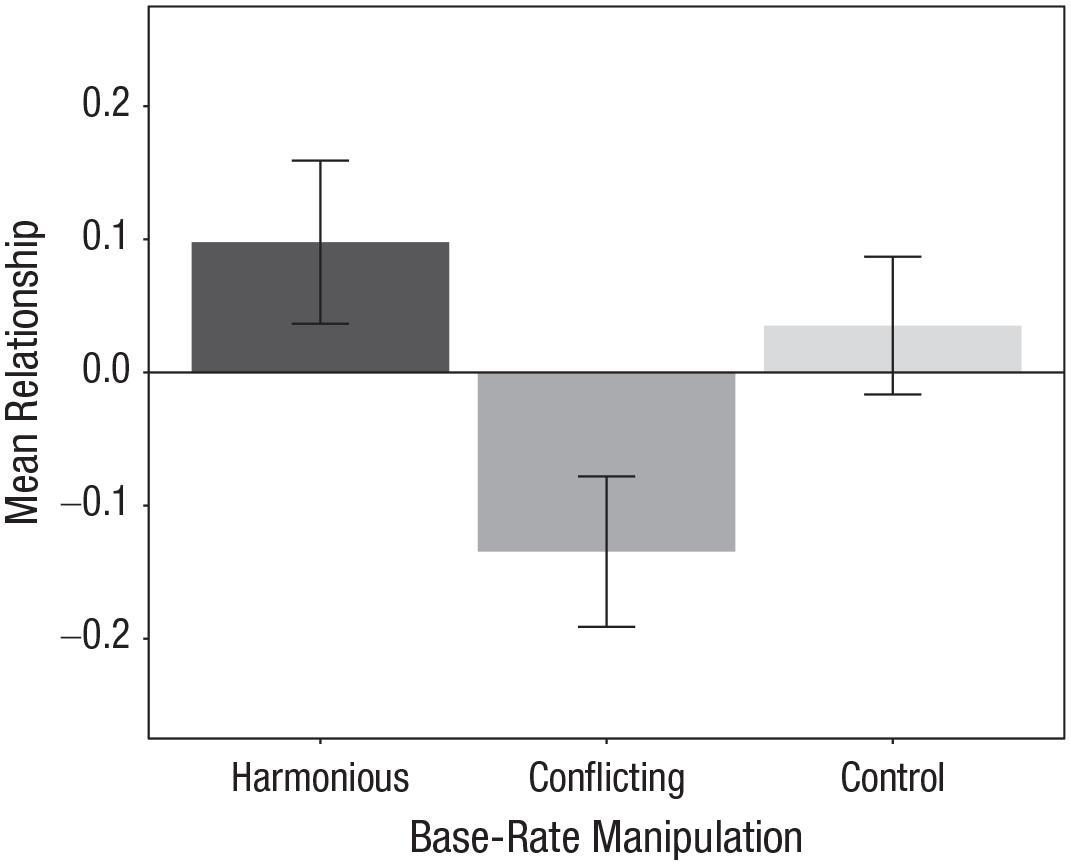
Mean perceived health–taste relationship across contexts in the three base-rate manipulations (Study 2). Error bars represent 95% confidence intervals.
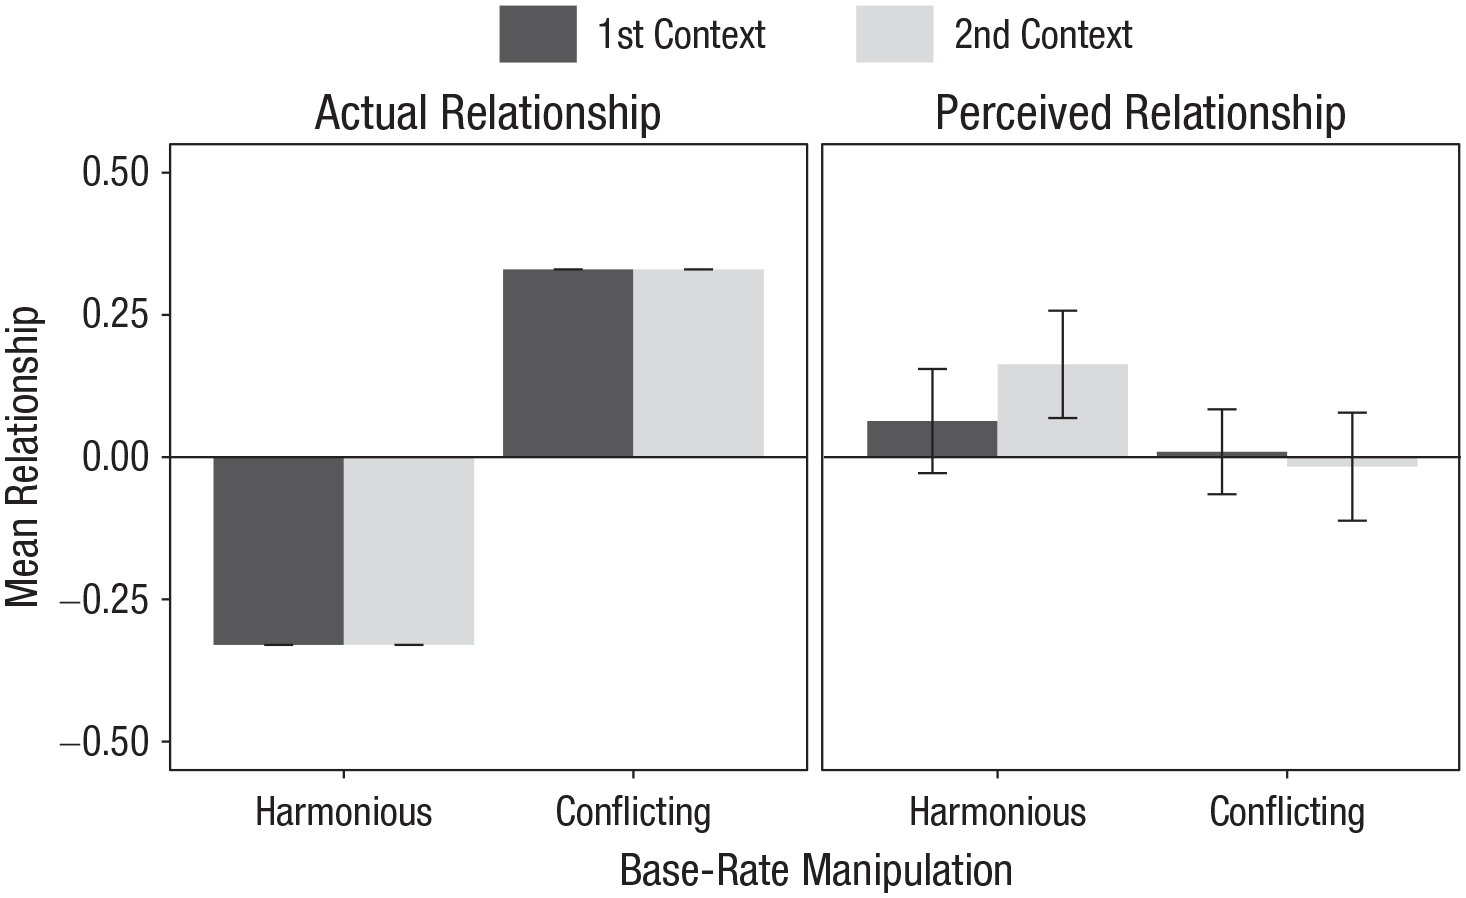
Within each context, participants viewing harmonious and conflicting base rates perceived health–taste relationships that were opposite to the actual contingencies in the stimulus material (see Fig. 9). Participants in the control group also perceived a healthy–tasty relationship, which was weaker compared with the harmonious base-rate manipulation in the first context but not in the second.
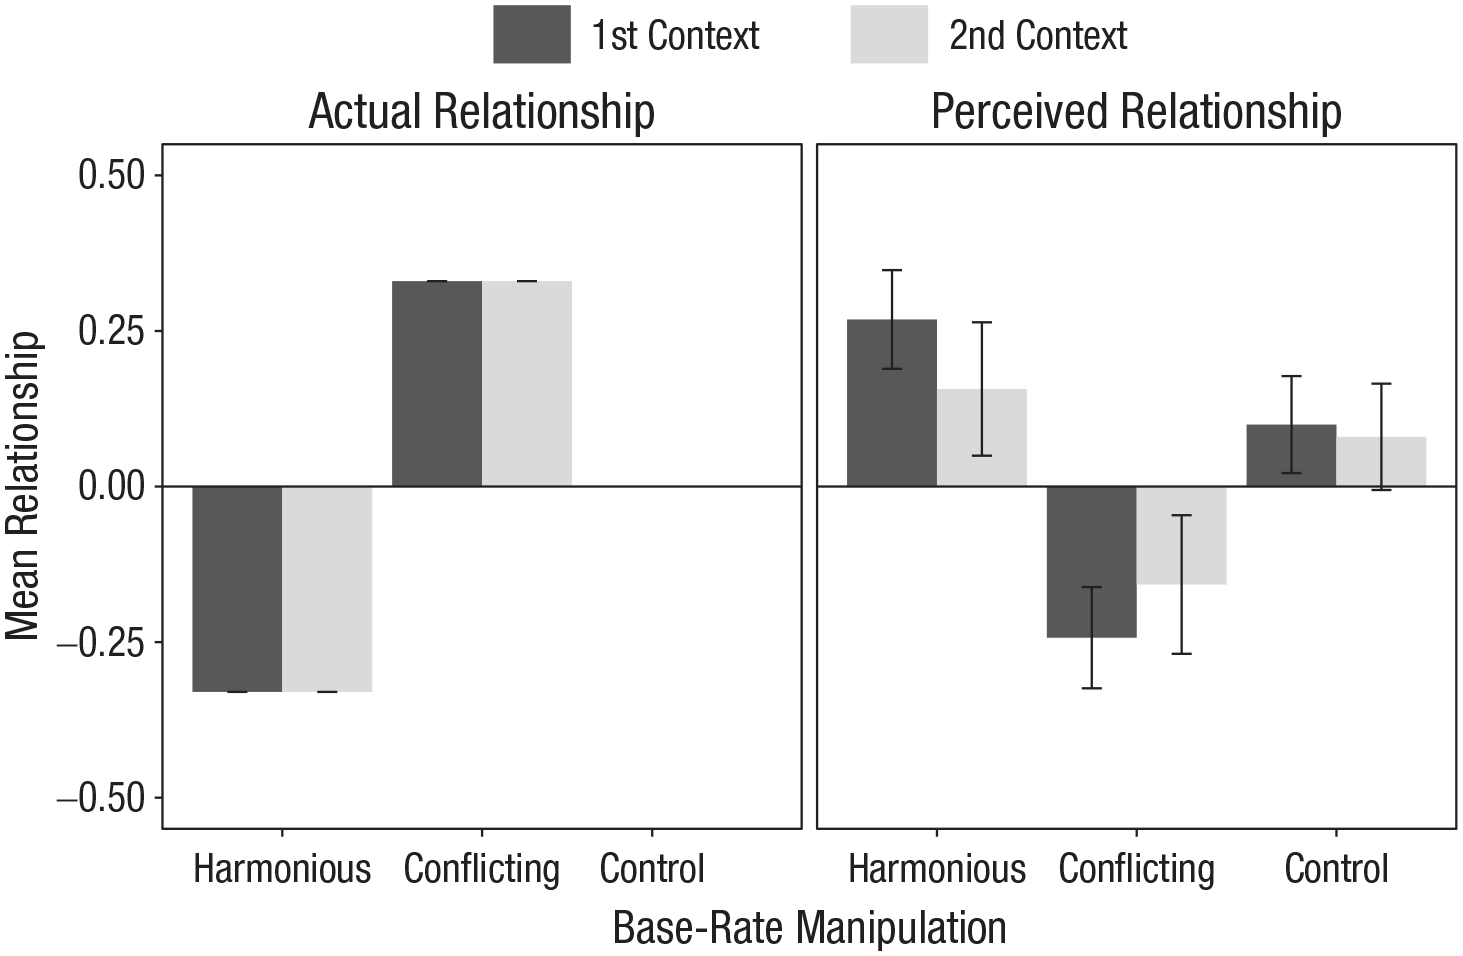
Mean actual and perceived relationships in each of the two contexts and three base-rate manipulations (between subjects: harmonious vs. conflicting vs. control; Study 2). Error bars represent 95% confidence intervals.
There was also a medium-size interaction effect between base-rate manipulation and context, F(2, 153) = 3.51, p = .03, η p 2 = .04. In the second context with few tasty foods, the perceived health–taste relationship did not differ between the harmonious base-rate manipulation and control group (padjusted = .86). Otherwise, the perceived health–taste relationship differed between all groups in both contexts (see Fig. 9).
Discussion
Study 2 shows that even if people have information about the actual health–taste contingency, they ignore it but rely on base rates to infer health–taste relationships across as well as within contexts. Participants perceived health–taste relationships, although the actual contingency was zero across contexts and in the opposite direction within each context. In Study 3, we replicated this effect in a real taste test and additionally assessed the choice for a healthy versus unhealthy food.
Study 3: Contrasting Contexts Affect Food Choice in a Taste Trial
Method
Participants
Sixty-three students were recruited via the university’s laboratory administration system and via flyers distributed in the university building to participate in the laboratory study. The sample consisted of 71.43% women; the sample’s mean age was 21.49 years (SD = 3.74) and mean BMI was 21.62 (SD = 3.66).
Procedure
We screened out participants who had any food allergies, were on a diet, or declined to drink a smoothie during the study. Two boxes with smoothie samples, representing the two contexts, were placed in front of participants along with a glass of water so they could rinse their mouth between trials. The instructions and measures were administered via computer.
After providing written informed consent, participants tasted eight smoothie samples from the first box, one after another in random order, and rated the taste of each sample. After they had tasted all smoothies, we asked participants to estimate the base rates of tasty and not-tasty smoothies in the box as a manipulation check. Next, participants viewed the health ratings of the same eight smoothies from the first box on the computer screen, separately and in random order. Each health rating was presented for 4 s, and participants were asked to repeat it. After they had seen all eight health ratings, participants estimated the base rates of healthy and unhealthy smoothies in the box. Afterwards, participants indicated whether the healthy or unhealthy smoothies were tastier in the first box. This procedure was repeated for the second box (see Fig. 10). Afterwards, participants indicated their perceived health–taste relationship across both boxes and chose between a healthy and an unhealthy smoothie. At the end of the experiment, participants provided demographic data and were fully debriefed.
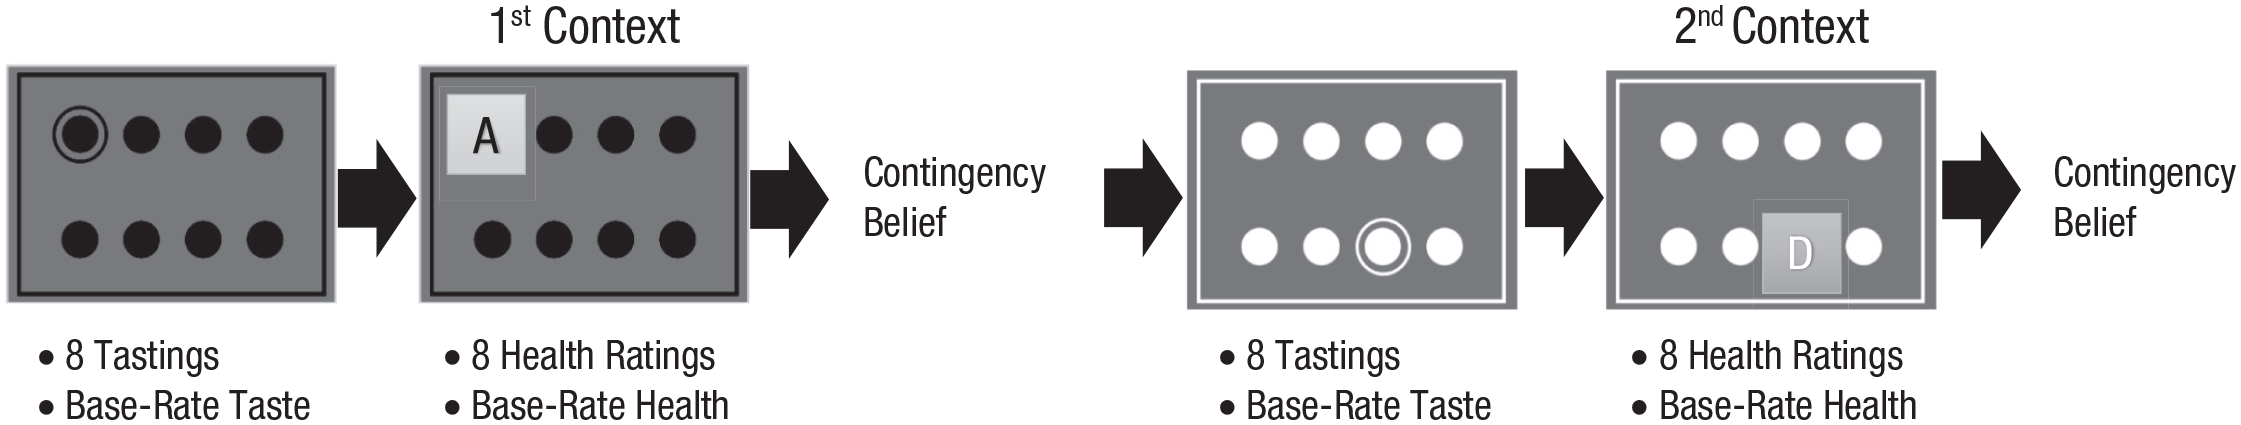
Experimental procedure with illustration of stimulus presentation (Study 3). In the taste trials, the circle indicated which smoothie from the box participants should taste next; the colors of the first and second box (black and white) were randomized between participants.
Stimuli and design
Participants tasted 16 smoothie samples from two contexts and viewed health ratings for each of them. The smoothie samples from the different contexts were served in black and white plastic cups that were arranged in black and white boxes representing the contexts. We used a fruit smoothie from a local supermarket and manipulated the not-tasty samples by adding two tablespoons of soy sauce per 100 ml. Health ratings were indicated by Nutri-Scores, as in Study 2. We manipulated the base rates of healthy and tasty foods between participants in the same way as in Study 2, but without the control group. For details, see the Supplemental Material. We randomized the combination of the first and second context with the black and white box and cup colors between participants.
Dependent measures
We assessed participants’ perceived health–taste relationship within each context as well as across contexts by measuring their relative health–taste contingency belief with the same item as in Study 1. Additionally, we asked participants with a single choice item whether they would rather choose a healthy or an unhealthy smoothie if they had to pick a tasty smoothie from any box.
Data analysis
In addition to the steps described in Study 1, we conducted a logistic regression of participants’ choice for a healthy versus tasty smoothie on the base-rate manipulation (harmonious vs. conflicting). We predetermined that a sample size of 60 would be needed to detect a medium-size effect with an α of .05 and a statistical power of .80 in a logistic regression.
Results
We found a strong effect of base-rate manipulation on the perceived health–taste relationship within contexts, F(1, 61) = 6.93, p = .01, η p 2 = .10, as well as across contexts, F(1, 61) = 10.3, p < .01, η p 2 = .14. Participants viewing harmonious base rates believed more strongly that the healthy smoothies tasted better across both contexts (overall: M = .16, SD = .21) as well as within each context (first: M = .06, SD = .24; second: M = .16, SD = .25), compared with conflicting base rates (overall: M = –.01, SD = .22; first: M = .01, SD = .21; second: M = –.02, SD = .27; see Figs. 11 and 12).
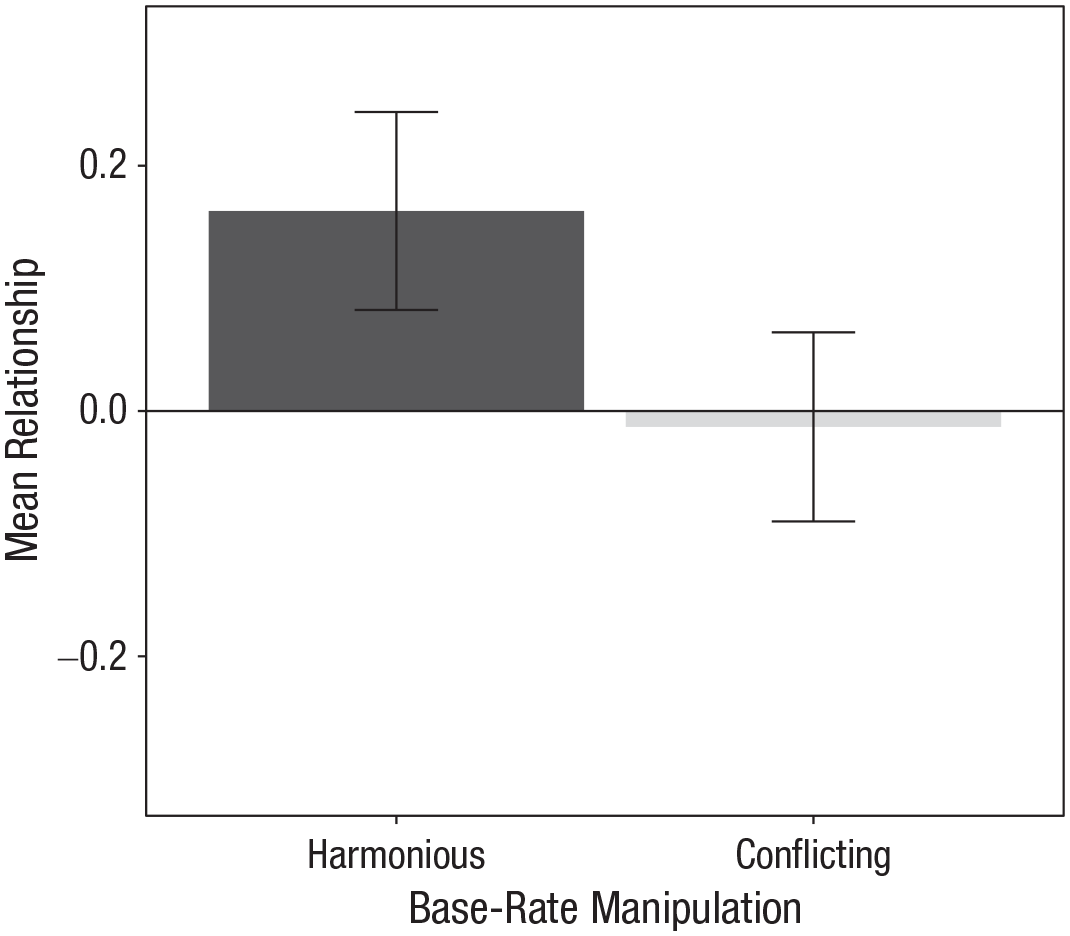
Mean perceived health–taste relationship across contexts in each of the two base-rate manipulations (Study 3). Error bars represent 95% confidence intervals.
Mean actual and perceived relationships in each of the two contexts and base-rate manipulations (Study 3). Error bars represent 95% confidence intervals.
Also, participants viewing harmonious compared with conflicting base rates were more likely to choose the healthy smoothie, exp(B) = 3.83, 95% confidence interval = [1.30, 12.56], p = .02, although the actual contingencies were in the opposite direction.
Discussion
Study 3 shows that people infer health–taste relationships from base rates instead of actual contingencies when tasting the food and that this even affects their food choice to a small extent.
General Discussion
Although many people perceive the same foods as healthy and tasty, the belief that unhealthy food tastes better than healthy food persists in society. Researchers have proposed that this “unhealthy = tasty” belief is a manifestation of a higher order belief (the Protestant ethic) or explicitly conveyed through the media (Raghunathan et al., 2006; Turnwald et al., 2022). We provided a novel cognitive-ecological account explaining food beliefs by properties of the food ecology and cognitive mechanisms by which people infer contingencies from this ecology.
Across three studies, we found that contrasting food contexts can trigger misbeliefs about the health–taste relationship. Study 1 shows that people believe that healthy food tastes better than unhealthy food when there is more healthy and tasty food in one context than another. Study 2 shows similar effects when the genuine contingency is reversed. Study 3 shows that people can form misbeliefs about the health–taste relationship when actually tasting the food, affecting their choice for a healthy versus an unhealthy food. Apparently, participants inferred health–taste relationships not from observations of individual foods but from base rates of healthy and tasty foods across contexts. Hence, a pseudocontingency inference (e.g., Fiedler et al., 2009) explains why people can form a general “unhealthy = tasty” belief even though they perceive the same foods as healthy and tasty.
Interestingly, in Studies 1 and 2, participants perceived stronger health–taste relationships in a context with many tasty foods than in a context with many not-tasty foods. For example, they inferred a stronger health–taste relationship in a context with many healthy and tasty foods than in a context with many unhealthy and not-tasty foods. Possibly, participants more readily inferred a pseudocontingency from aligning two high than two low base rates of healthy and tasty food. Although we did not expect this finding given previous work showing that people infer comparably strong pseudocontingencies in a context by aligning two frequent as well as rare base rates (Fiedler & Freytag, 2004), it does not interfere with our conclusion that people infer health–taste relationships from base rates.
Our findings are in line with those of past research demonstrating that pseudocontingencies help explain stereotype formation (Kutzner & Fiedler, 2017; Meiser & Hewstone, 2004). We contribute to this research by showing that pseudocontingencies help explain food beliefs, such as the “unhealthy = tasty” belief (Briers et al., 2020; Raghunathan et al., 2006). In the same vein, we offer a novel theoretical account for food beliefs that might open the door to healthy eating interventions. The cognitive-ecological account suggests that the immediate food environment can contribute to food beliefs in addition to culturally grounded beliefs, such as the Protestant ethic. In fact, the endorsement of the Protestant ethic (Katz & Hass, 1988; Mirels & Garrett, 1971) was unrelated to the perceived health–taste relationship in Study 2, suggesting that other factors have to contribute to the “unhealthy = tasty” belief. In our studies, base rates of healthy and tasty foods varied across two contexts (e.g., mostly healthy and tasty food in one context but mostly unhealthy and not-tasty food in another context). This constellation renders the alignment of base-rates particularly salient and pseudocontingency inferences particularly likely (Fiedler & Freytag, 2004). Our findings illustrate this case, as we found the strongest effects when asking for participants’ belief across both contexts, indicating that they integrated the information about both contexts for their judgments.
A limitation of the present studies is that we tested the formation of pseudocontingencies between health and taste exclusively in the laboratory but not in real food environments. We argue that the food ecology is prone to create contrasting contexts and offer initial evidence suggesting that people do contrast healthy and unhealthy food contexts and tasty and not-tasty food contexts. But more research is needed to explore when and where people are exposed to contrasting food contexts with the potential to create misbeliefs about the health–taste relationship. Further, generalizability of our findings might be restricted to Austrian undergraduate psychology students and Prolific academic participants from the United Kingdom. Future studies should include diverse samples that better represent the general population.
Our findings imply that to help people perceive a health–taste relationship, it is not sufficient to create individual foods that are both healthy and tasty. Instead, it may help to change people’s environment—for example, by offering more healthy options on restaurant menus and depicting more healthy than unhealthy food in films and television shows—to make people realize that they do not have to compromise between healthy and tasty food.
Supplemental Material
sj-docx-1-pss-10.1177_09567976231158288 – Supplemental material for Food Is All Around: How Contexts Create Misbeliefs About the Health–Taste Relationship
Supplemental material, sj-docx-1-pss-10.1177_09567976231158288 for Food Is All Around: How Contexts Create Misbeliefs About the Health–Taste Relationship by Sonja Kunz, Simona Haasova, Niklas Pivecka, Justus Schmidt and Arnd Florack in Psychological Science
Footnotes
Transparency
Action Editor: Mark Brandt
Editor: Patricia J. Bauer
Author Contributions
References
Supplementary Material
Please find the following supplemental material available below.
For Open Access articles published under a Creative Commons License, all supplemental material carries the same license as the article it is associated with.
For non-Open Access articles published, all supplemental material carries a non-exclusive license, and permission requests for re-use of supplemental material or any part of supplemental material shall be sent directly to the copyright owner as specified in the copyright notice associated with the article.